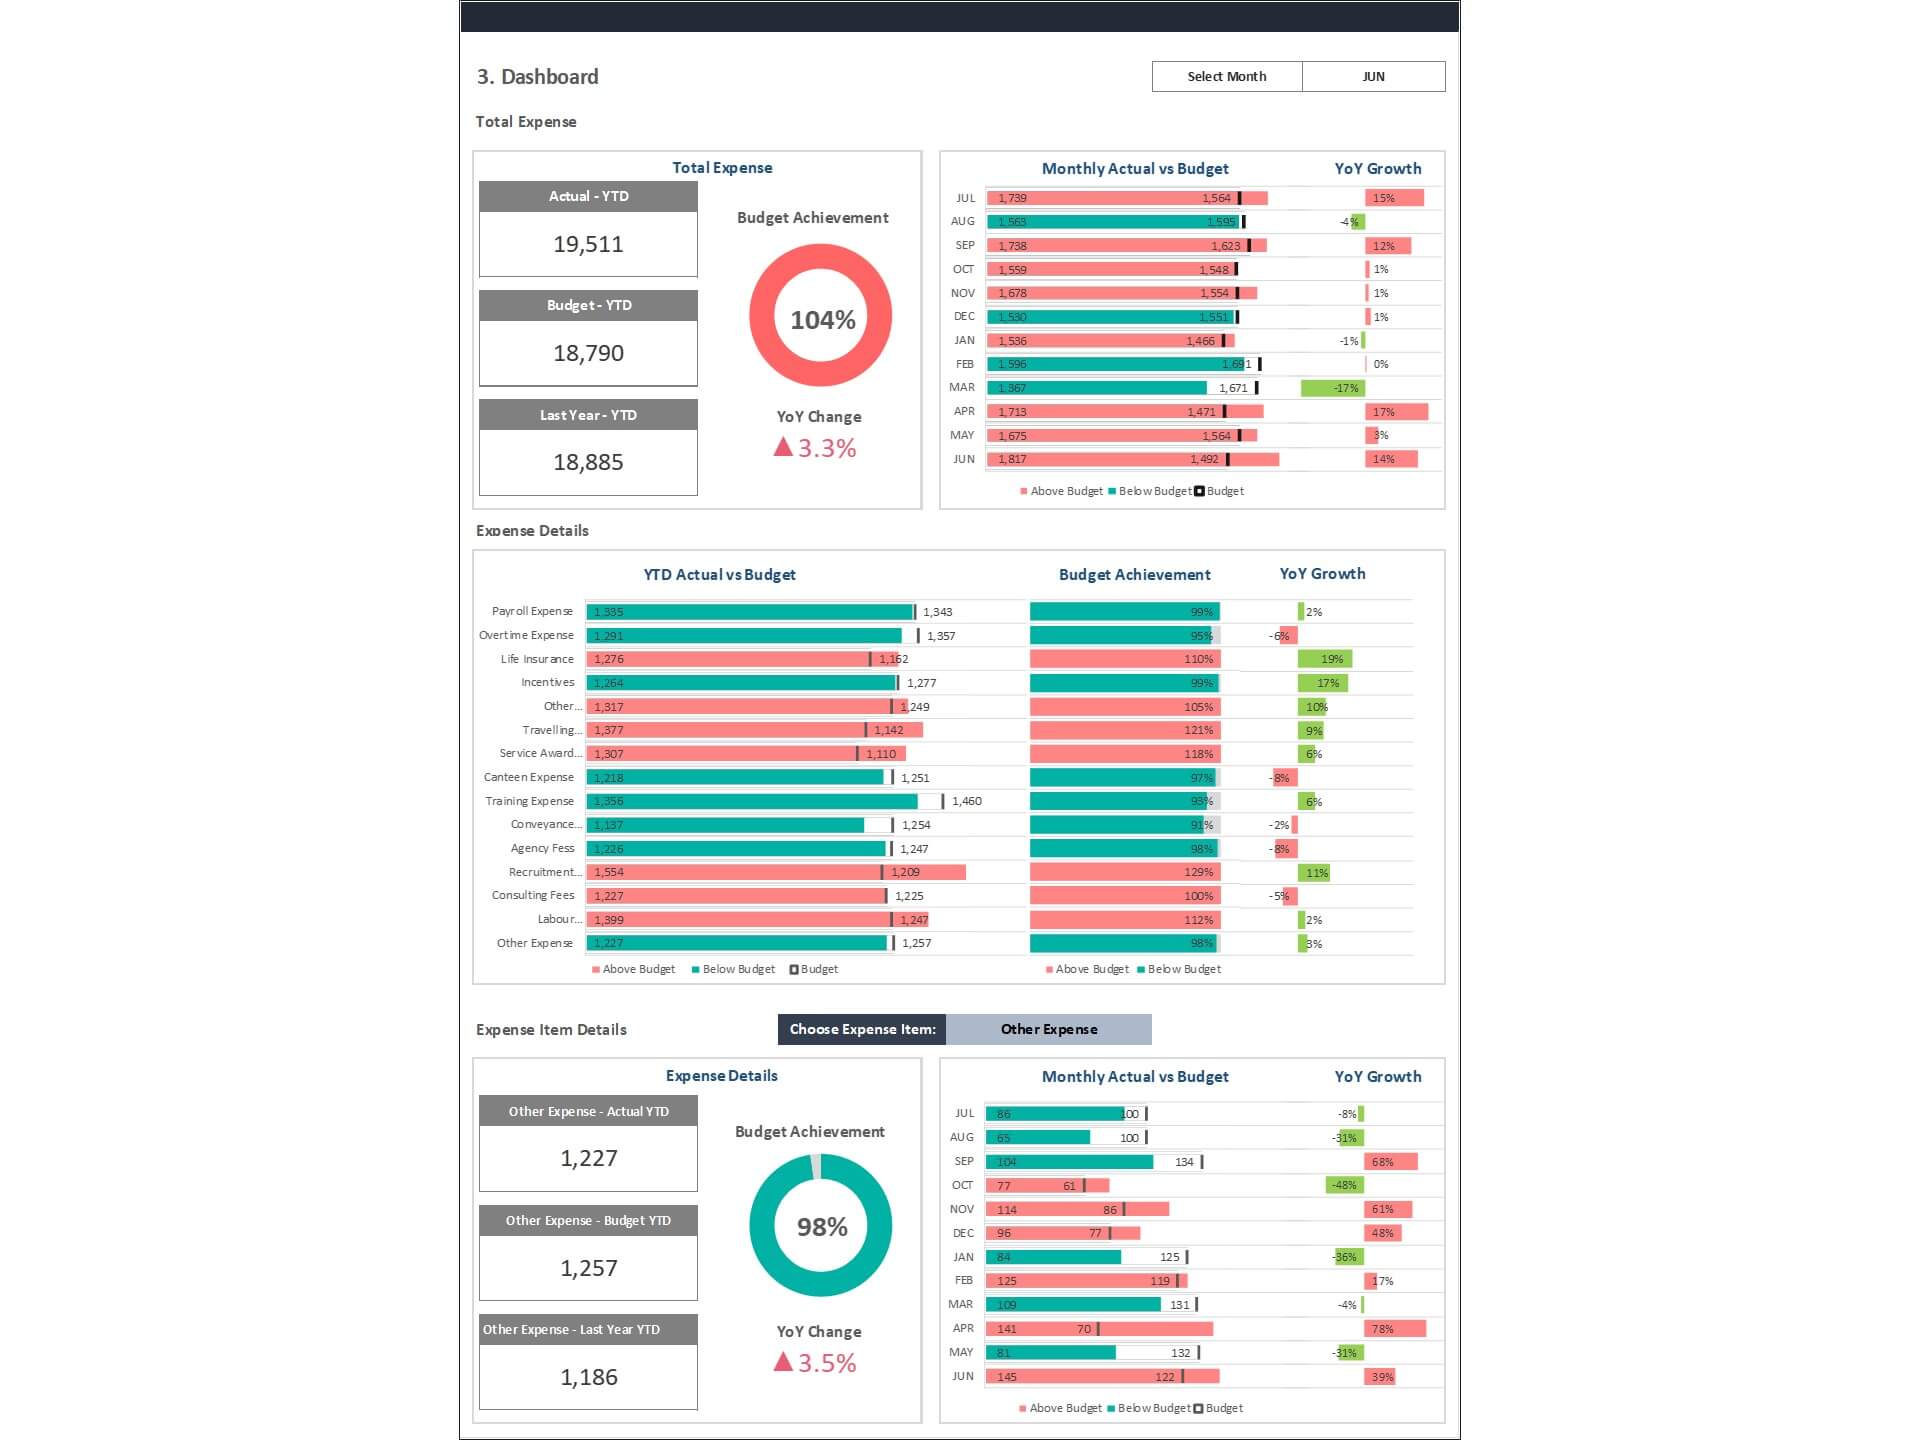
Display Financial Data with Our Innovative Financial Dashboards and Reporting Templates
Many business executives and students struggle to design interactive and visually-pleasing financial dashboards on Excel. They fail to incorporate necessary design tools and elements to give their presentations a creative spin and transform boring financial data into interesting dashboards. As a result, they end up spending a lot of time and money on expensive graphic designers.
To save you from the hassle and unwanted expenses, we bring an expansive range of user-friendly and flexible Excel Dashboard Templates to help you create beautiful presentations. Whether you’re looking for financial dashboards, sales management dashboard templates or HR dashboard Excel templates to entice your colleagues, teachers, or managers, Biz Infograph offers it all!
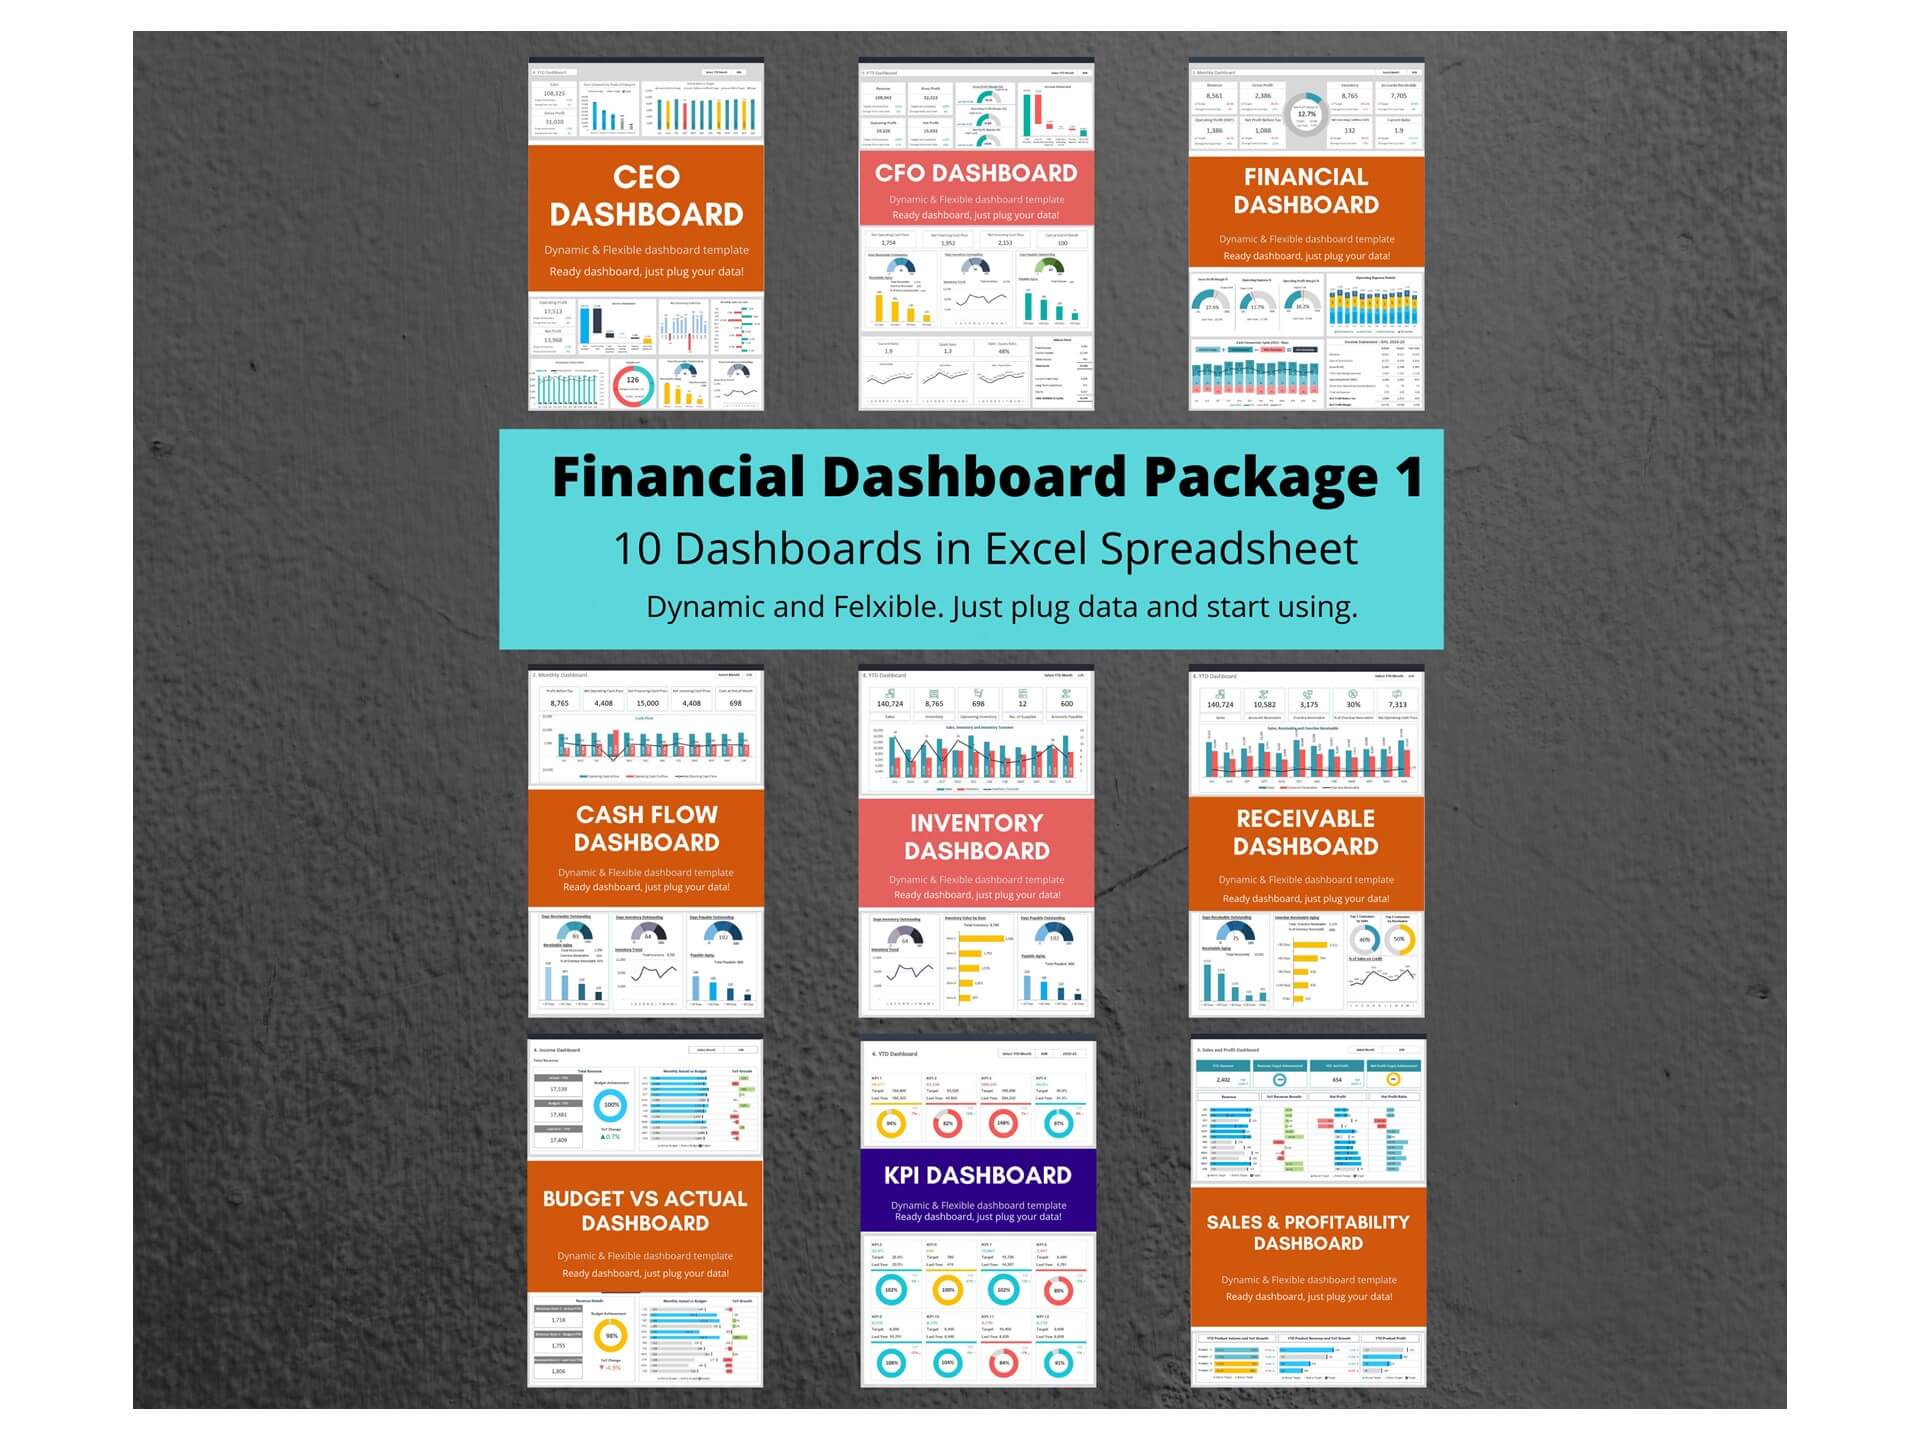
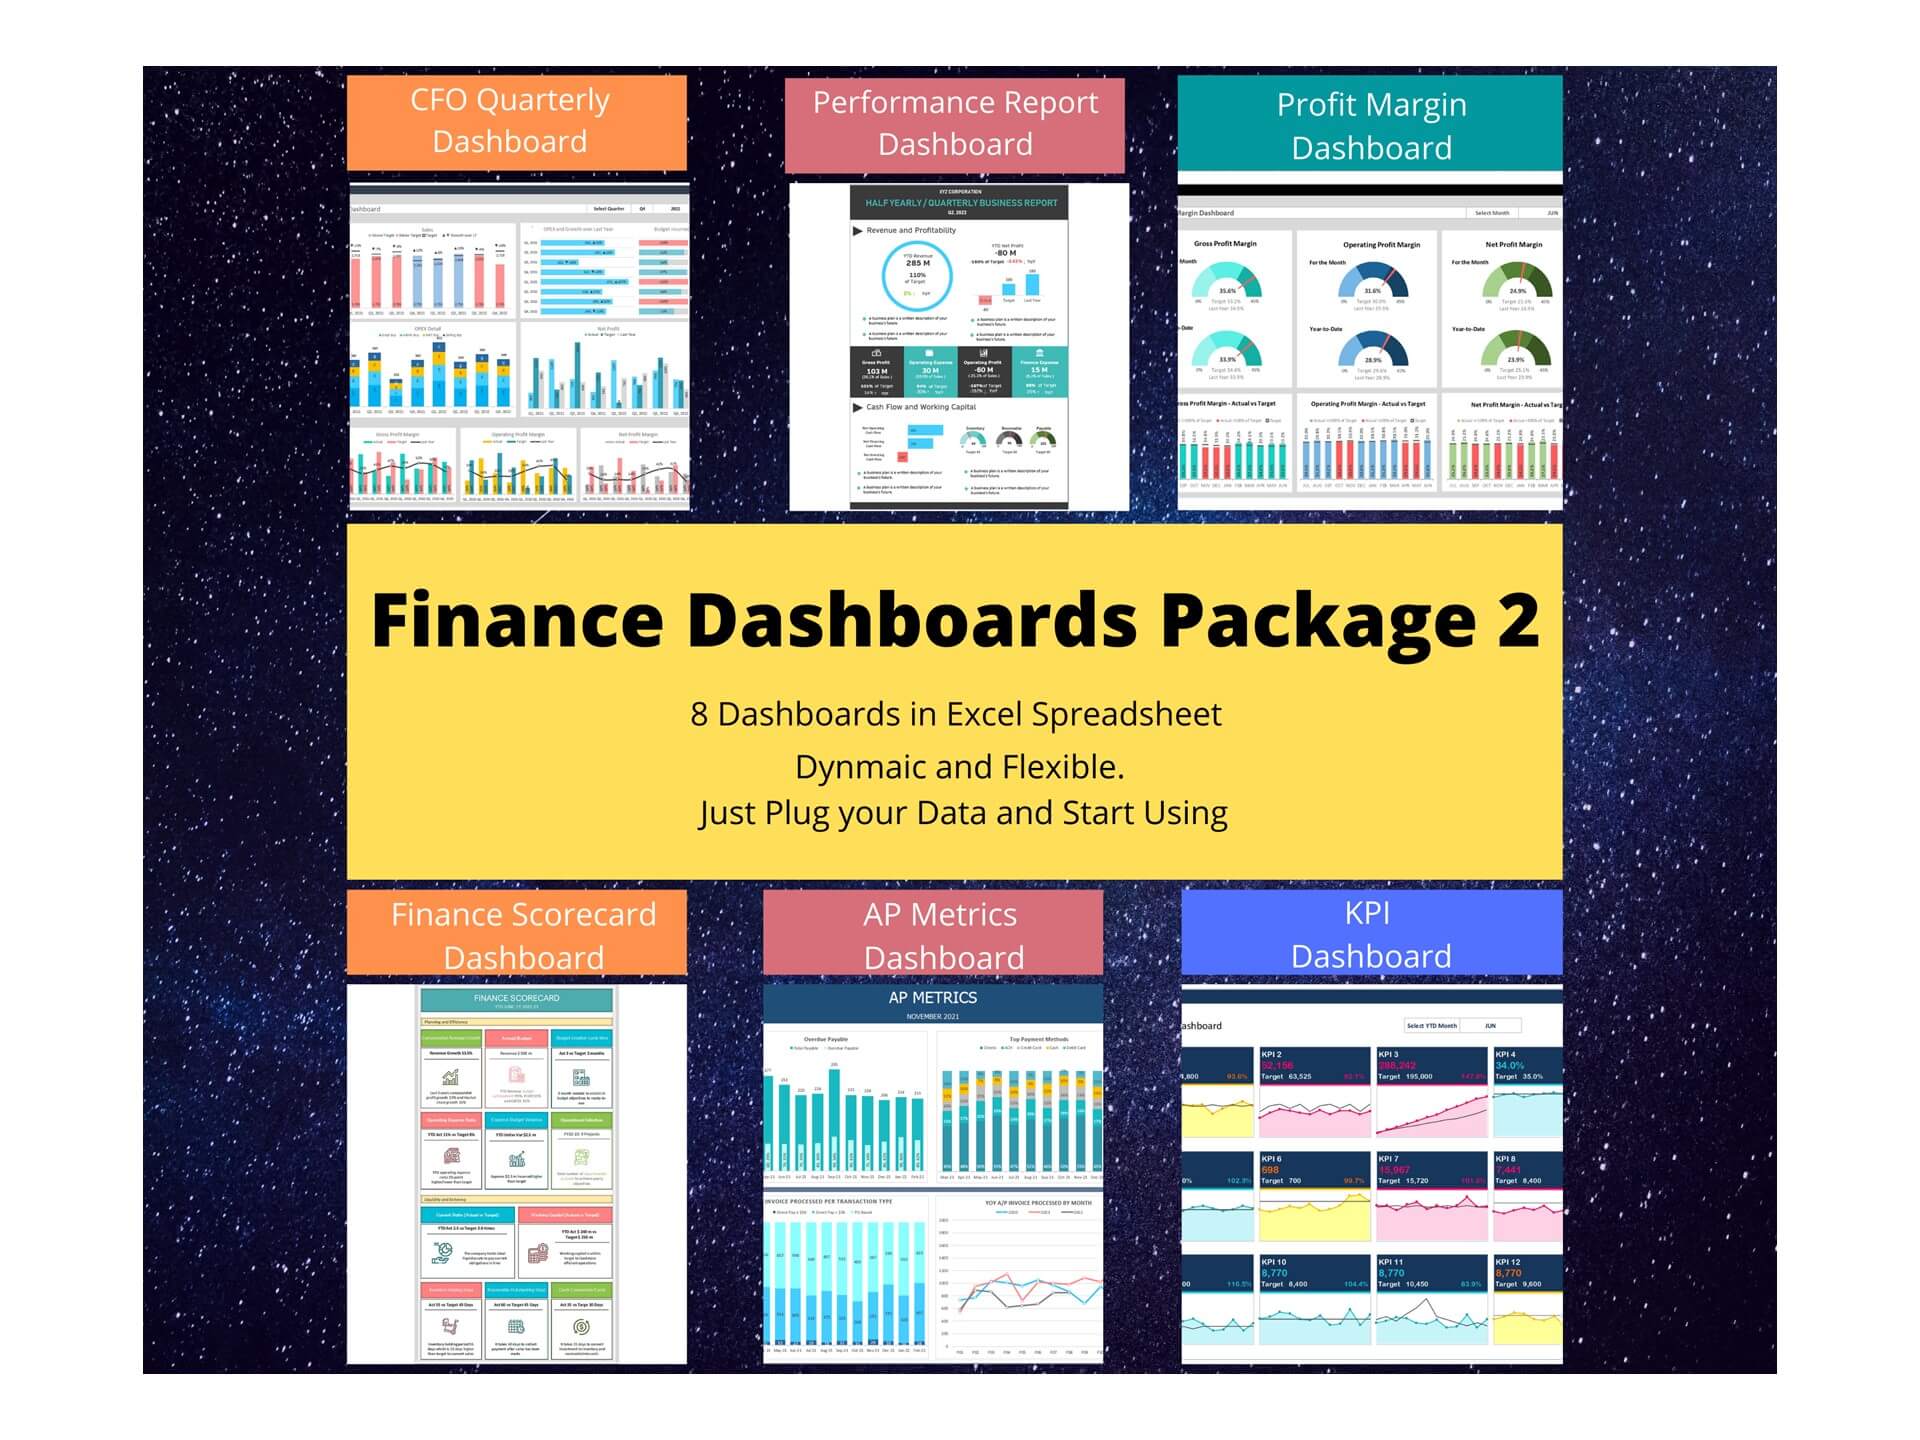
Browse through our wide range of stunning dashboards and reporting templates that are fully dynamic, flexible and very easy to use. All dashboards are ready, just plug your data and start using.
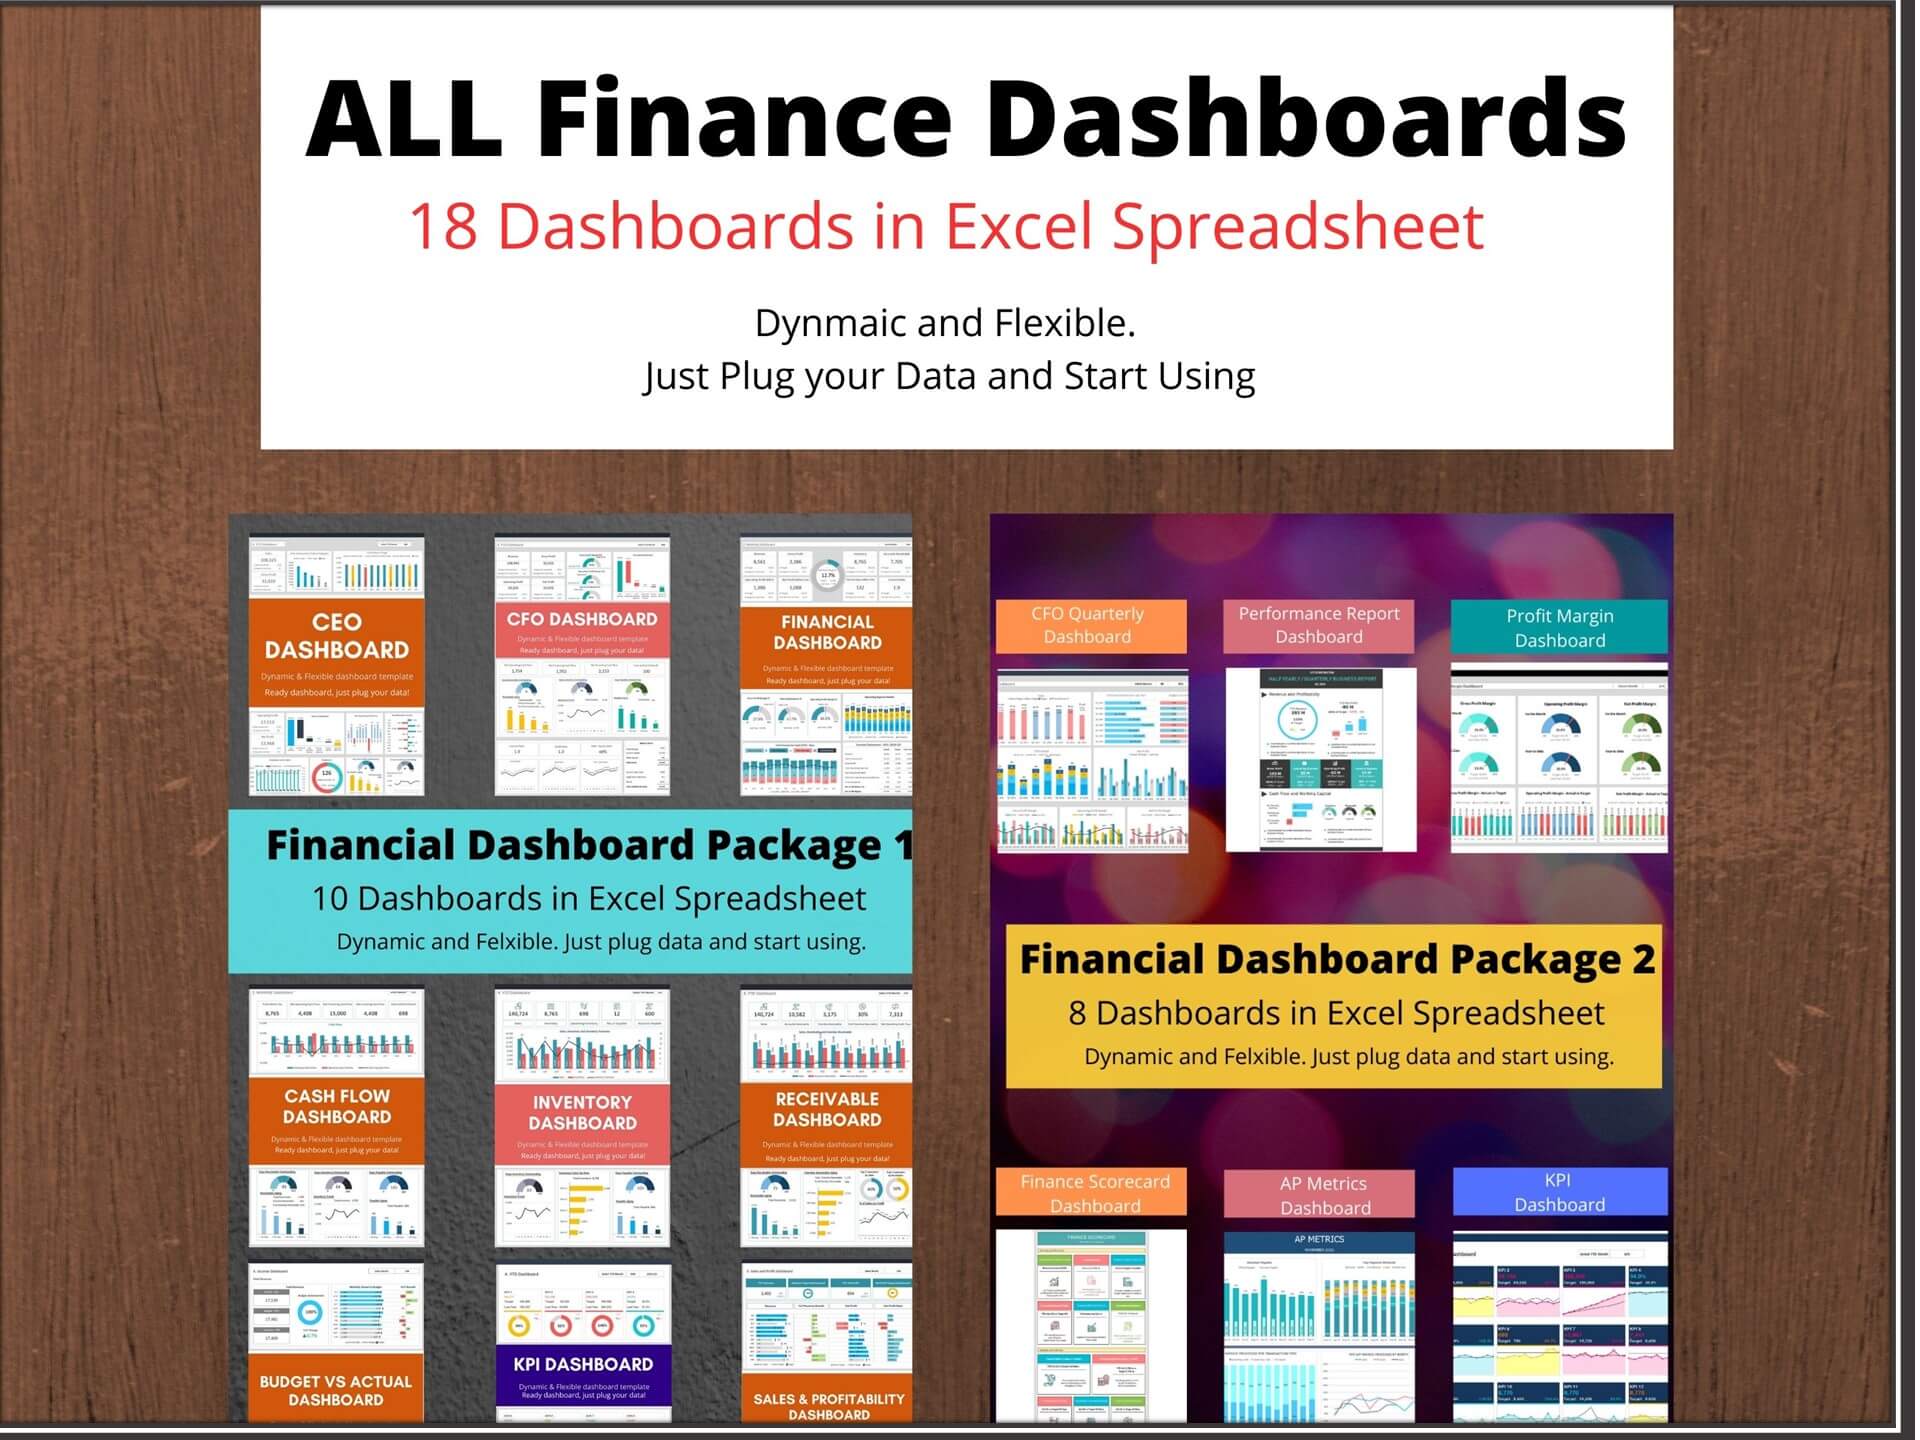

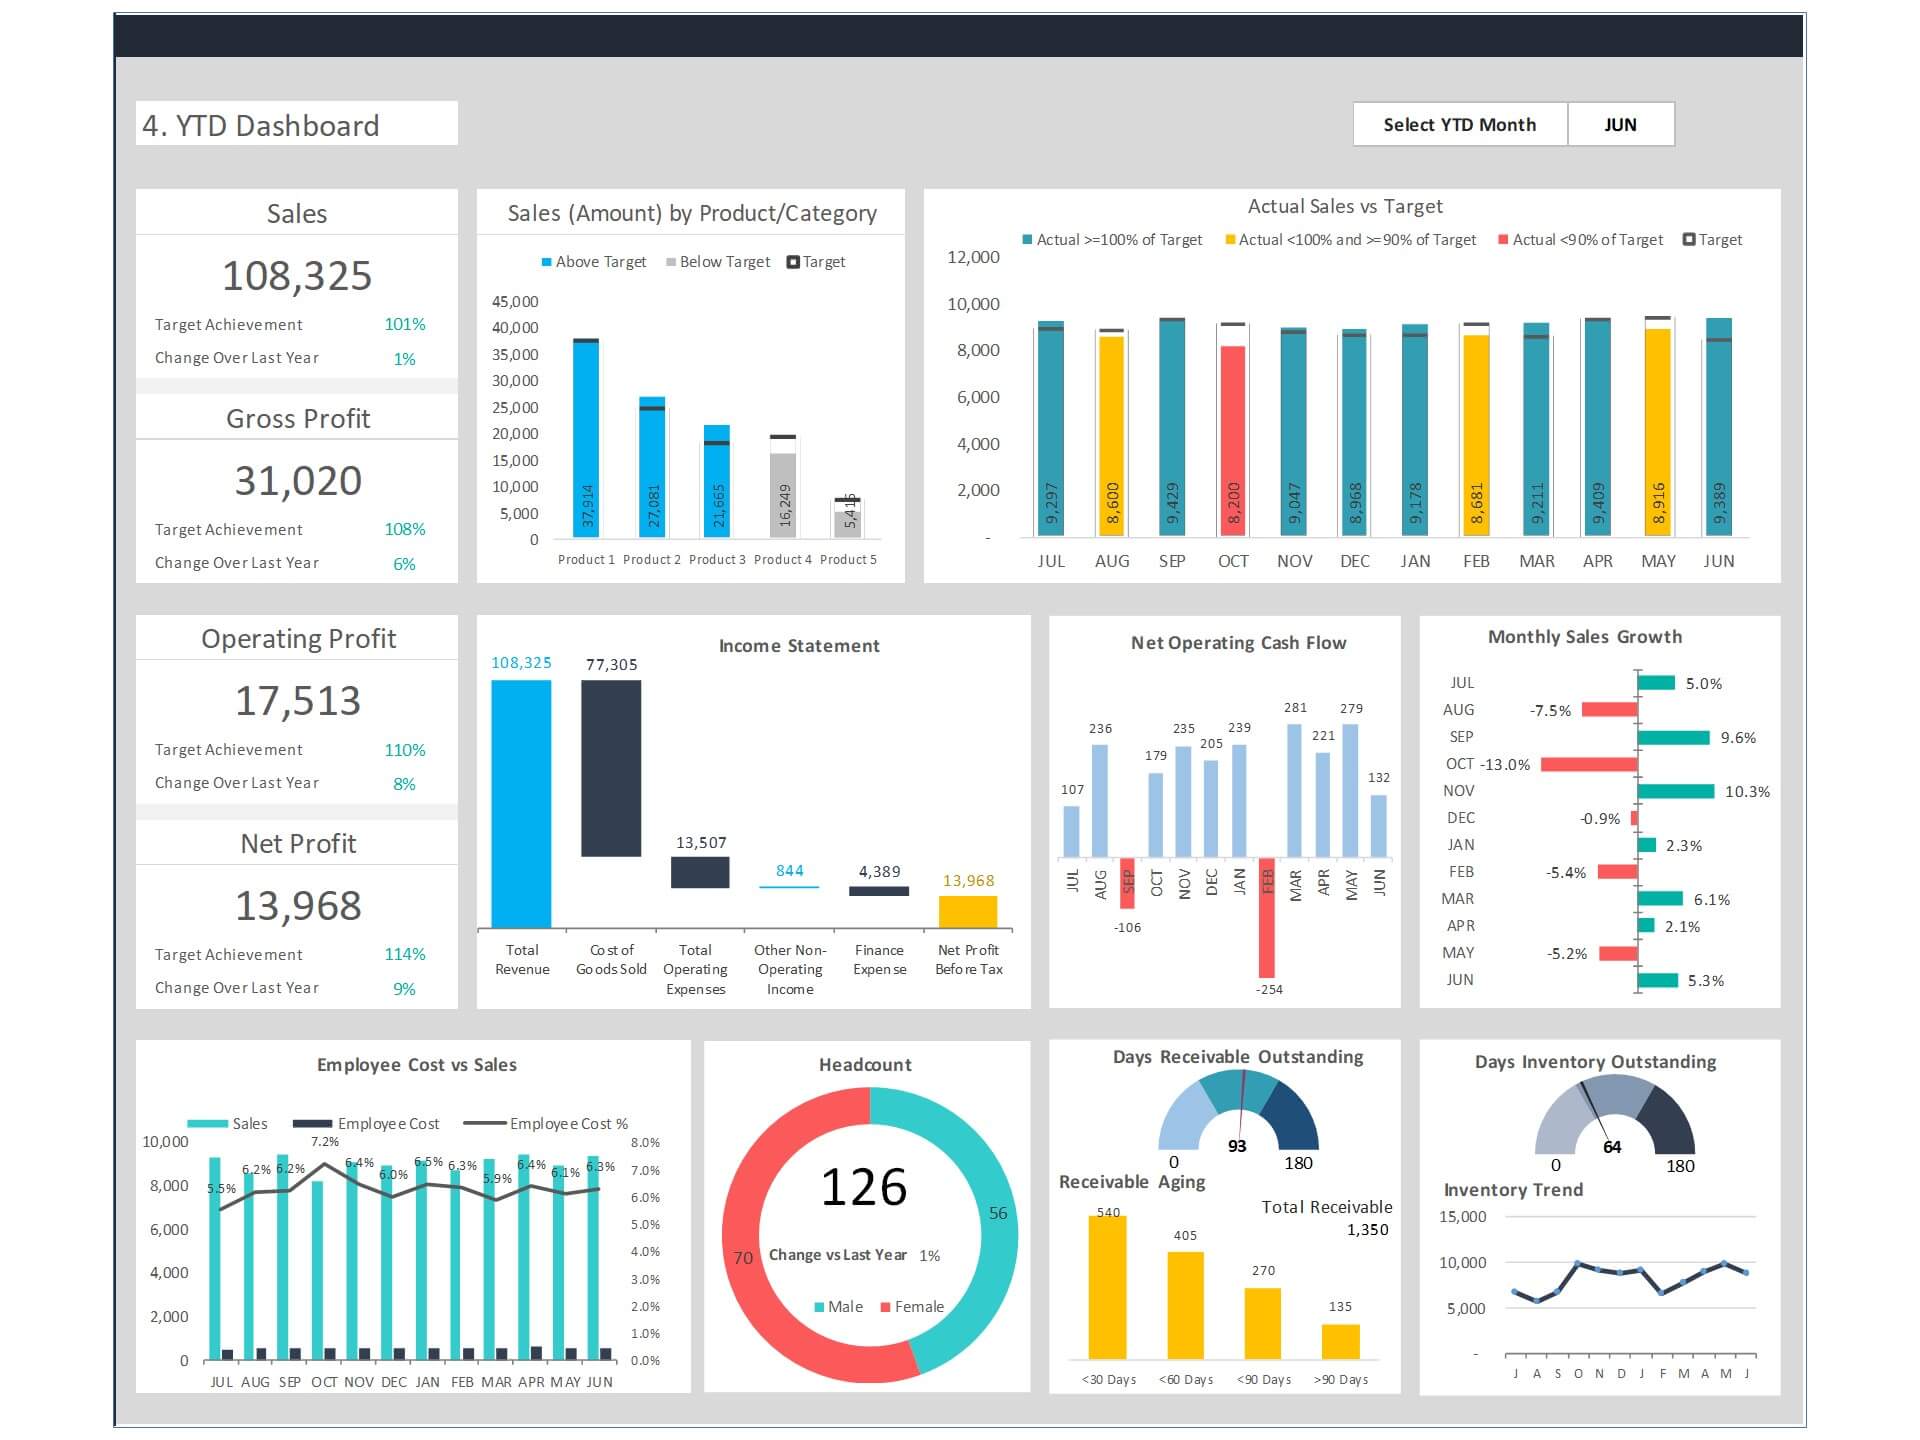
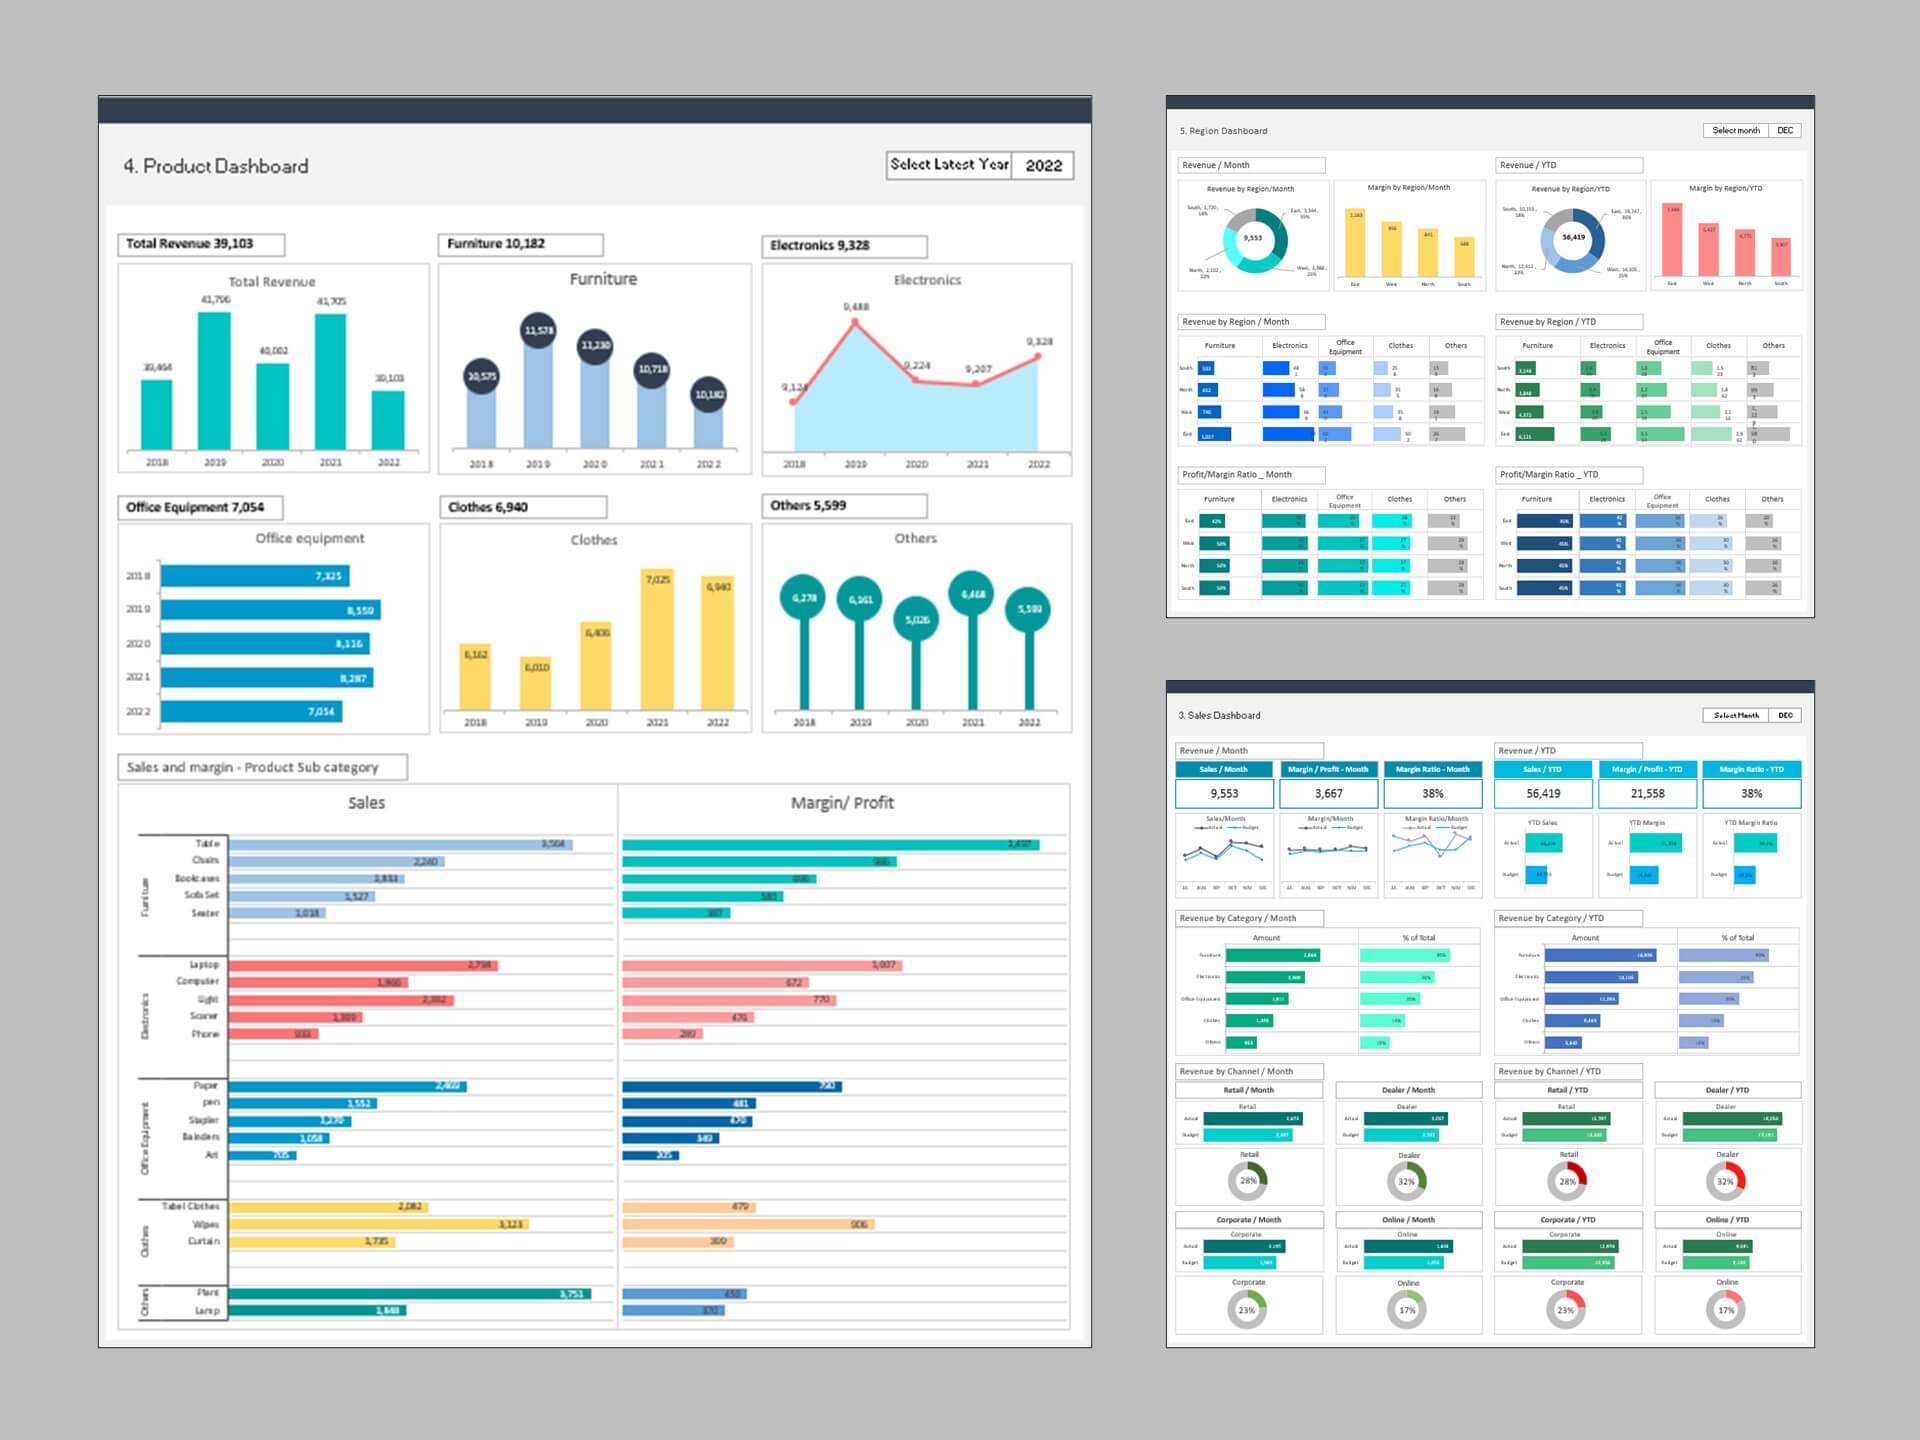
Choose from a range of professional financial dashboard templates that have been created for use by small to mid-sized businesses, corporates, individuals, and organizations alike. There are various design options available, depending on your requirements and needs, whether you’re using these financial dashboards and templates for personal use or professional.
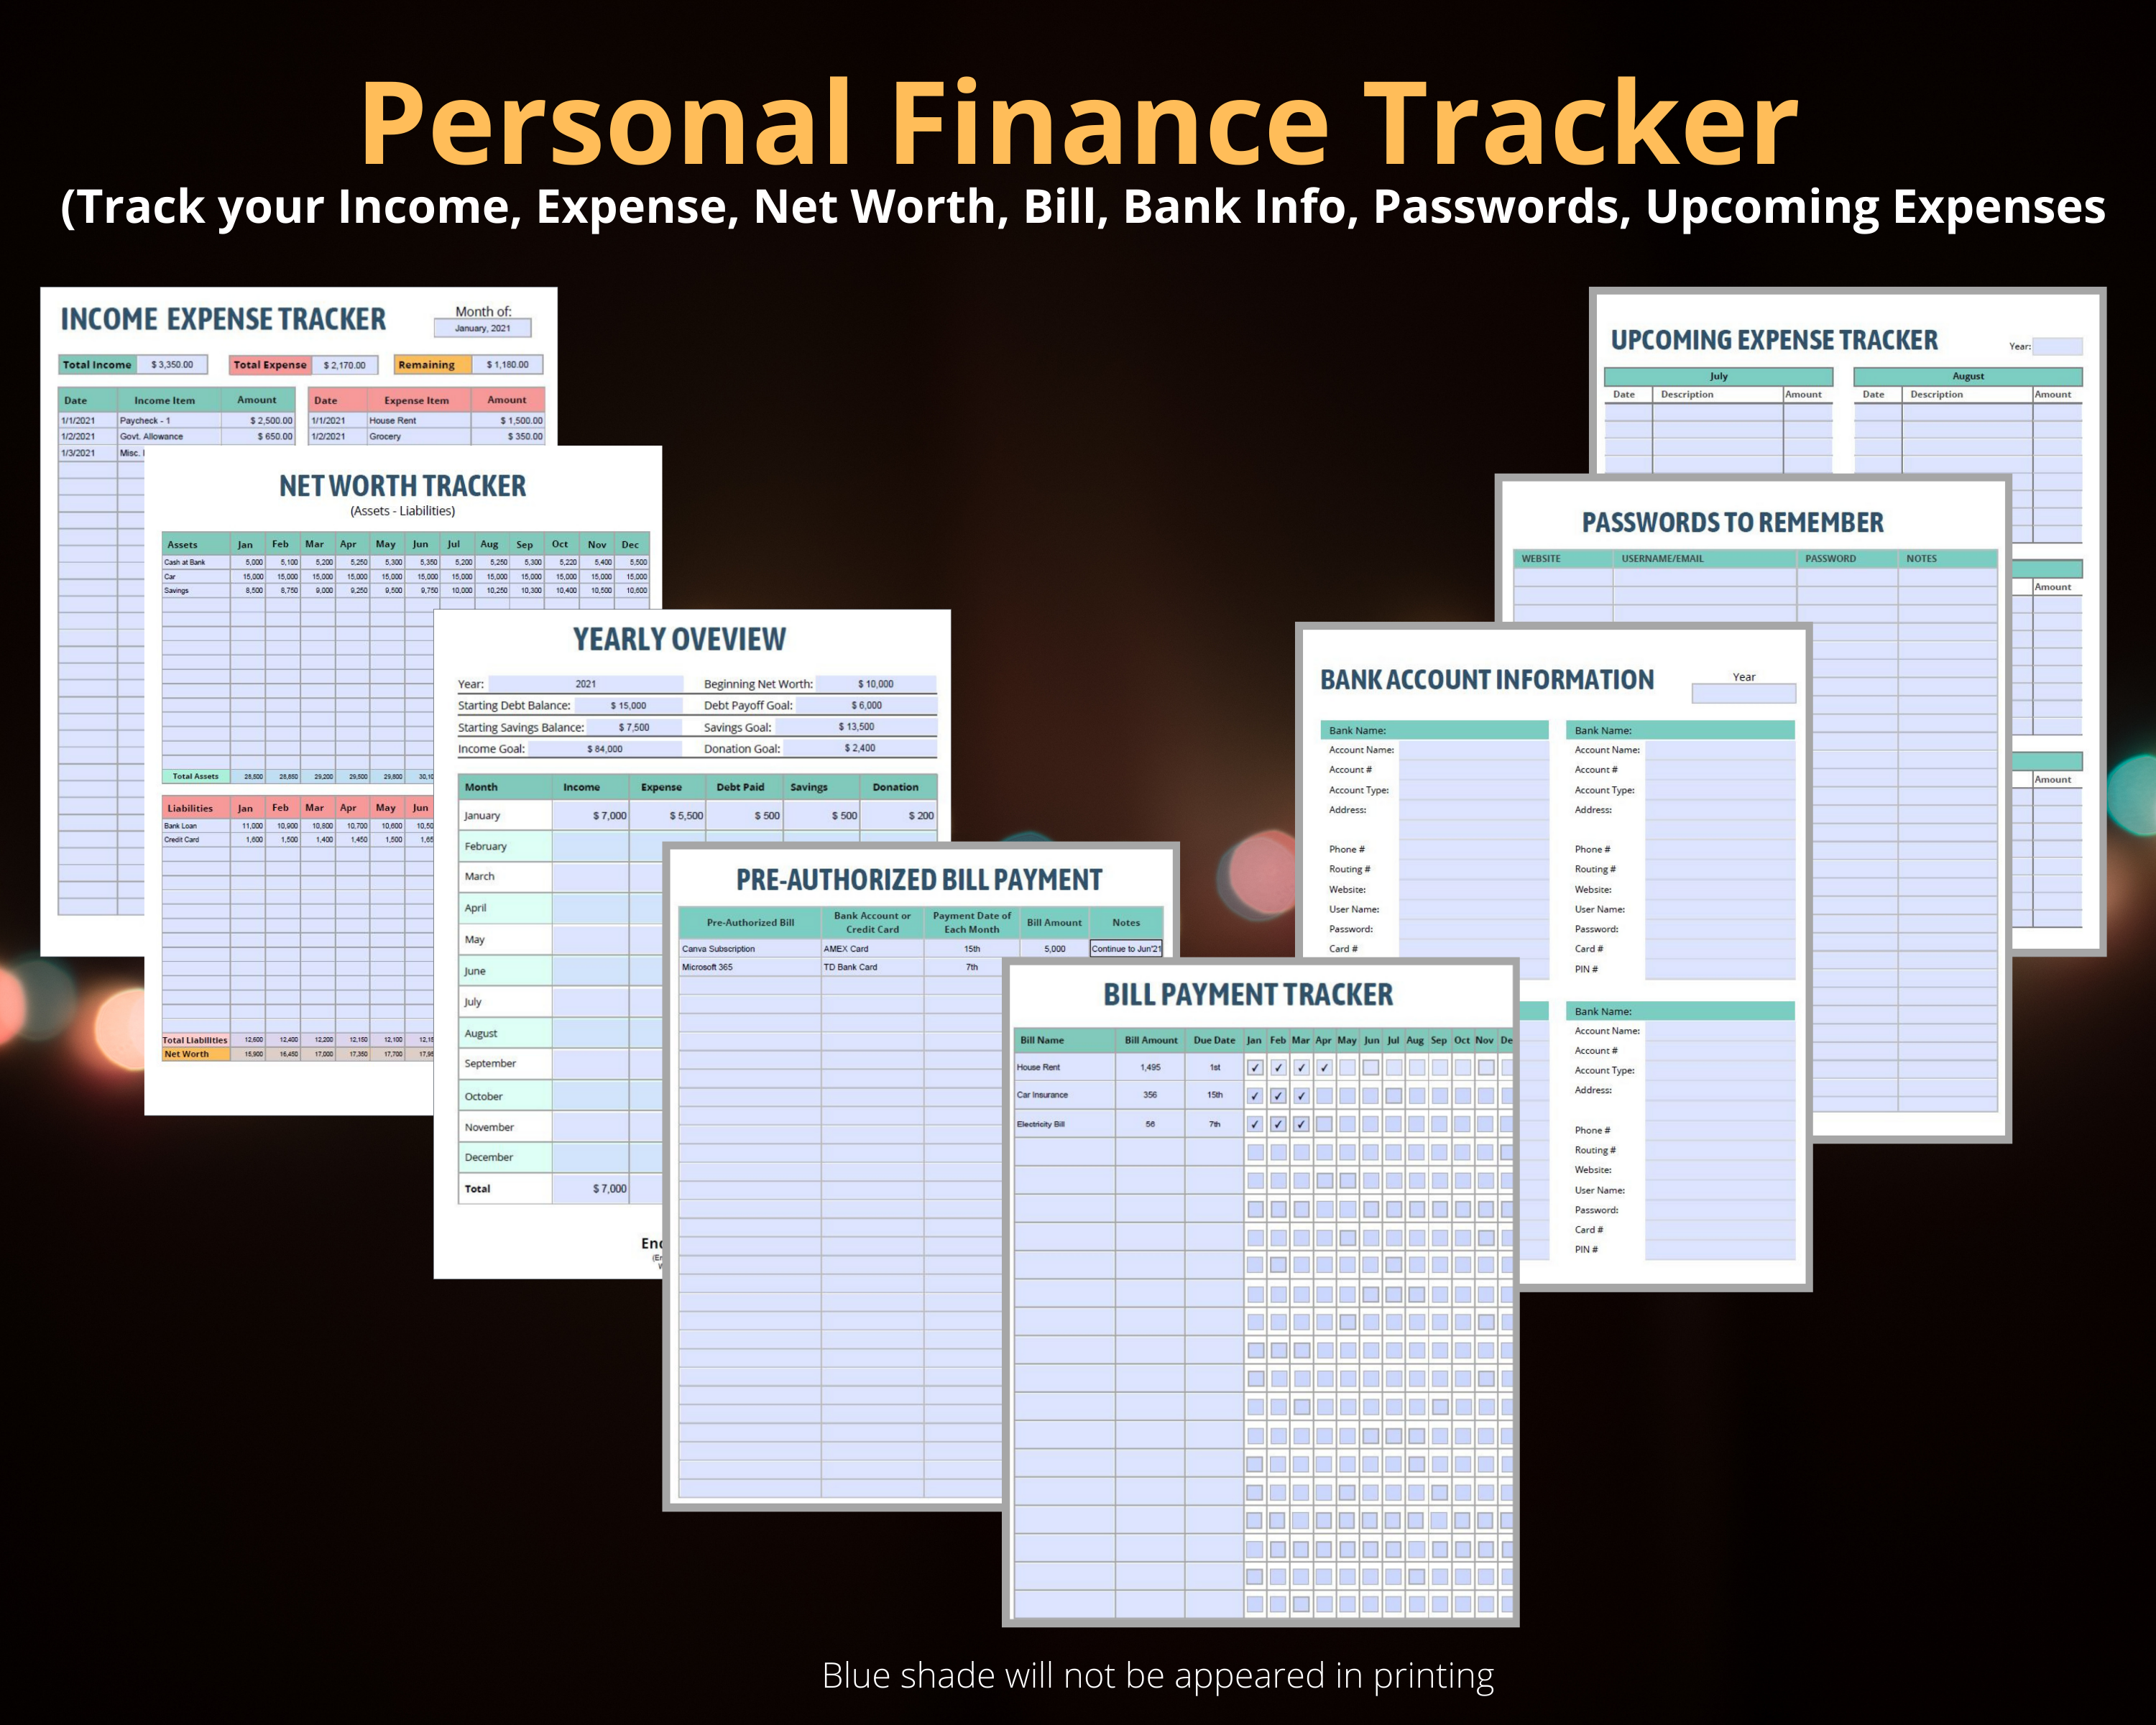
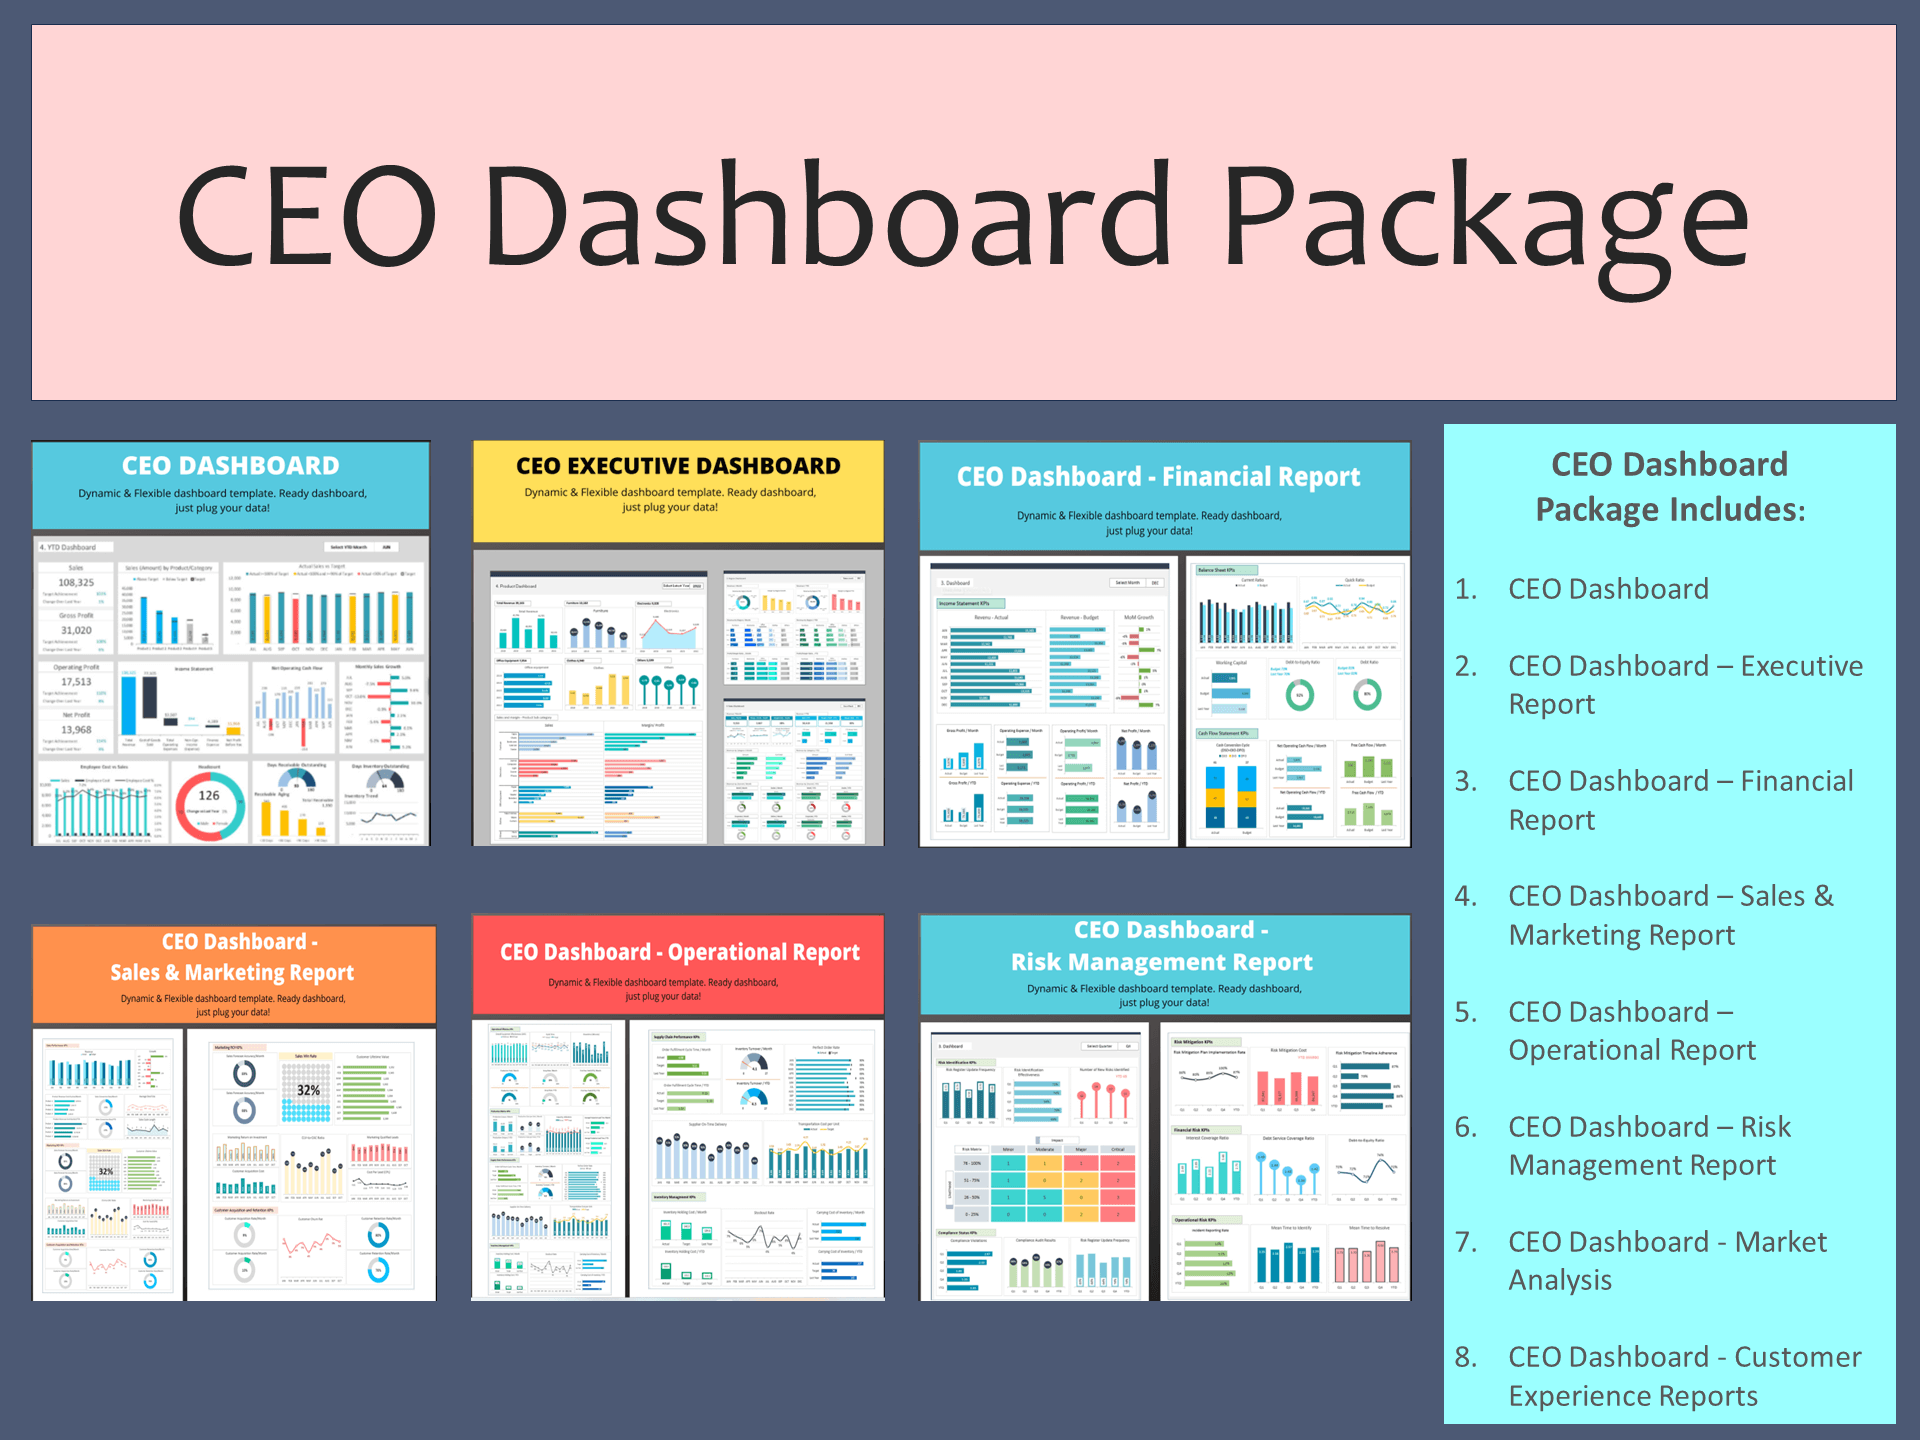
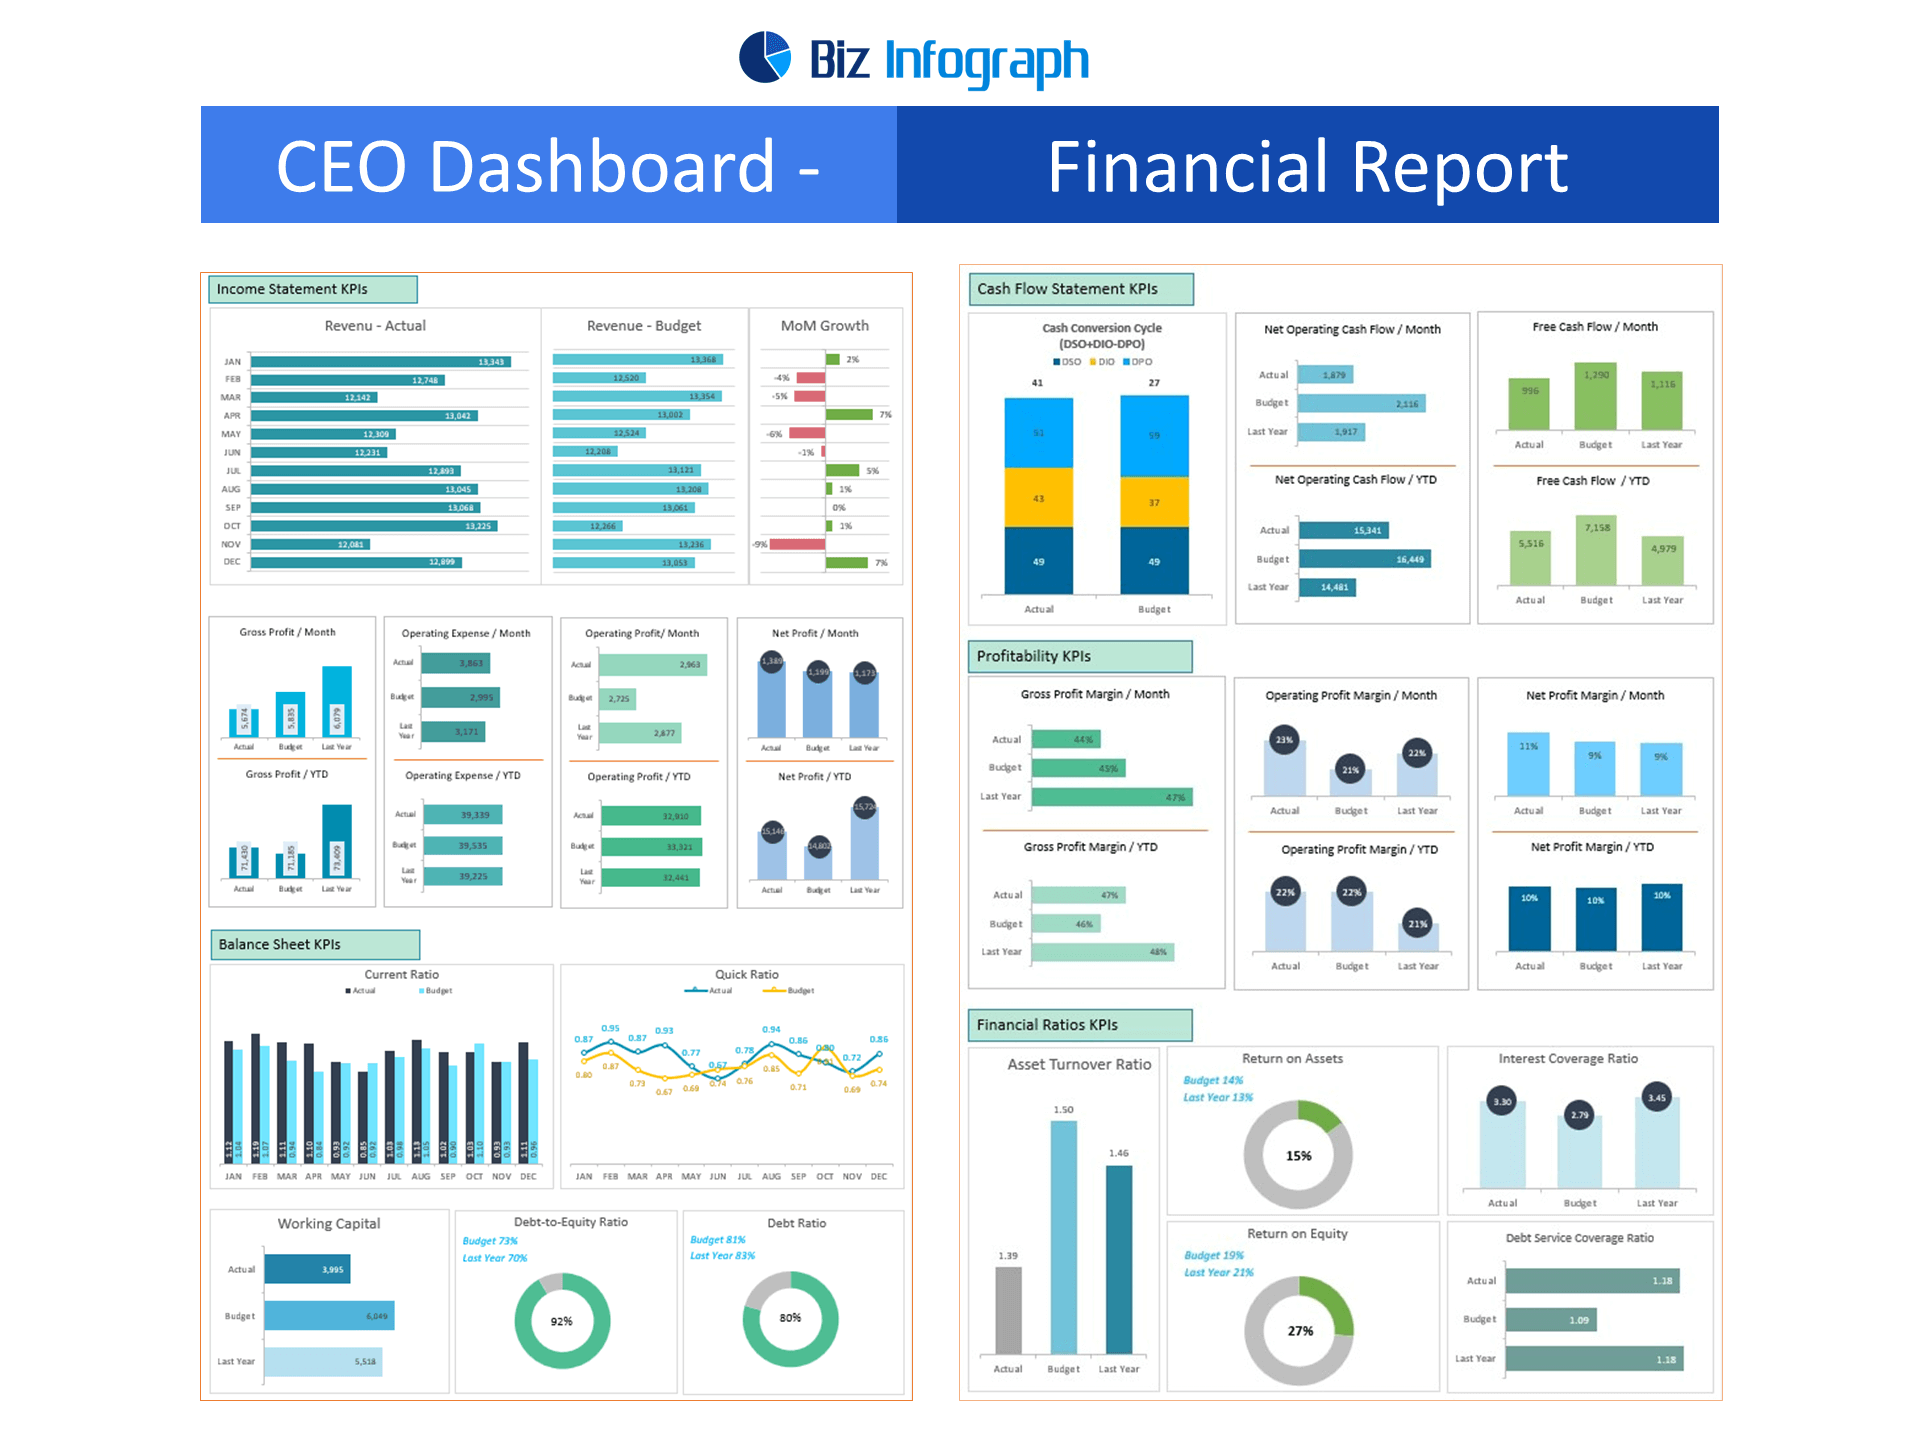
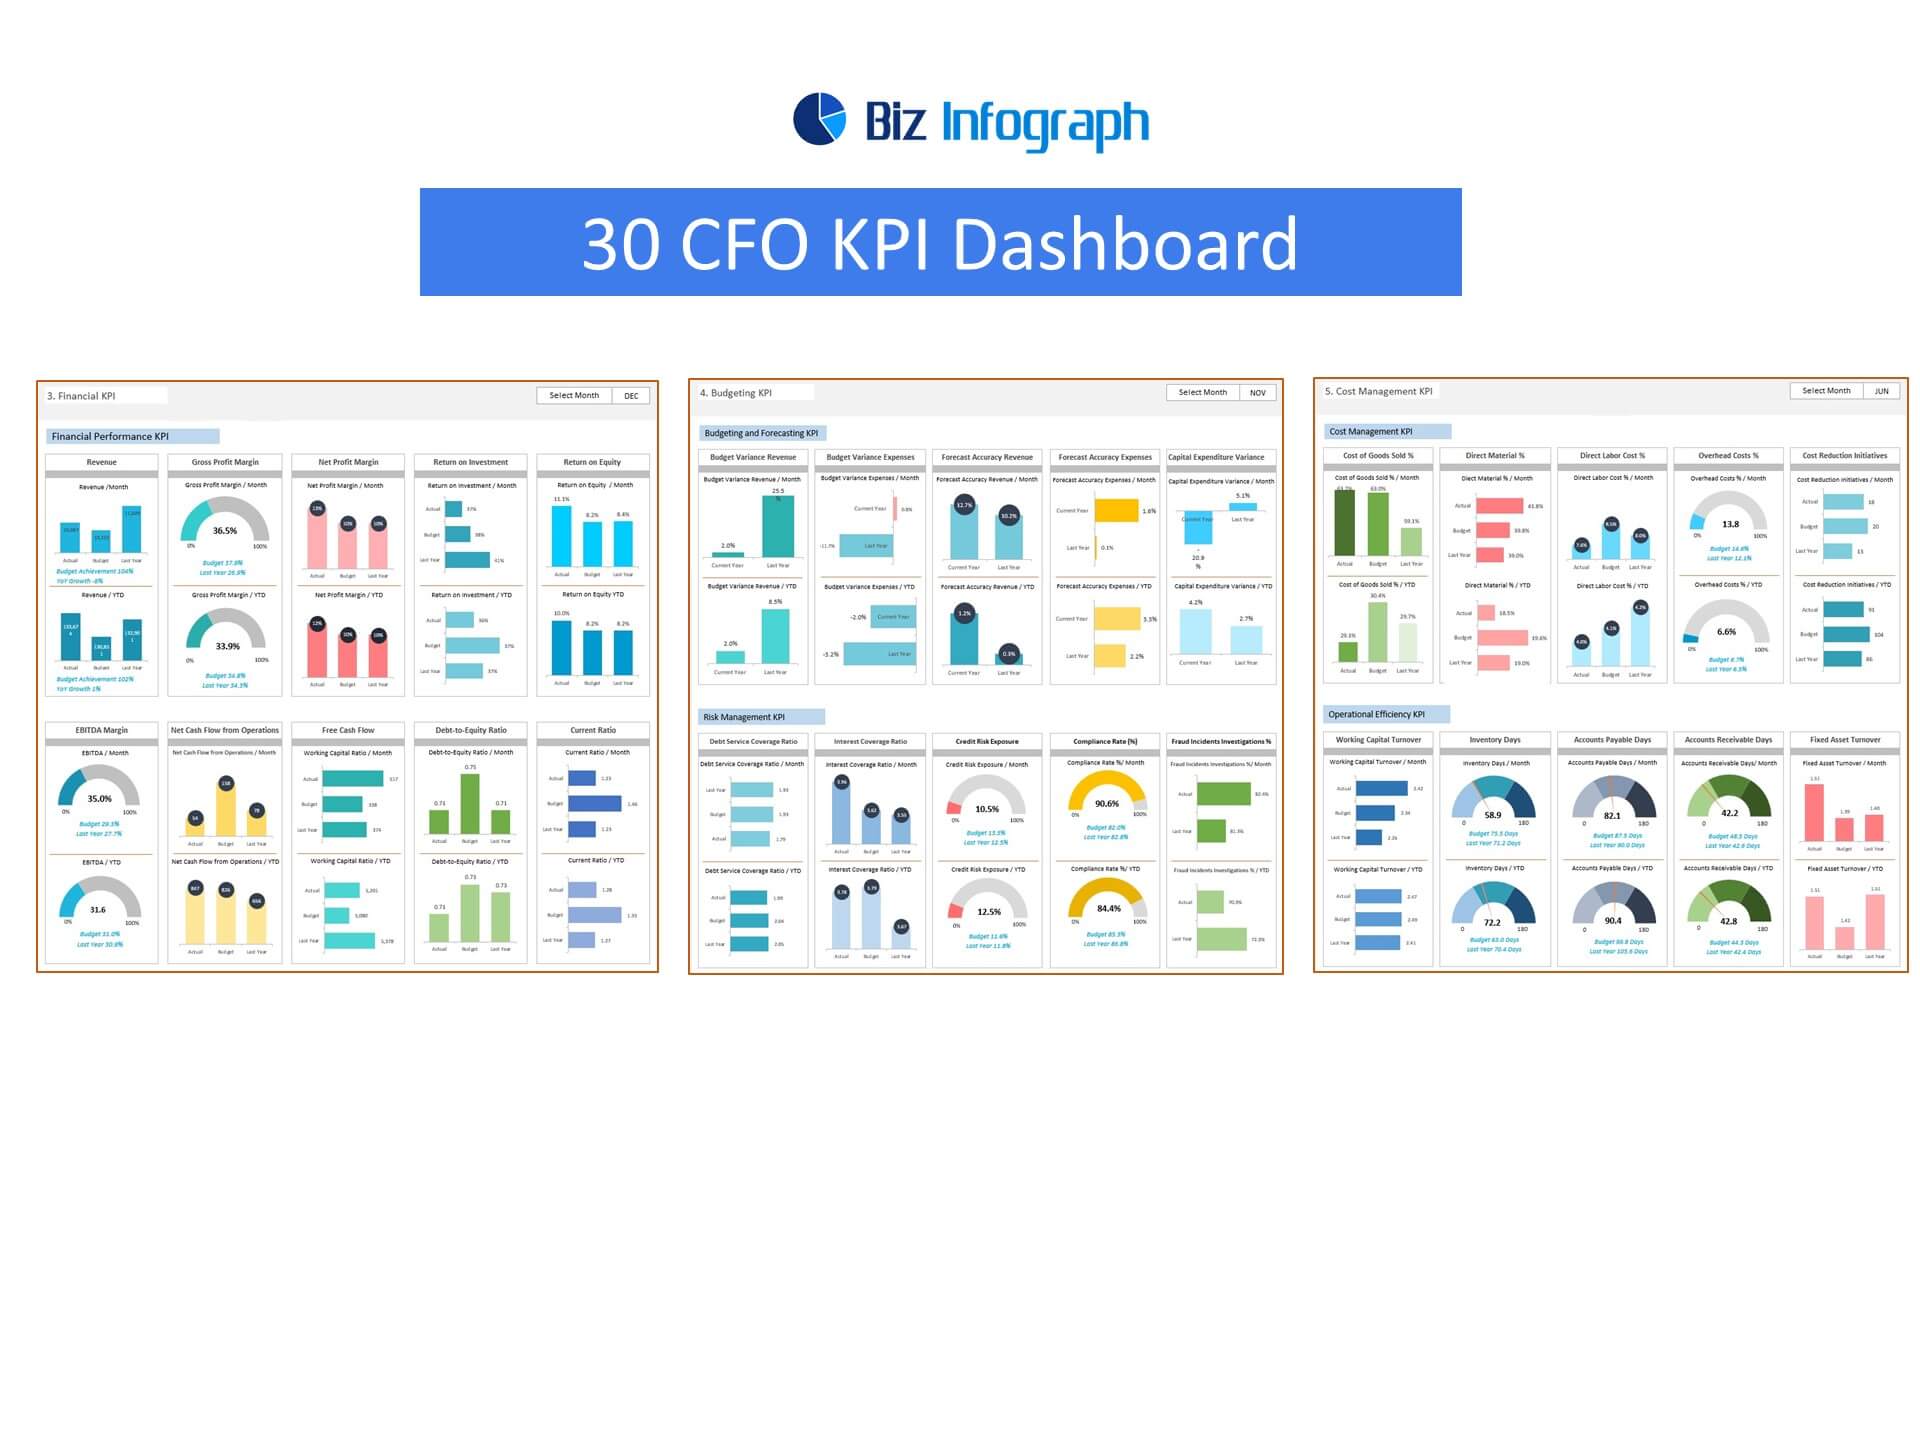
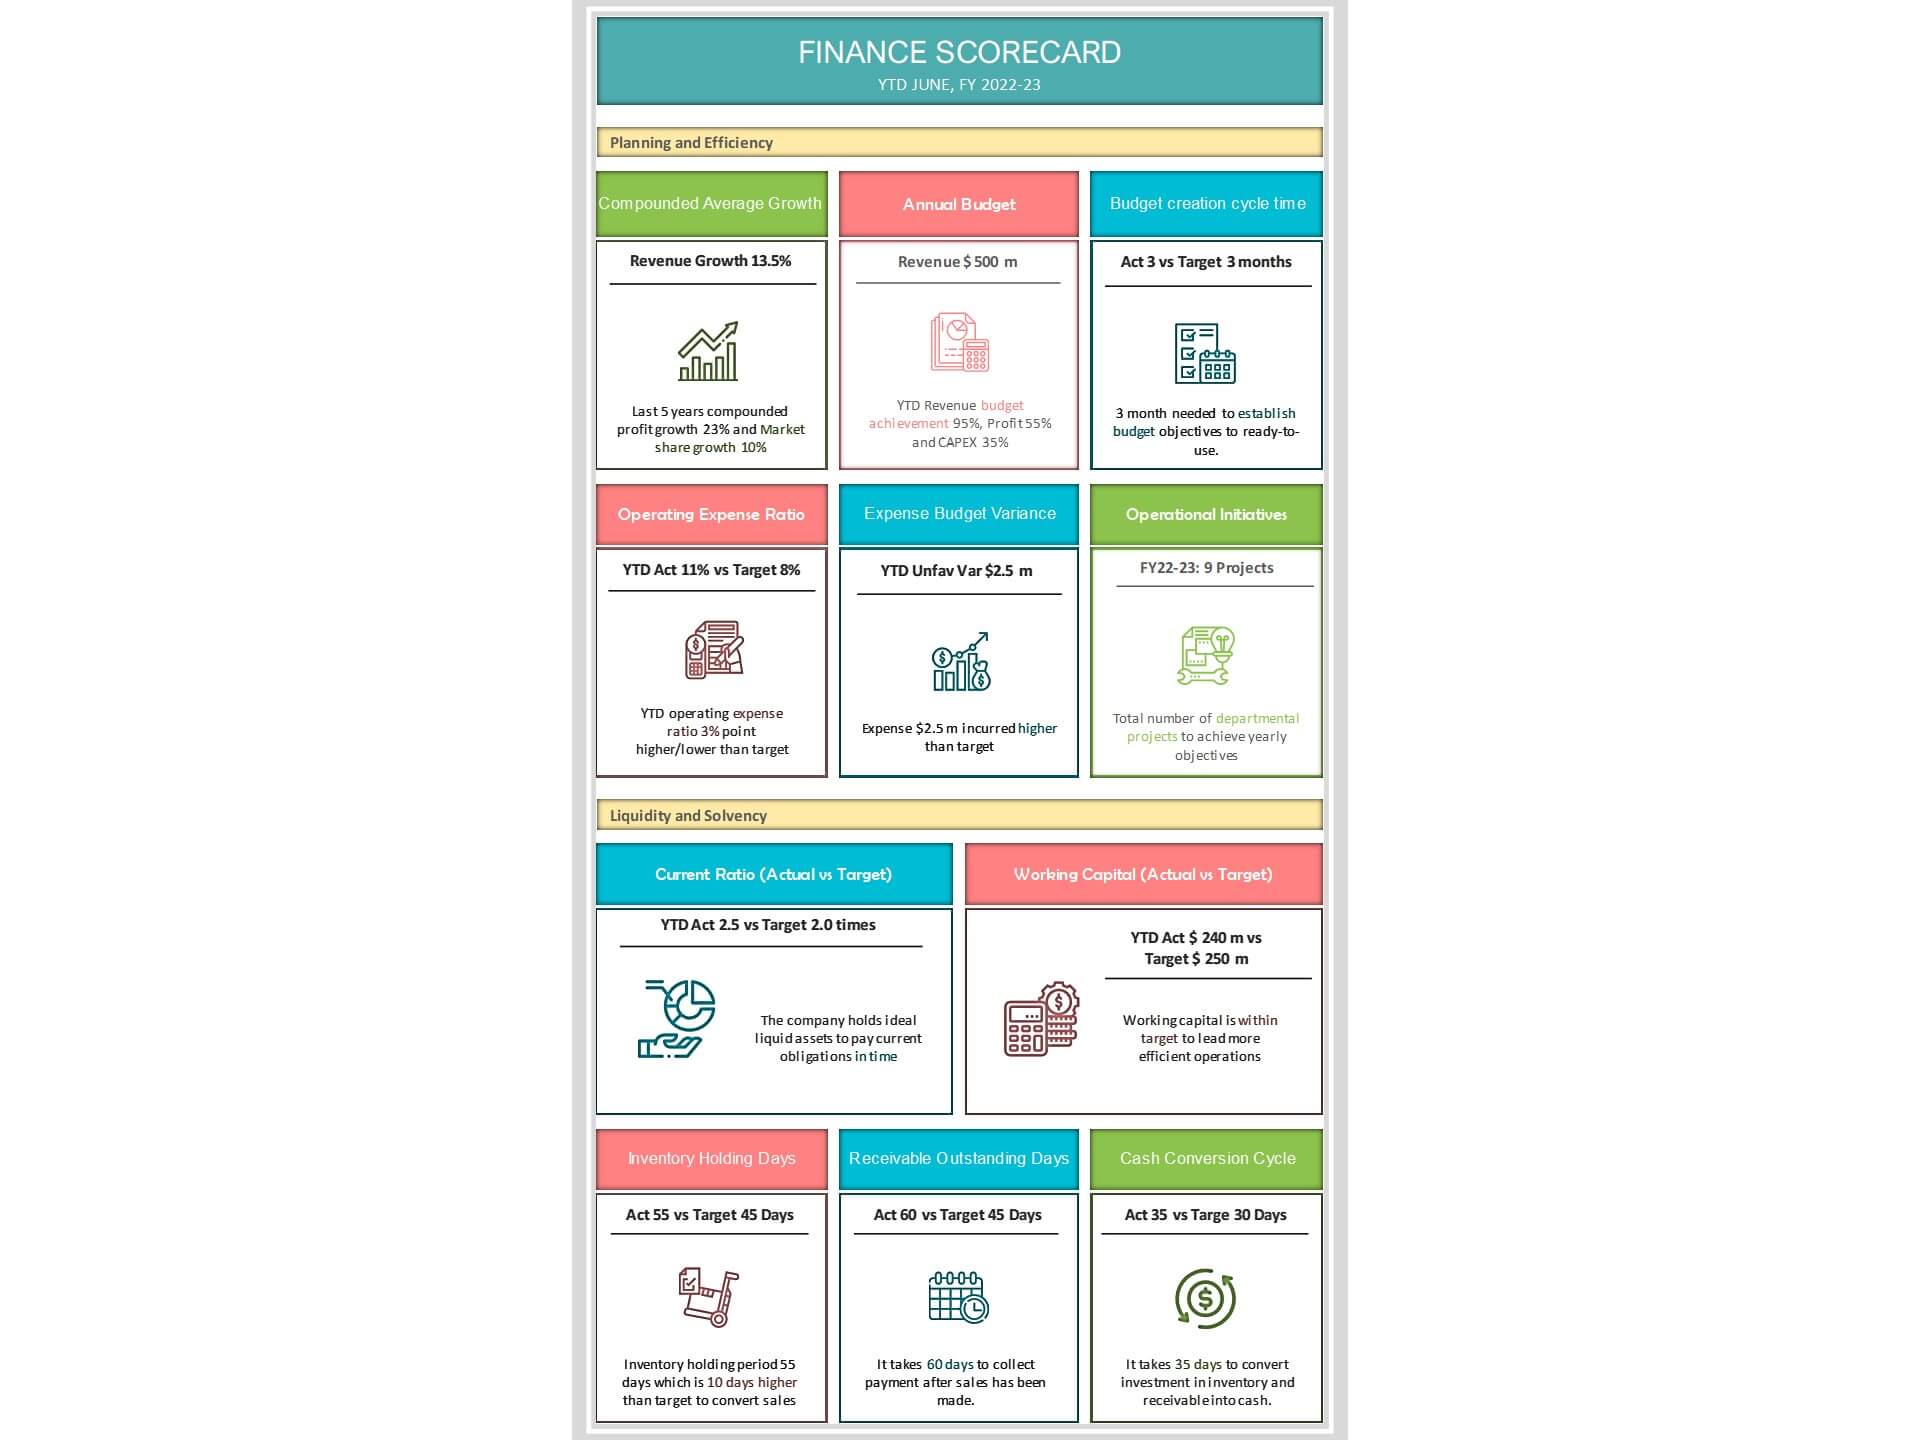
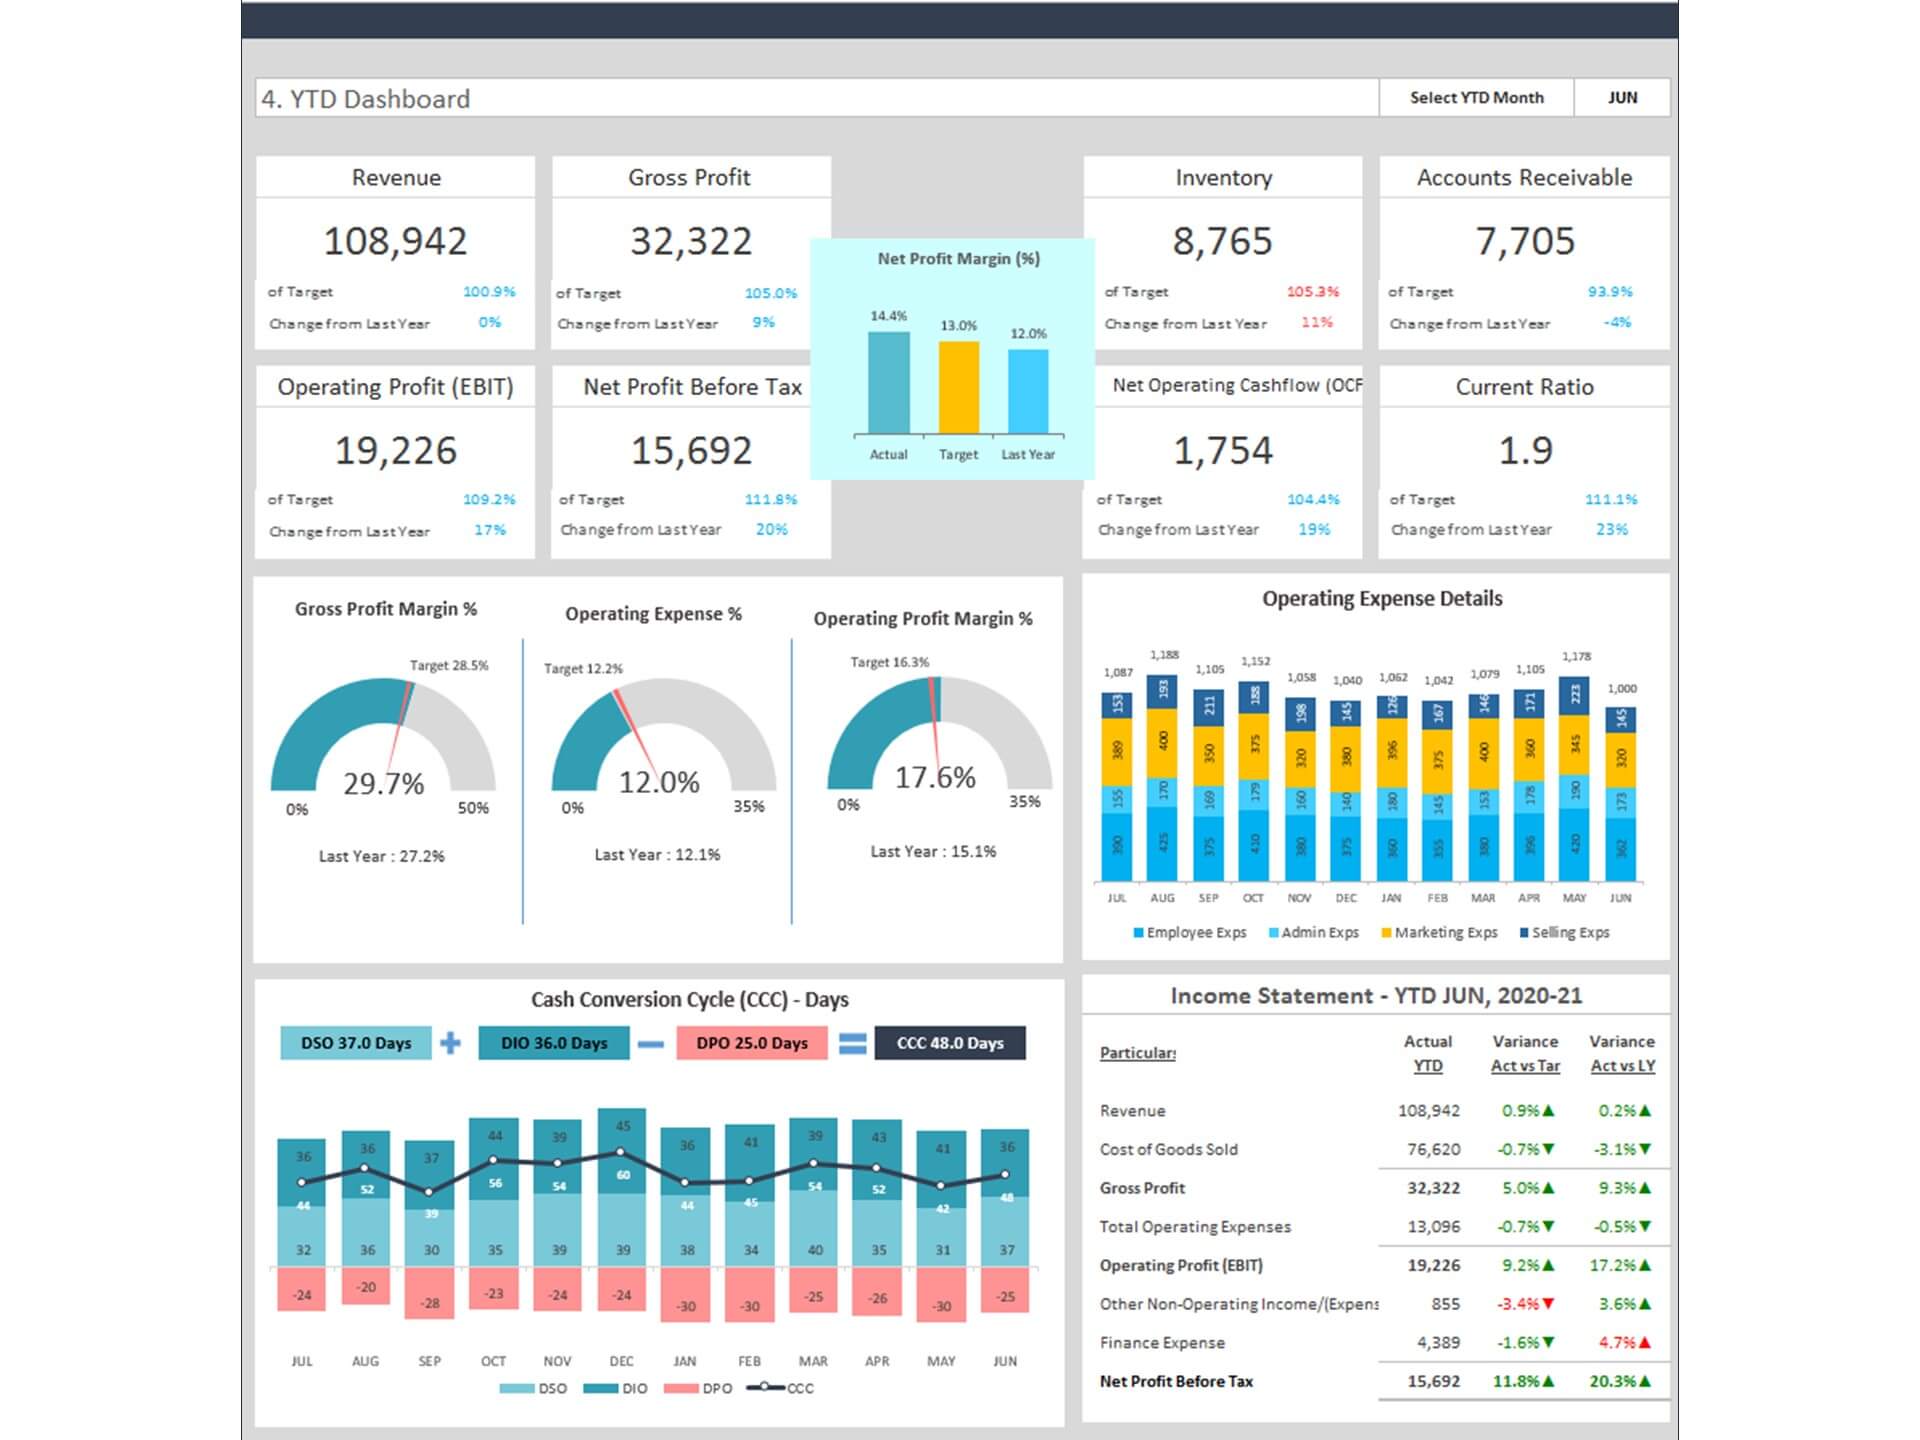
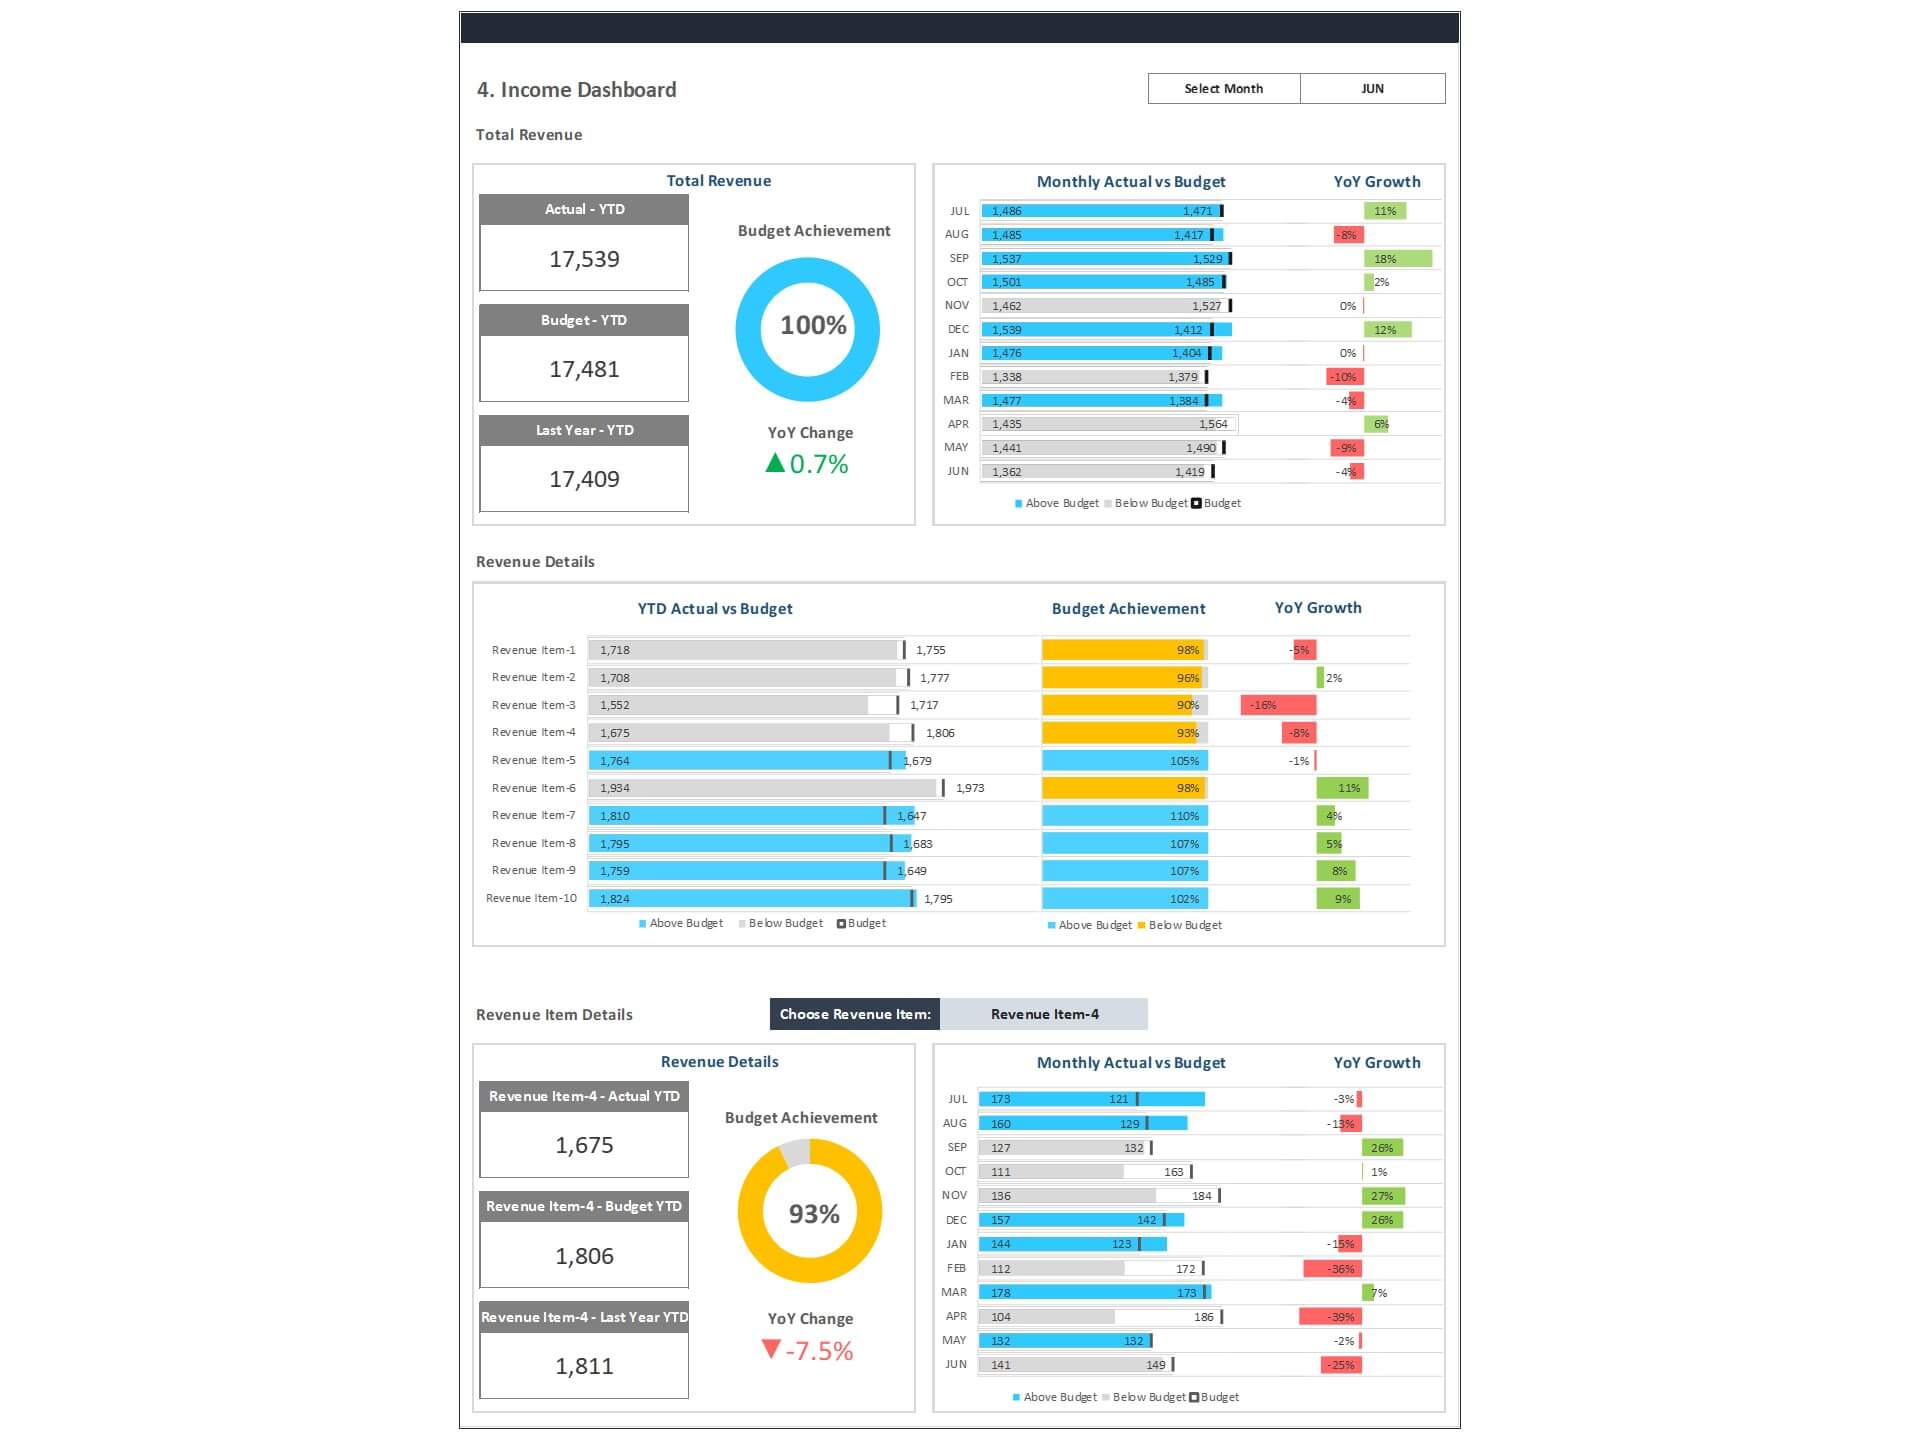
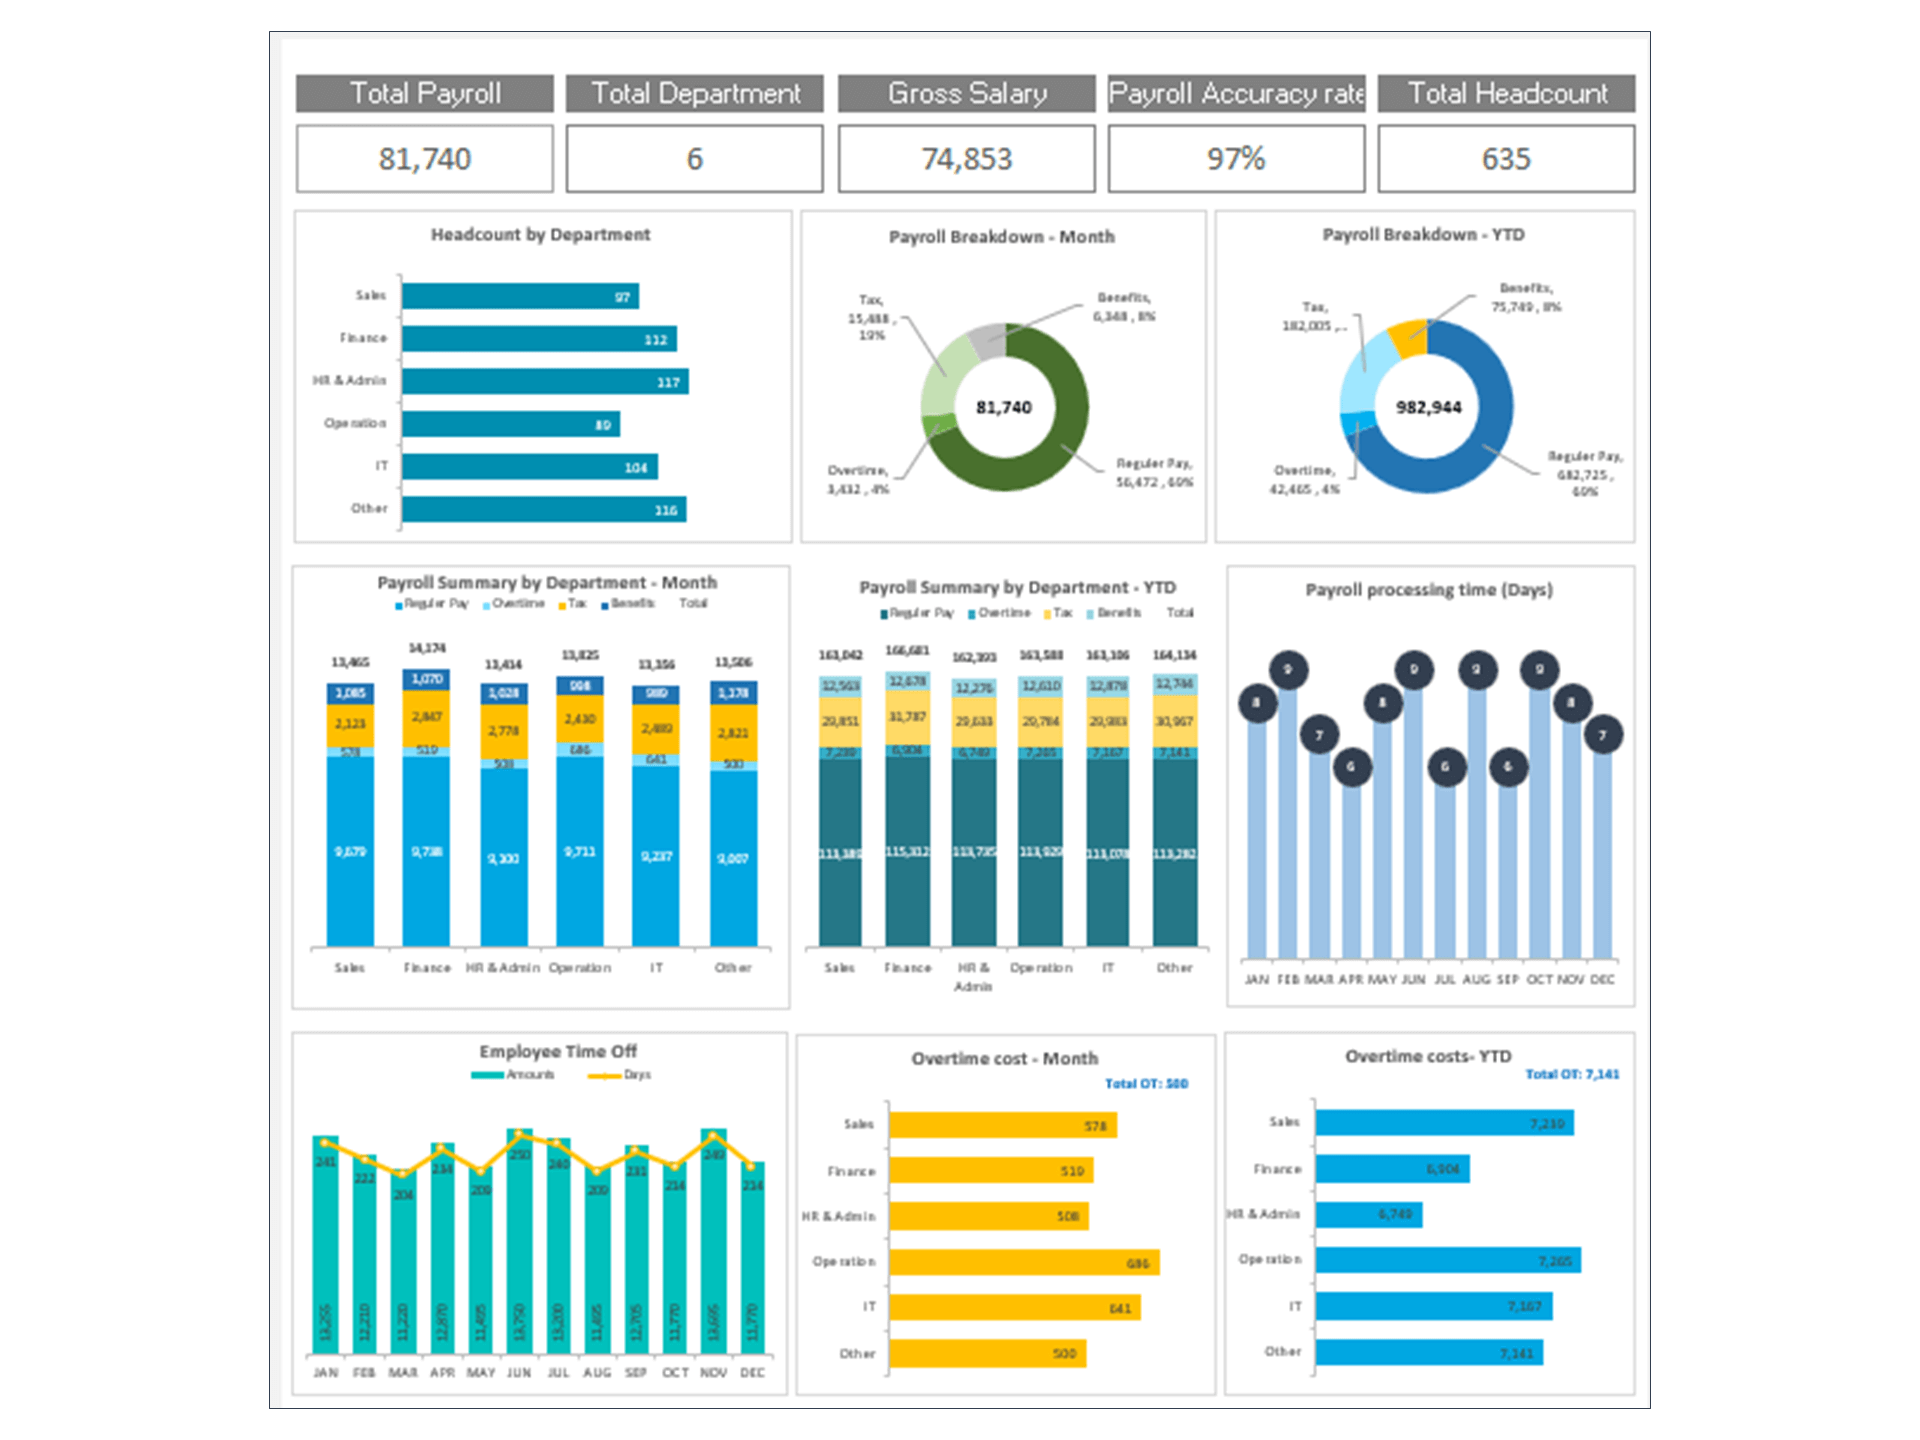
Organize all your data from salaries and payables to income, savings, profits, and more in one template. This will make calculations, record-keeping, and accounting significantly easier, and you may not require additional labor. We have dashboards for different executive levels, too, including managers, CEOs, and CFOs, with varying indicators included in each.
Our professionally designed financial dashboards are meant to make things easier for businesses and individuals alike, so they are simple to use, may have customizable features, and come in various designs that you can choose from.


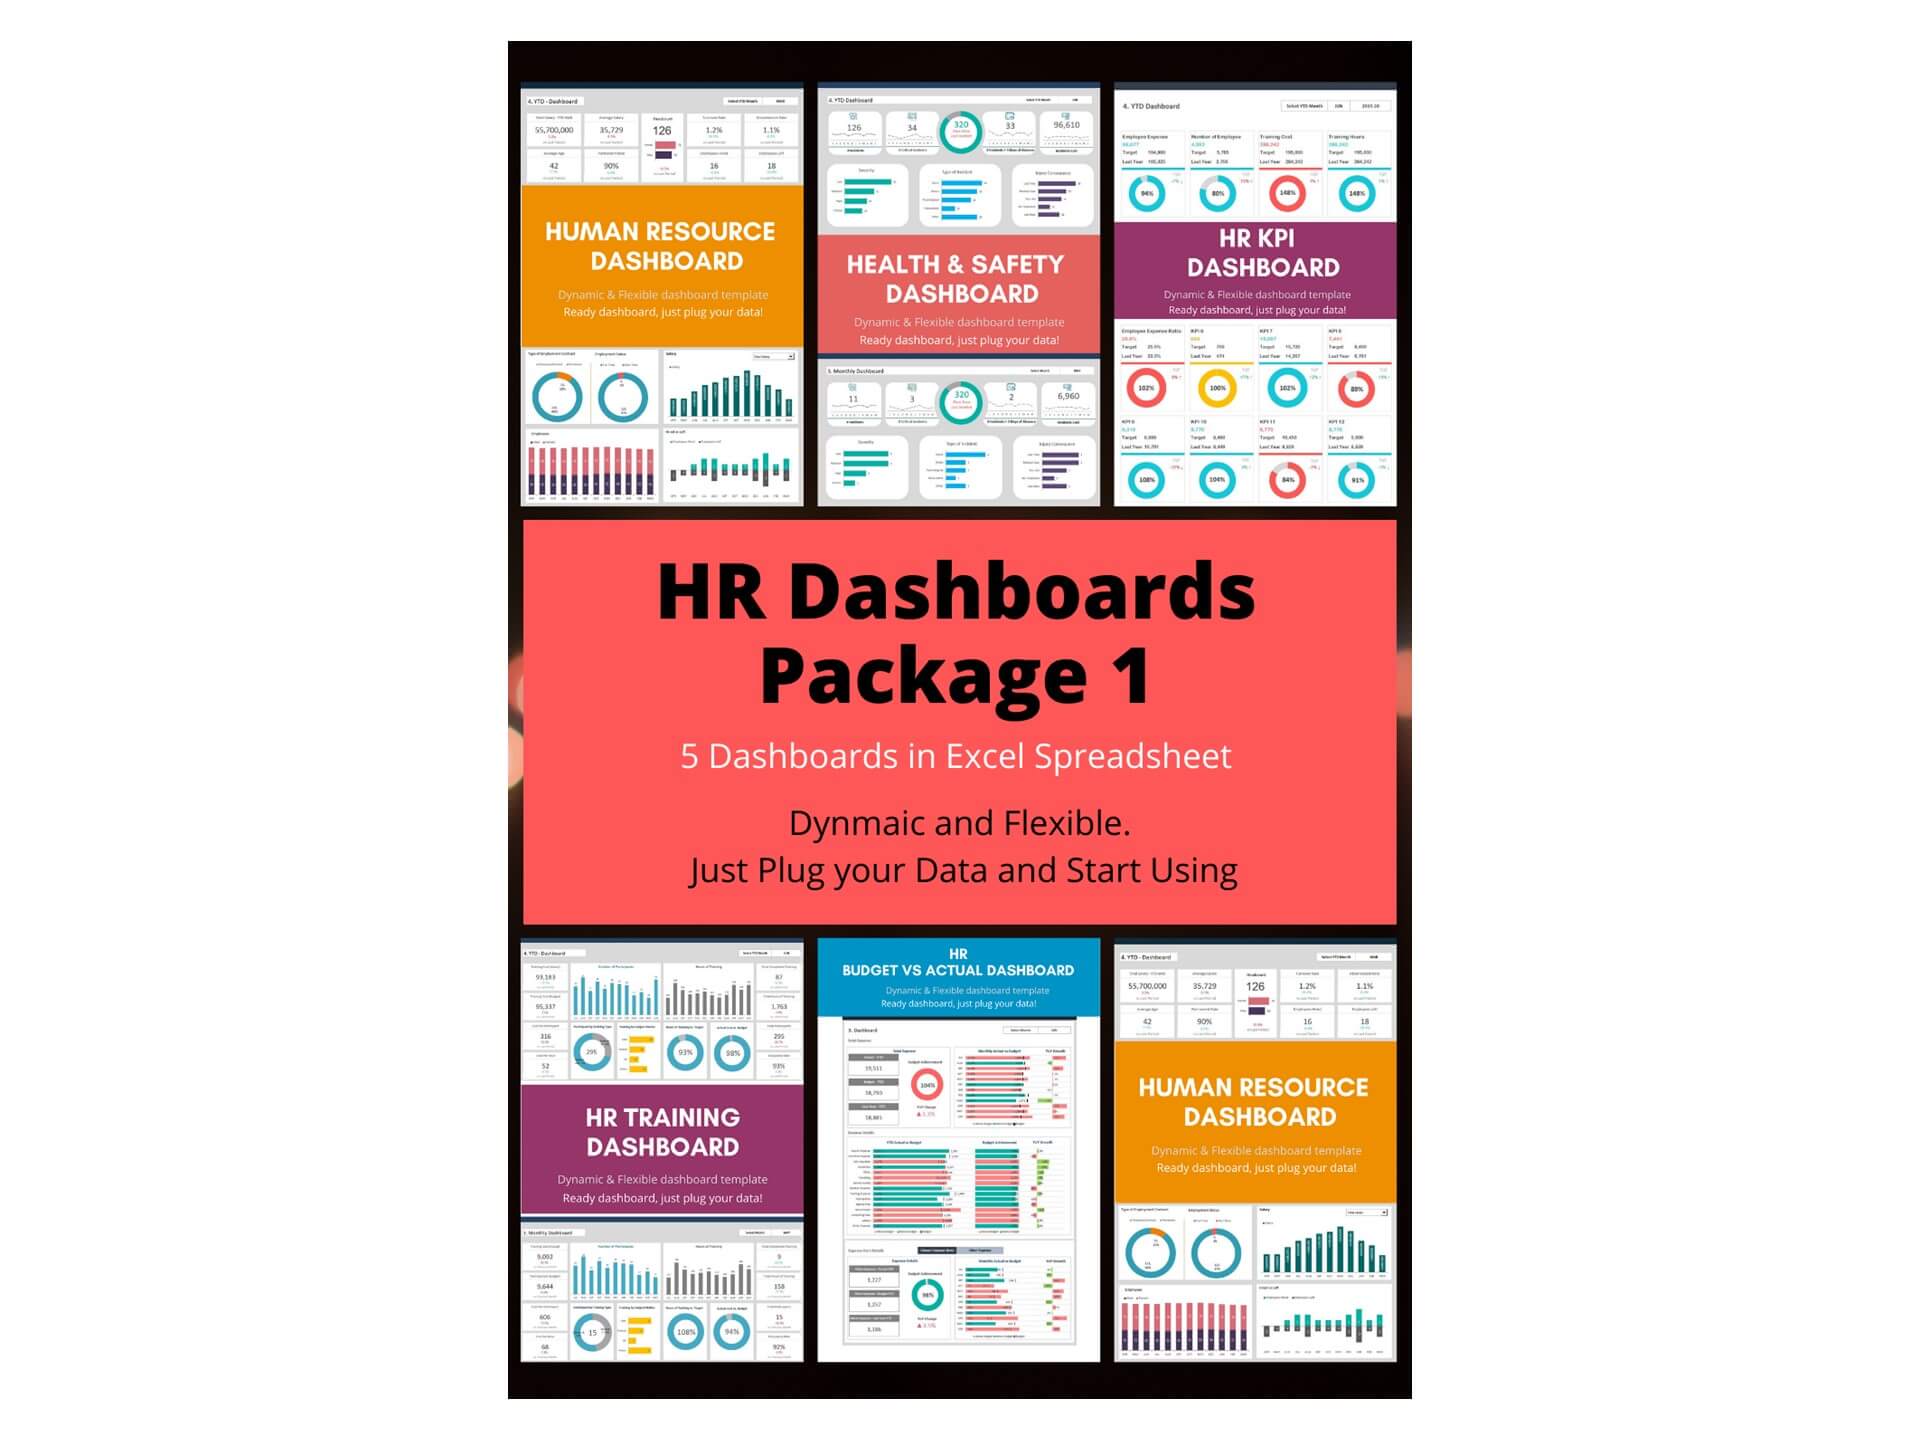
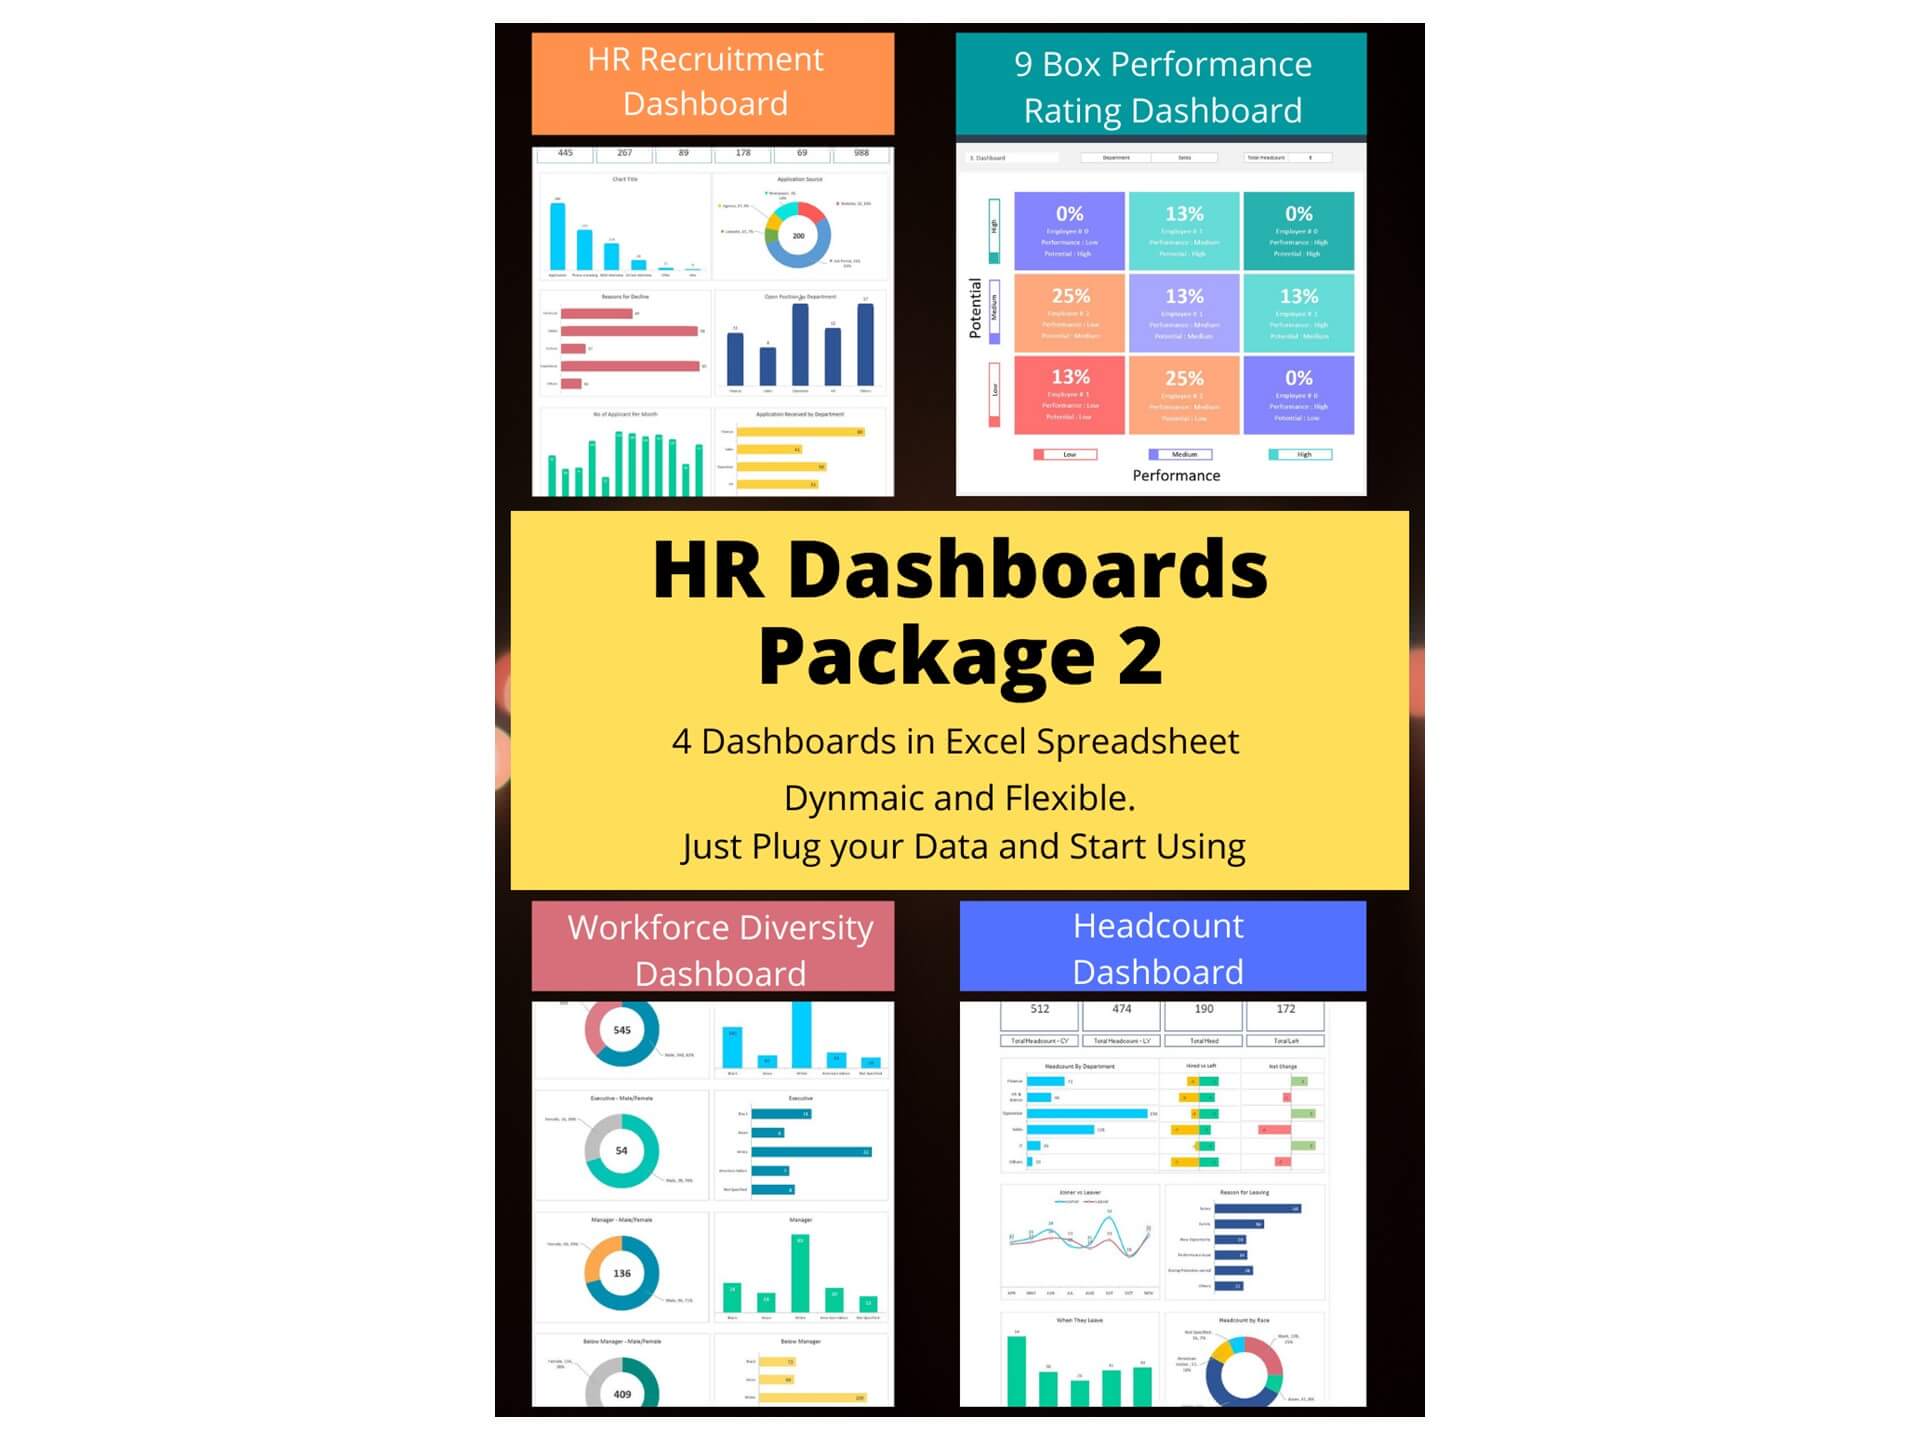
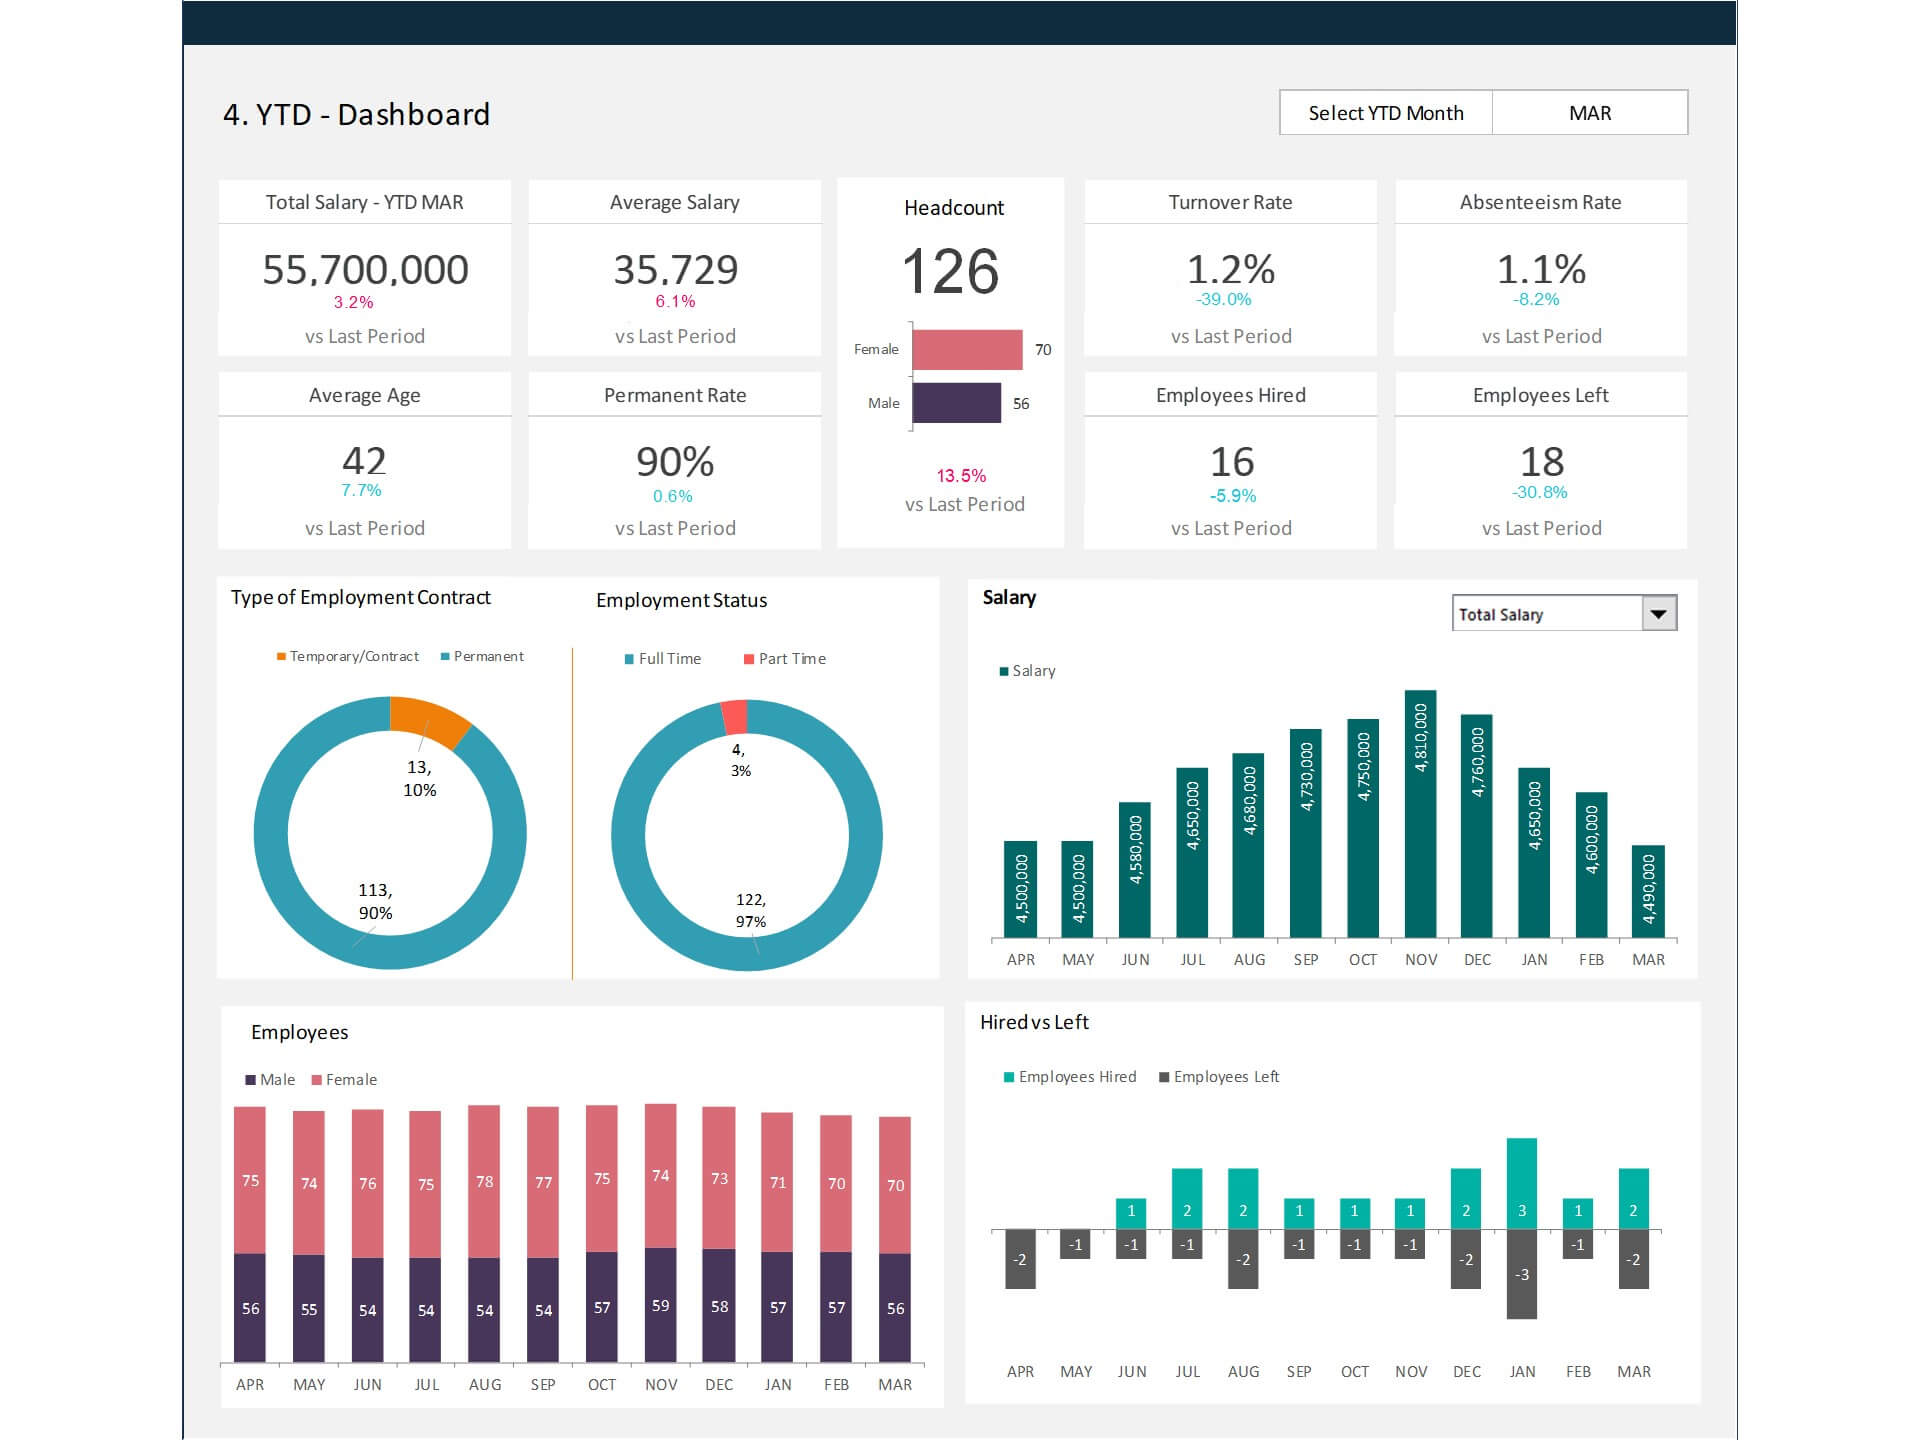
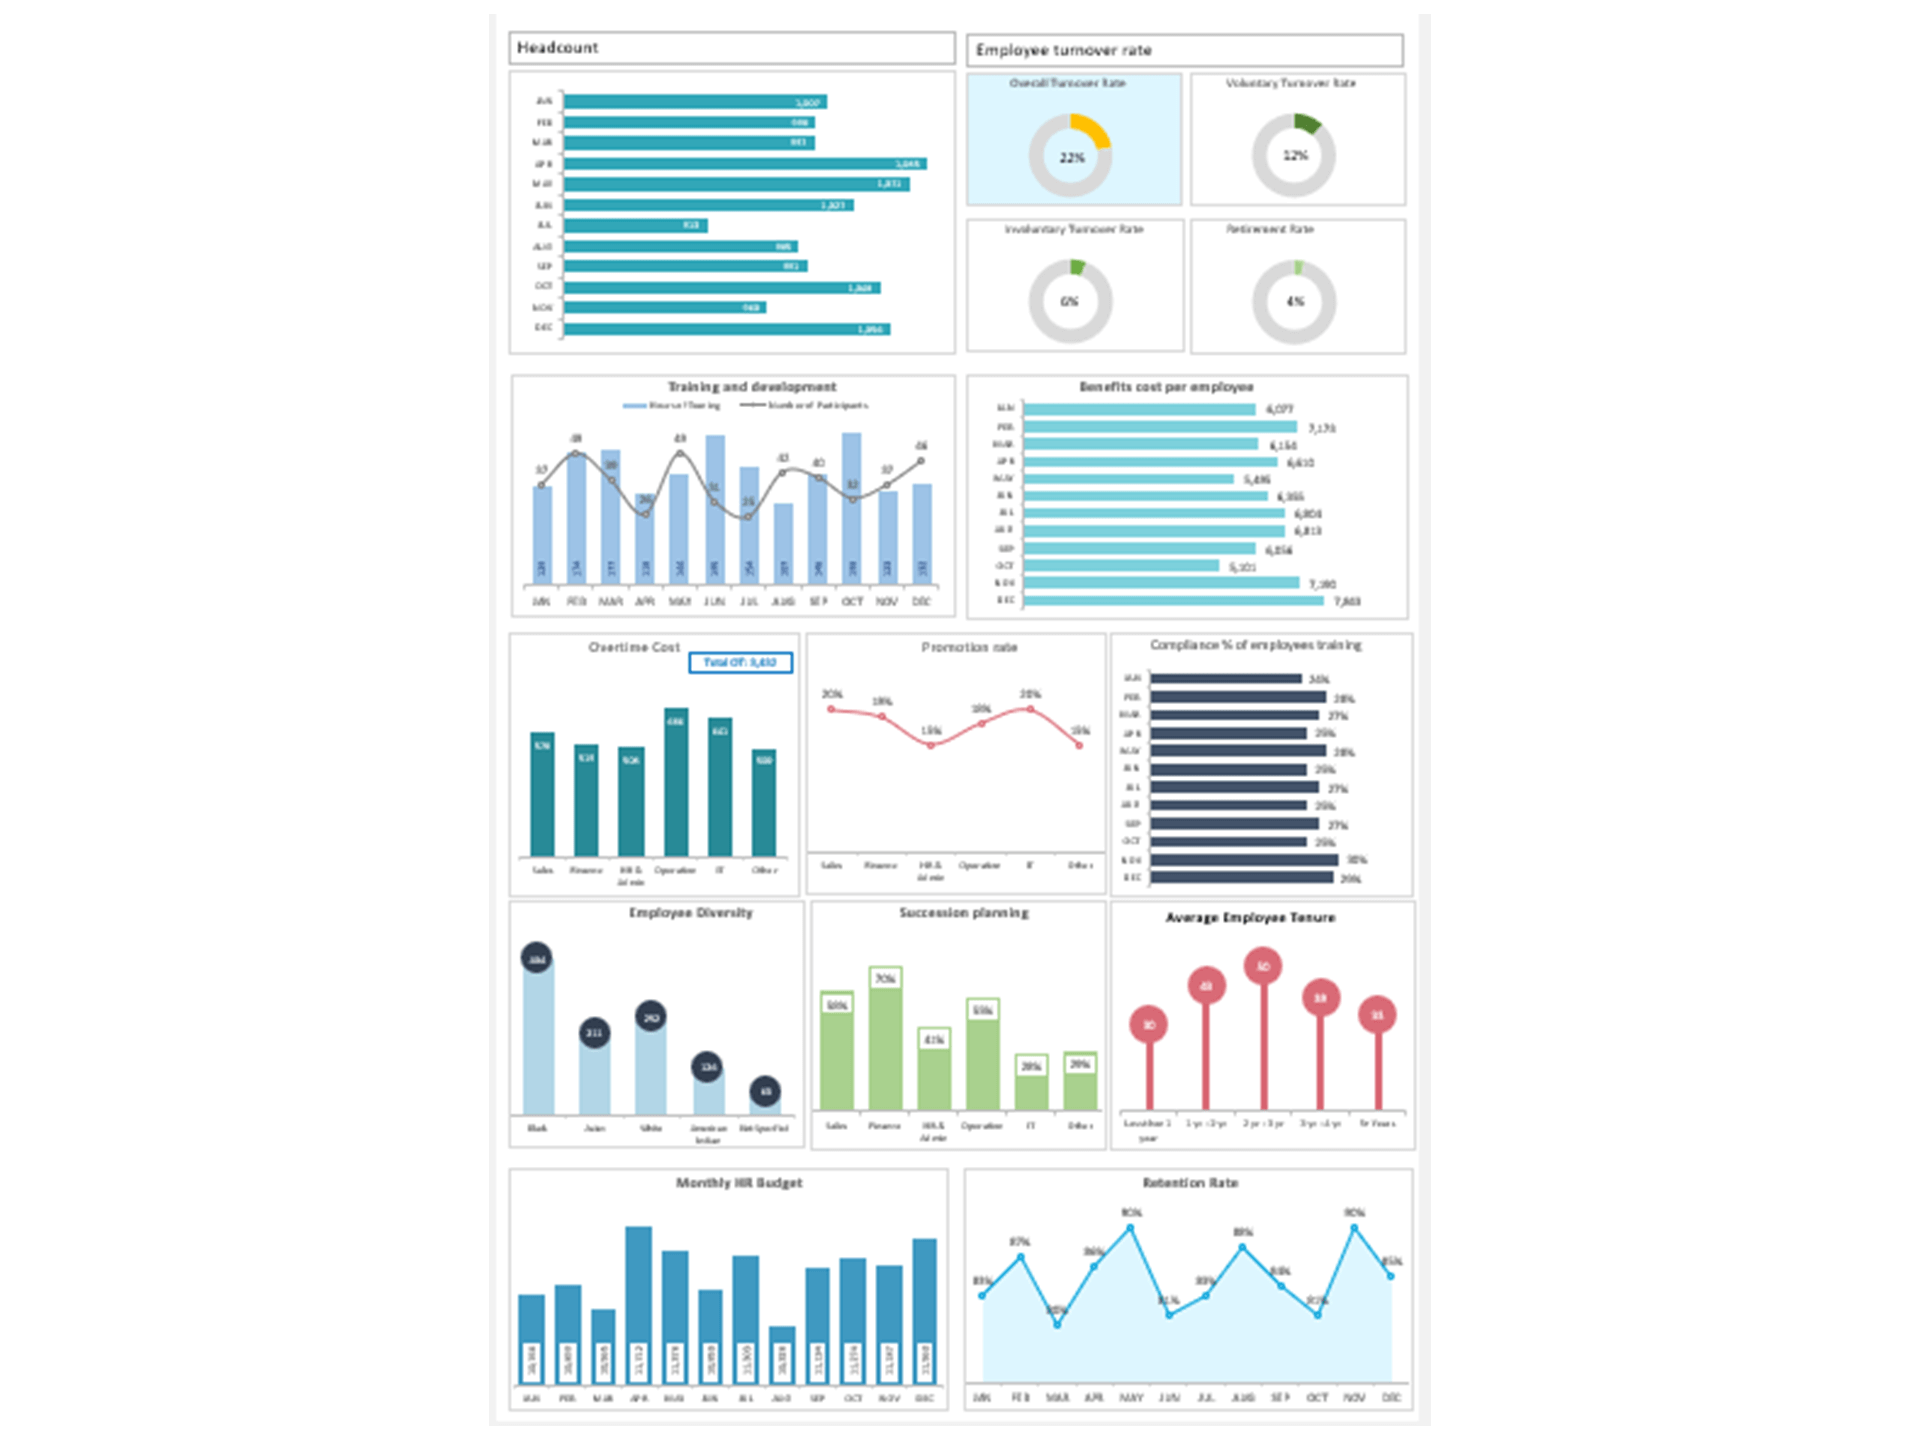
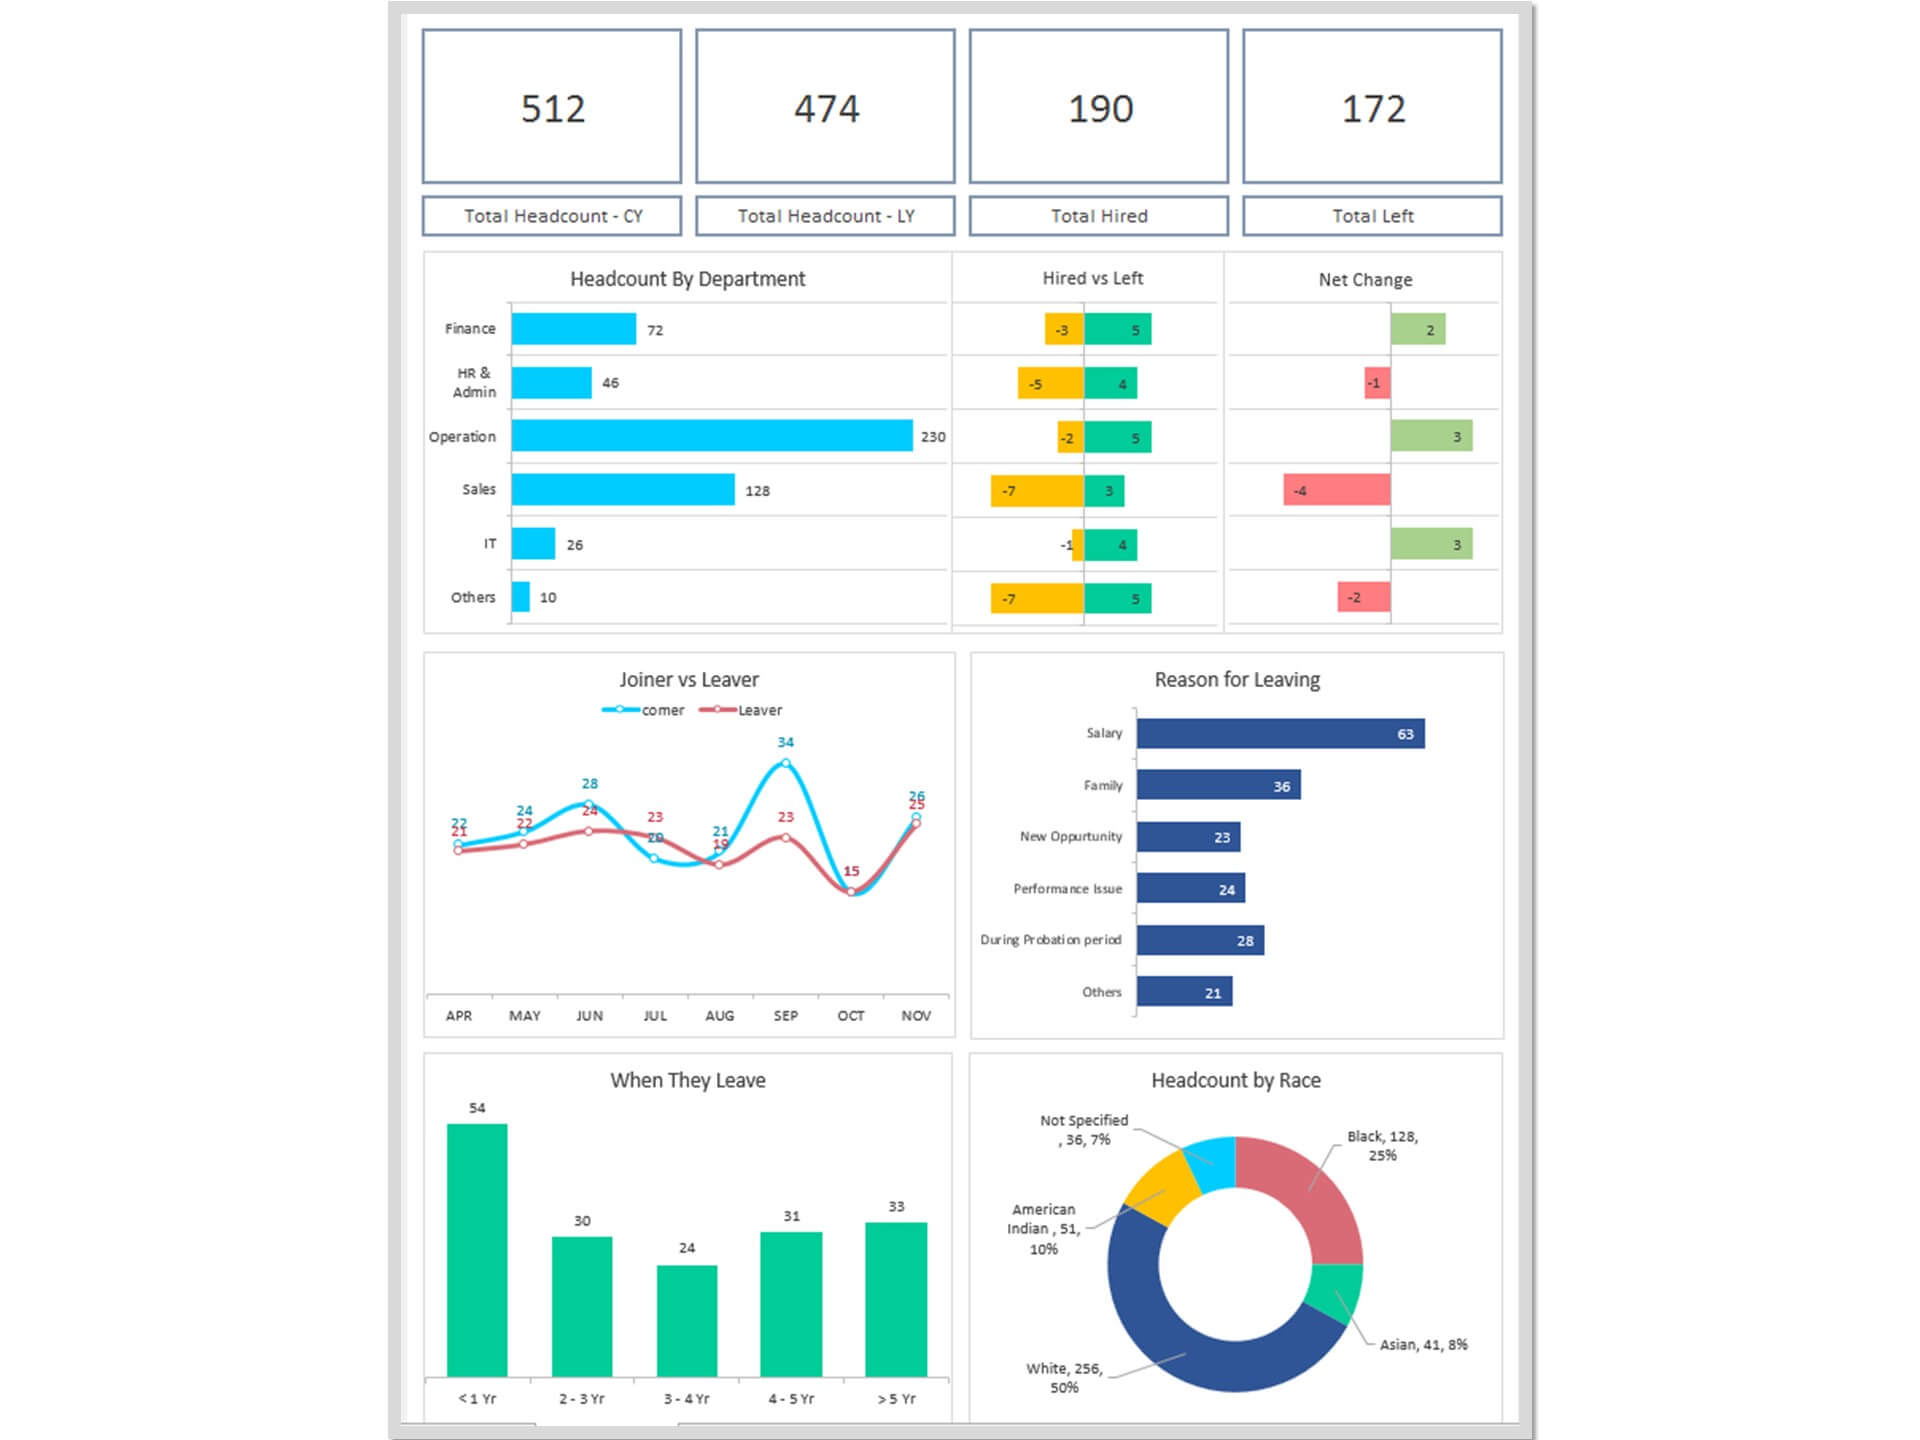
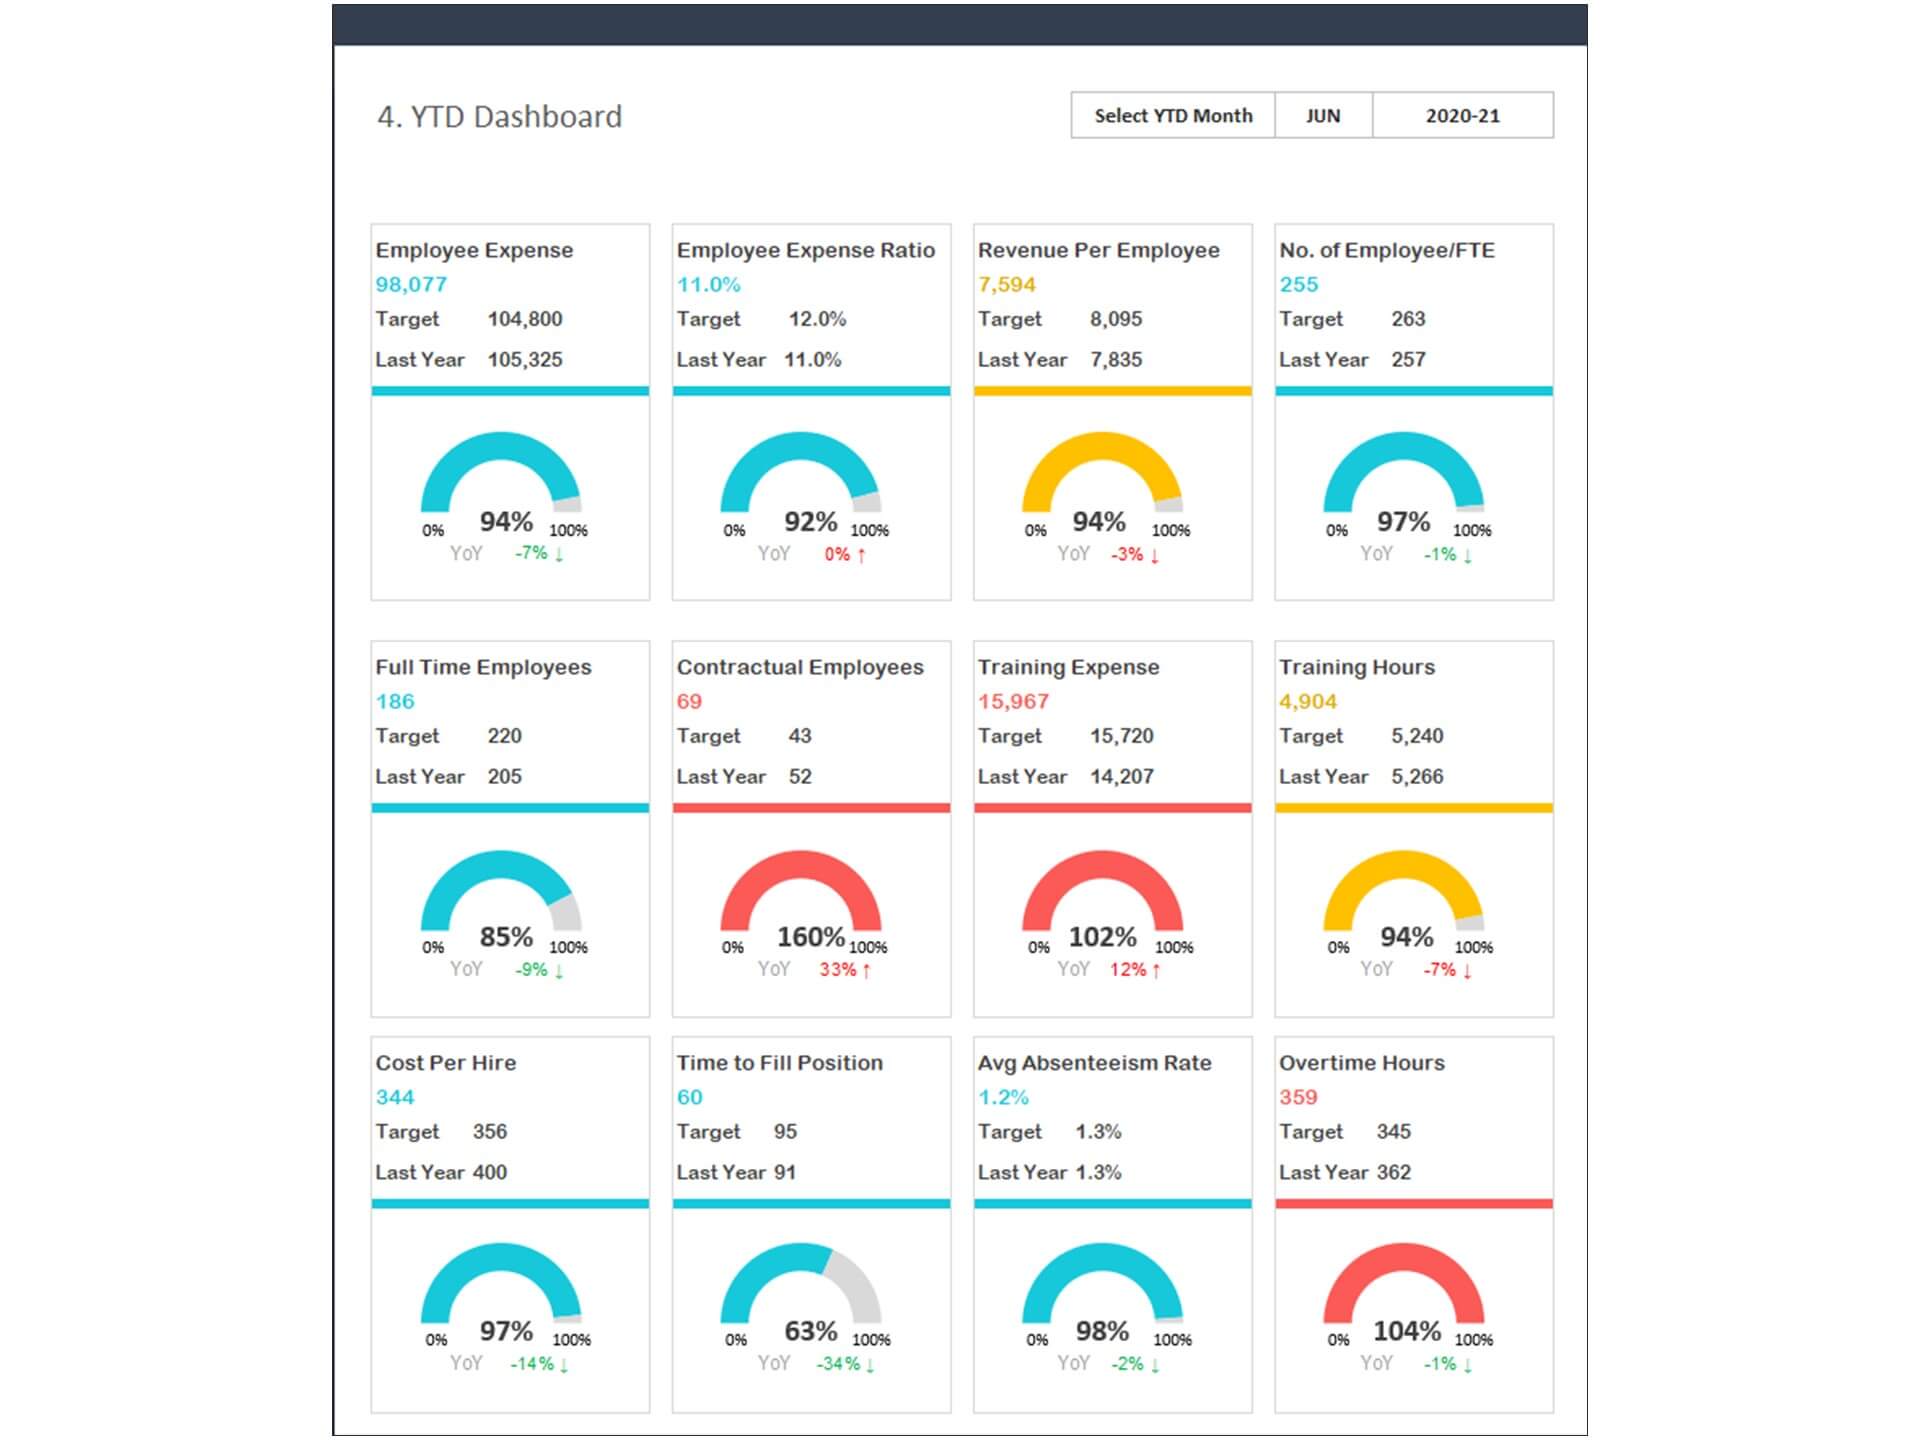
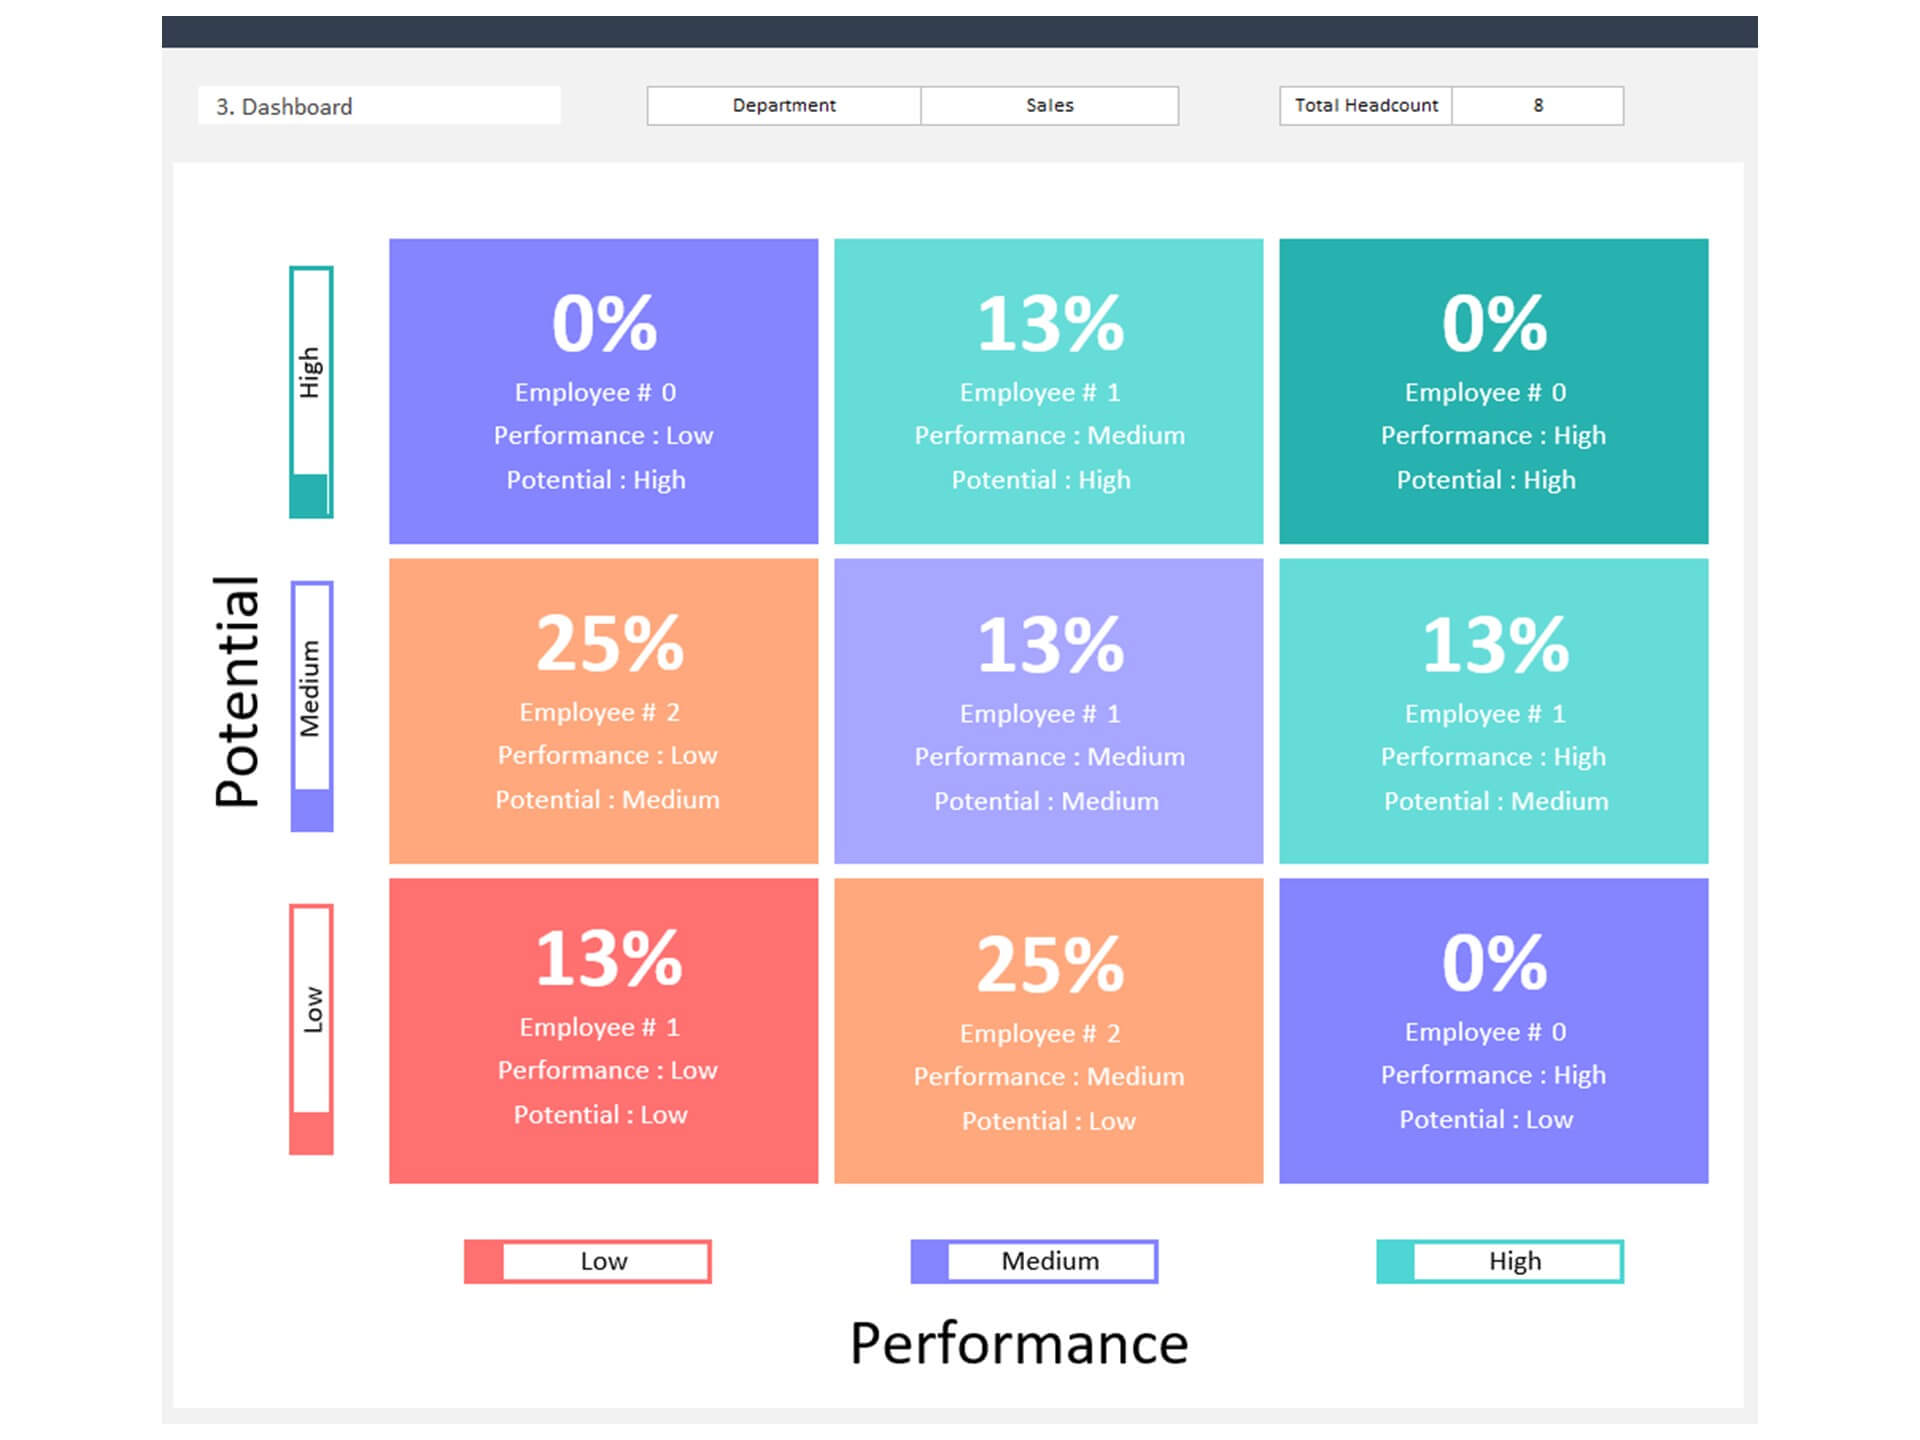
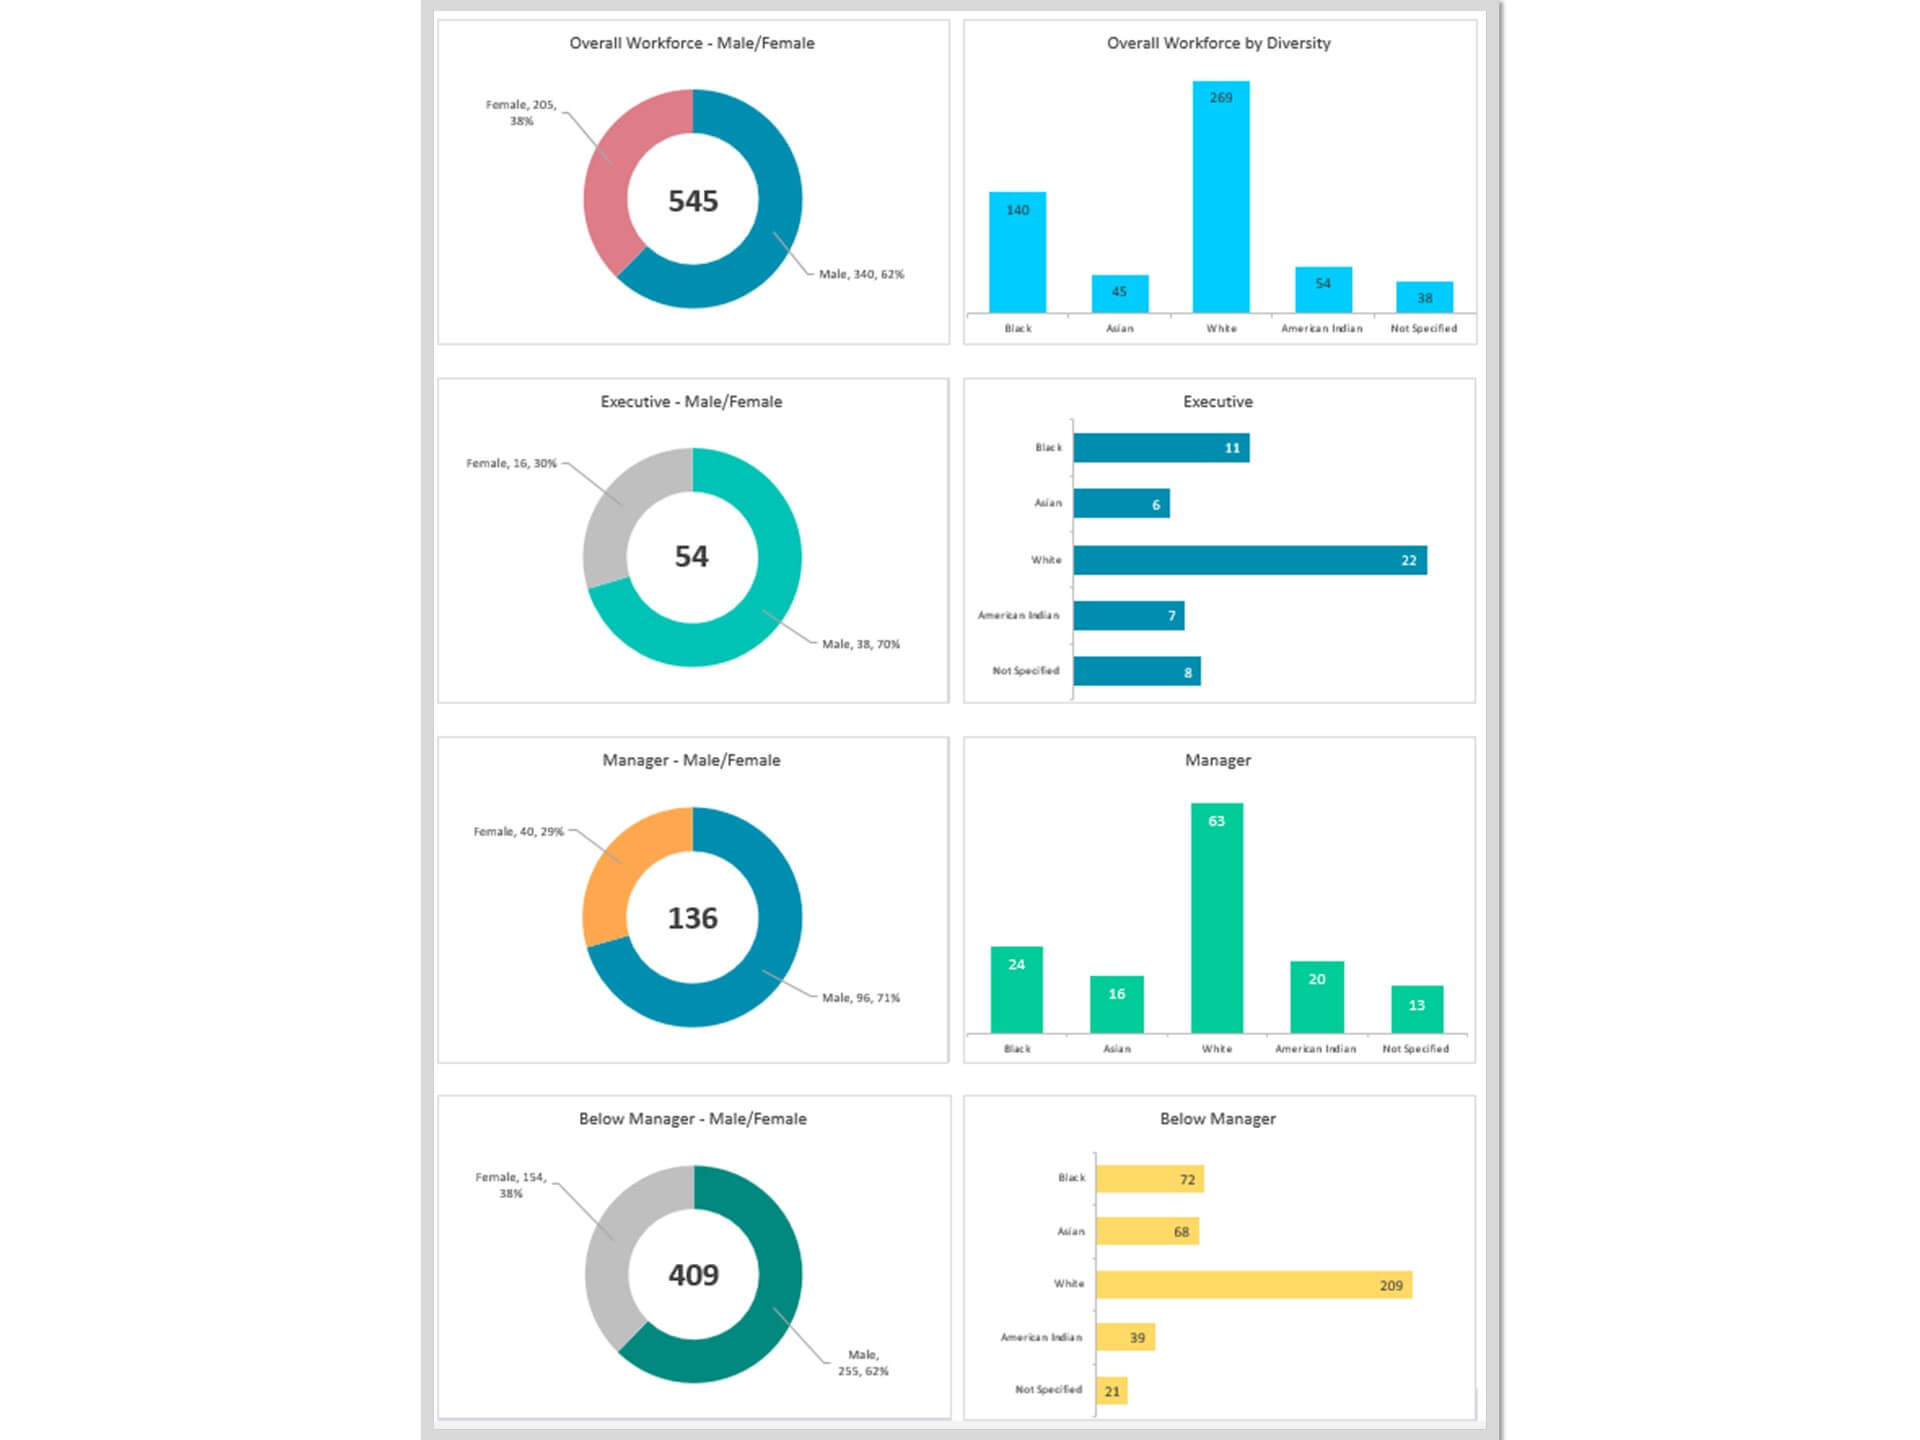
For many small and mid-sized businesses and larger organizations, managing human resources (HR) is difficult. Departments are small, resources are limited, and there is a lot of information to keep track of.
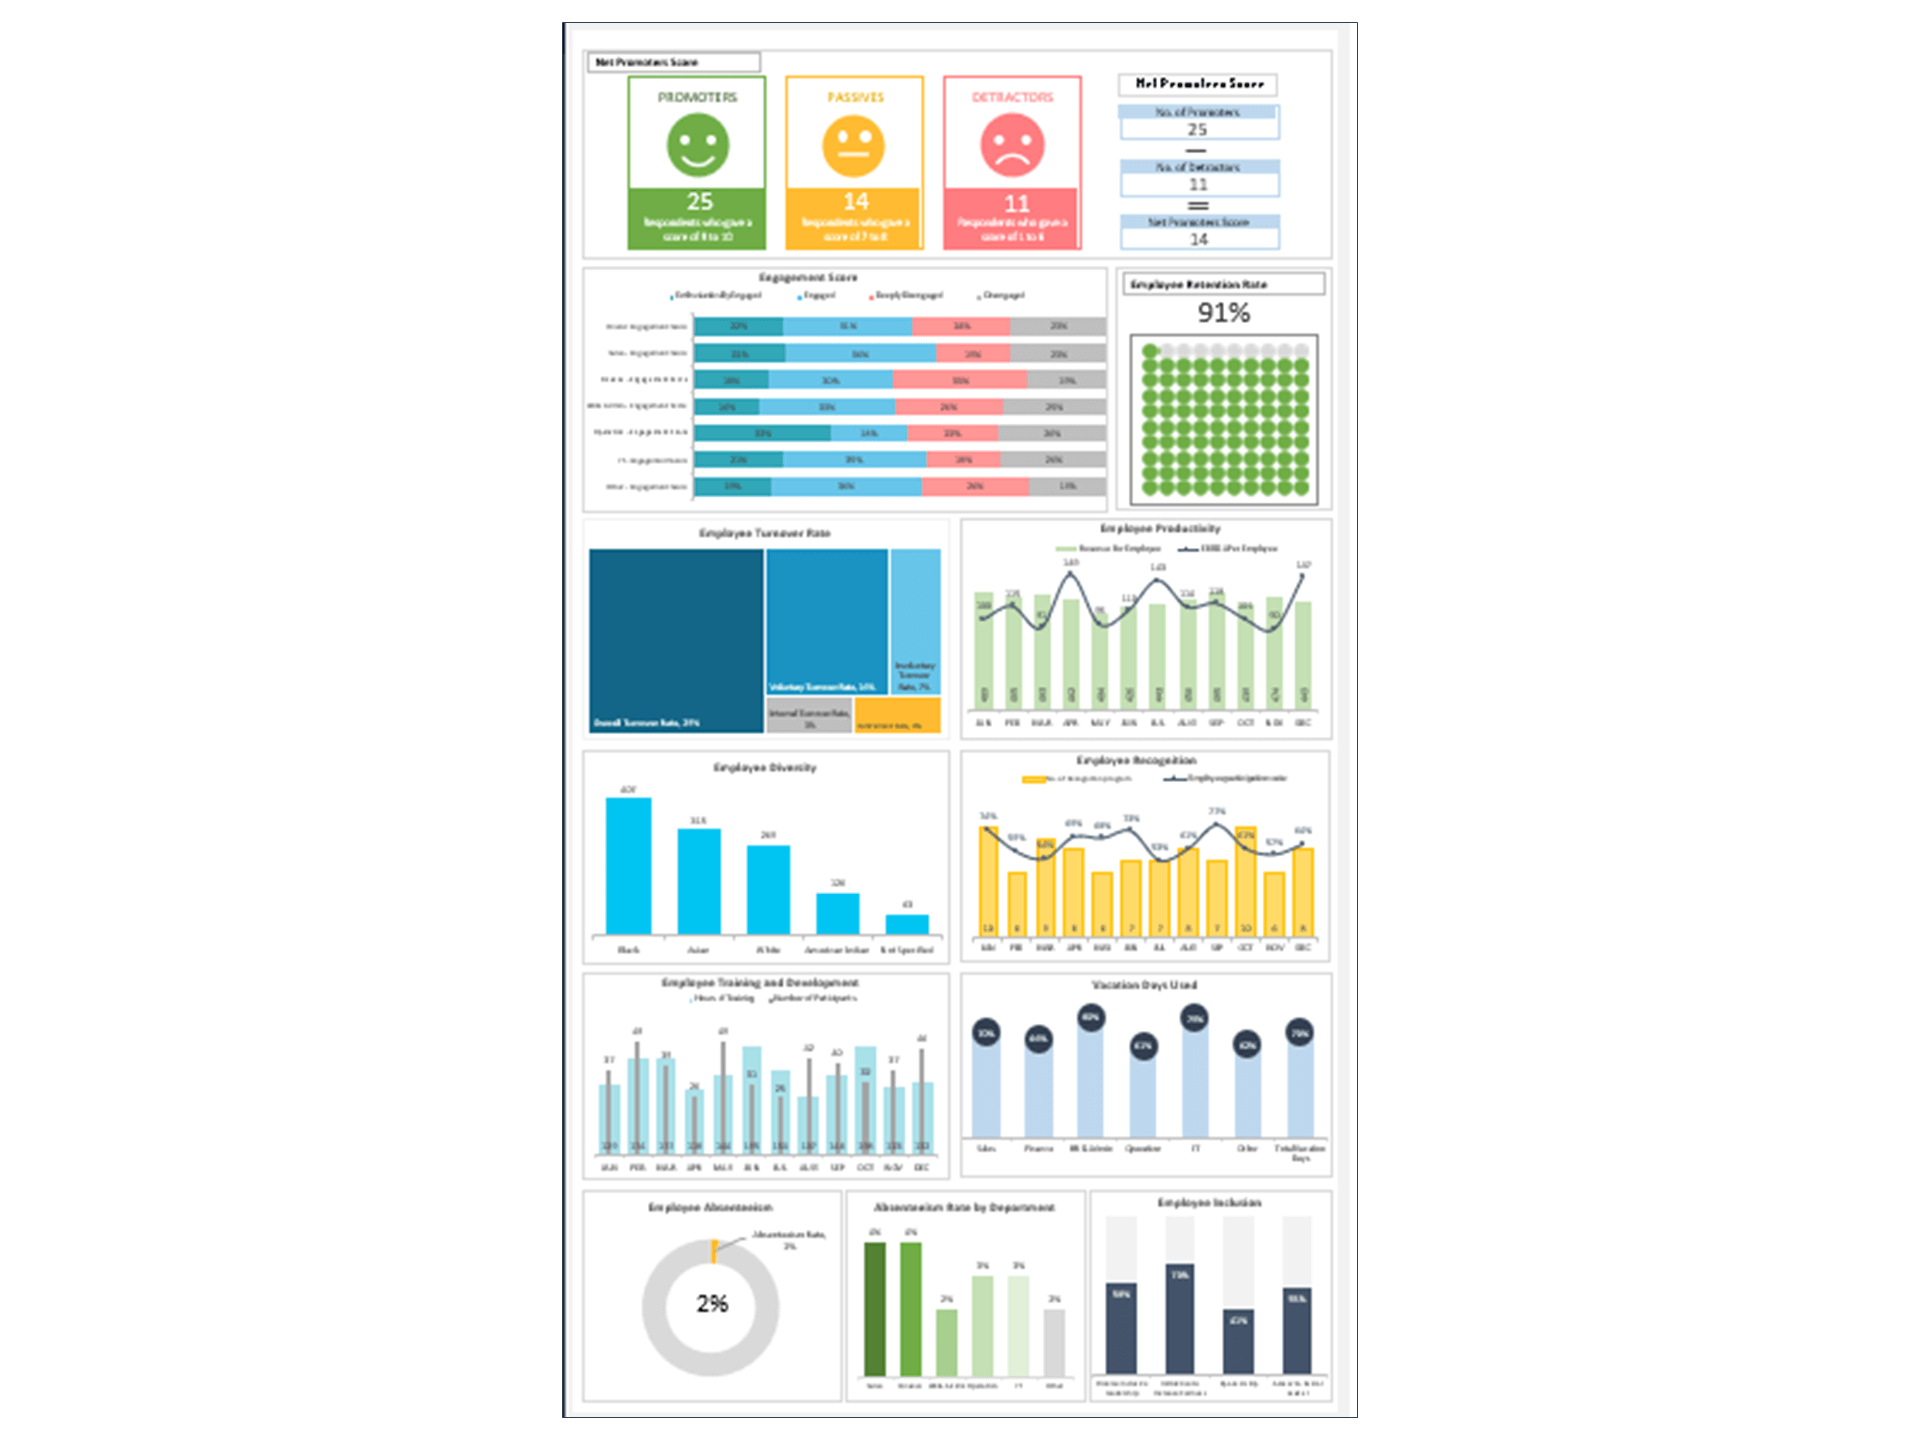
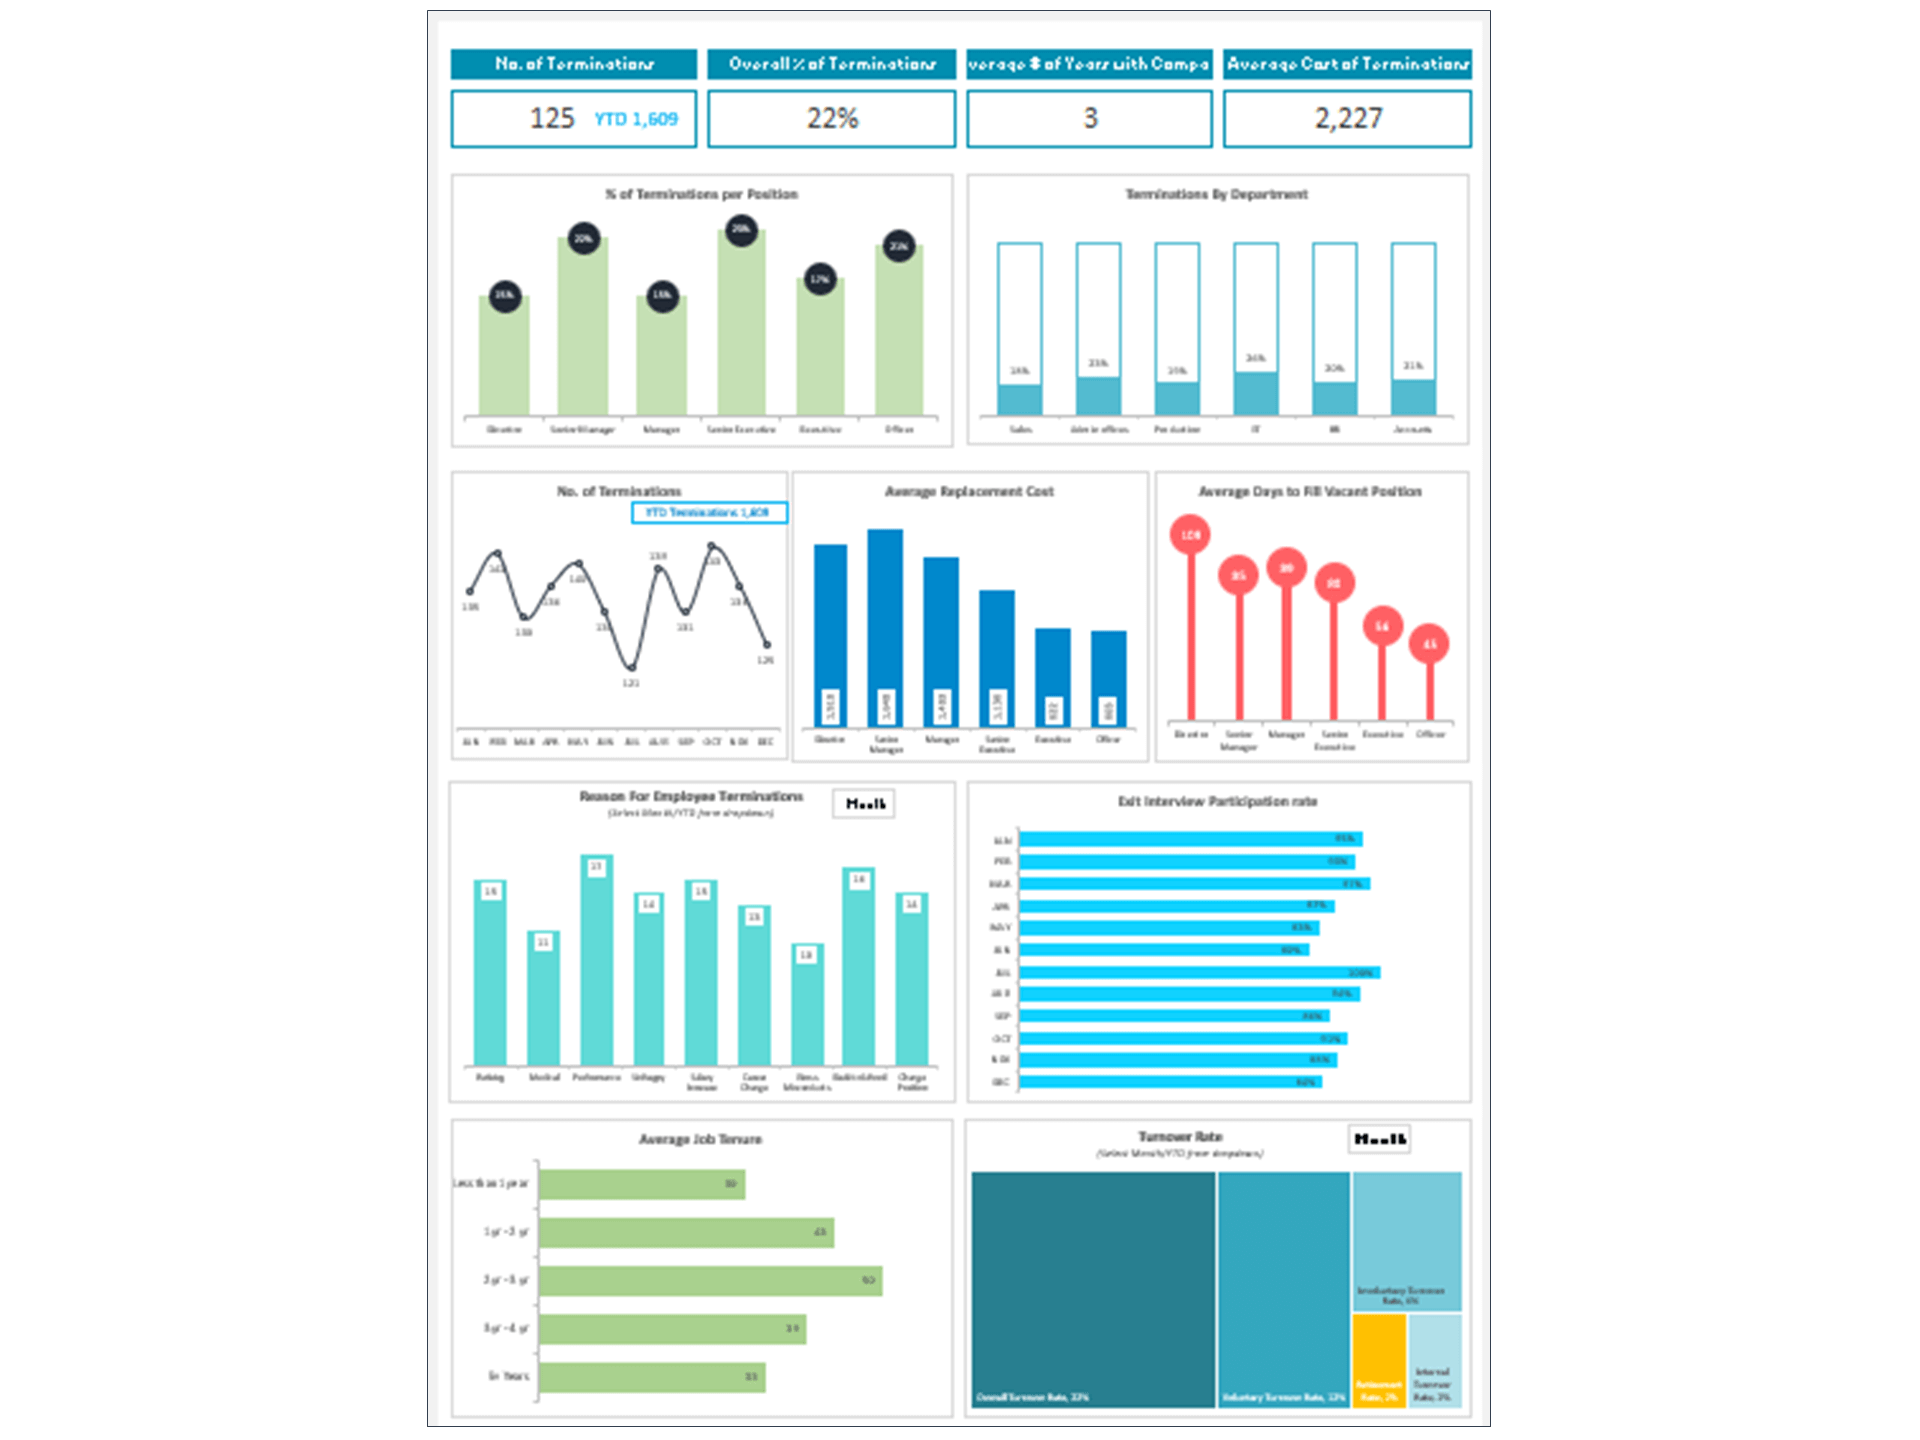
From training and onboarding to orientations, resource compilation, policies, salary disbursements, and issues, the volume of information and data is almost too much to keep organized. This is why you need to invest in our professionally designed HR dashboards that will make HR processes faster, smoother, and more consistent.
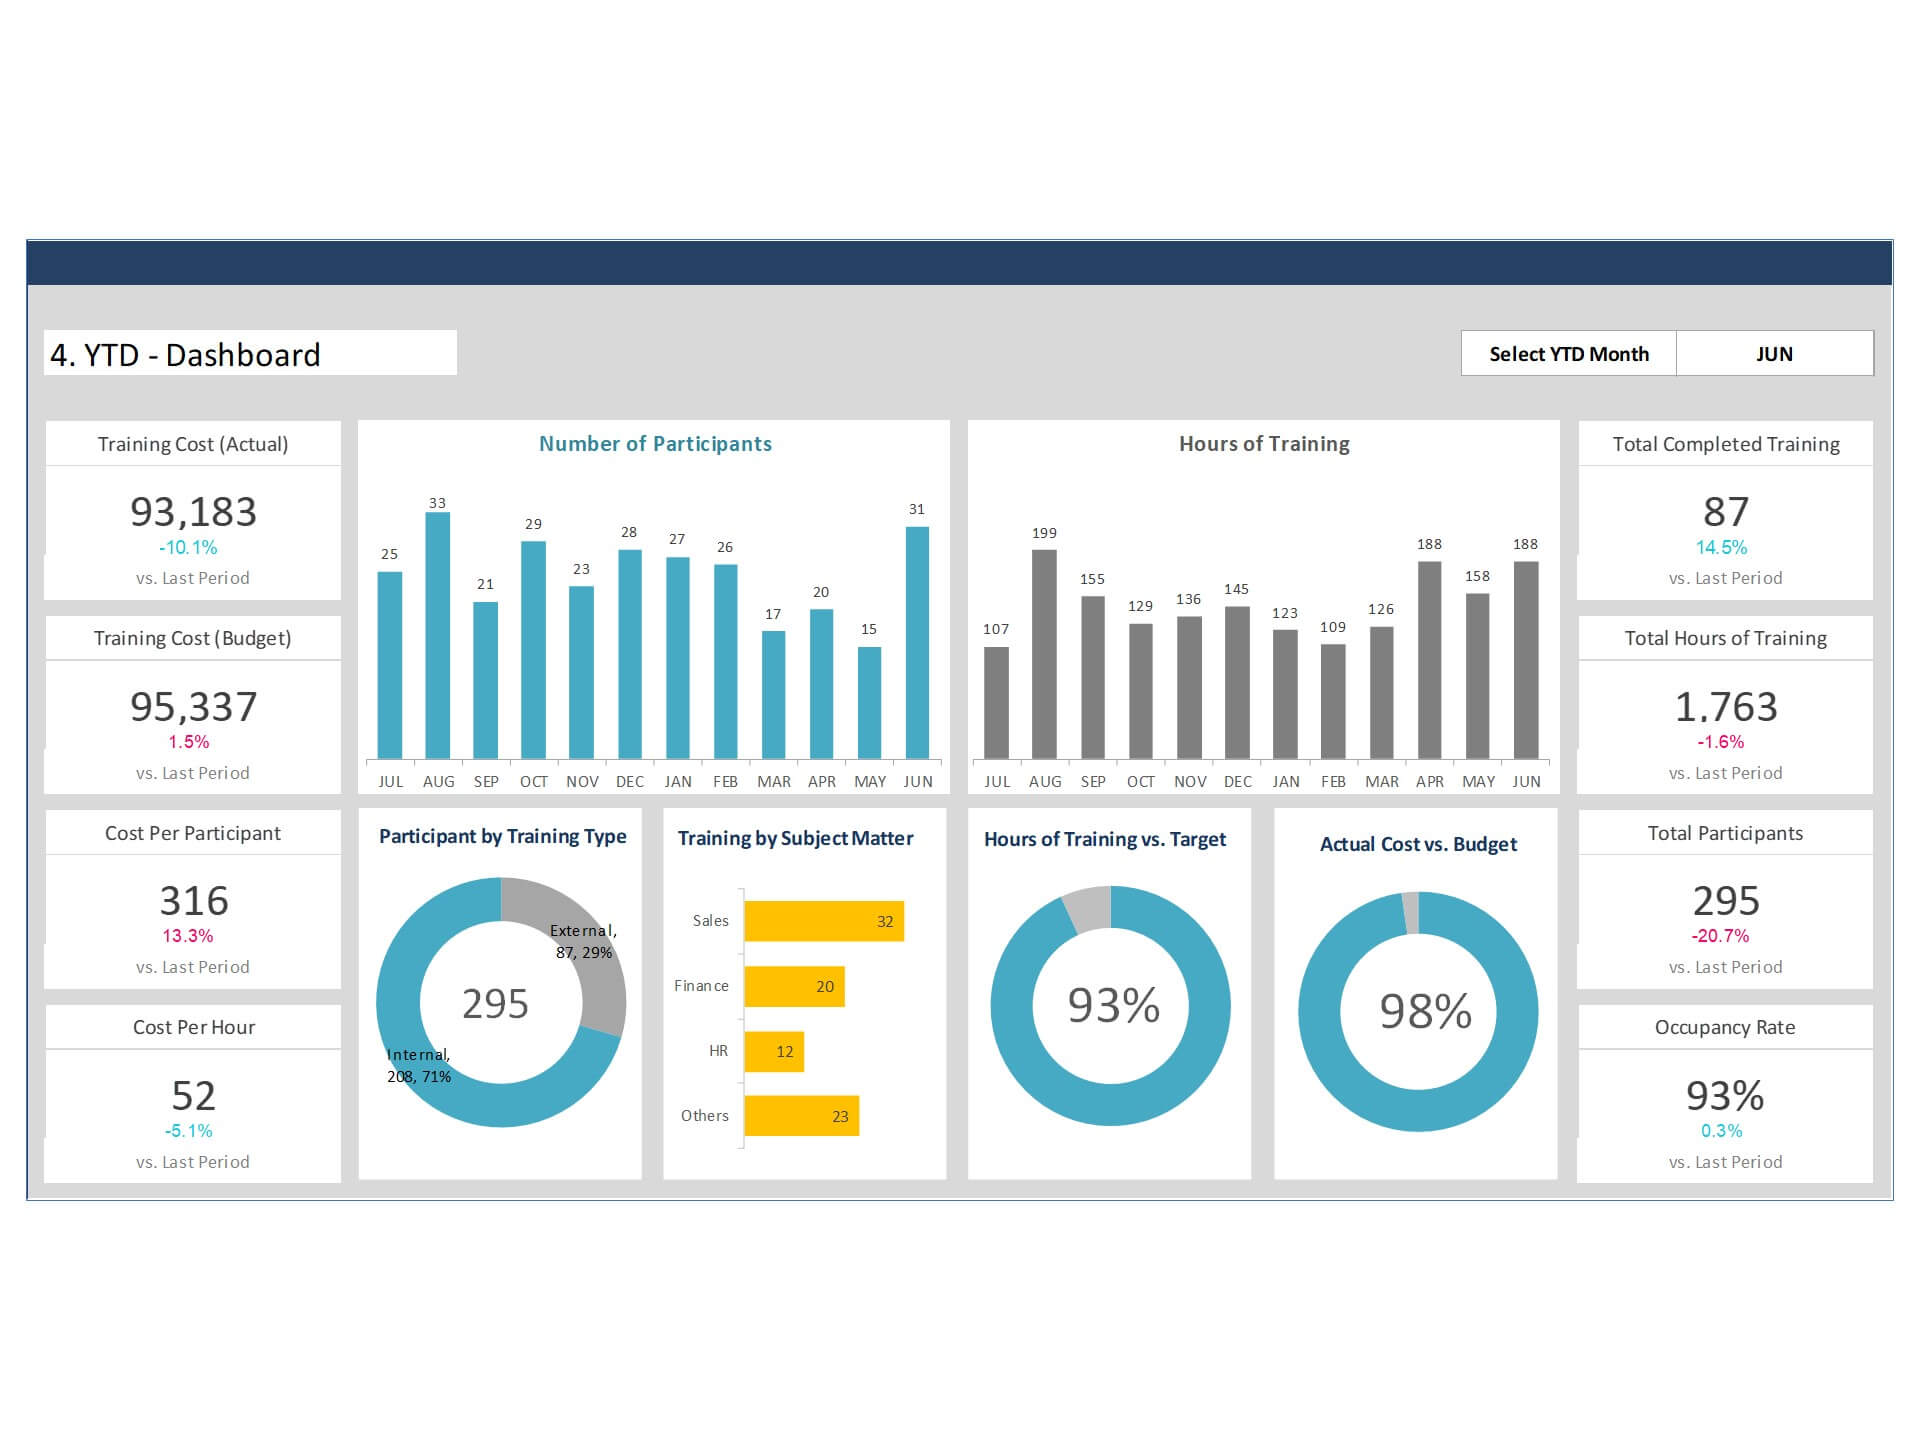
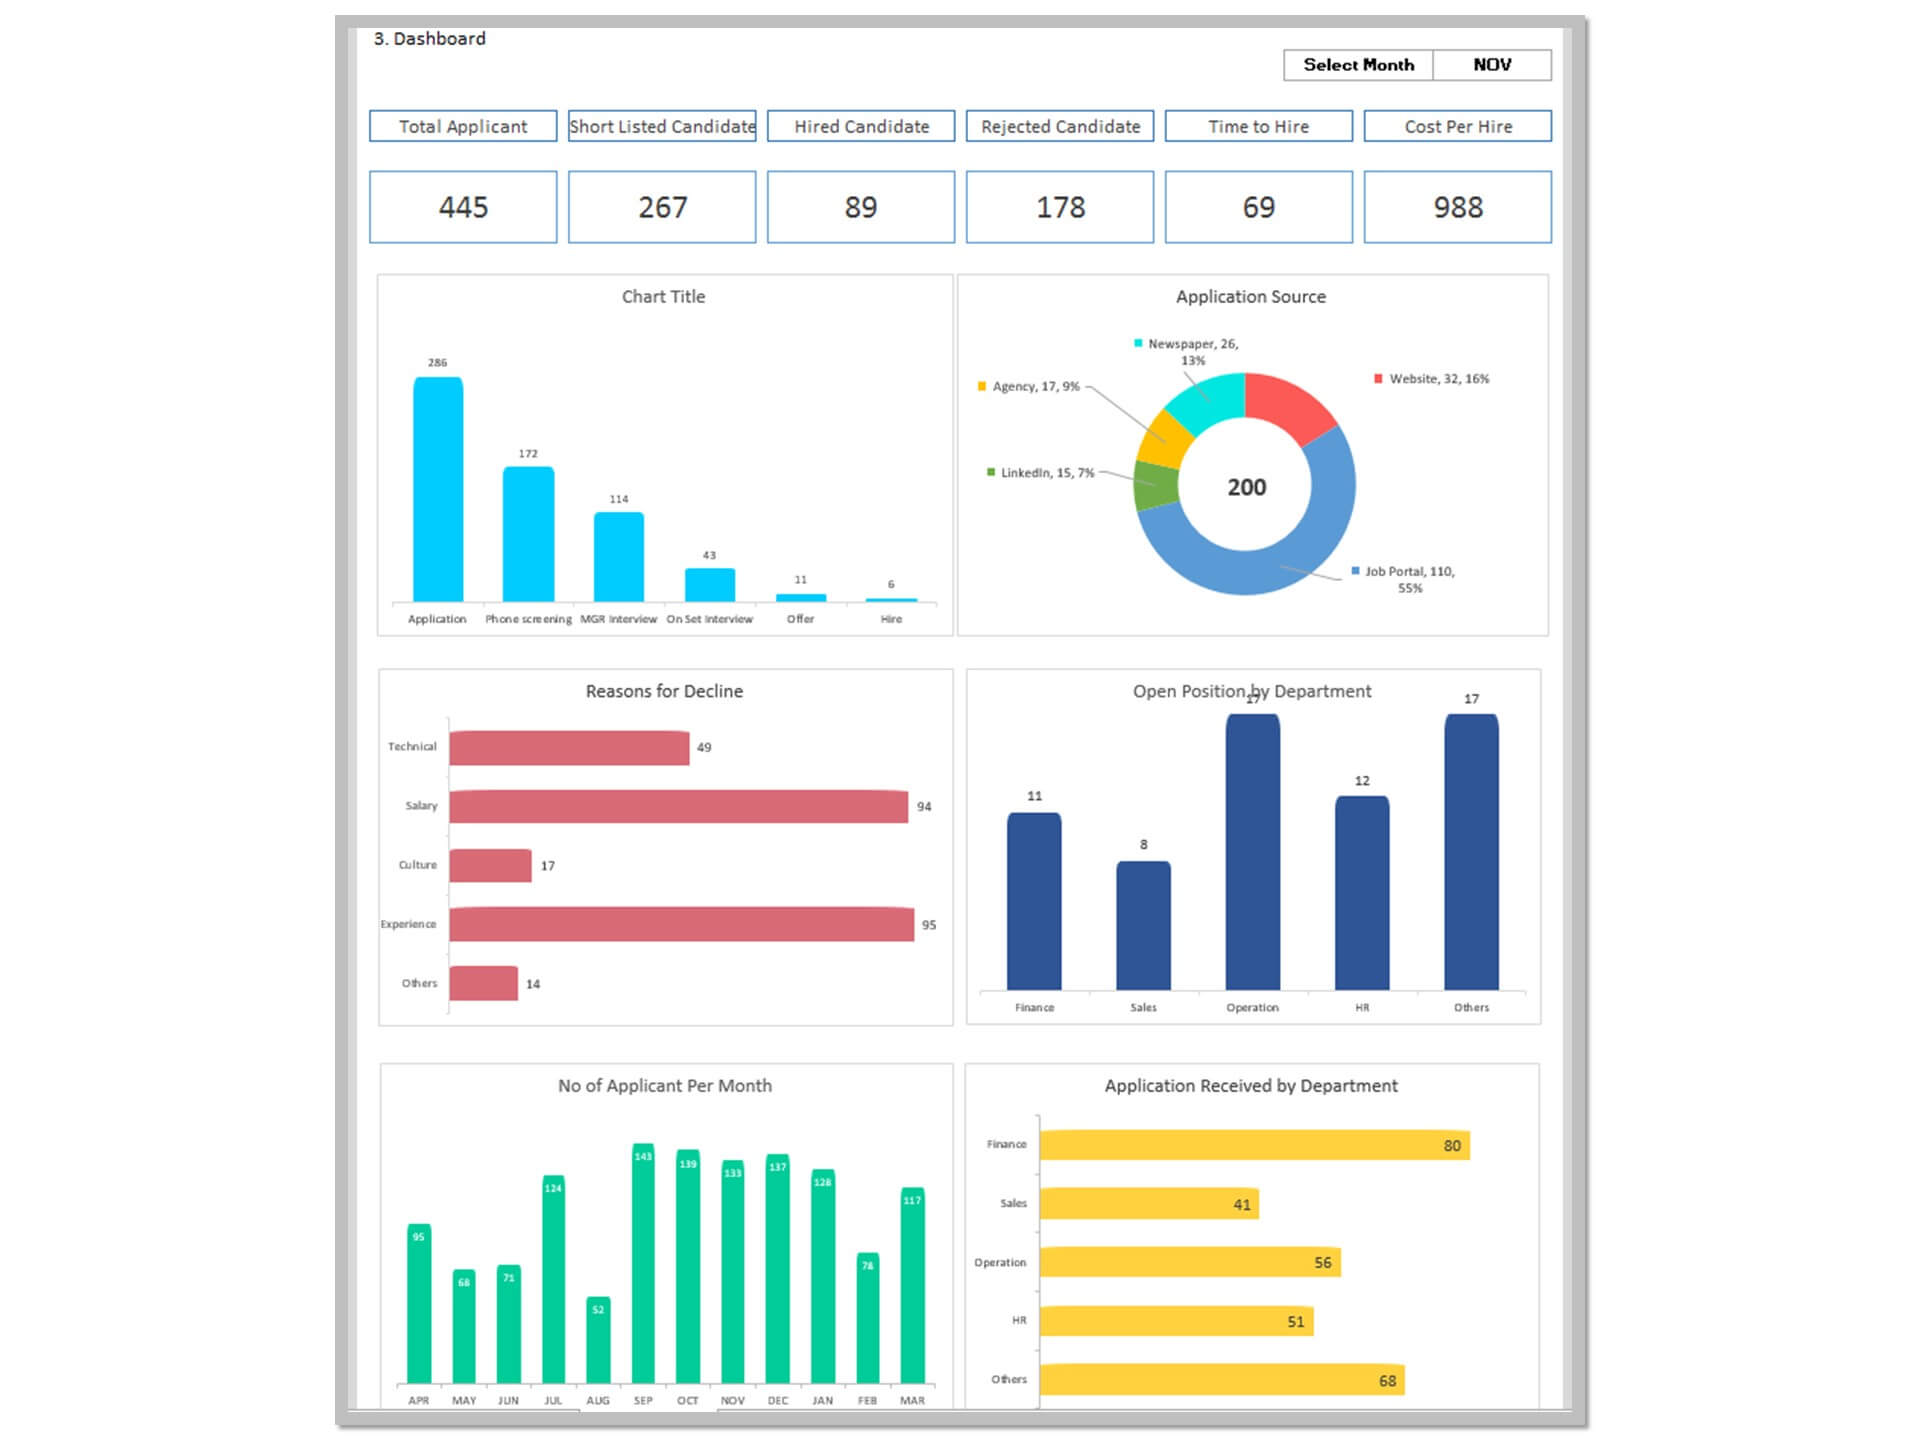
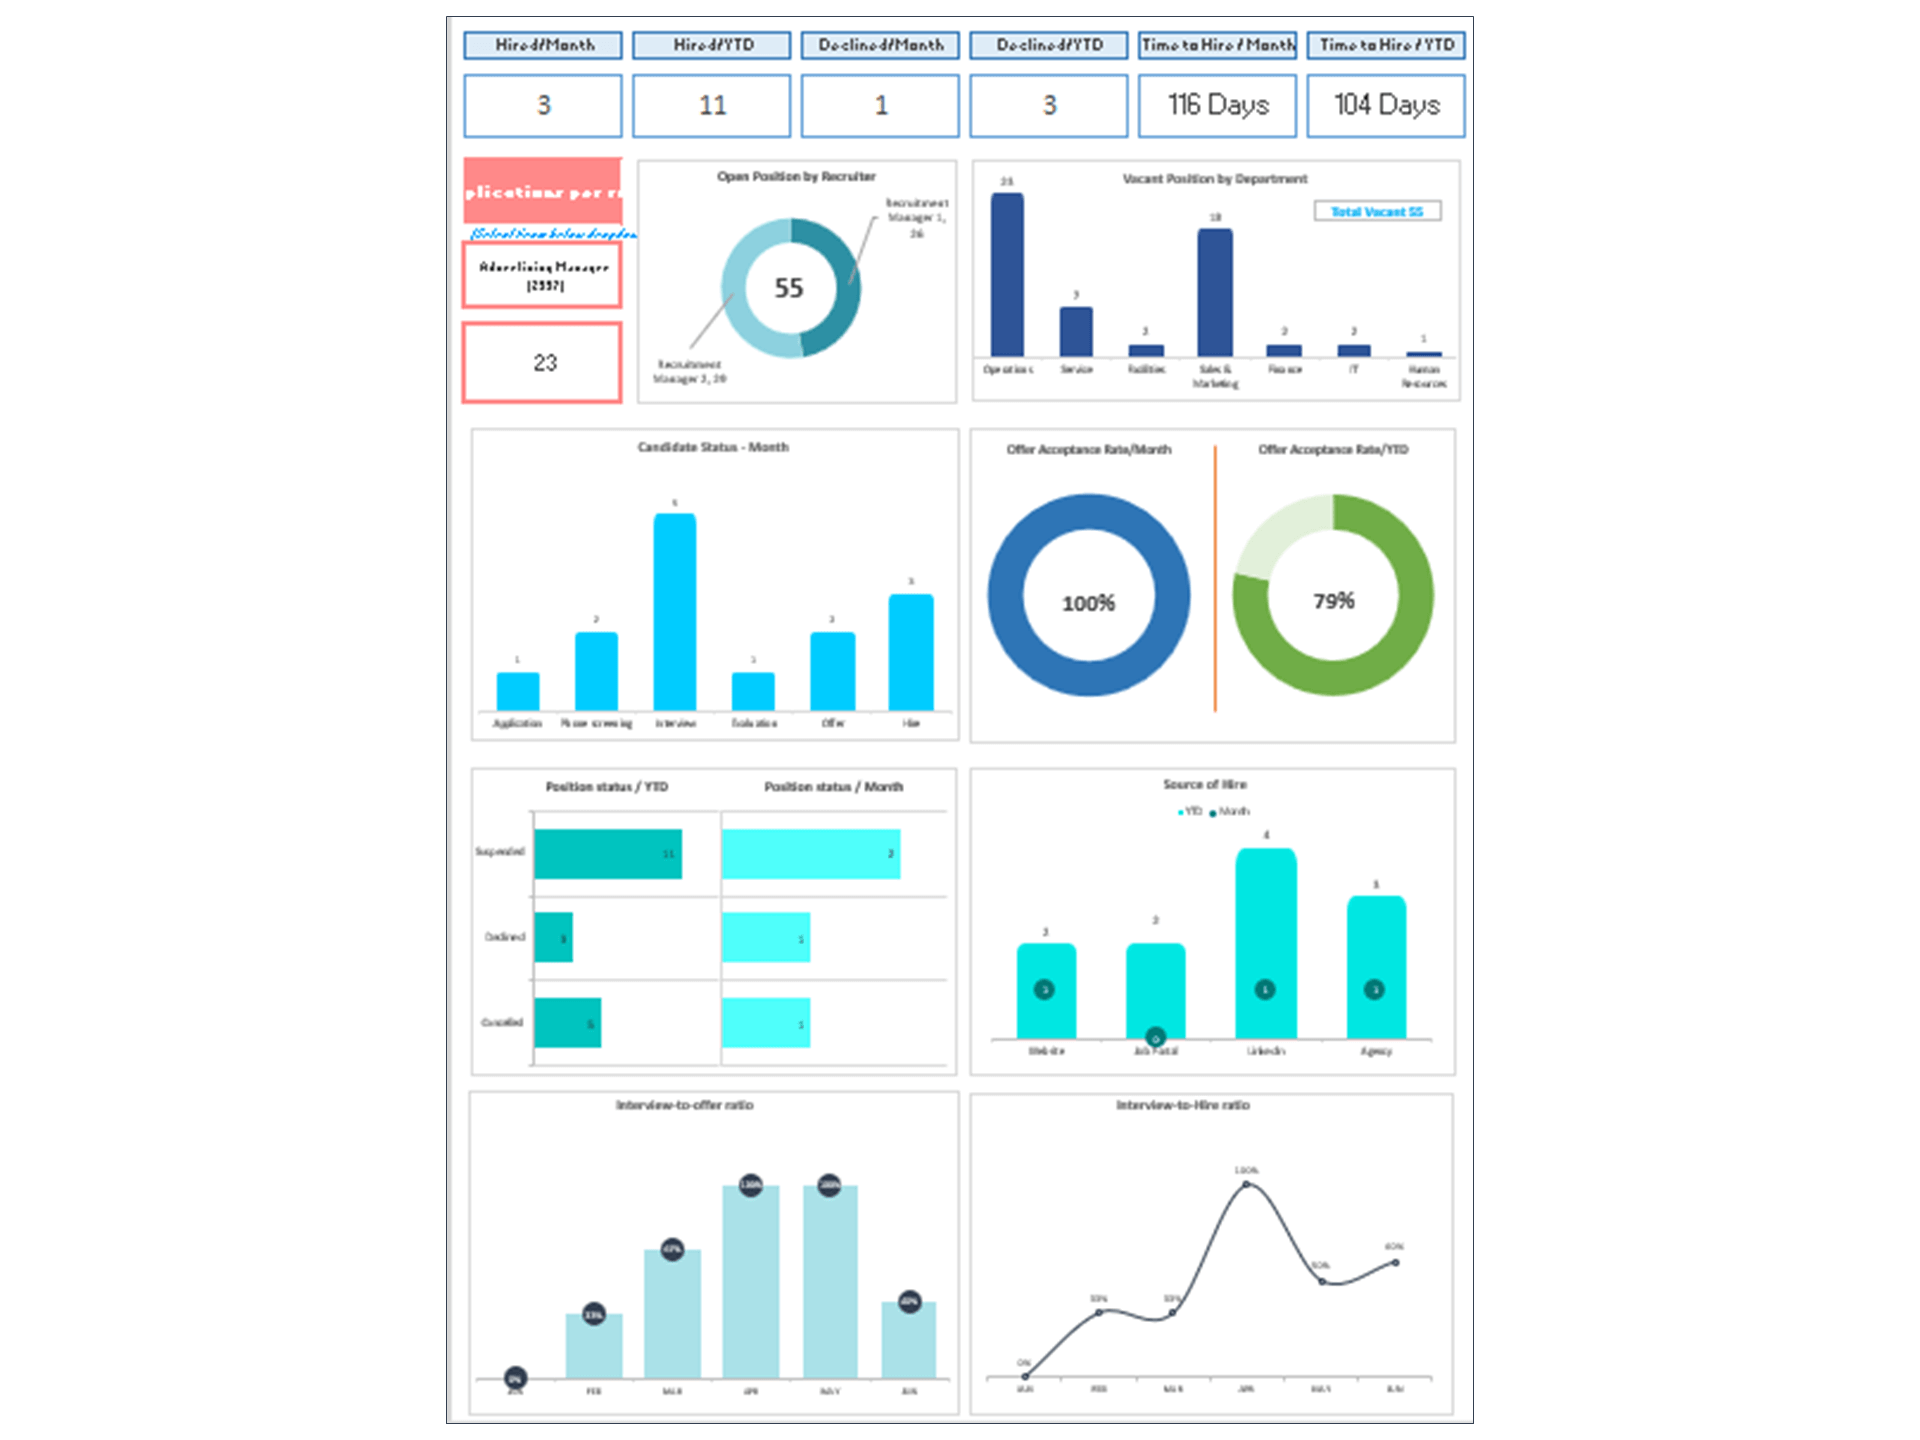
We're offering general HR dashboard templates, HR training dashboards where you can share instructions, resources, policies, and other educational material, and HR excel templates that can be used to store data.

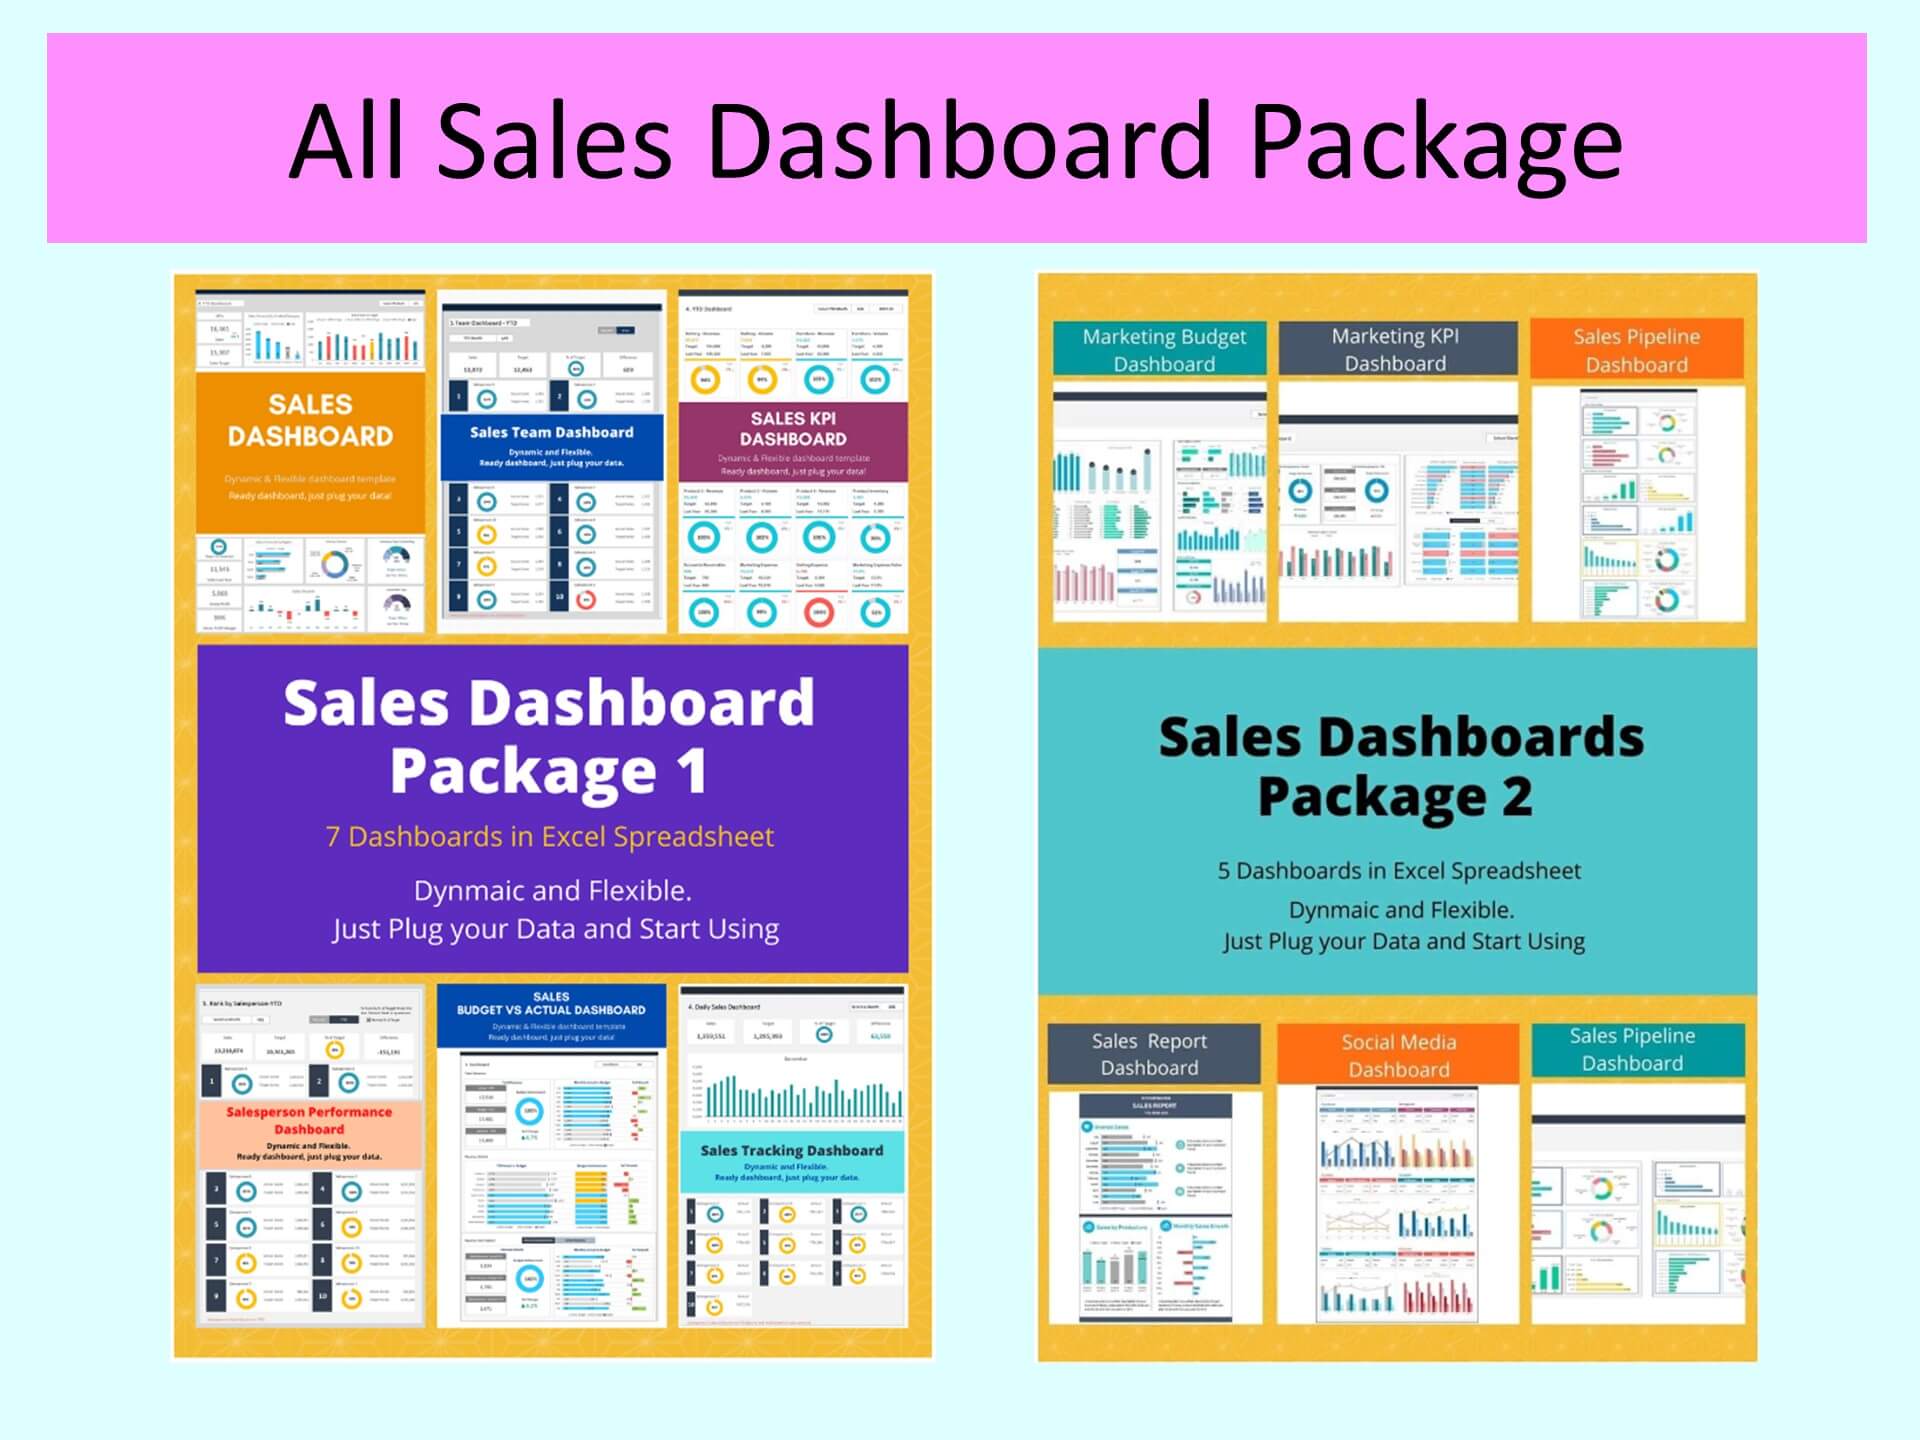
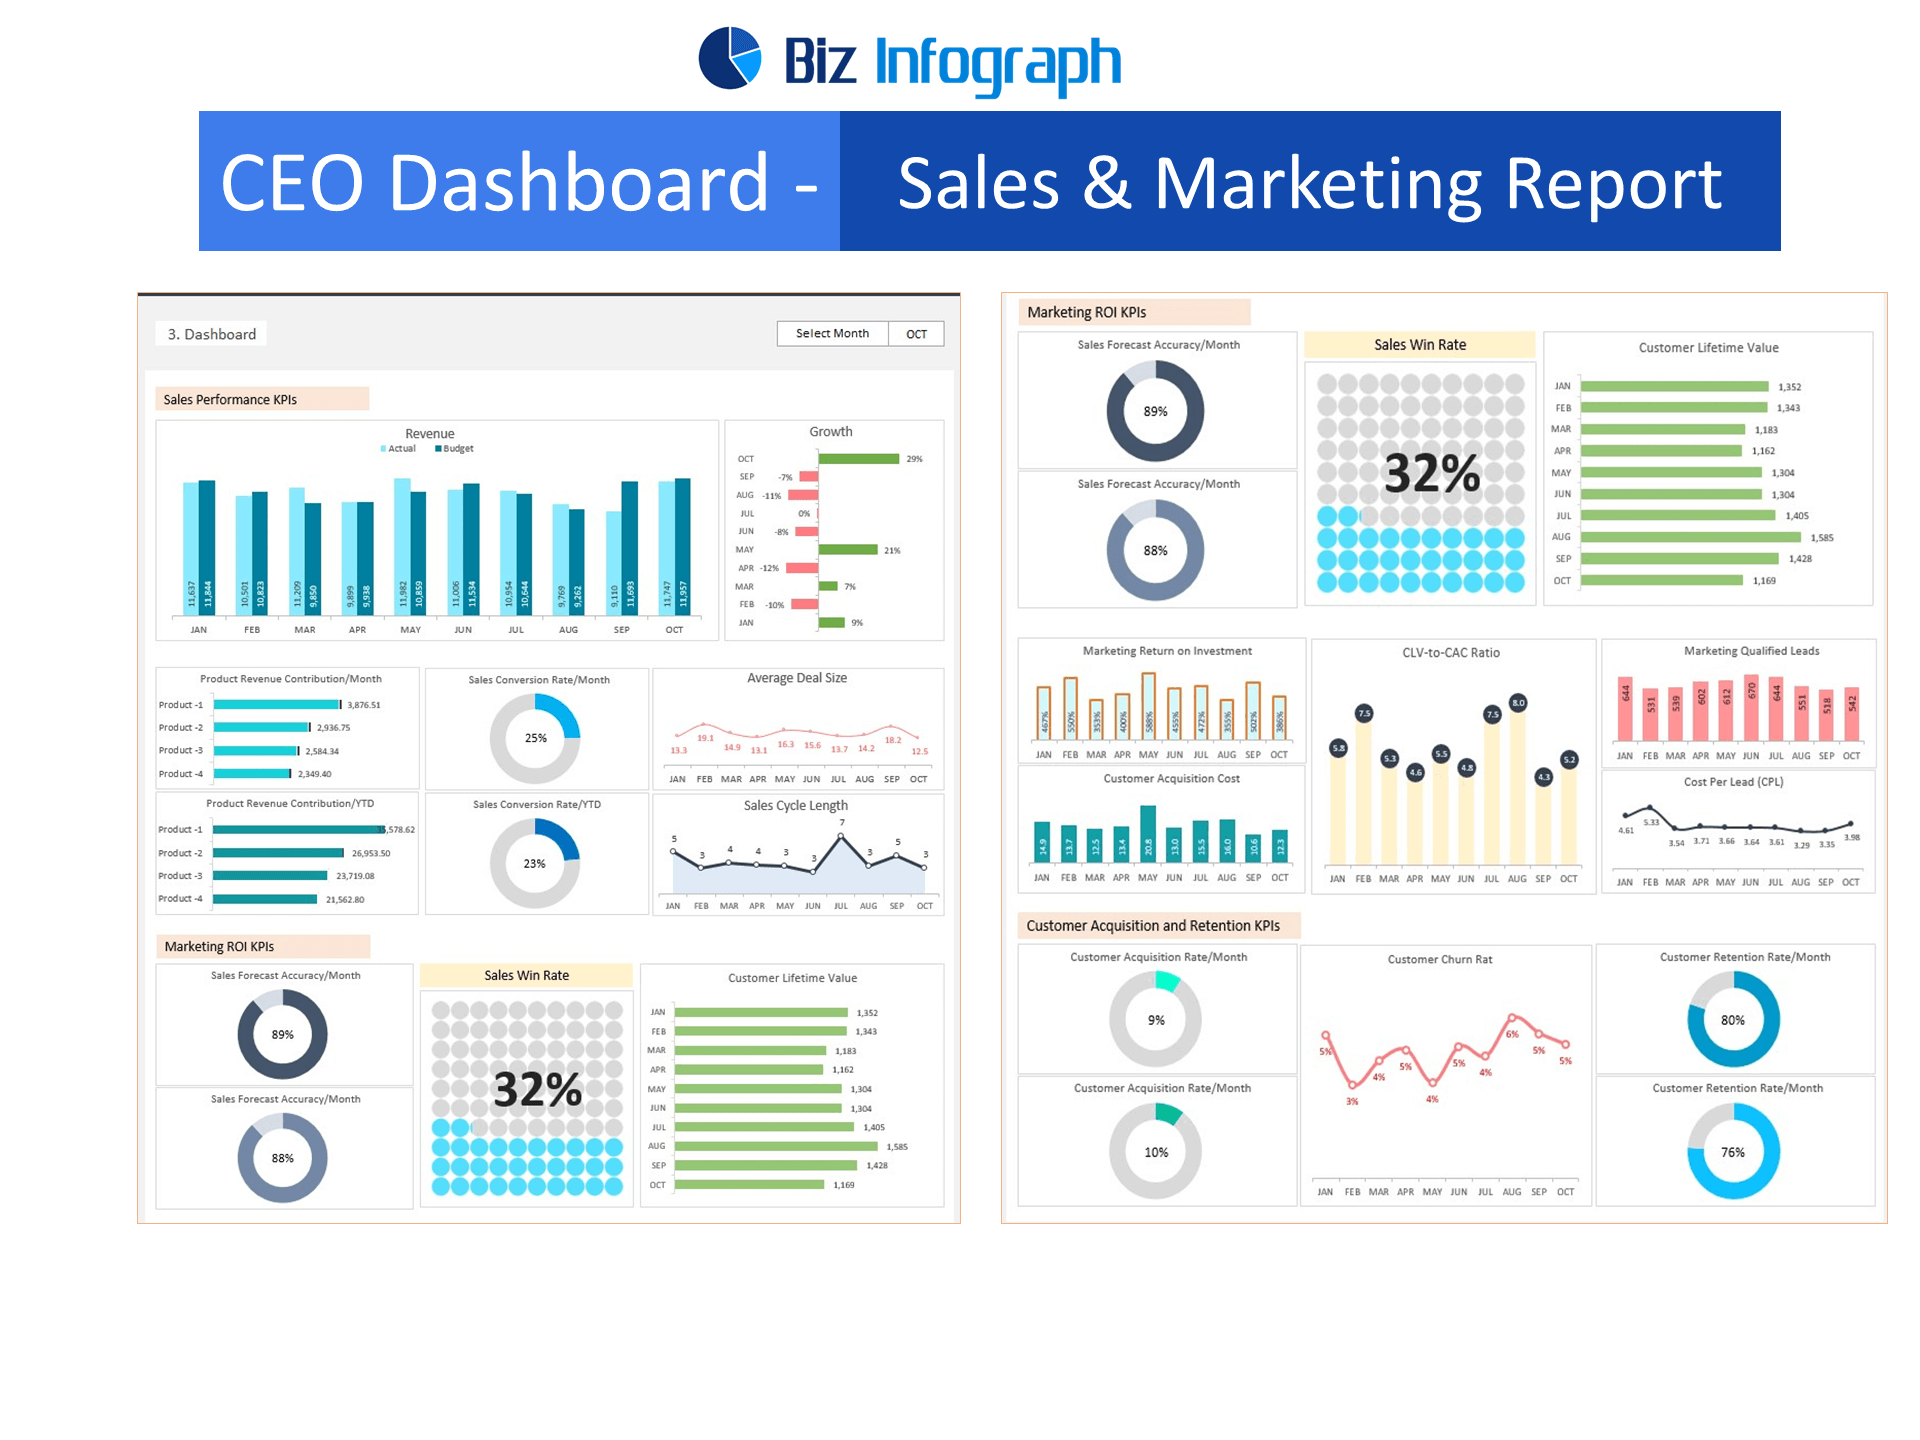
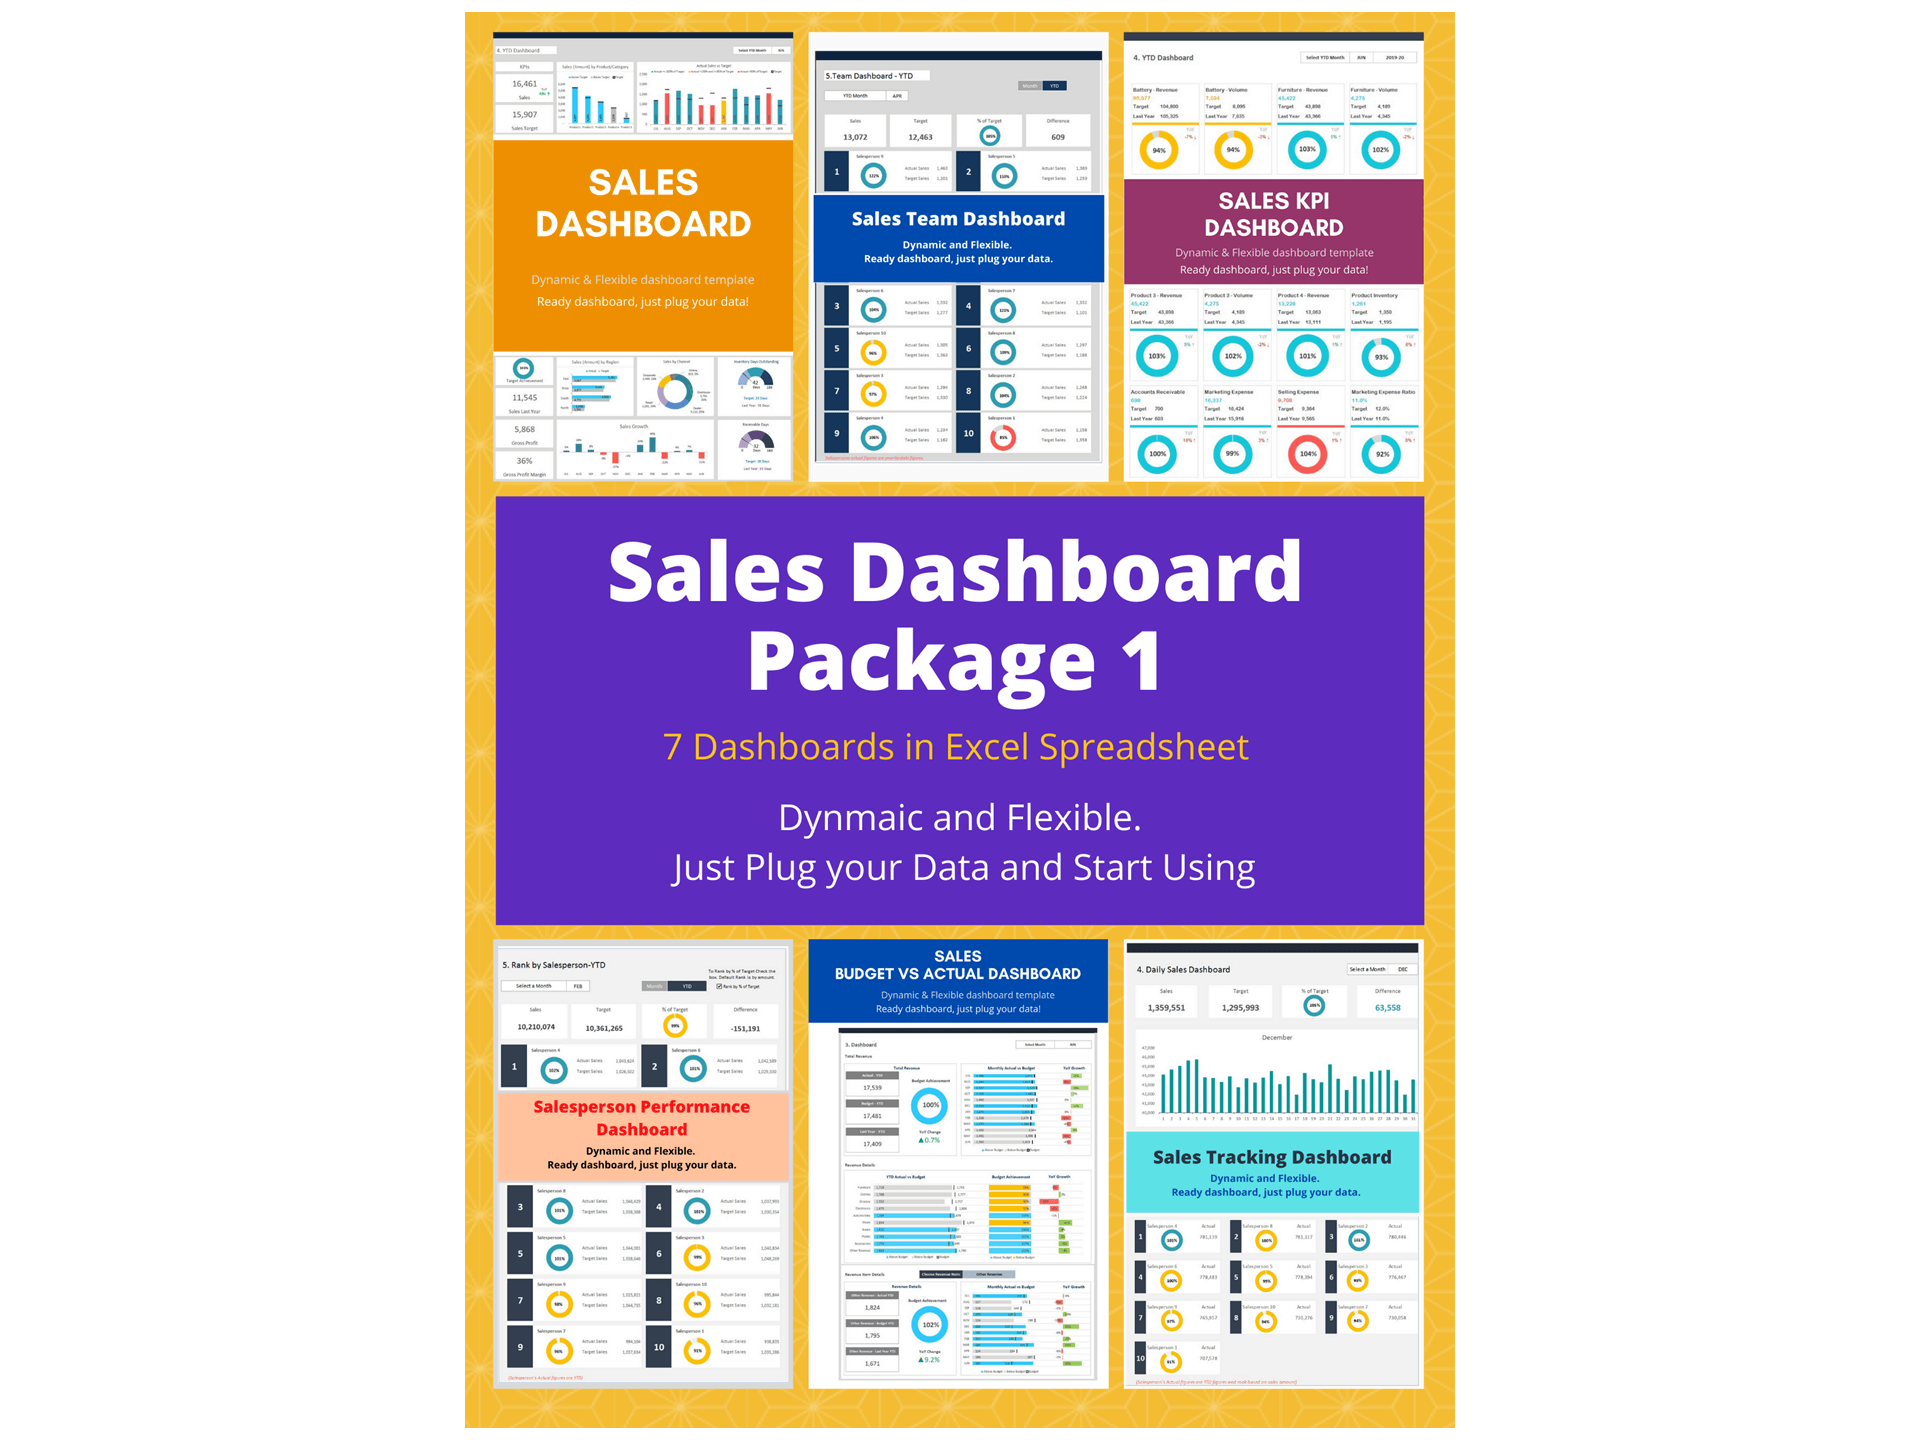
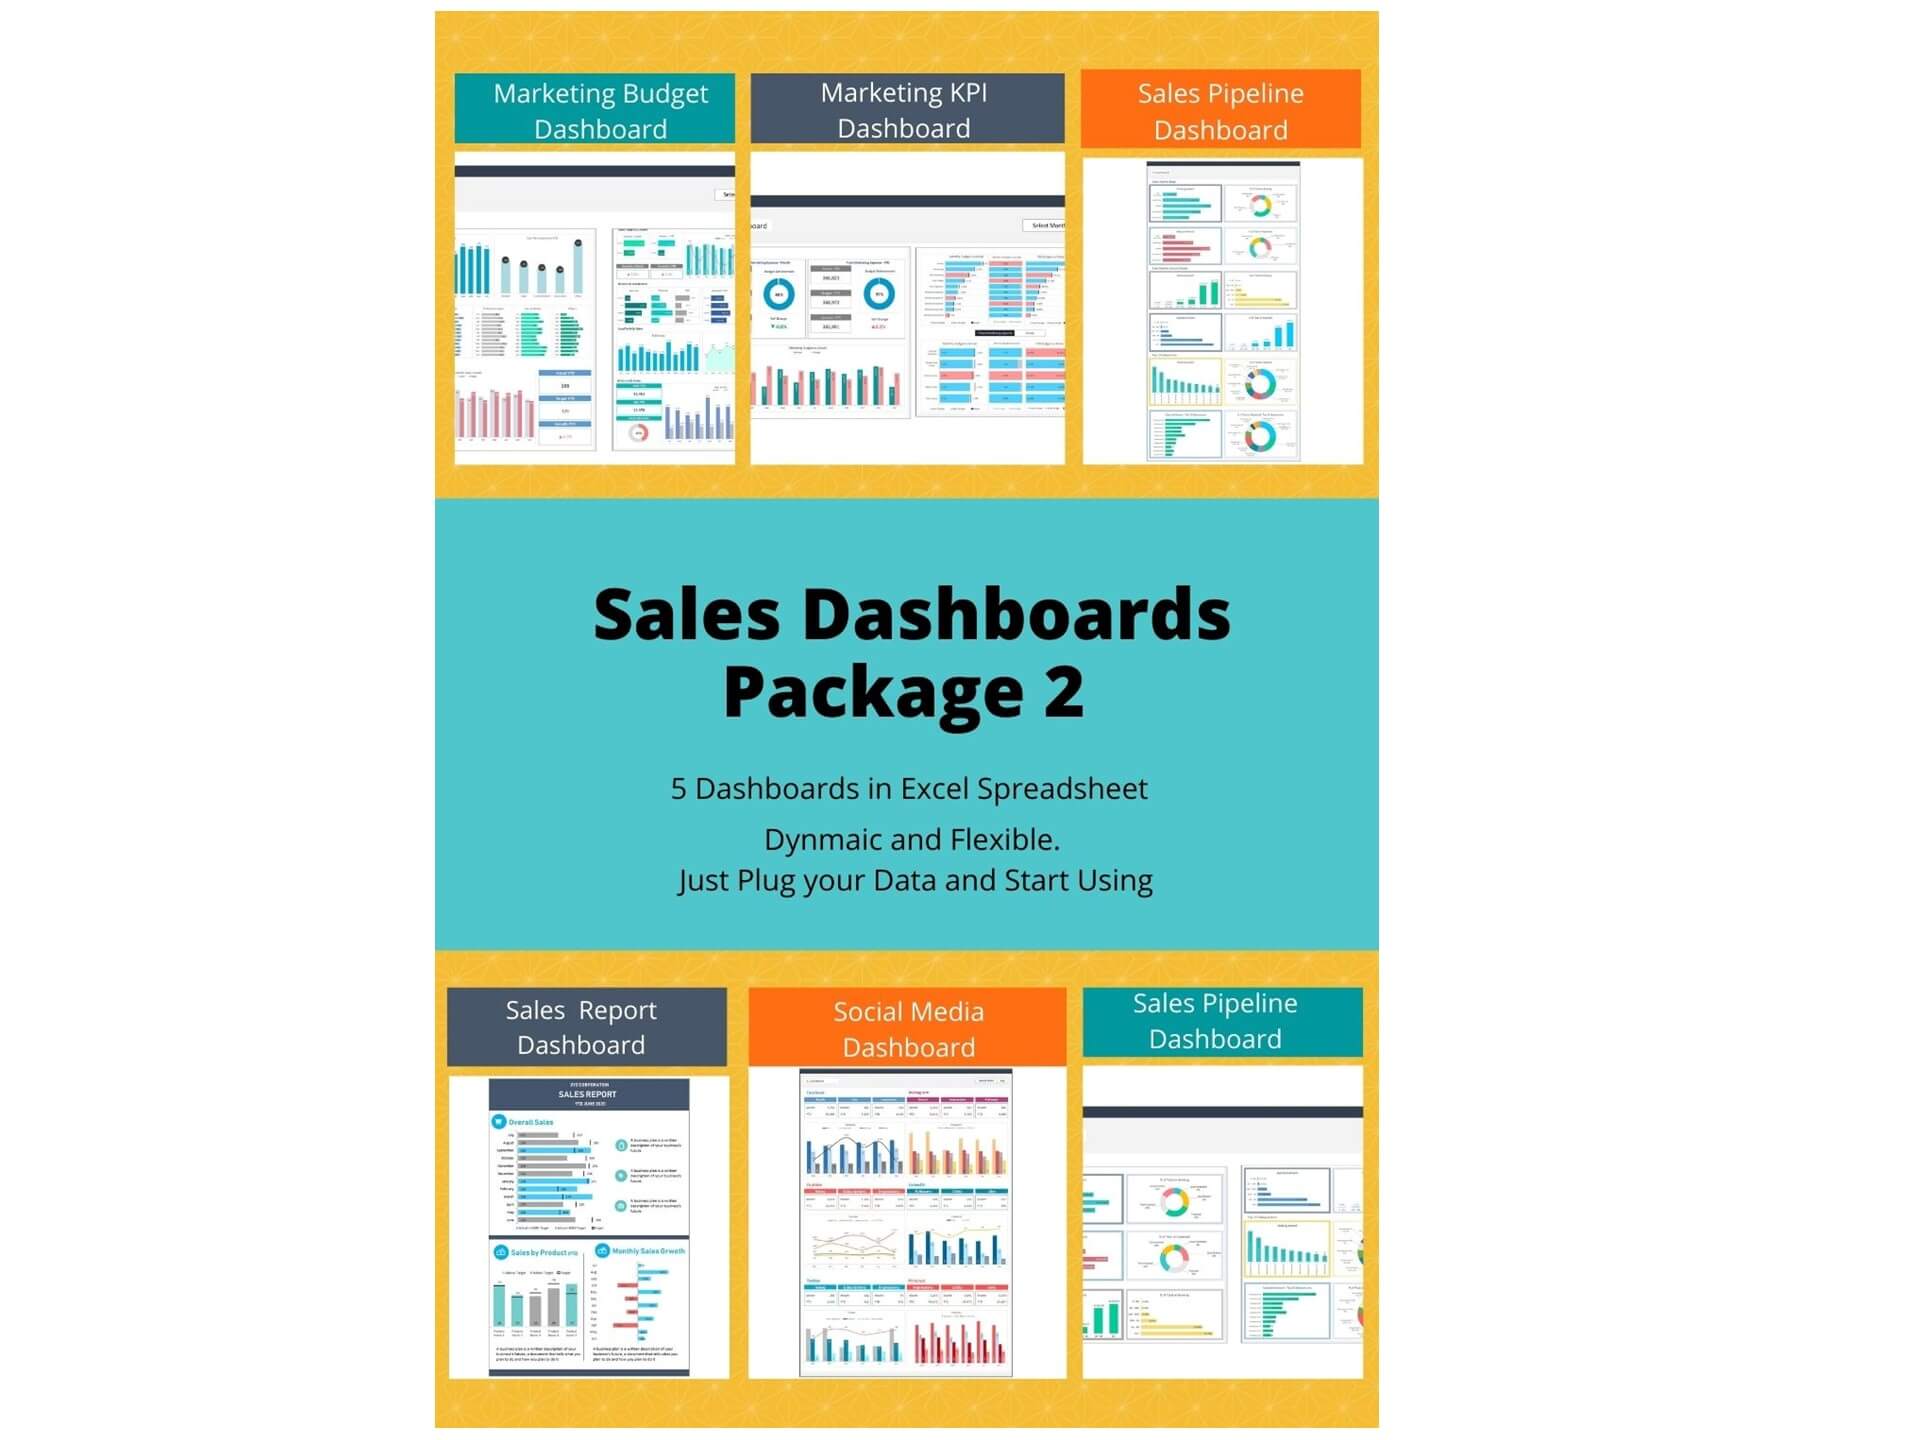
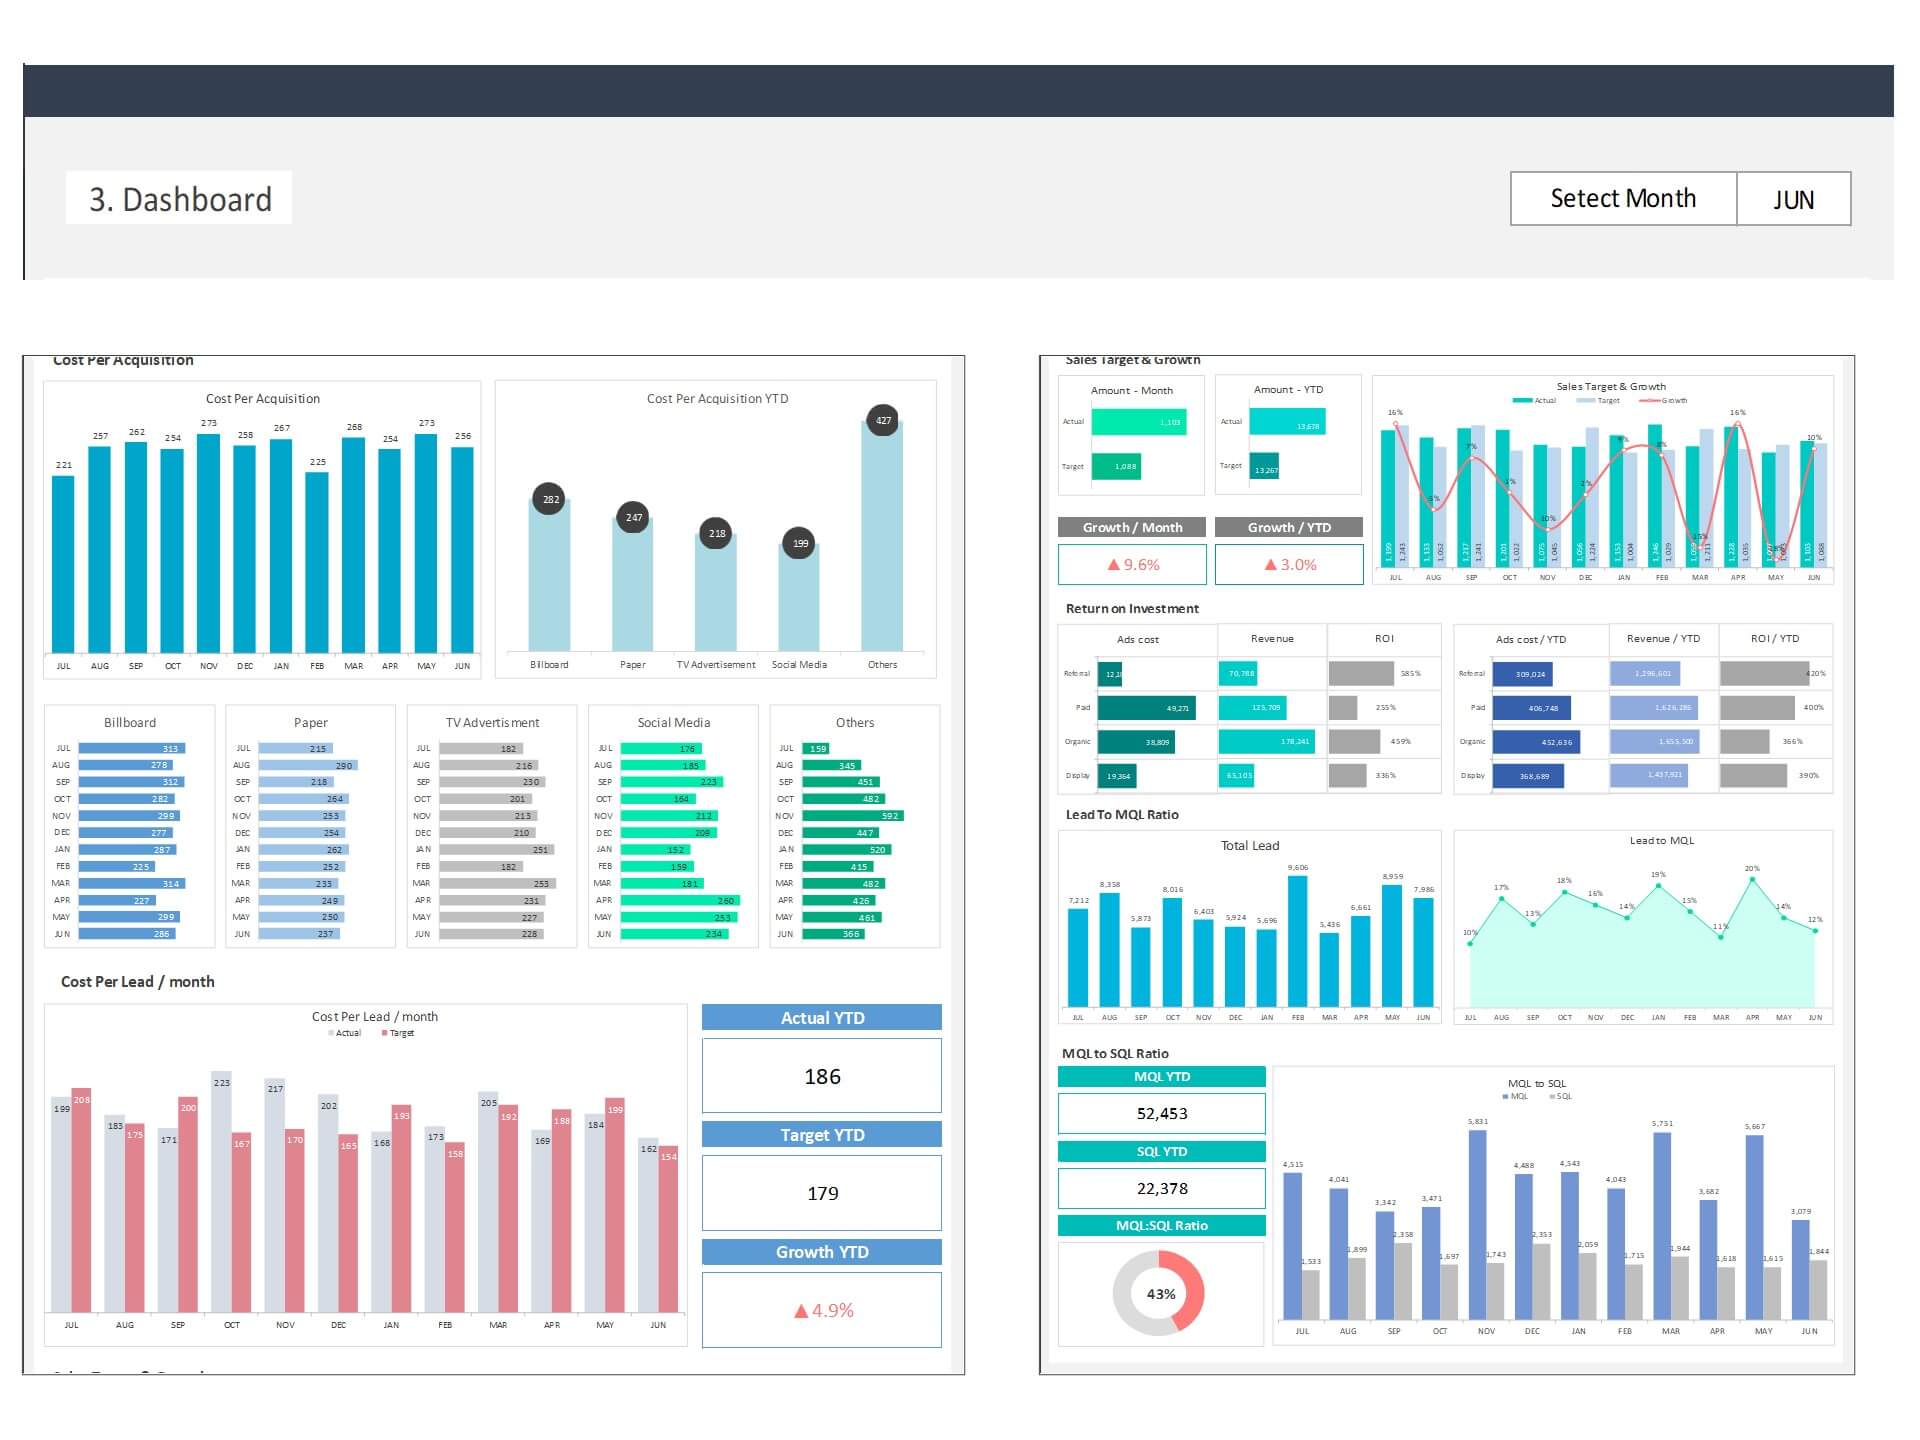
It’s never been easier to keep track of sales records, information, and details than it is now. Our professional sales dashboard templates are exactly what you need to make it easier to keep track of your sales goals, rates, and successes.
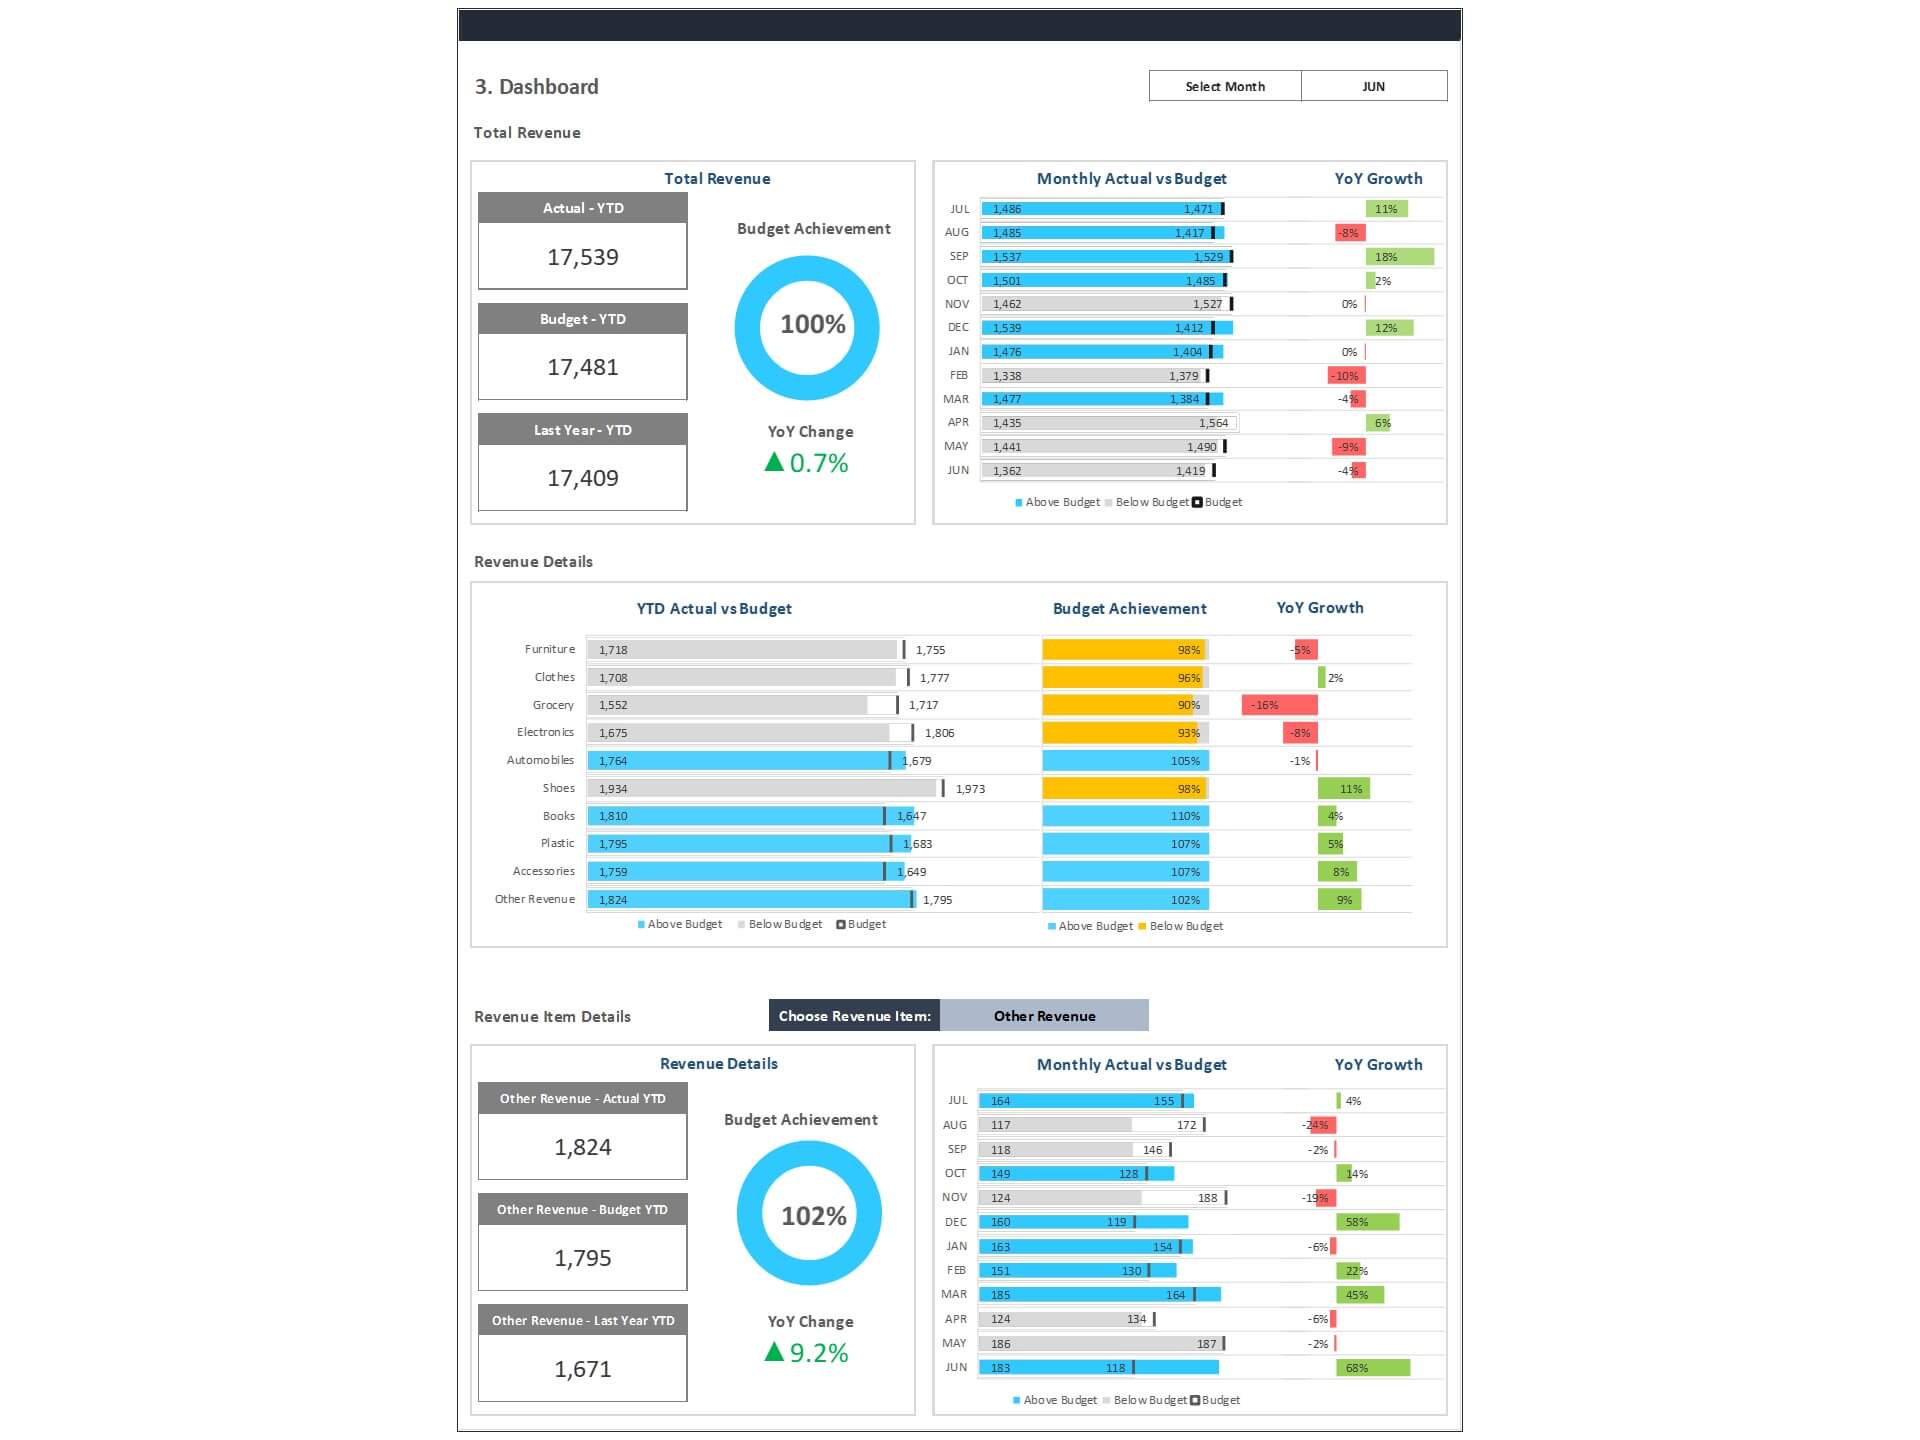
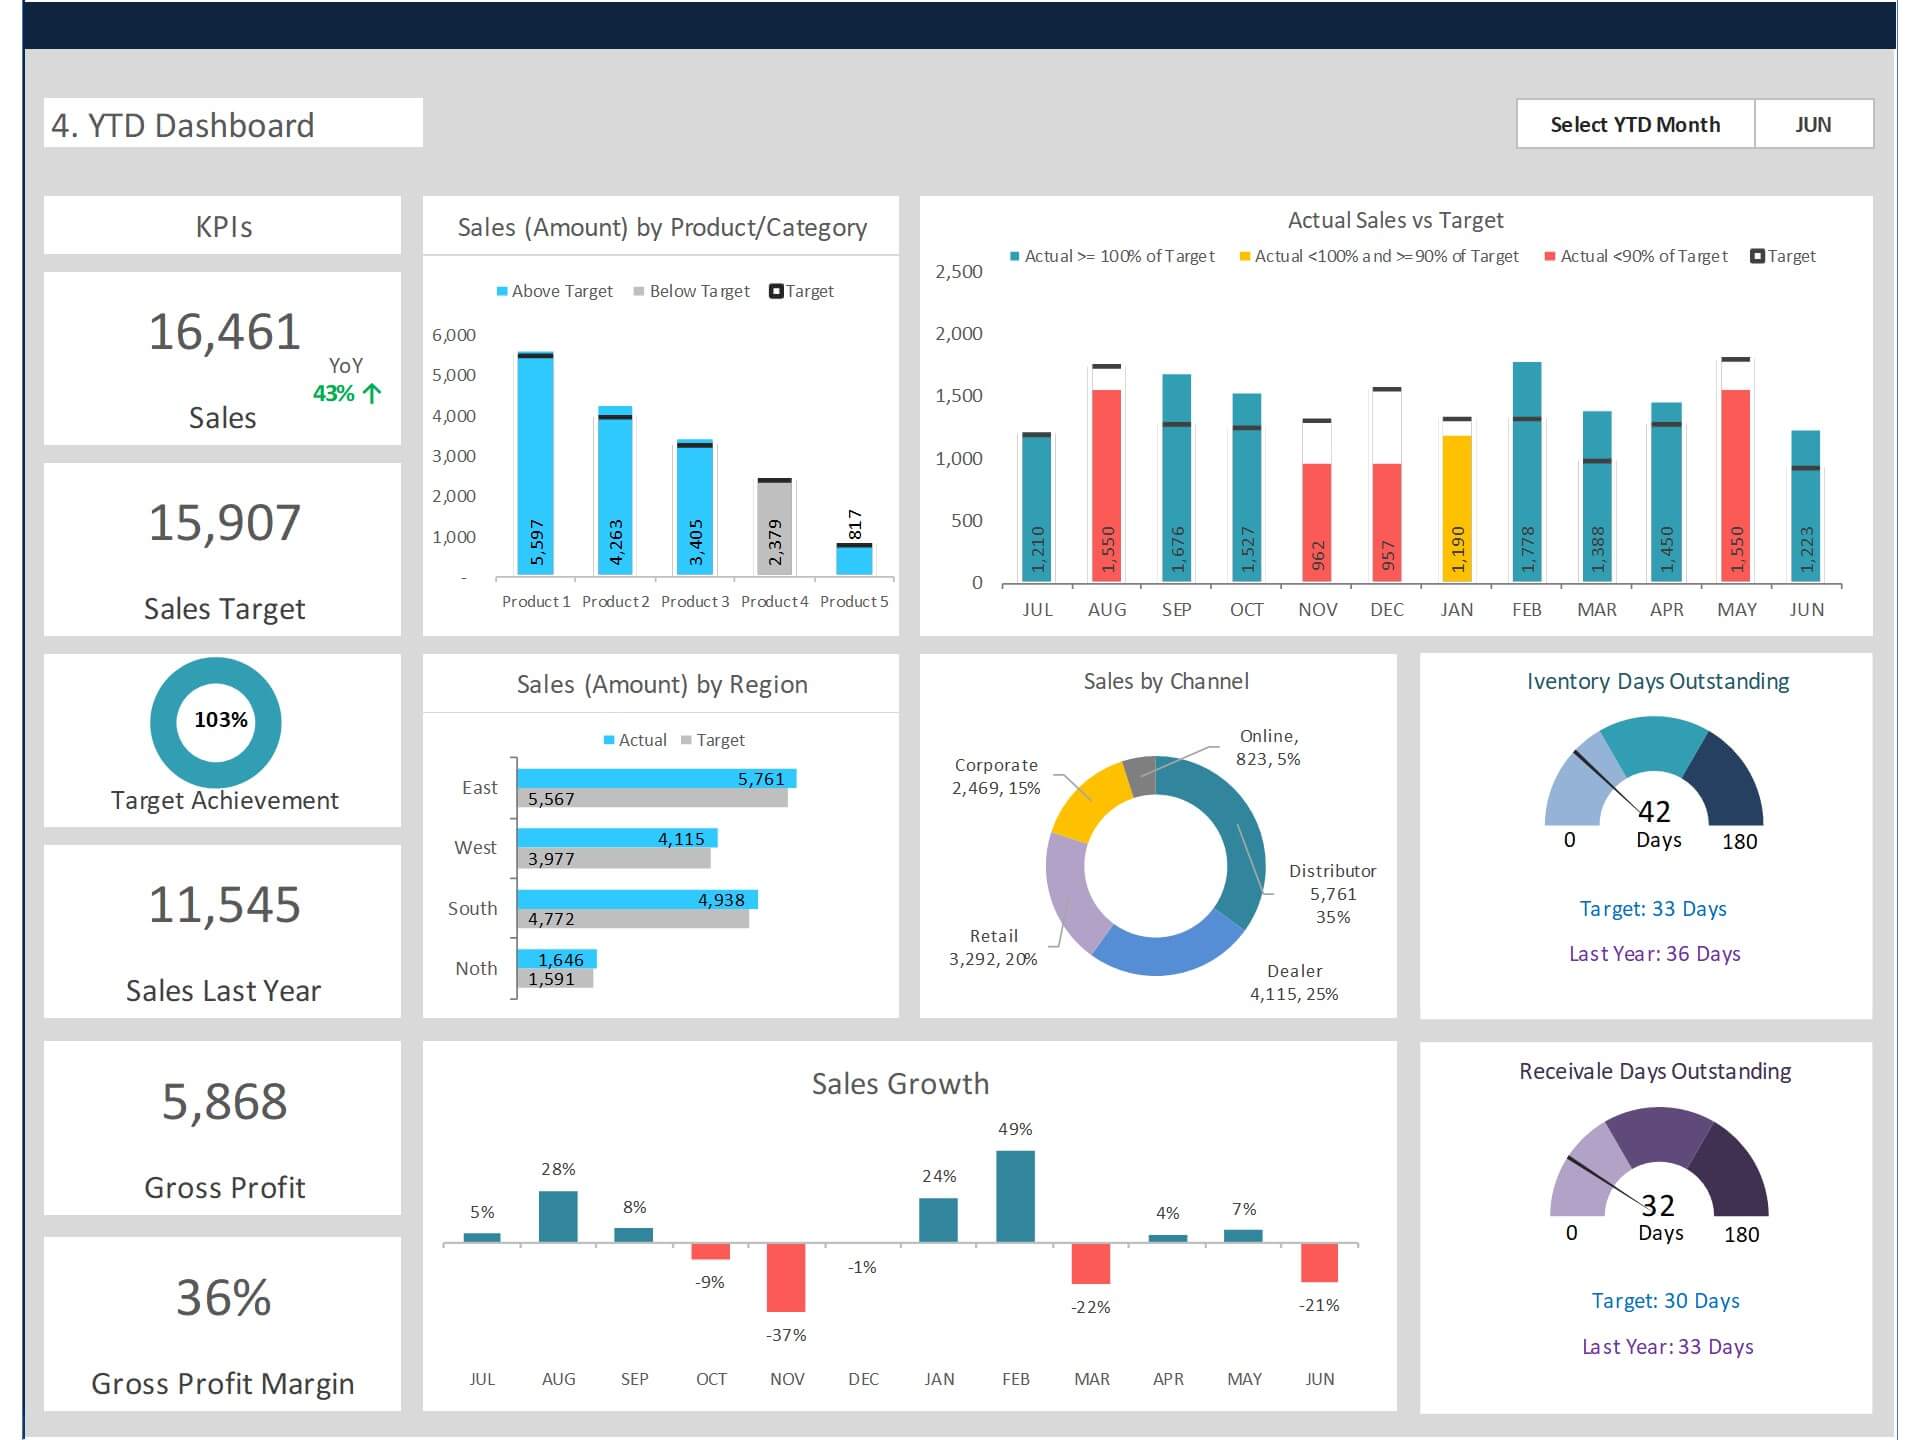
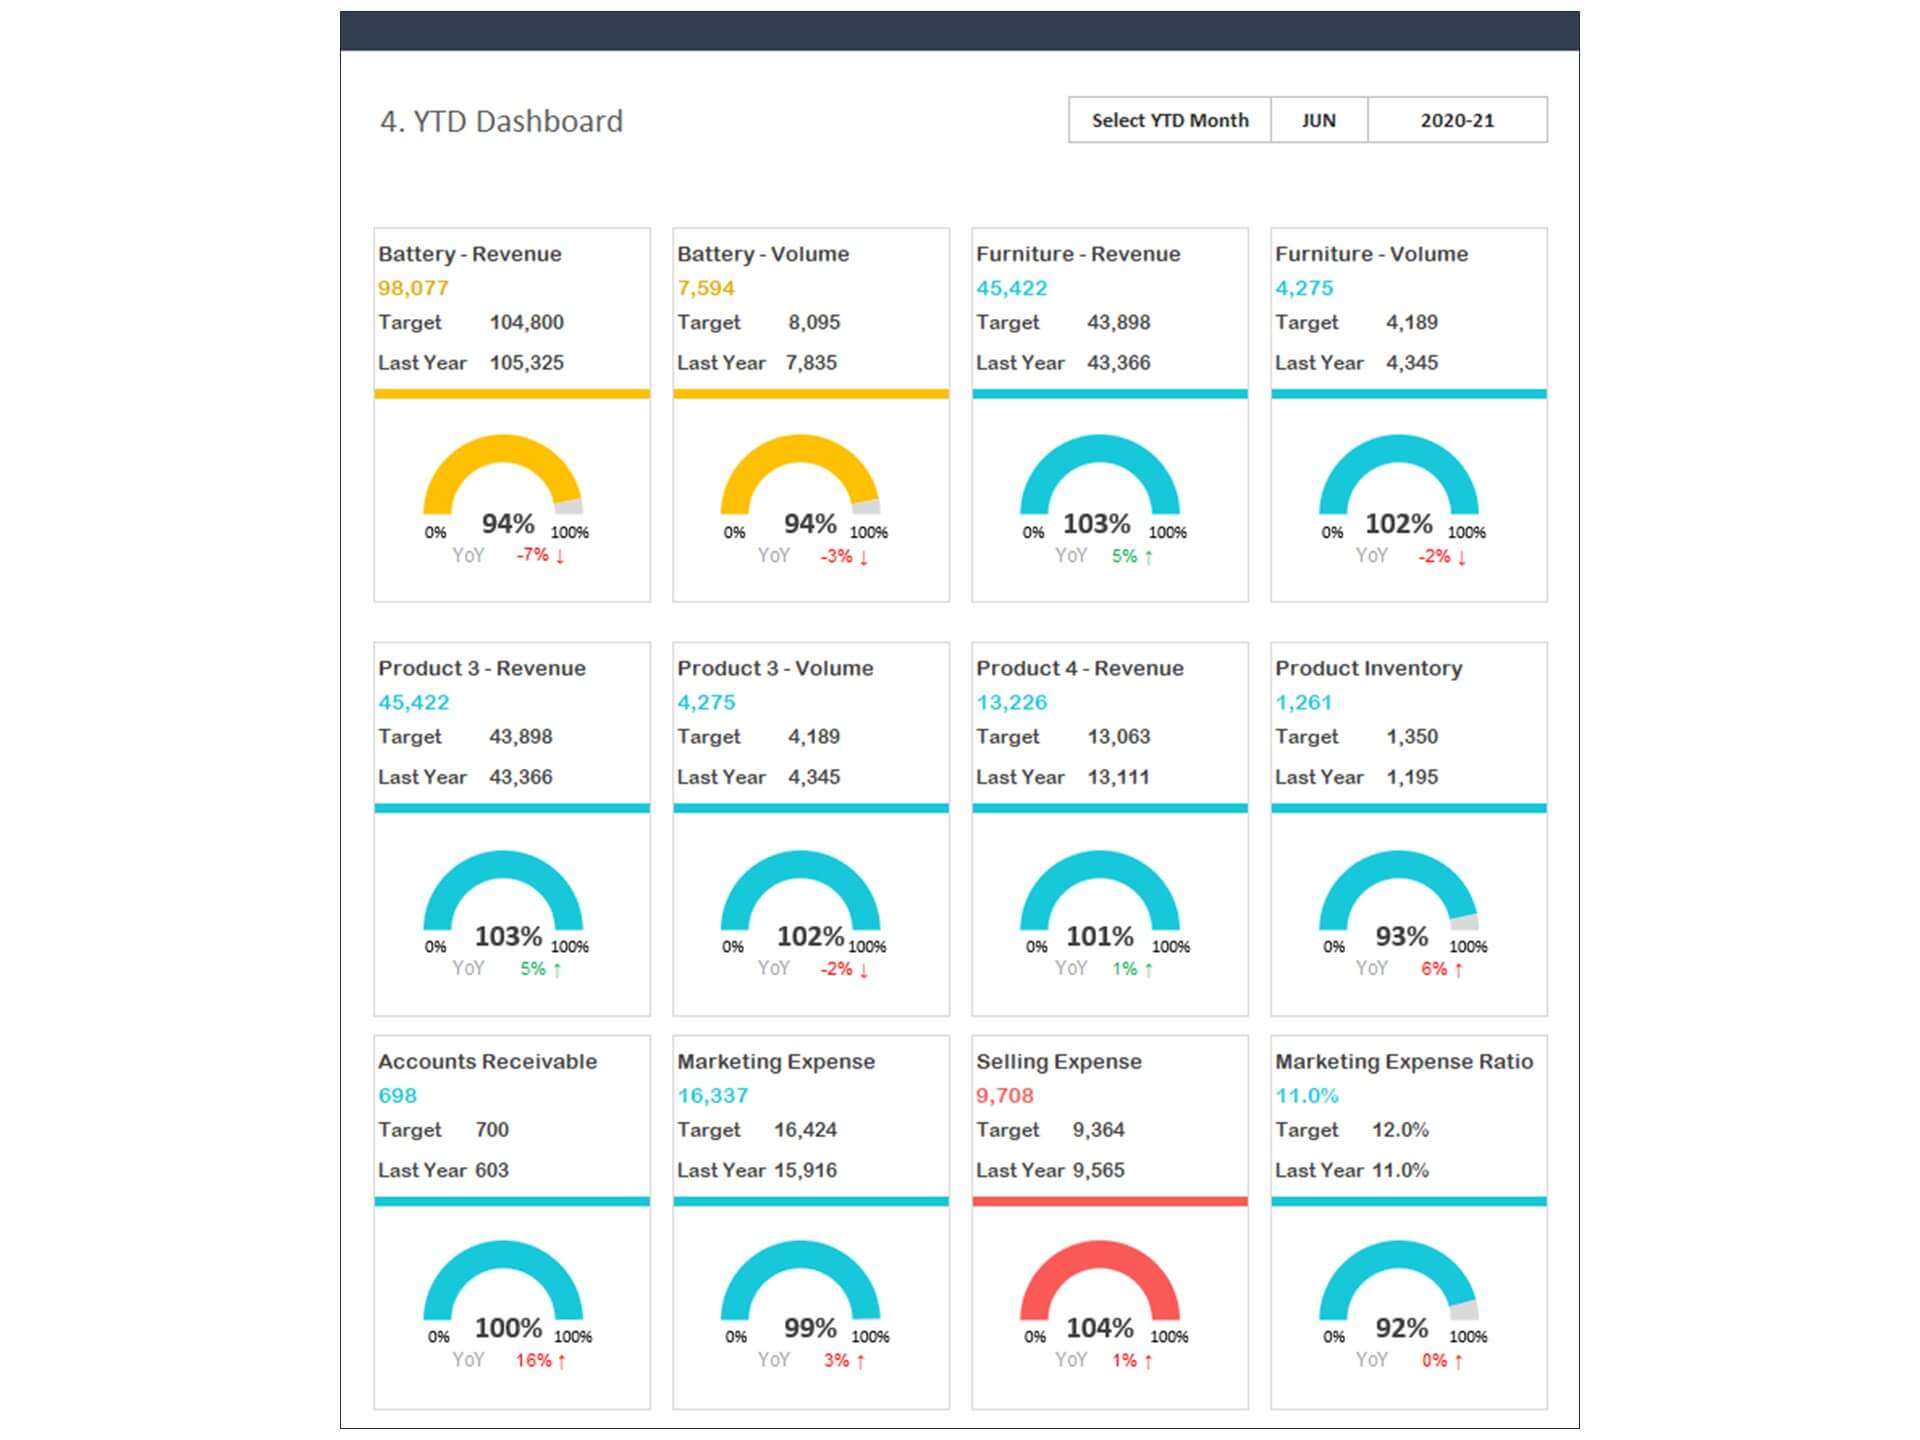
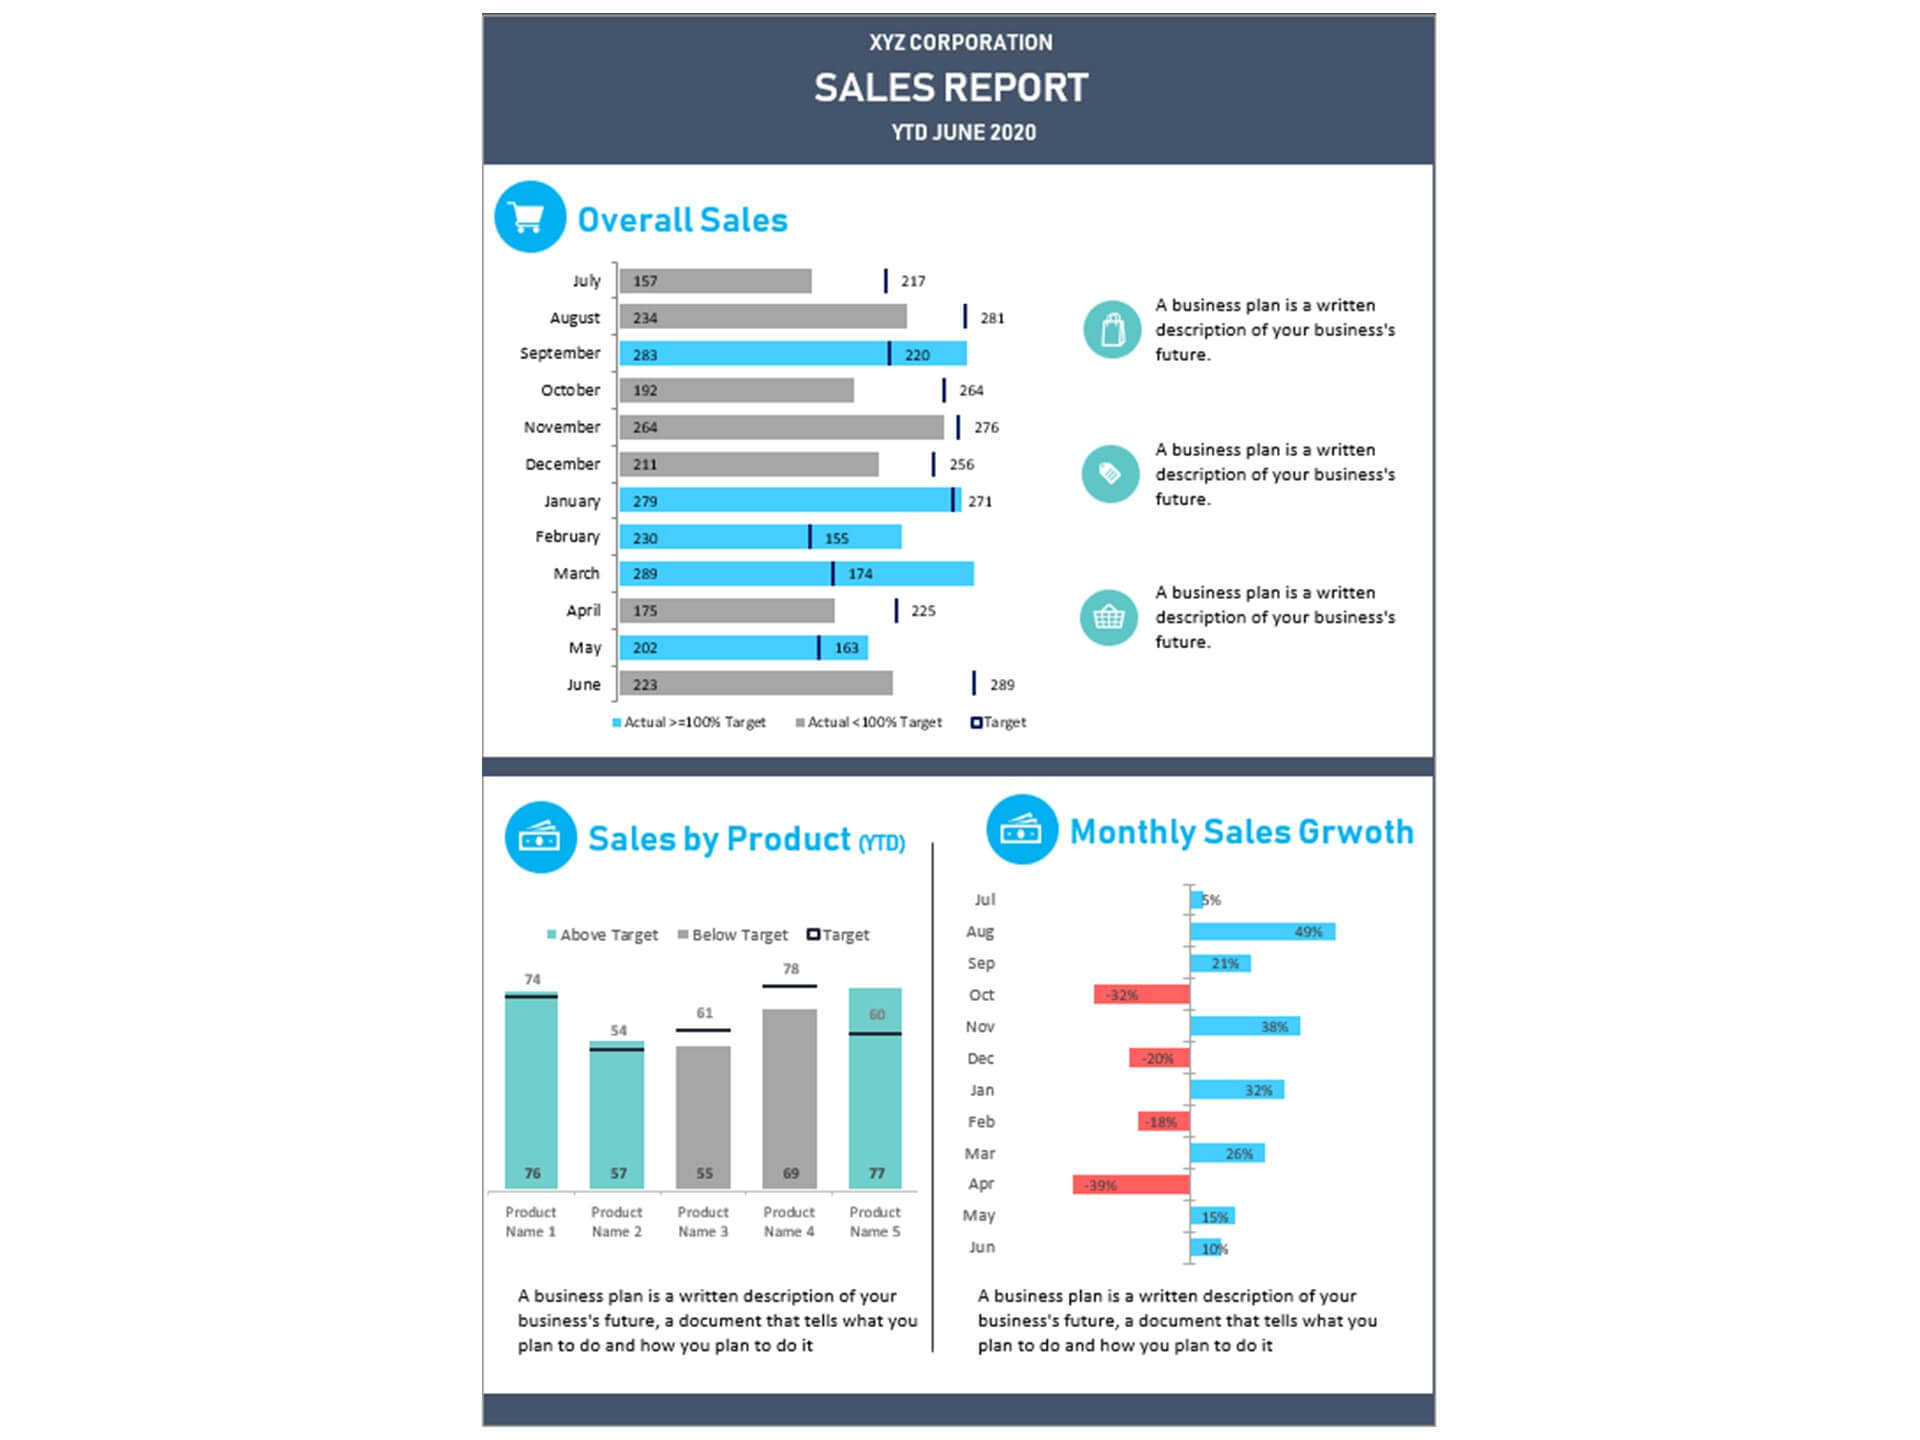
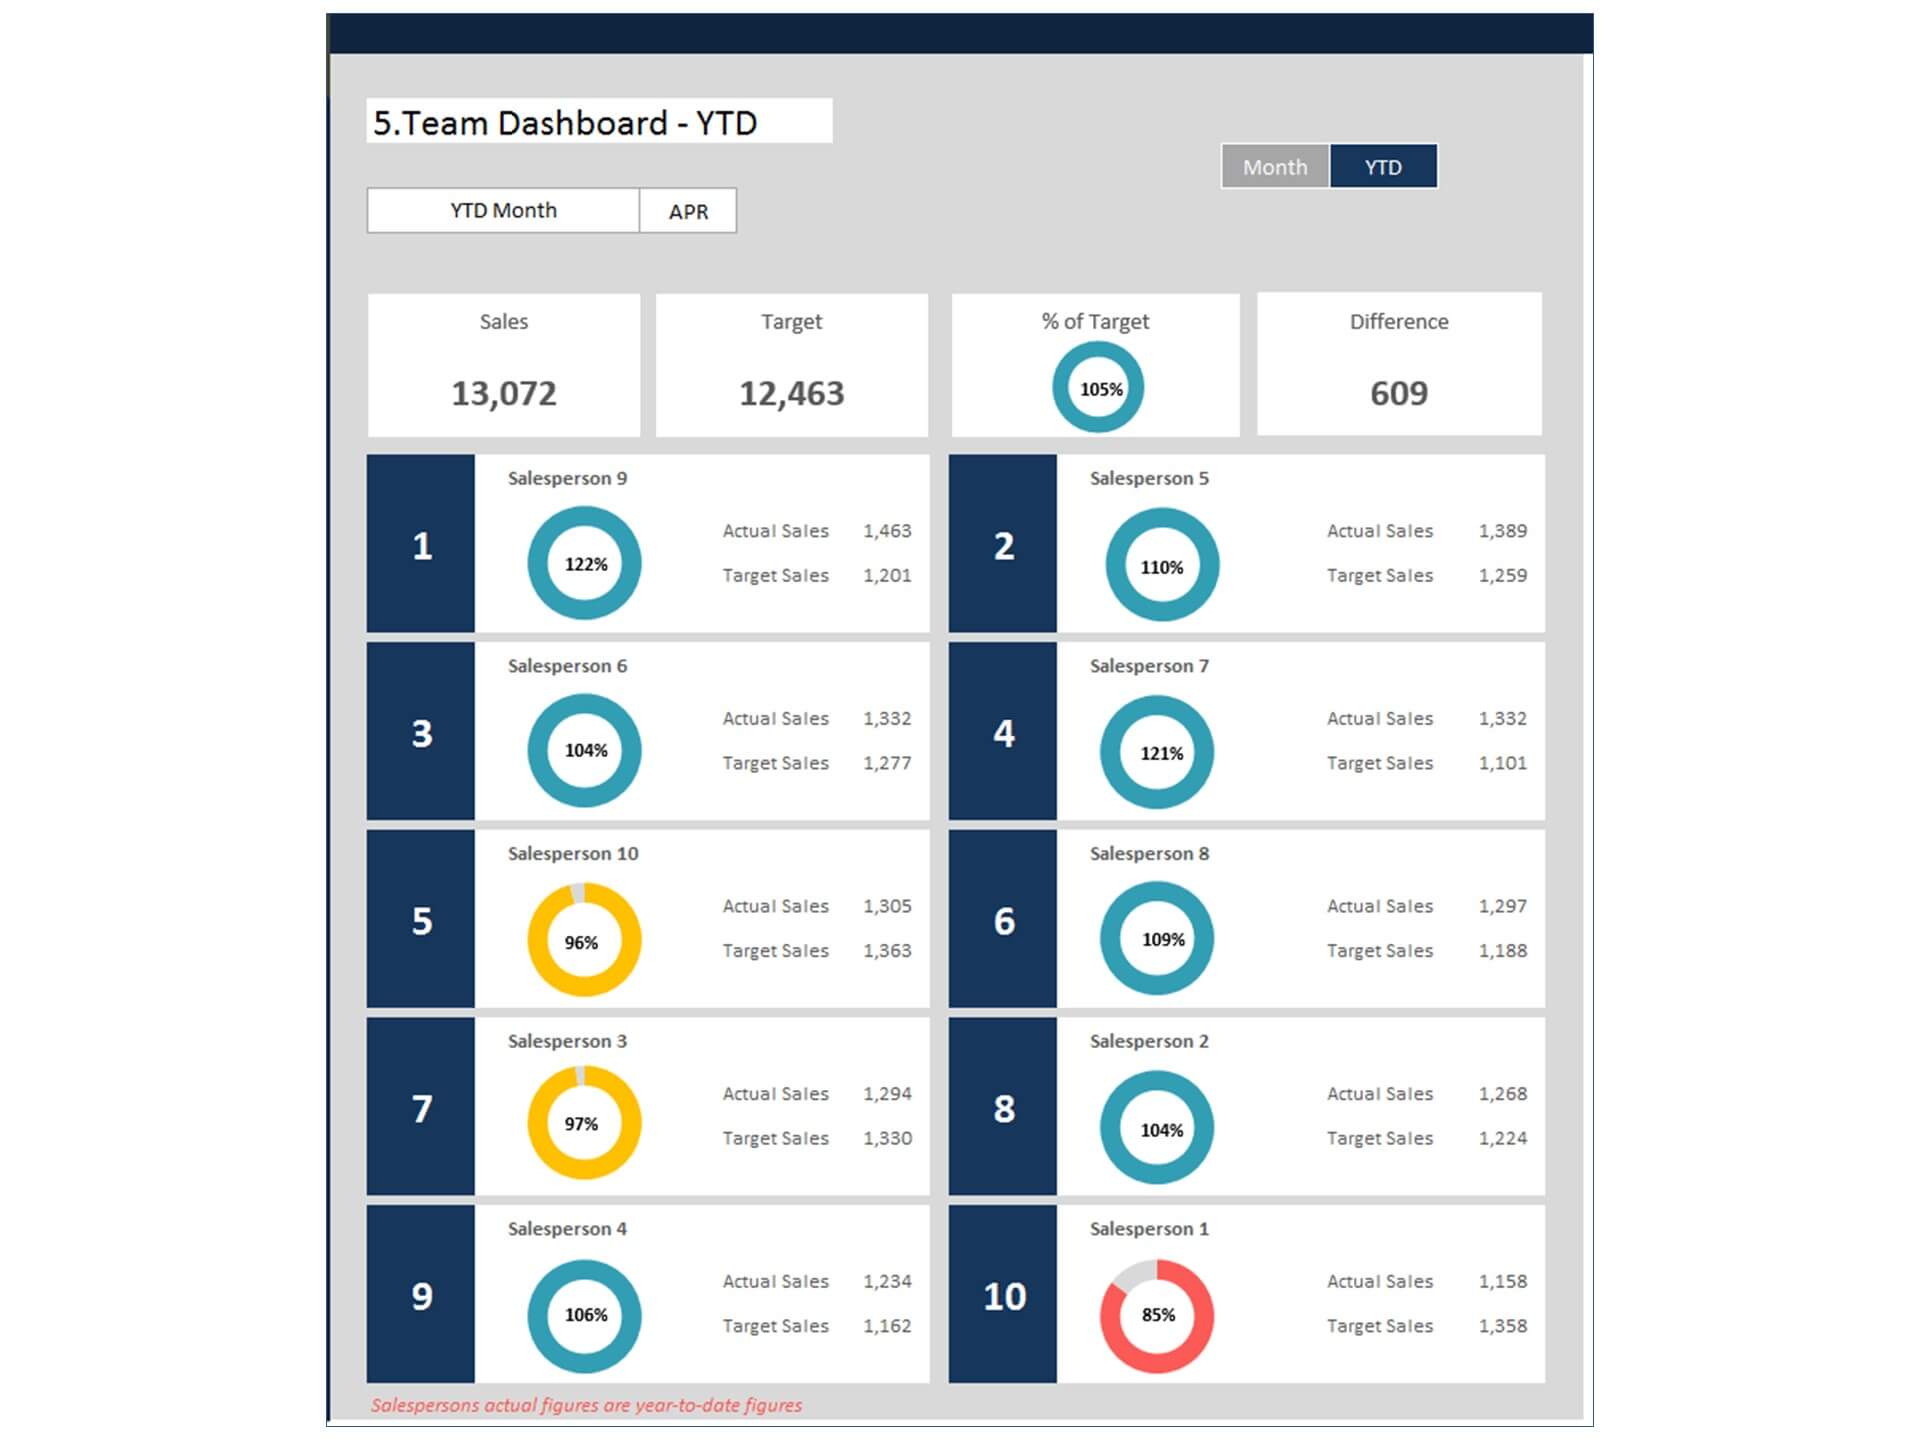
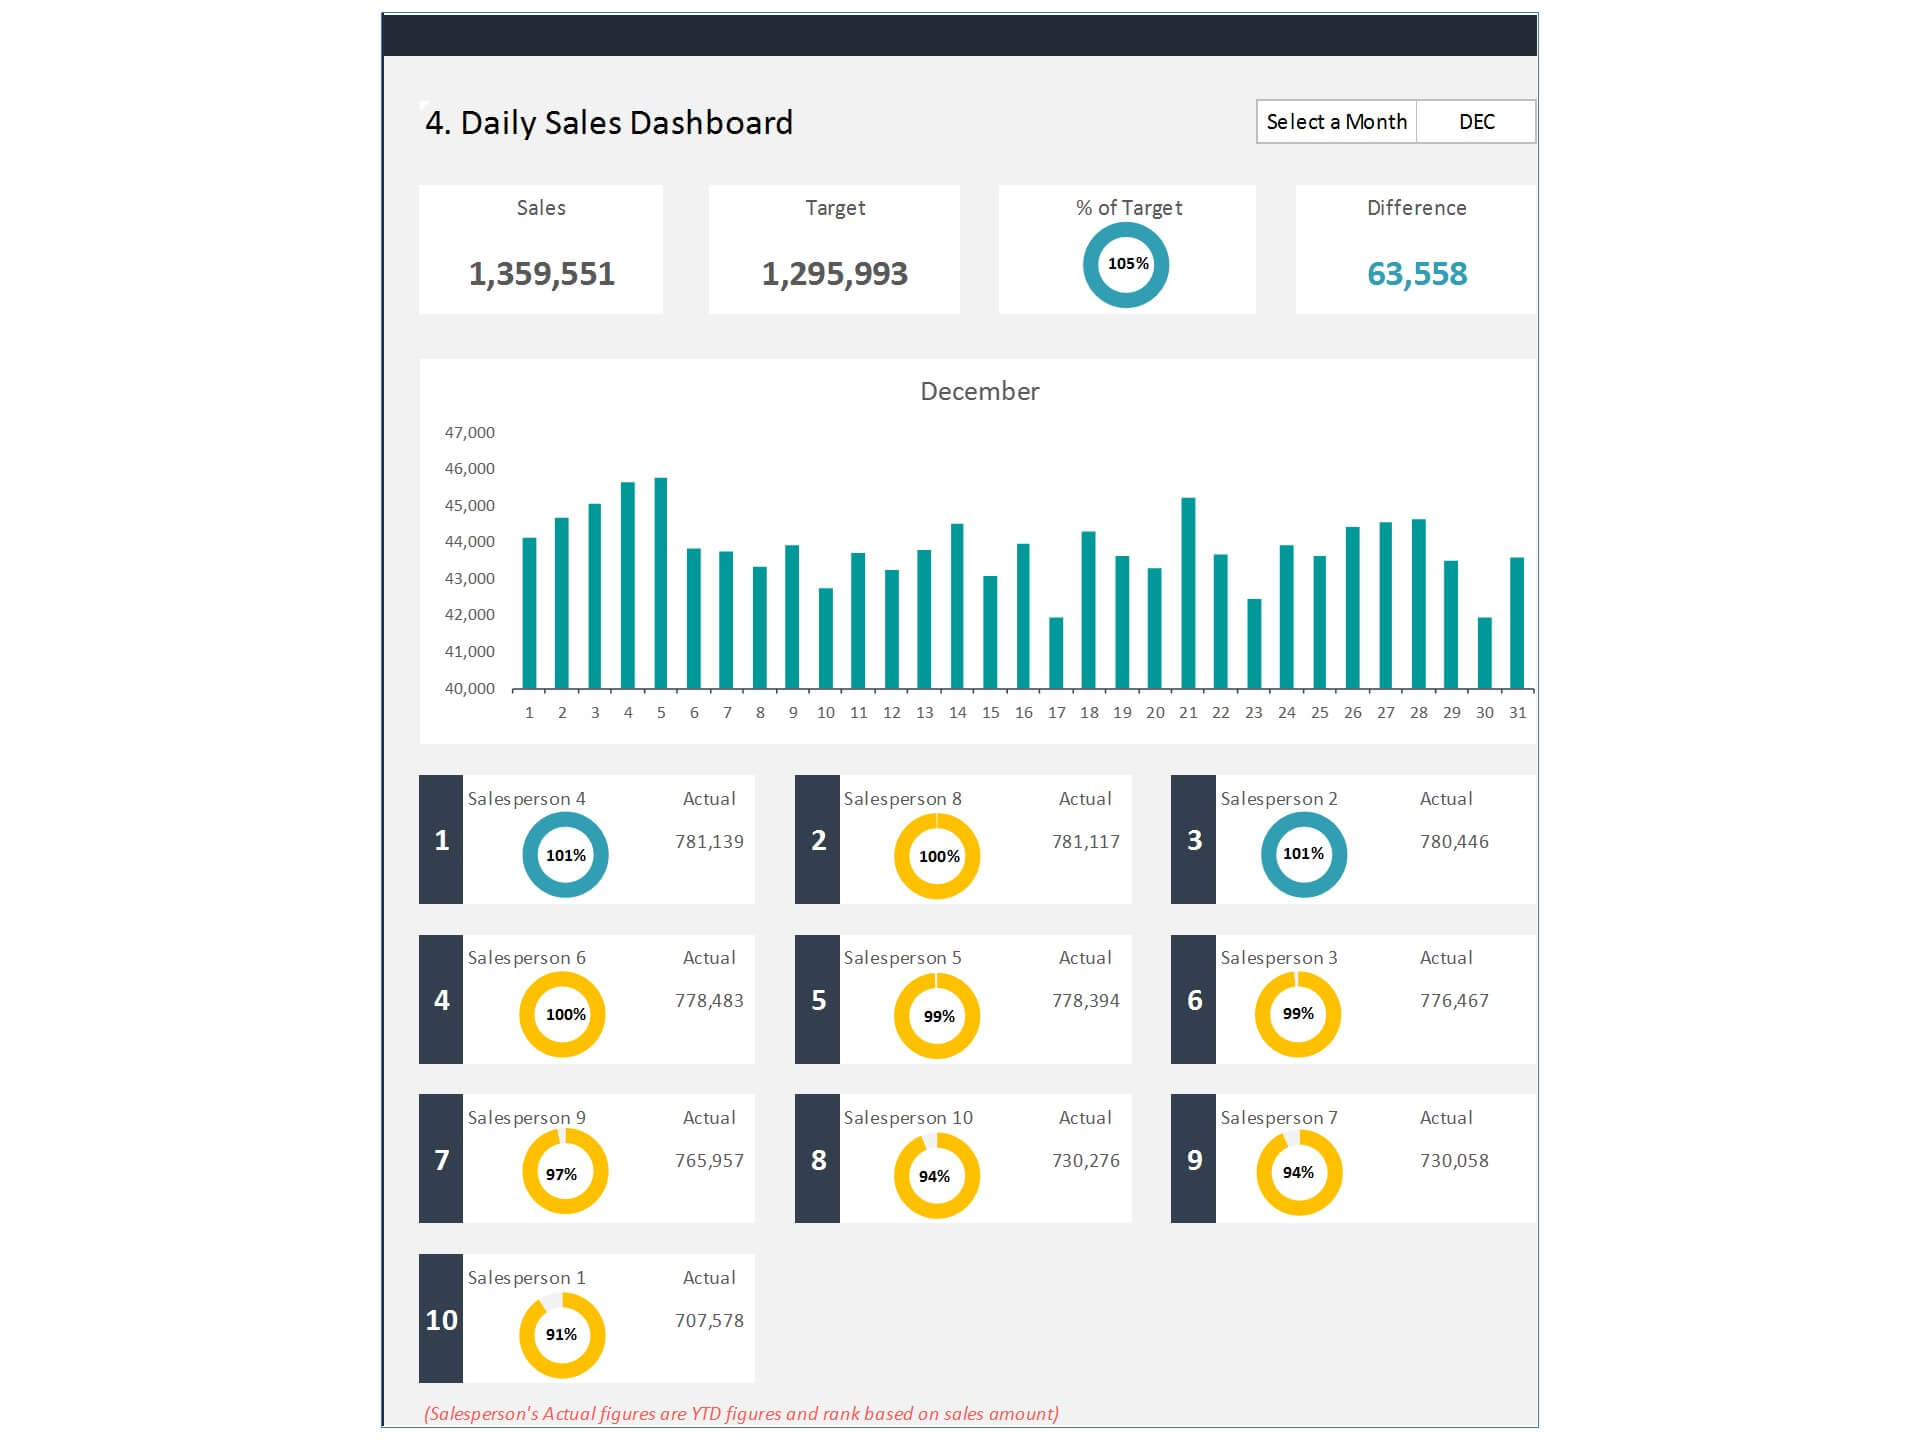
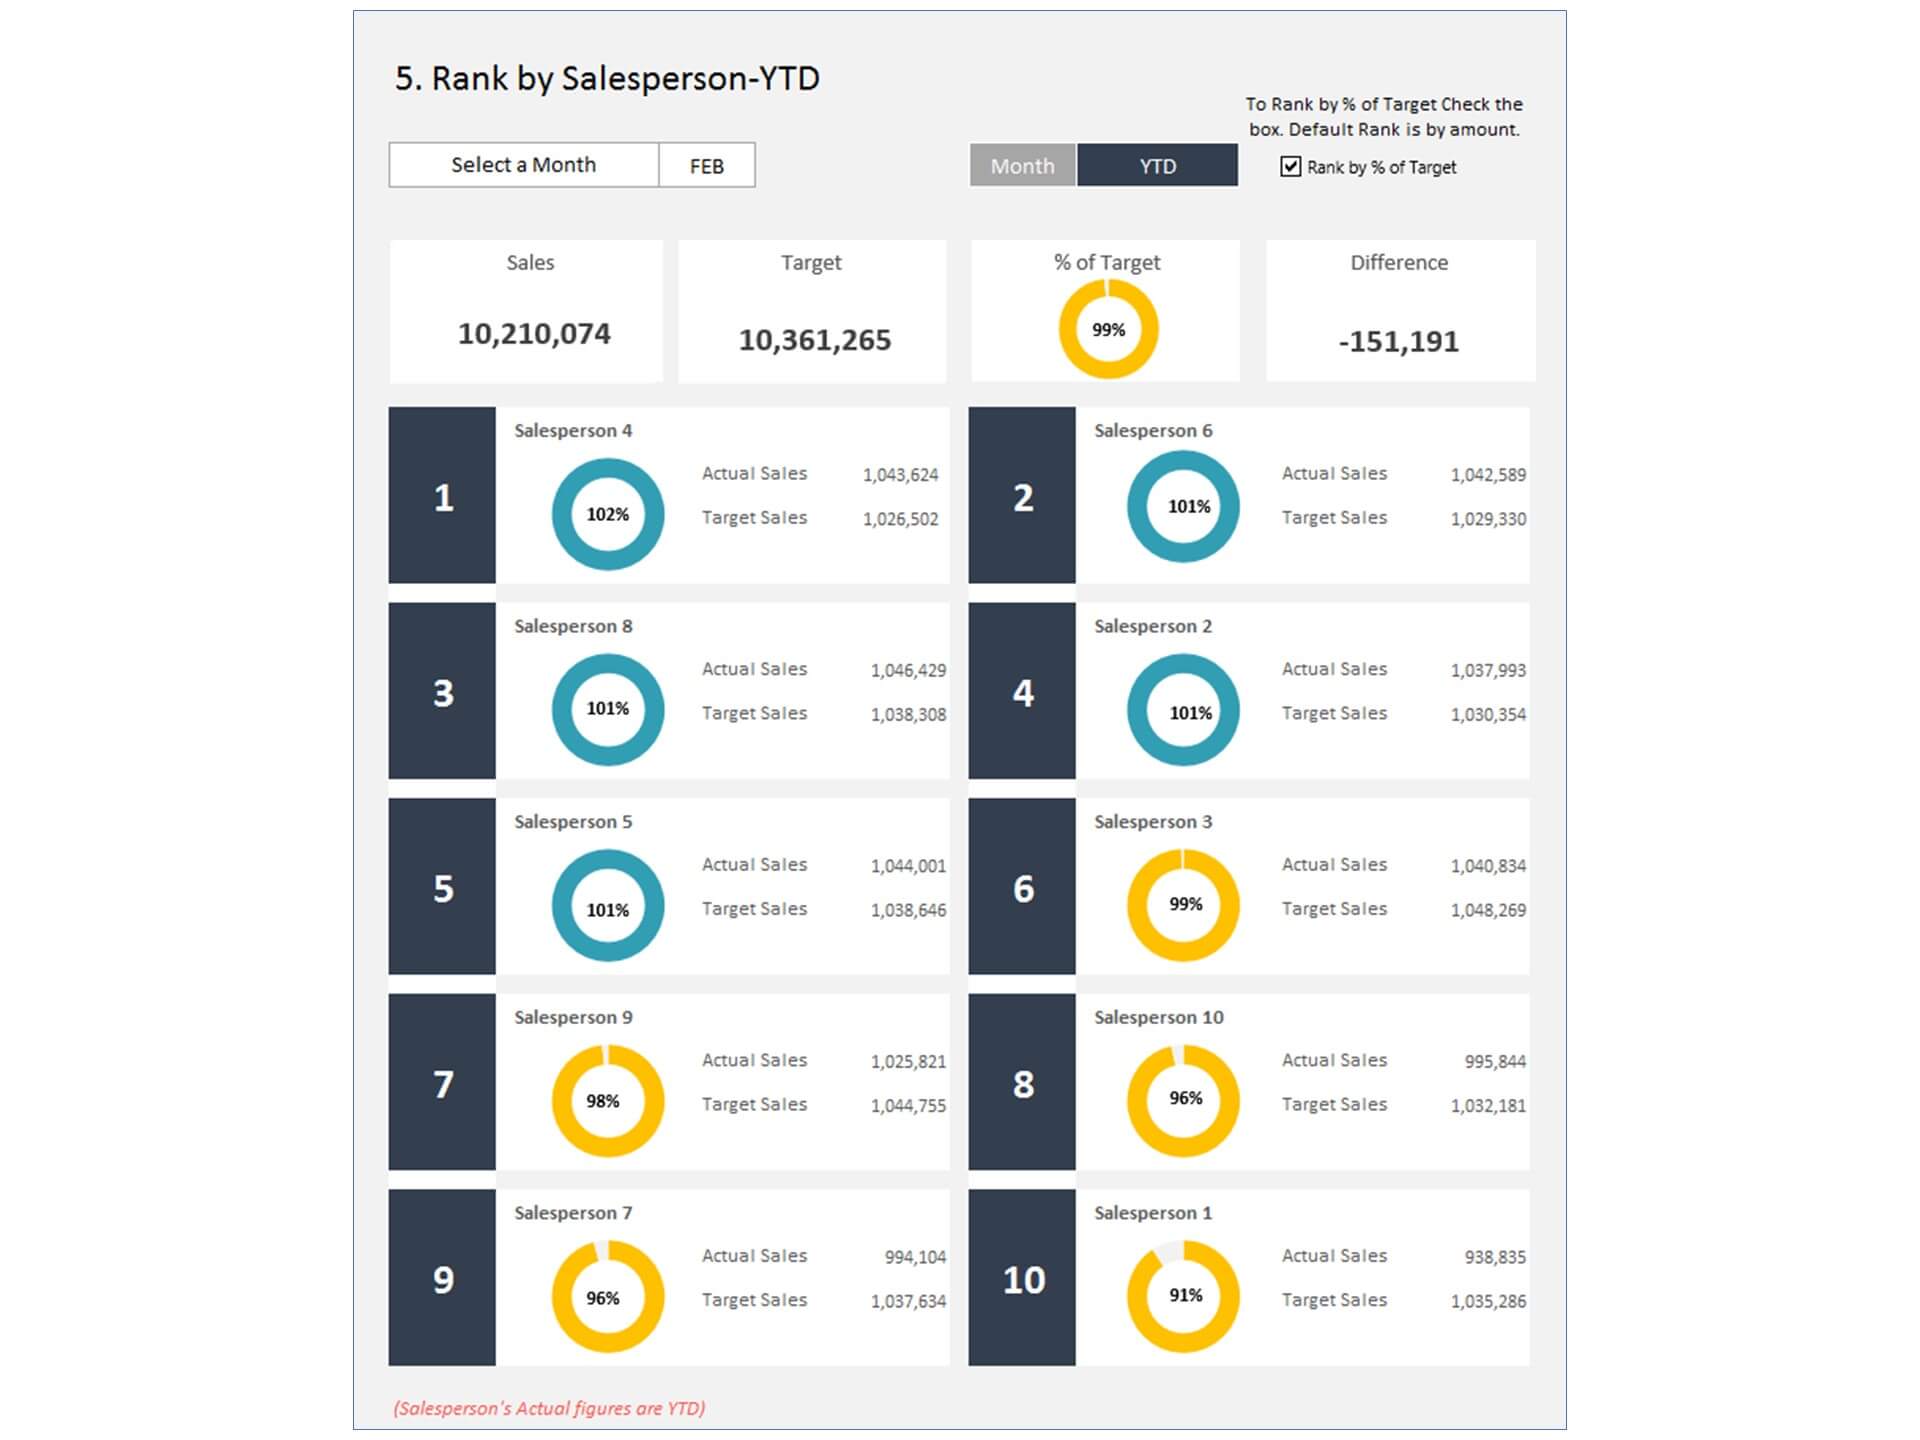
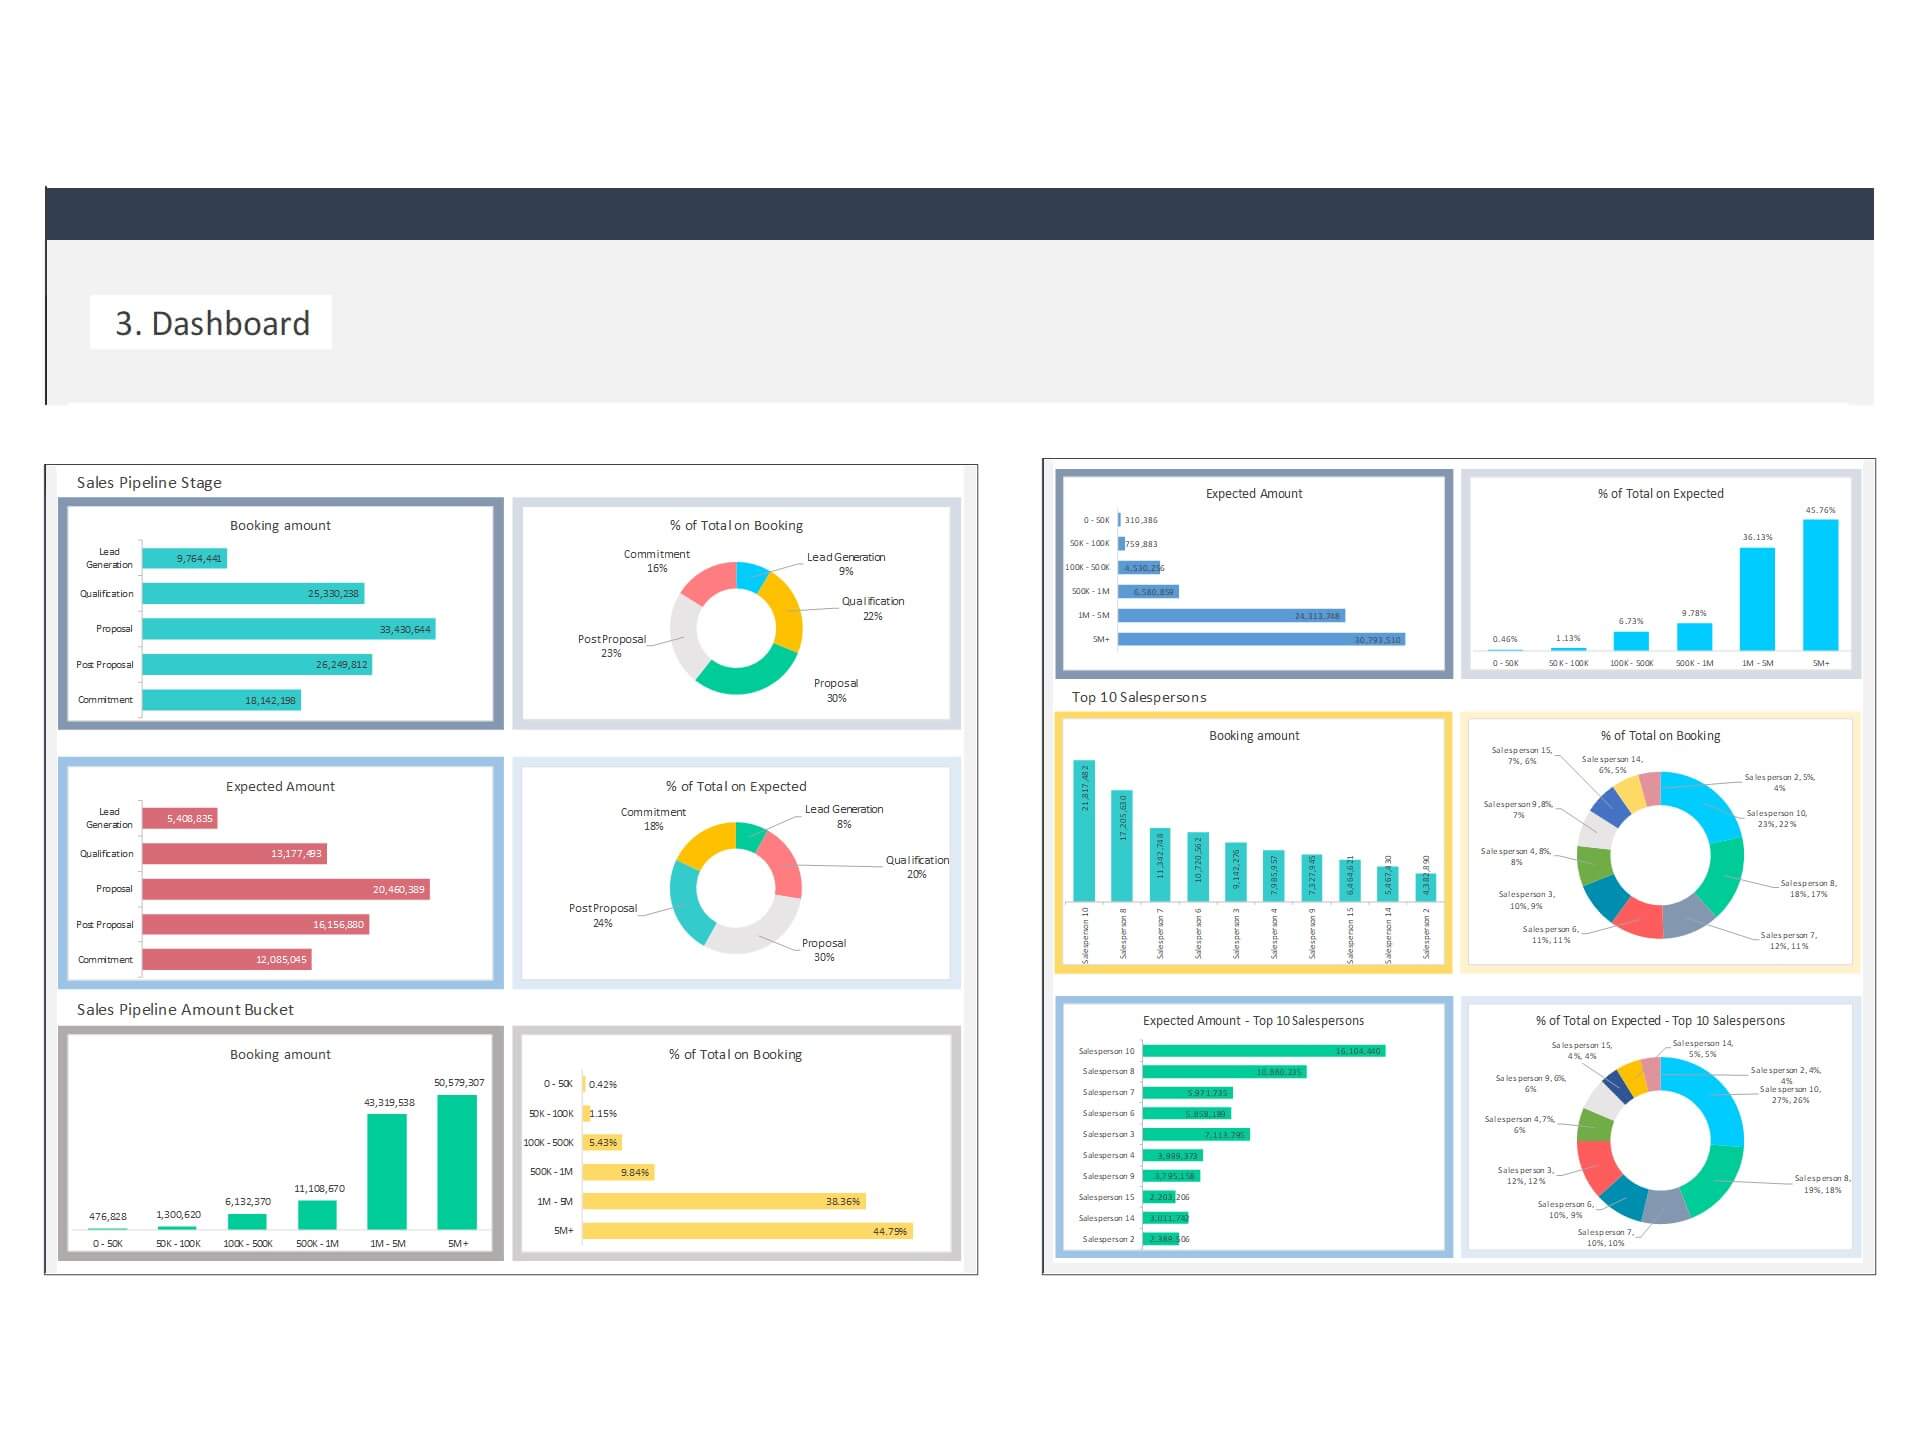
Enjoy faster and smoother goal-setting and record-keeping with these well-designed sales management dashboard templates that are intended to keep your business right on track. Make the right decisions and choices for your business, recording data in real-time, generating graphical representations, and tracking all sales-related data. Sales dashboard package includes Sales Team Dashboard, Sales Tracking Dashboard, Salespersons Performance Dashboard, Sales Budget vs Actual Dashboard and Sales KPI Dashboard.
These sales dashboard templates will equip your managers will the right tools, data, and information to help them strategize and make important procedural decisions.


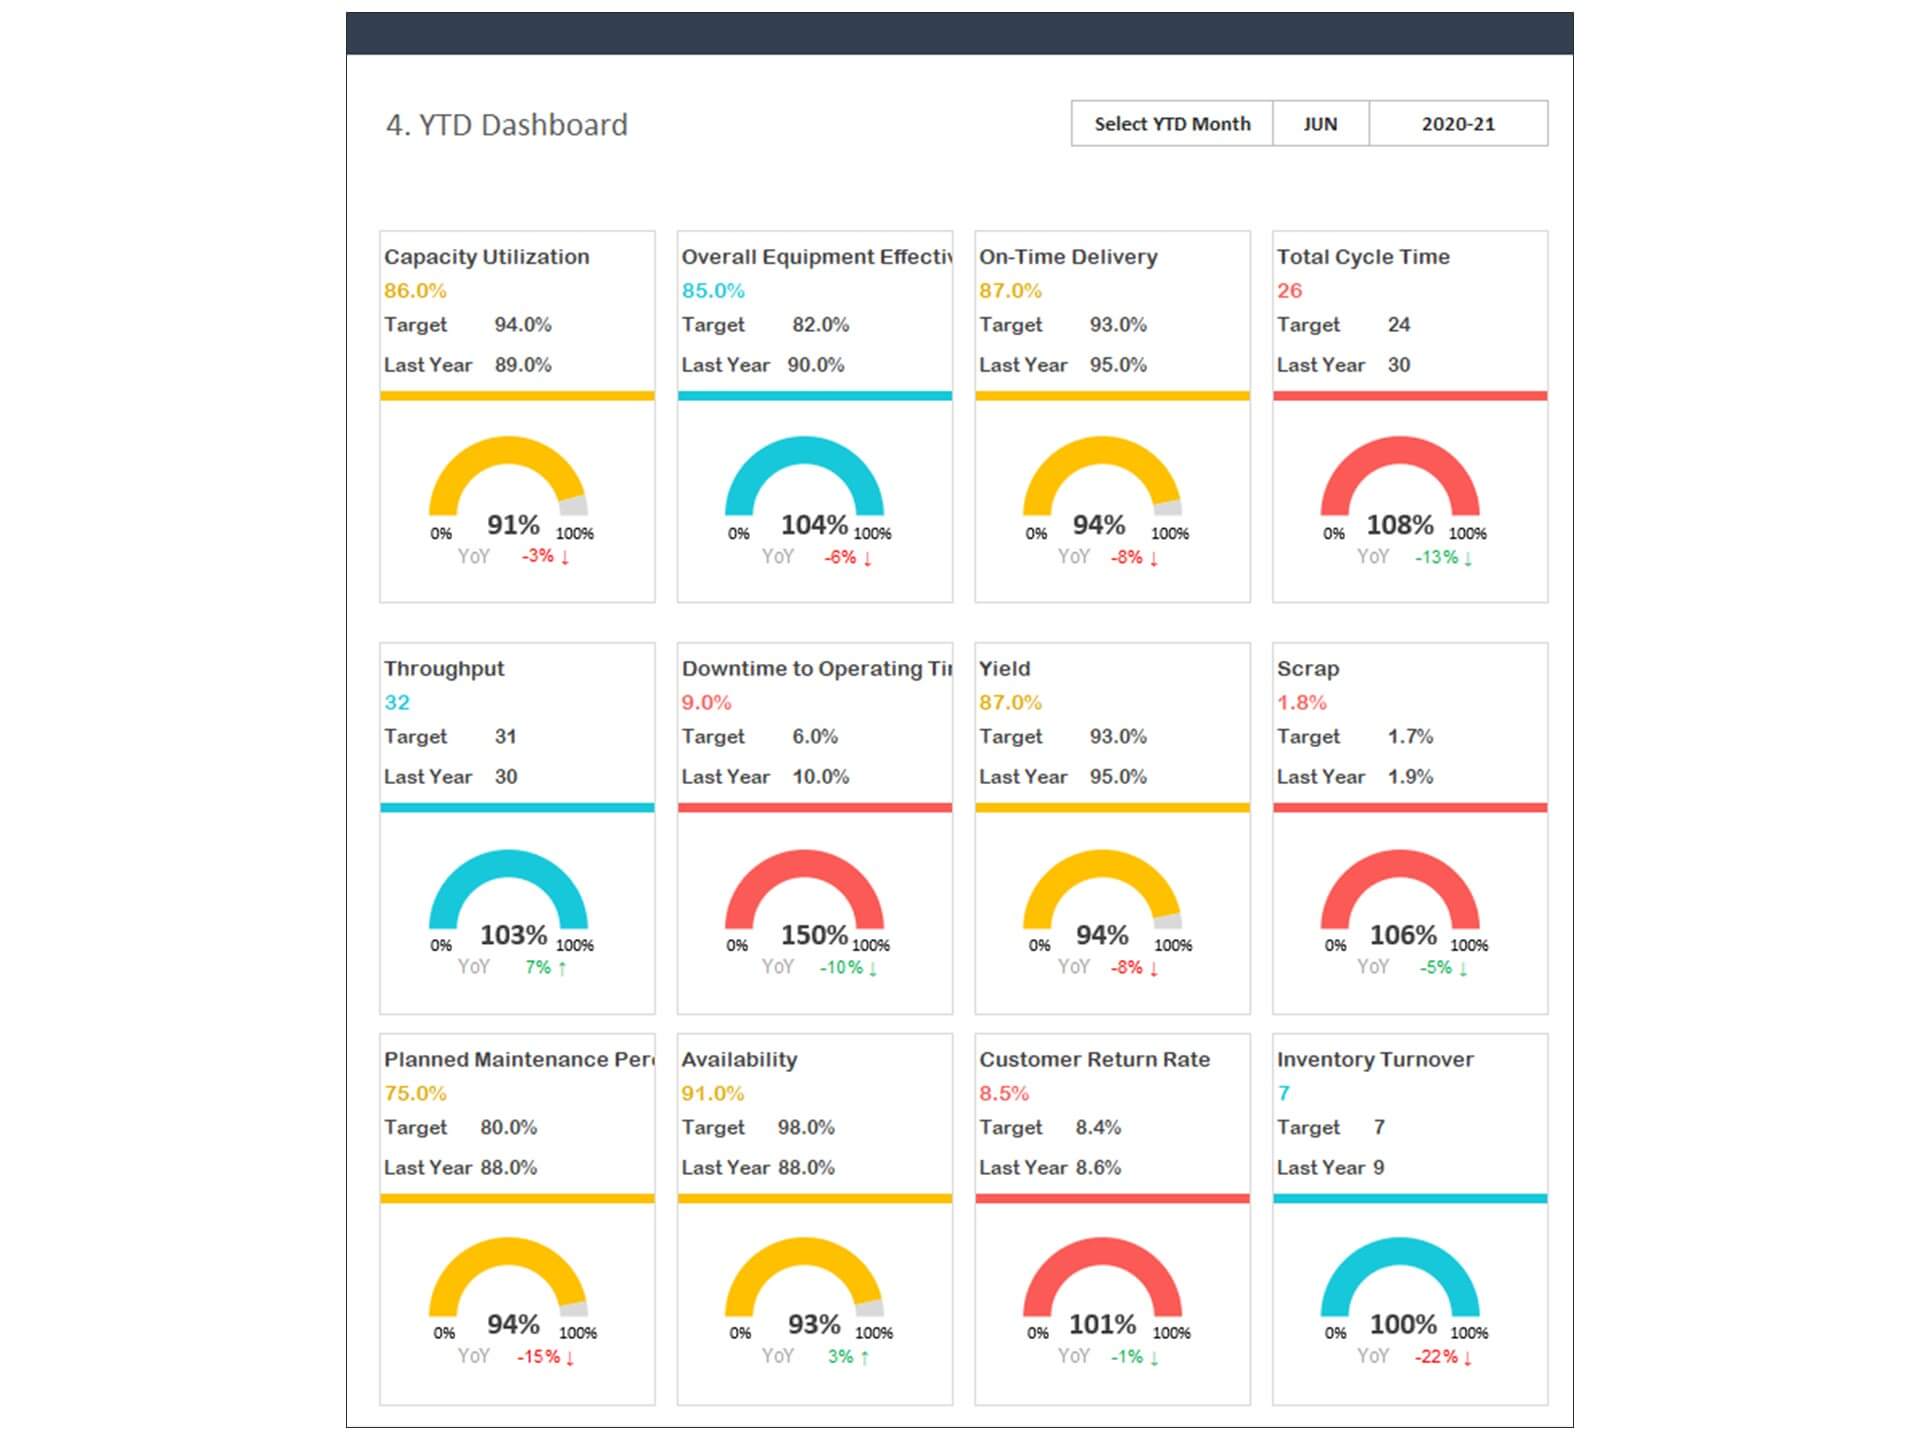
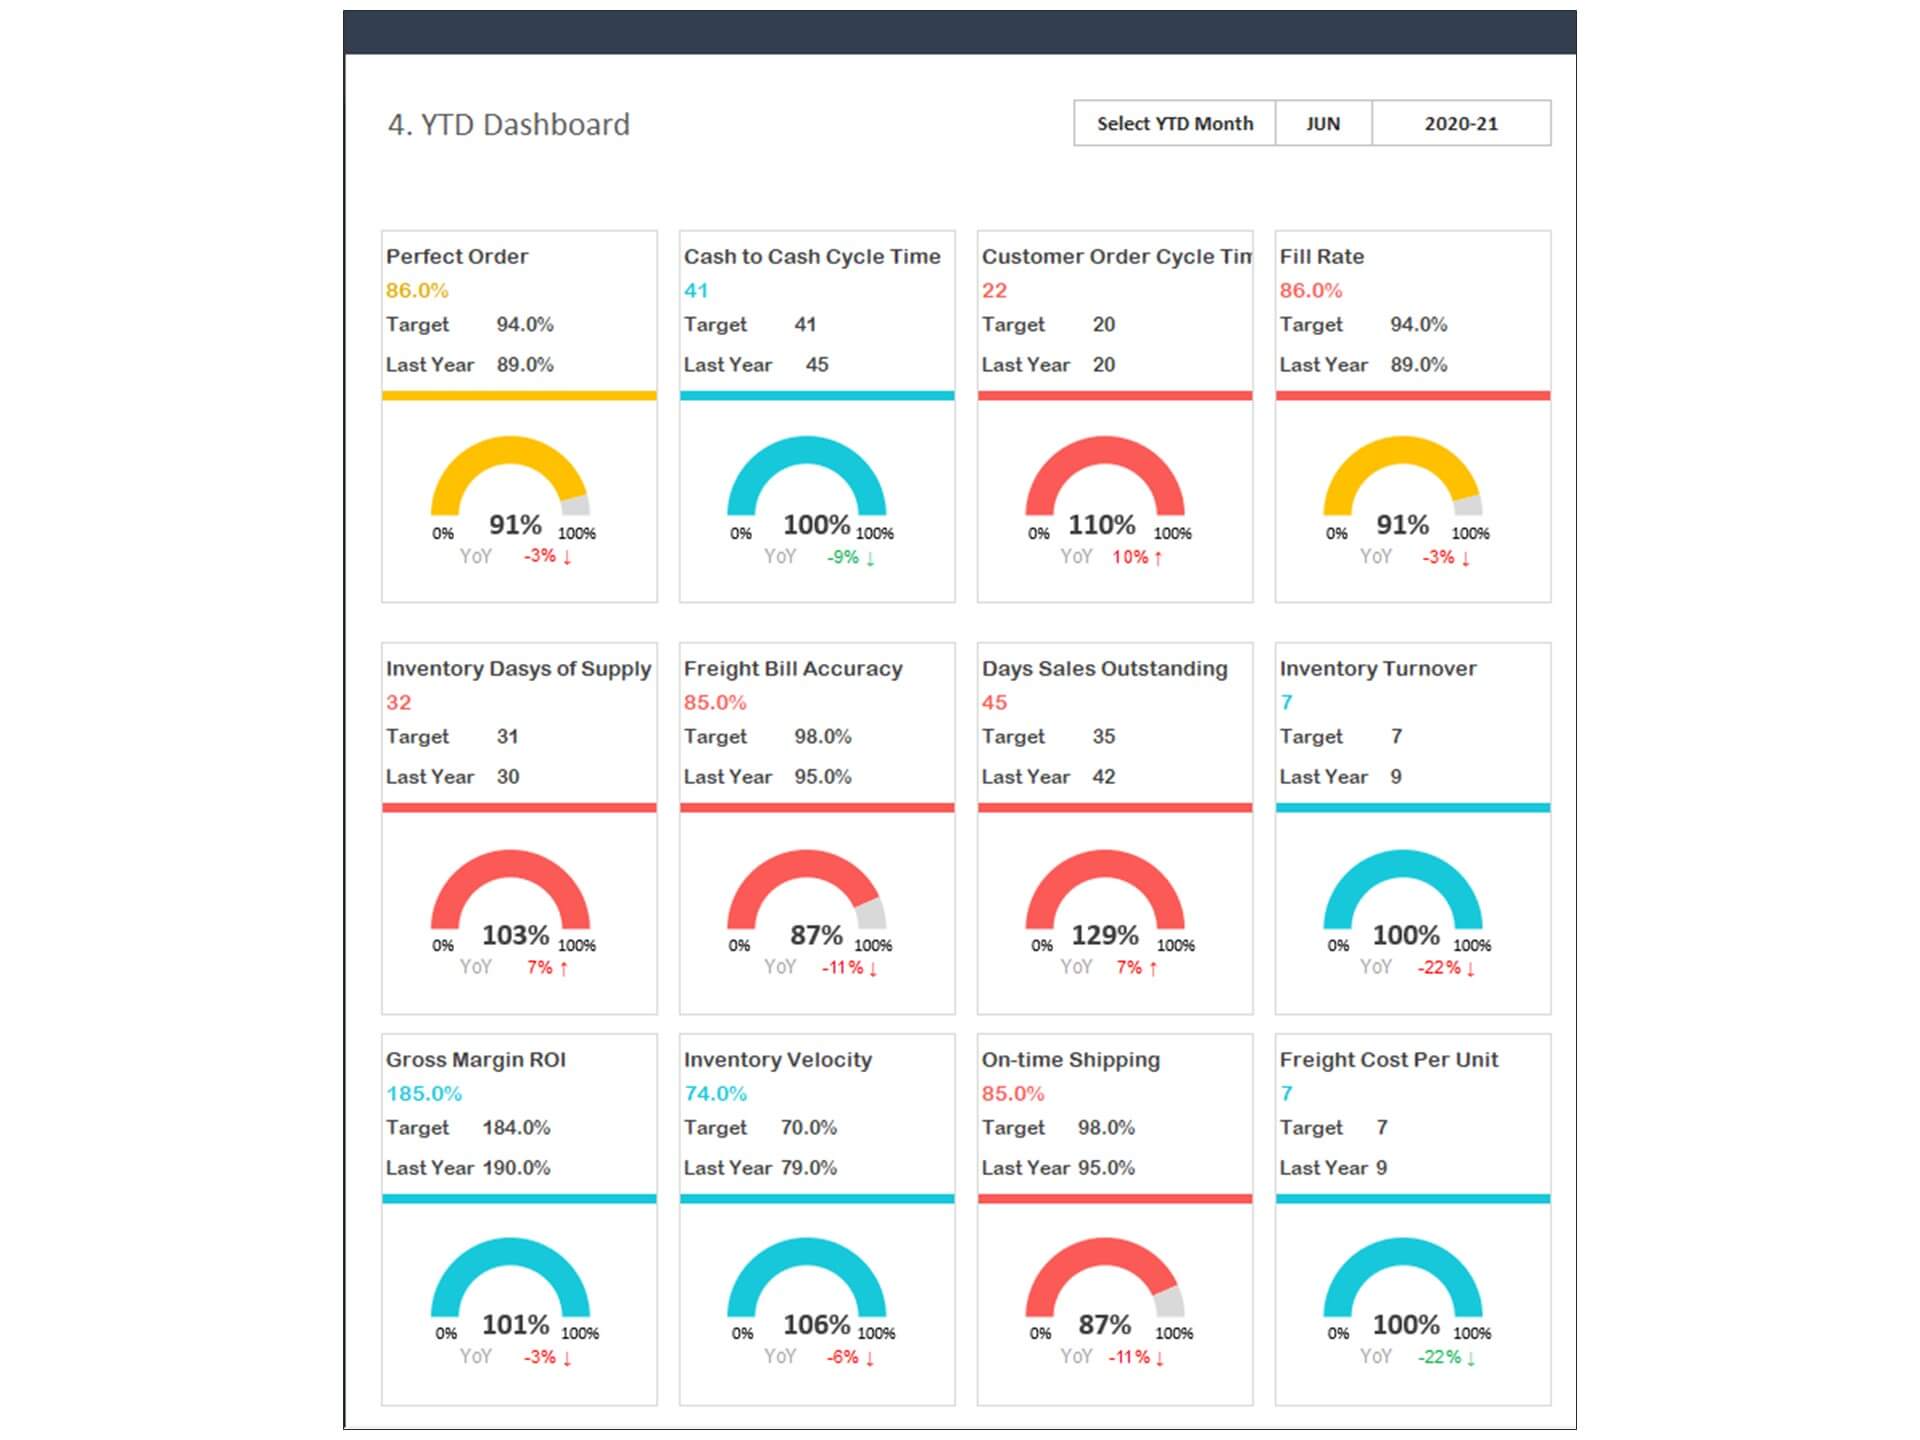
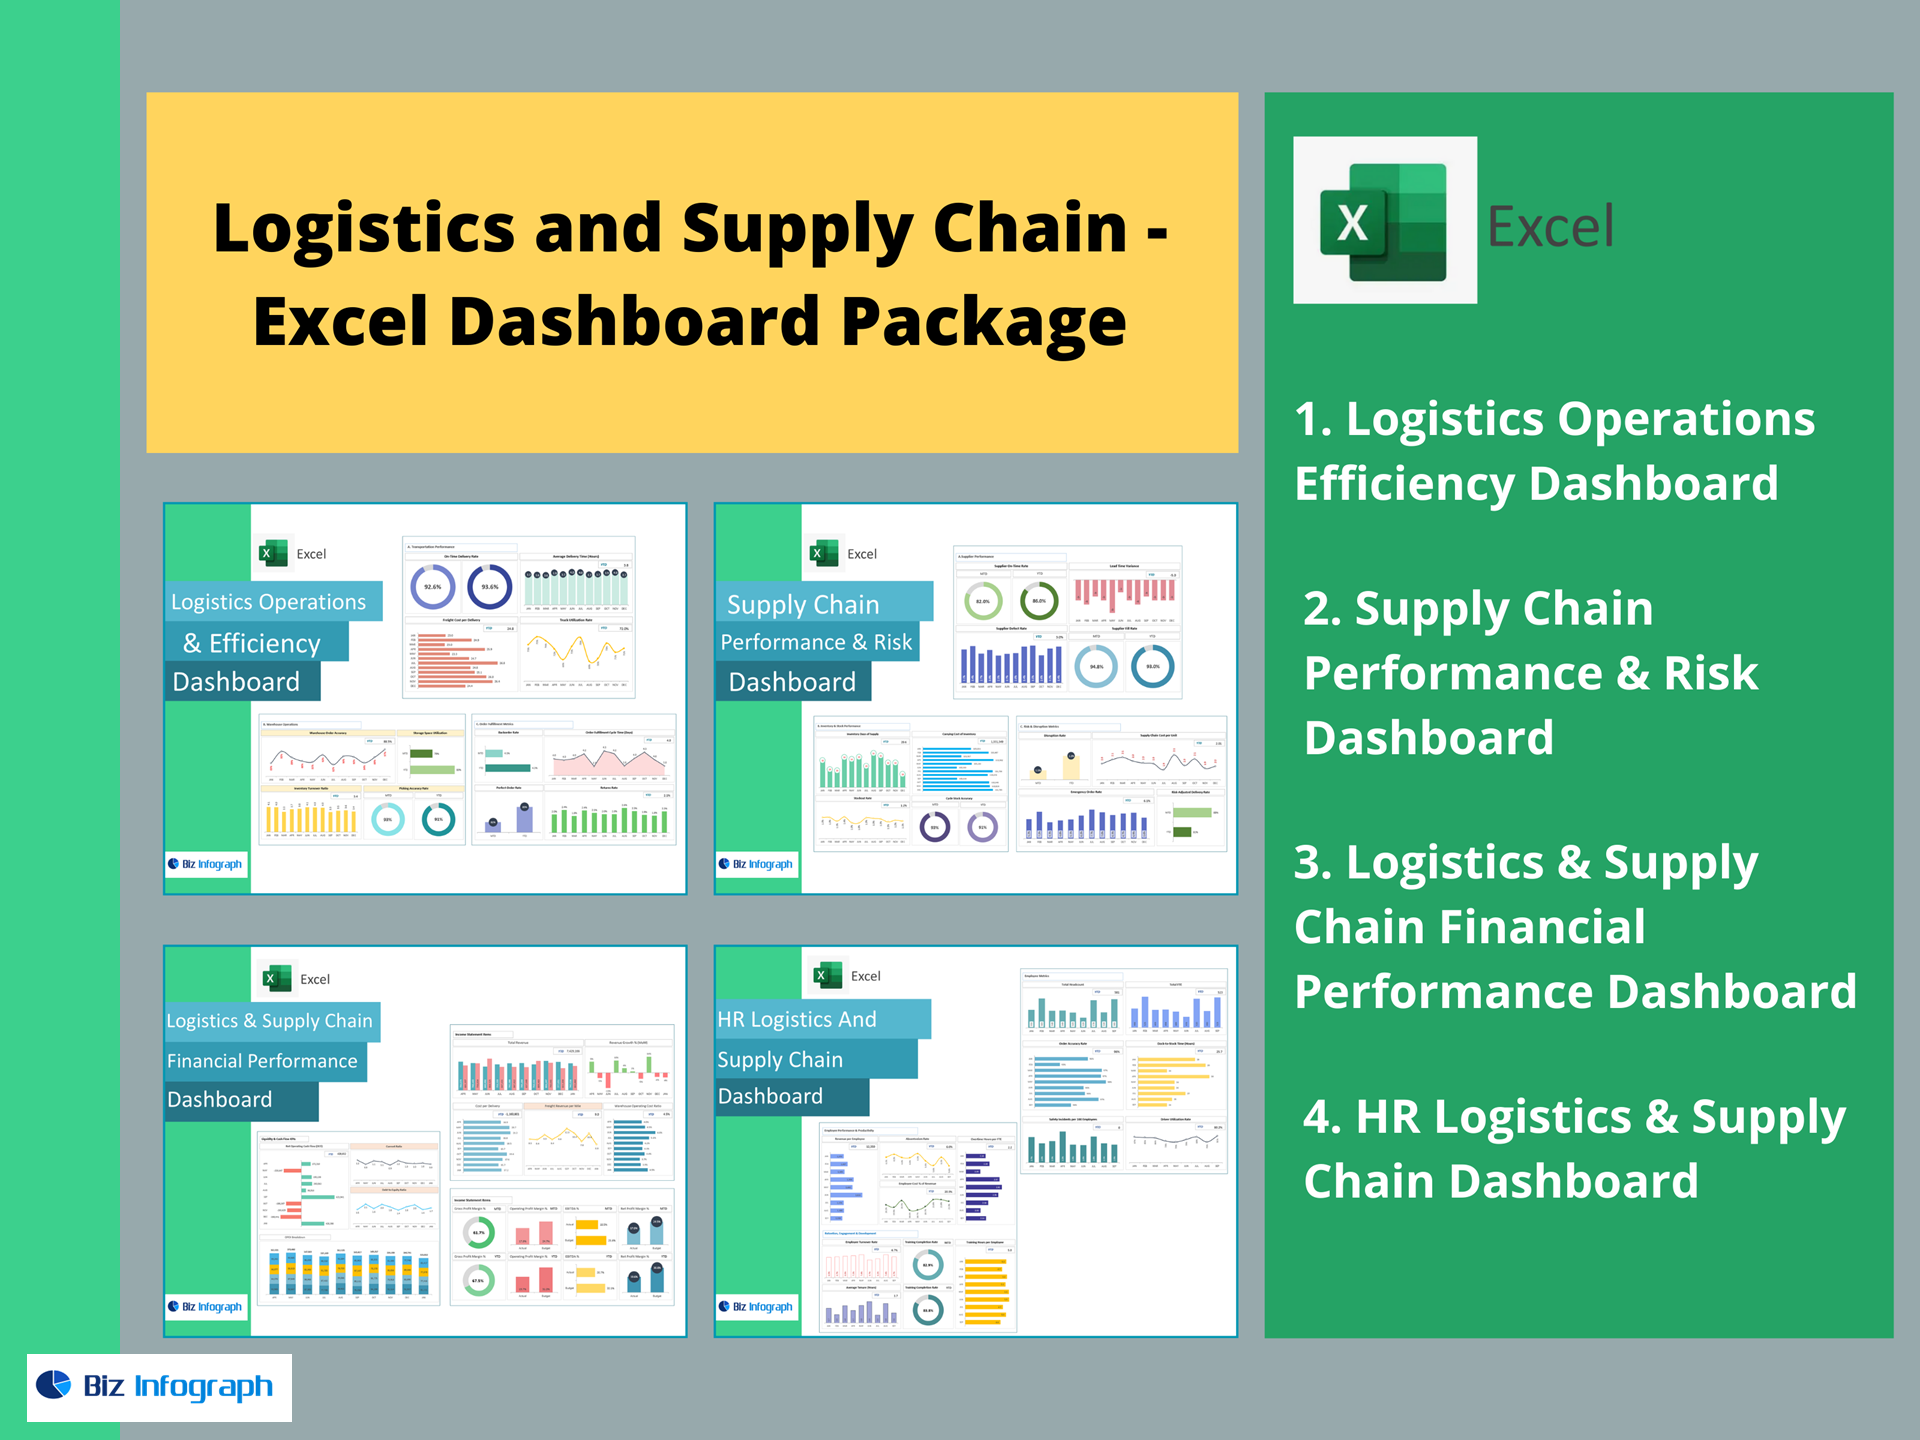
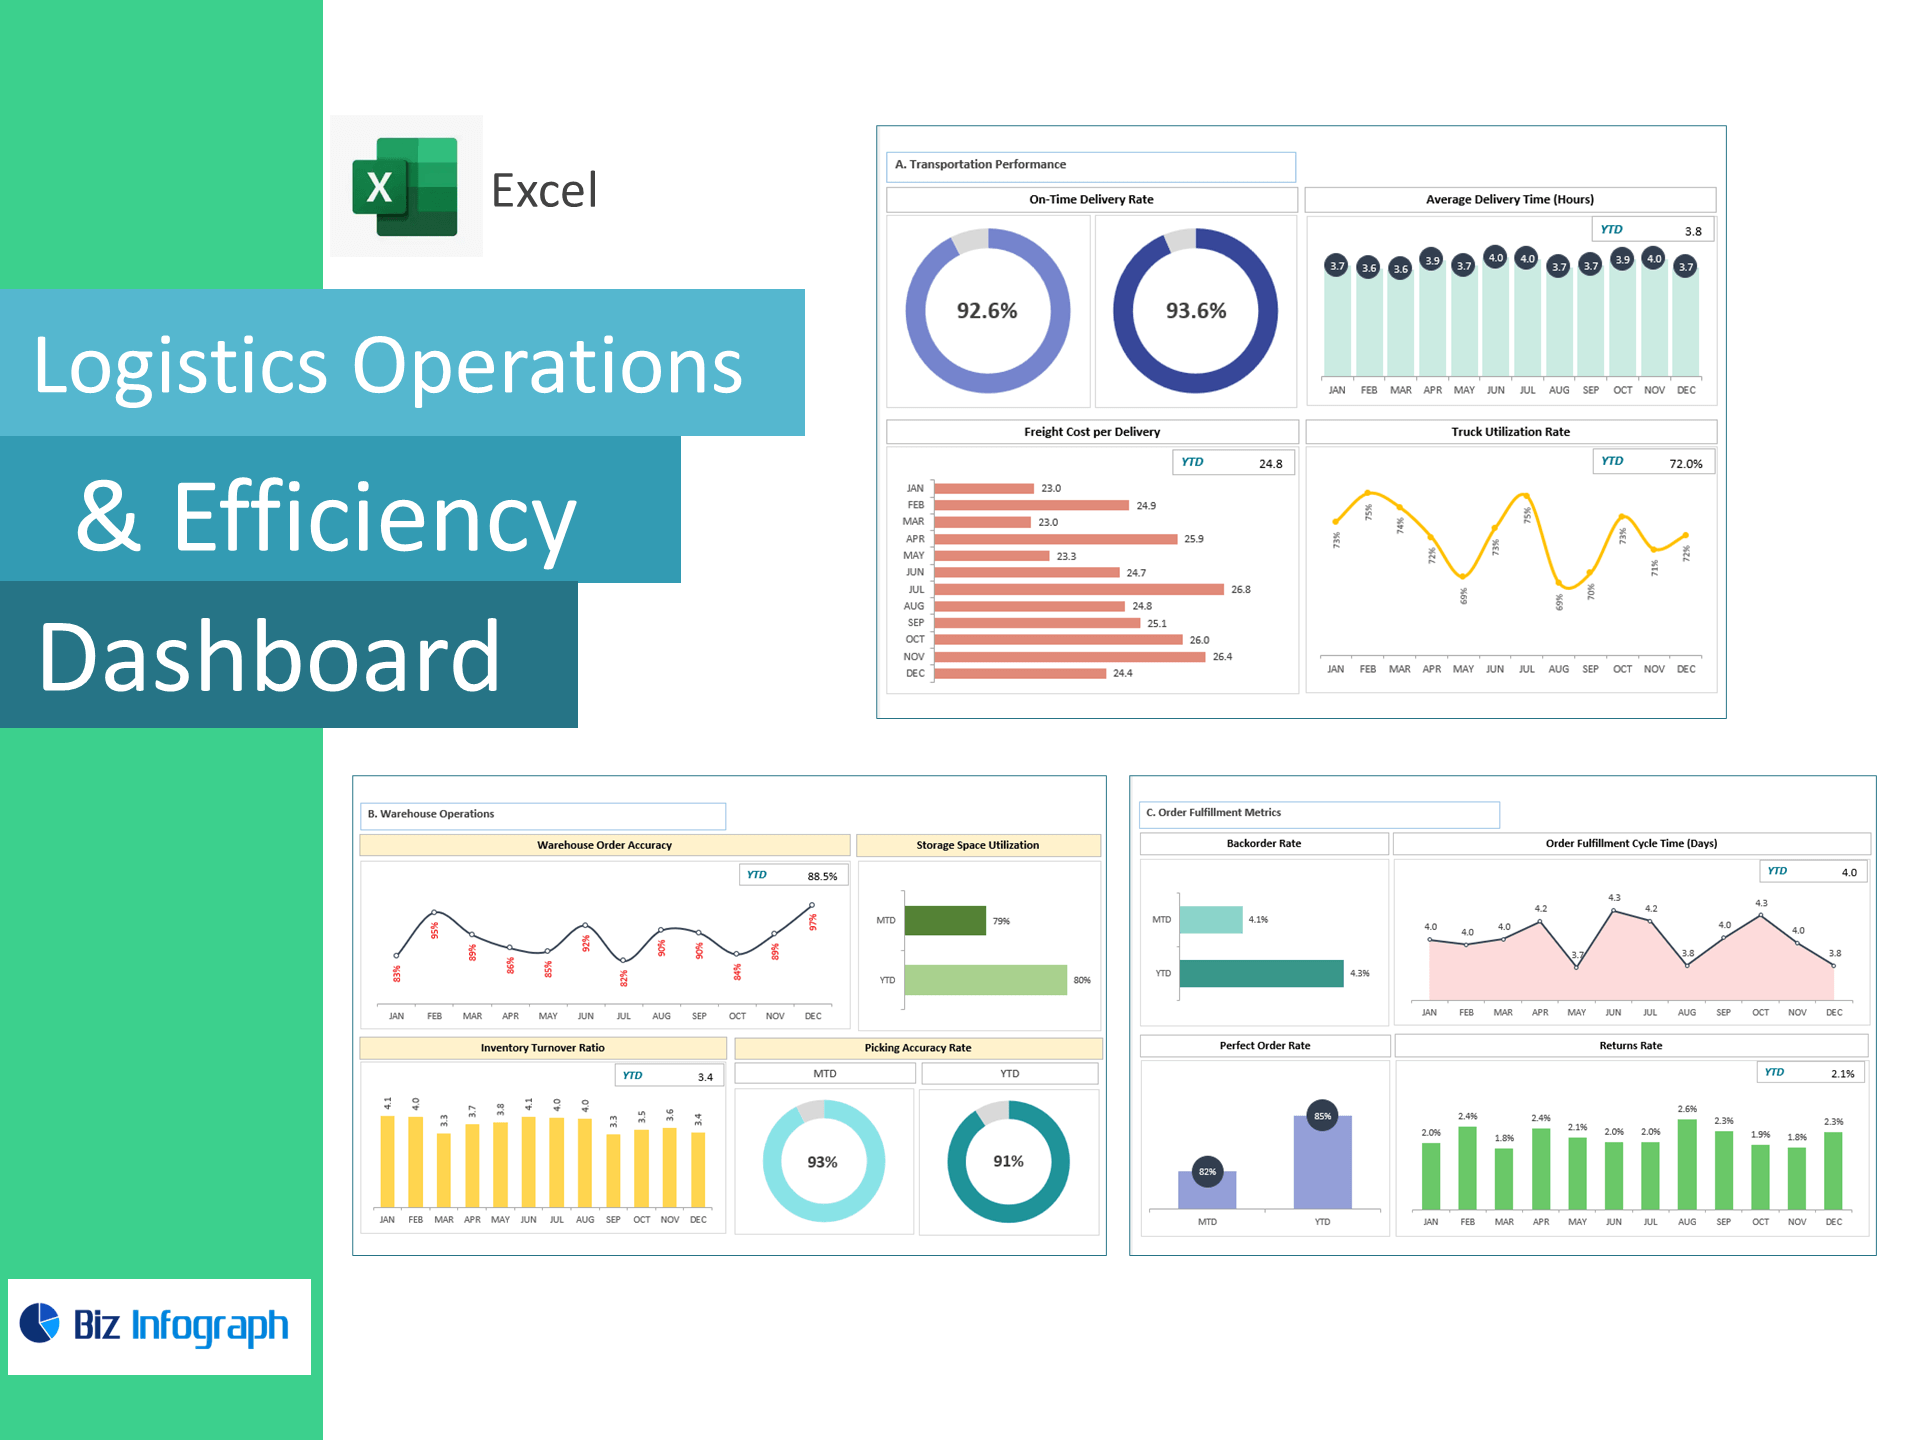
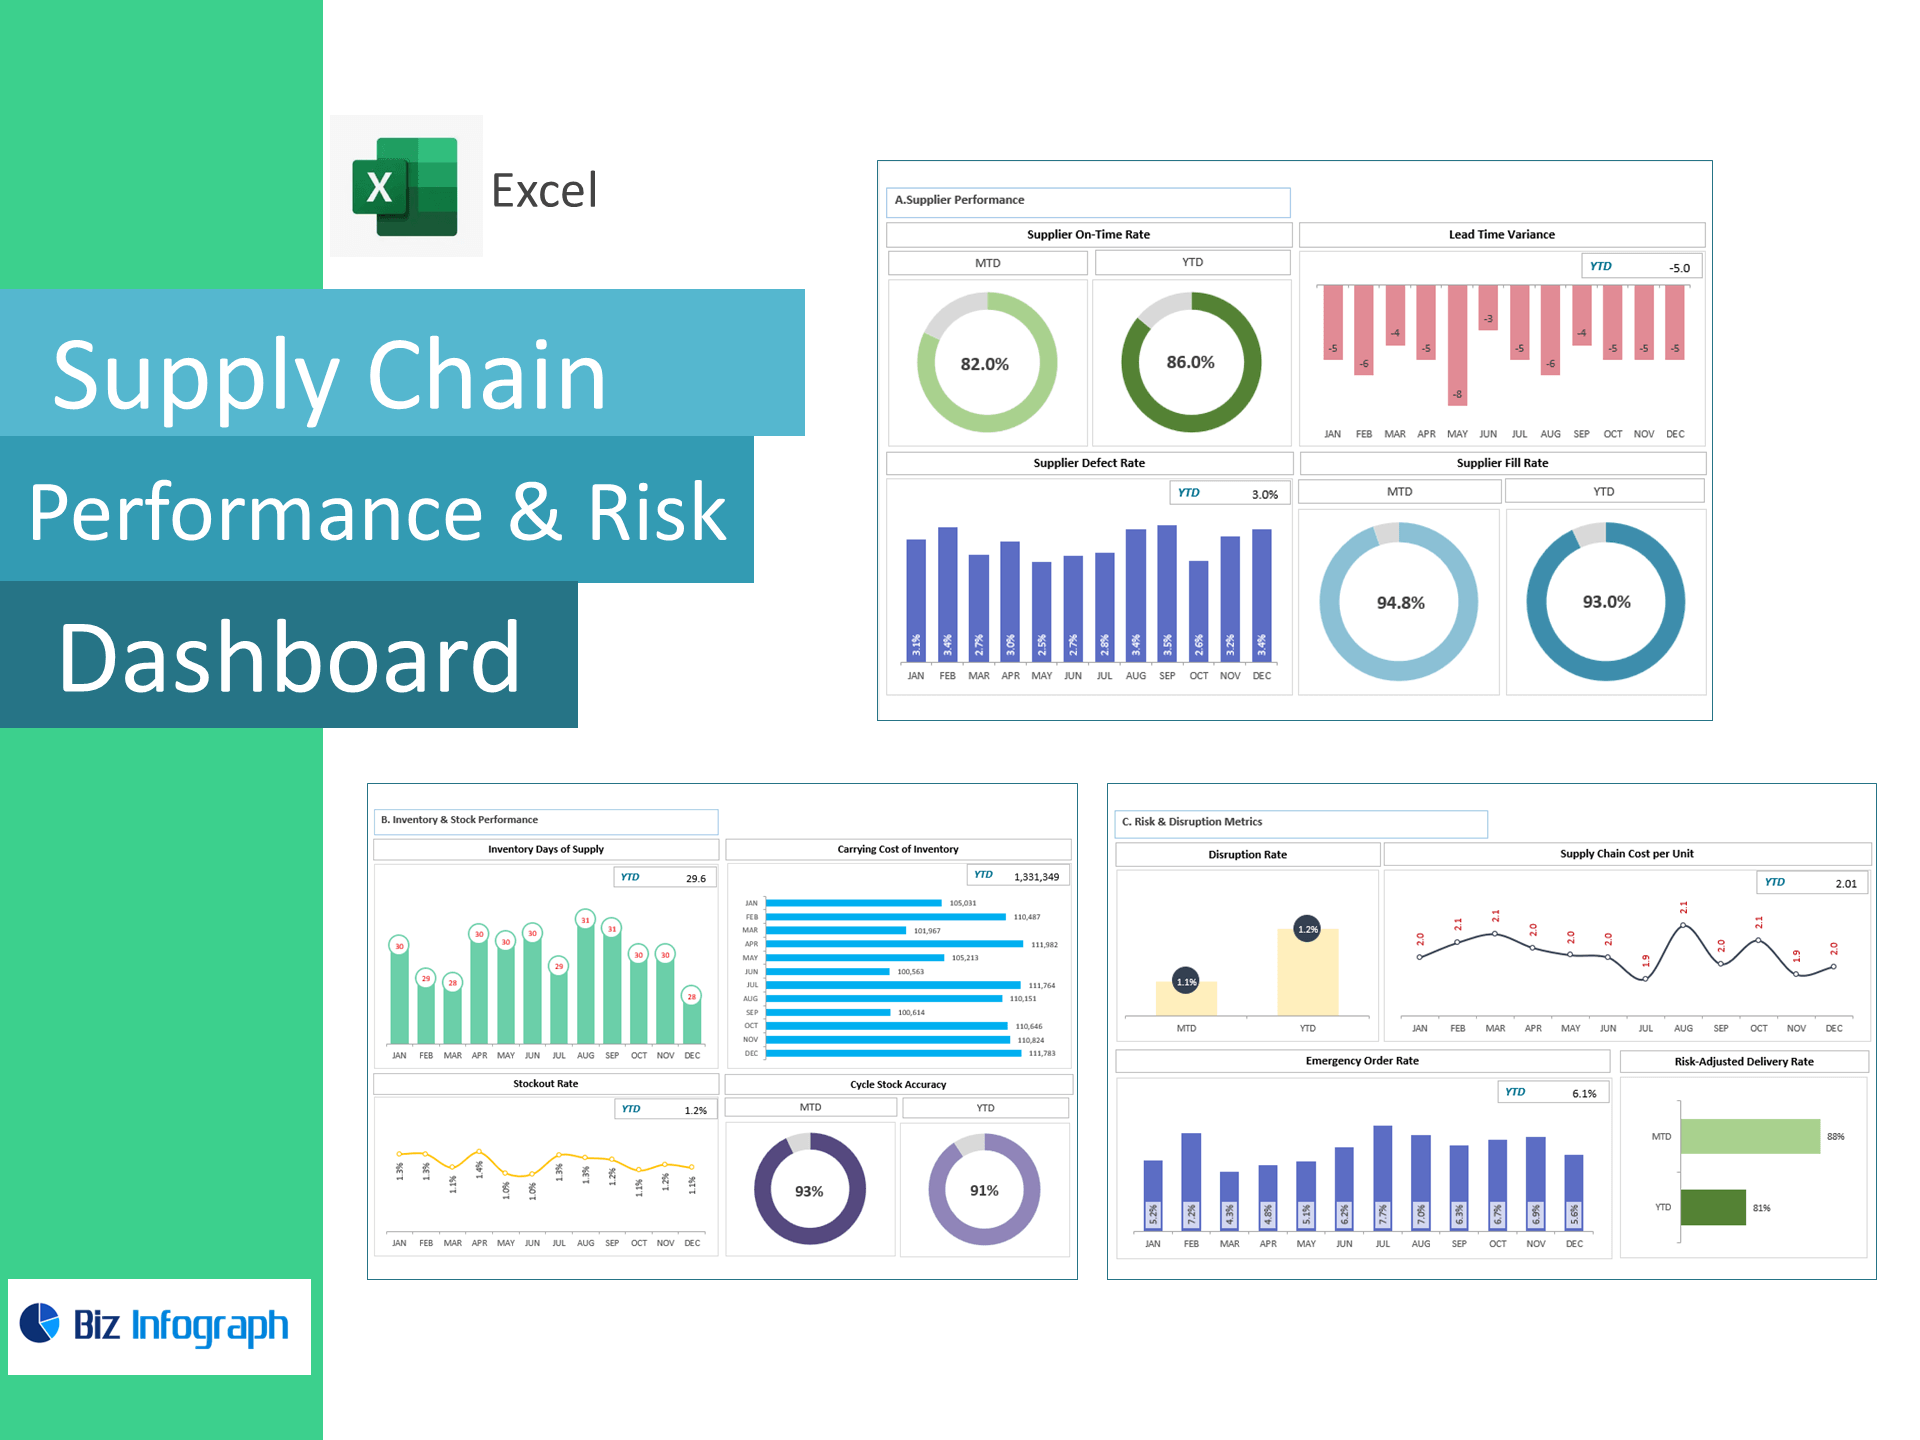
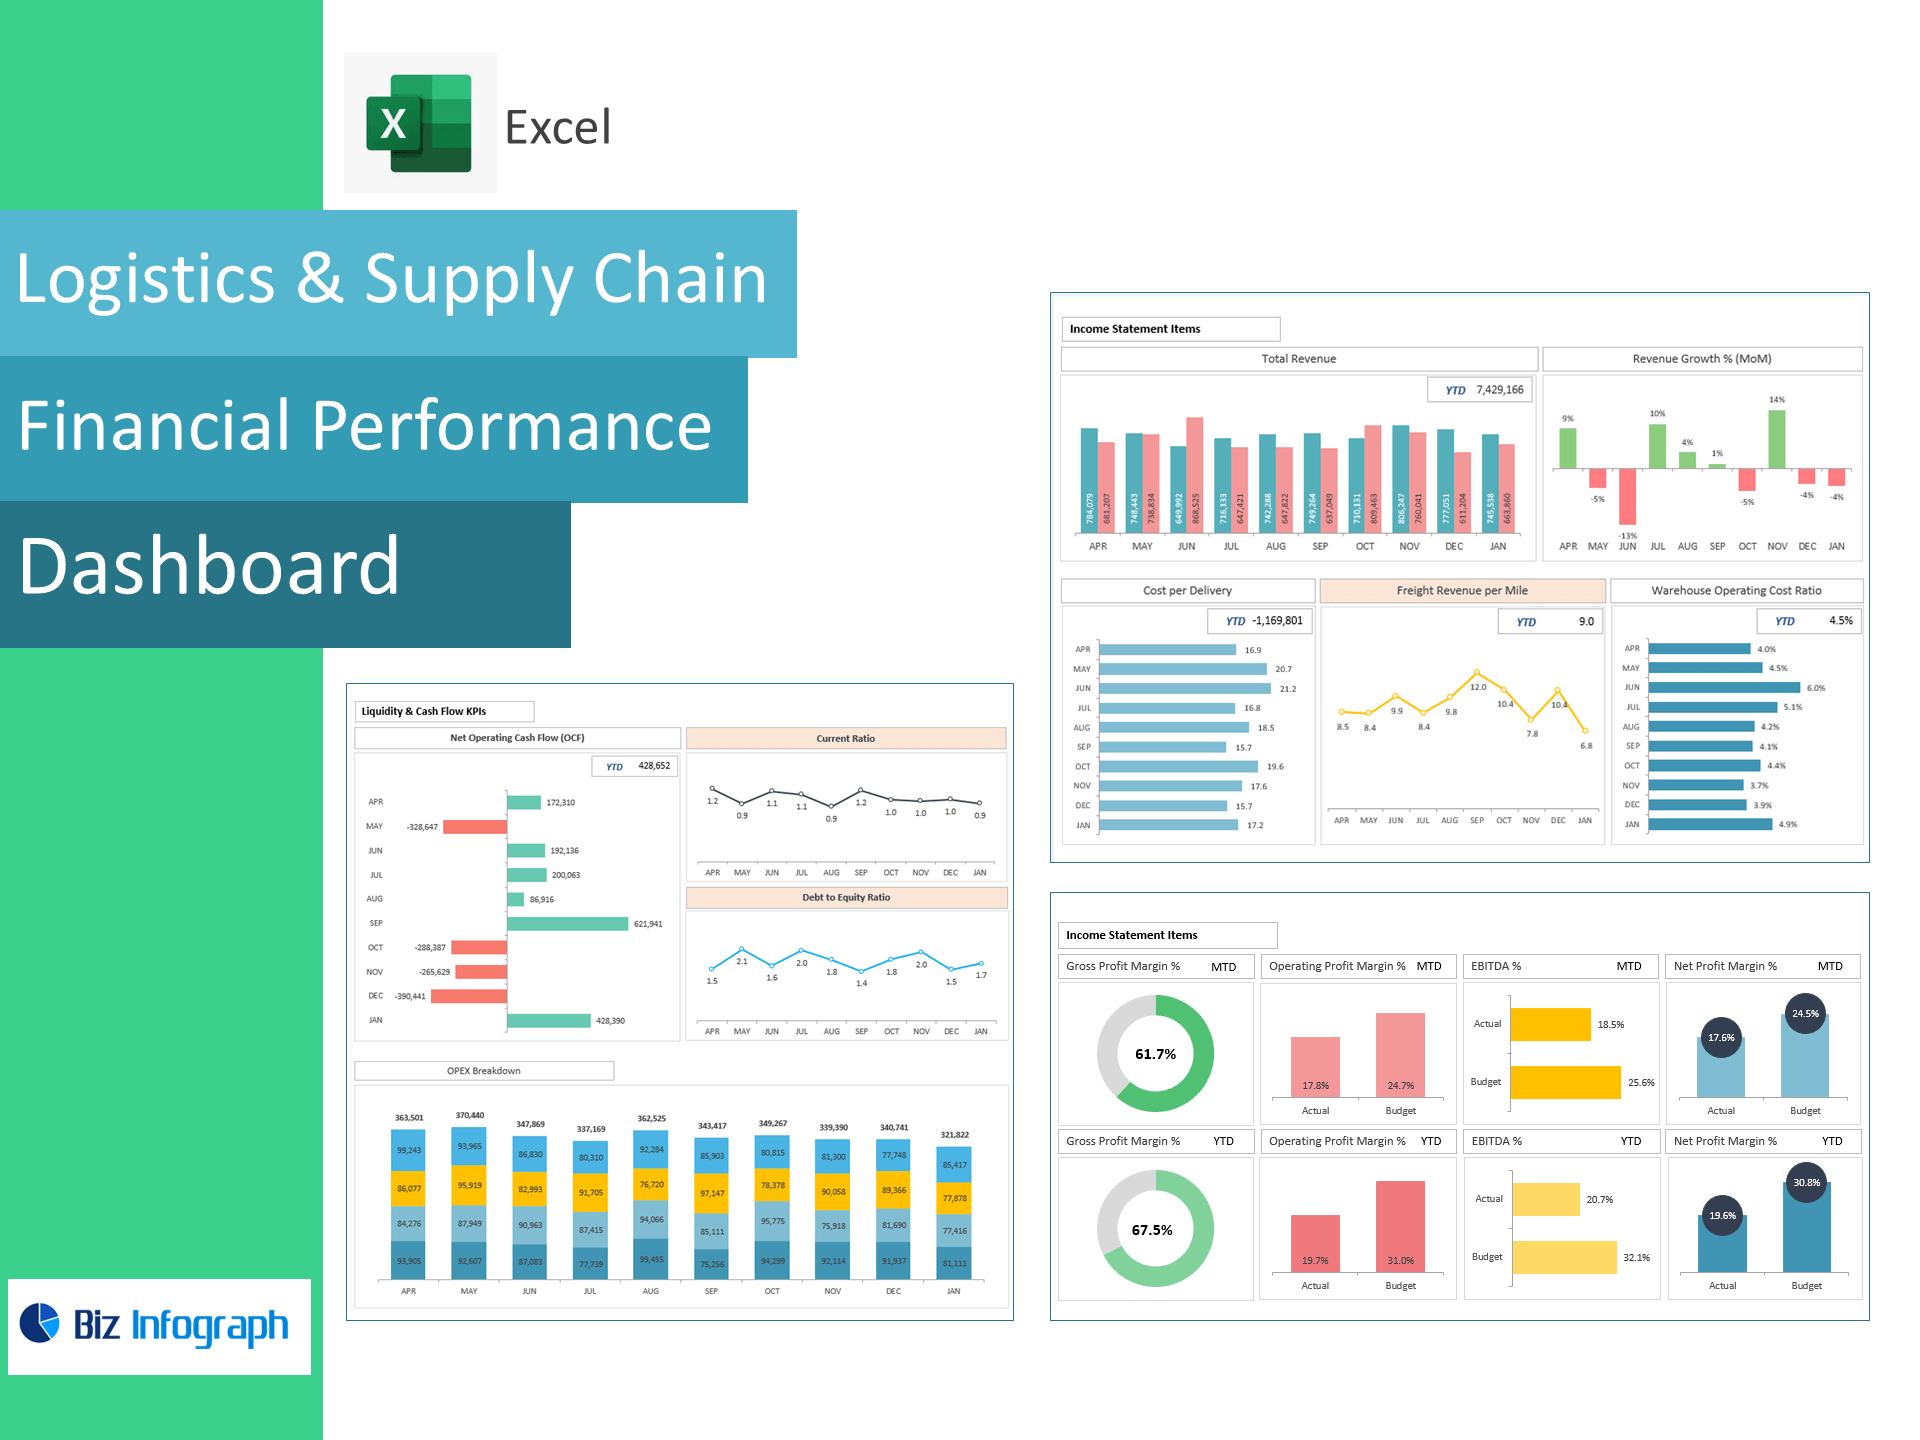
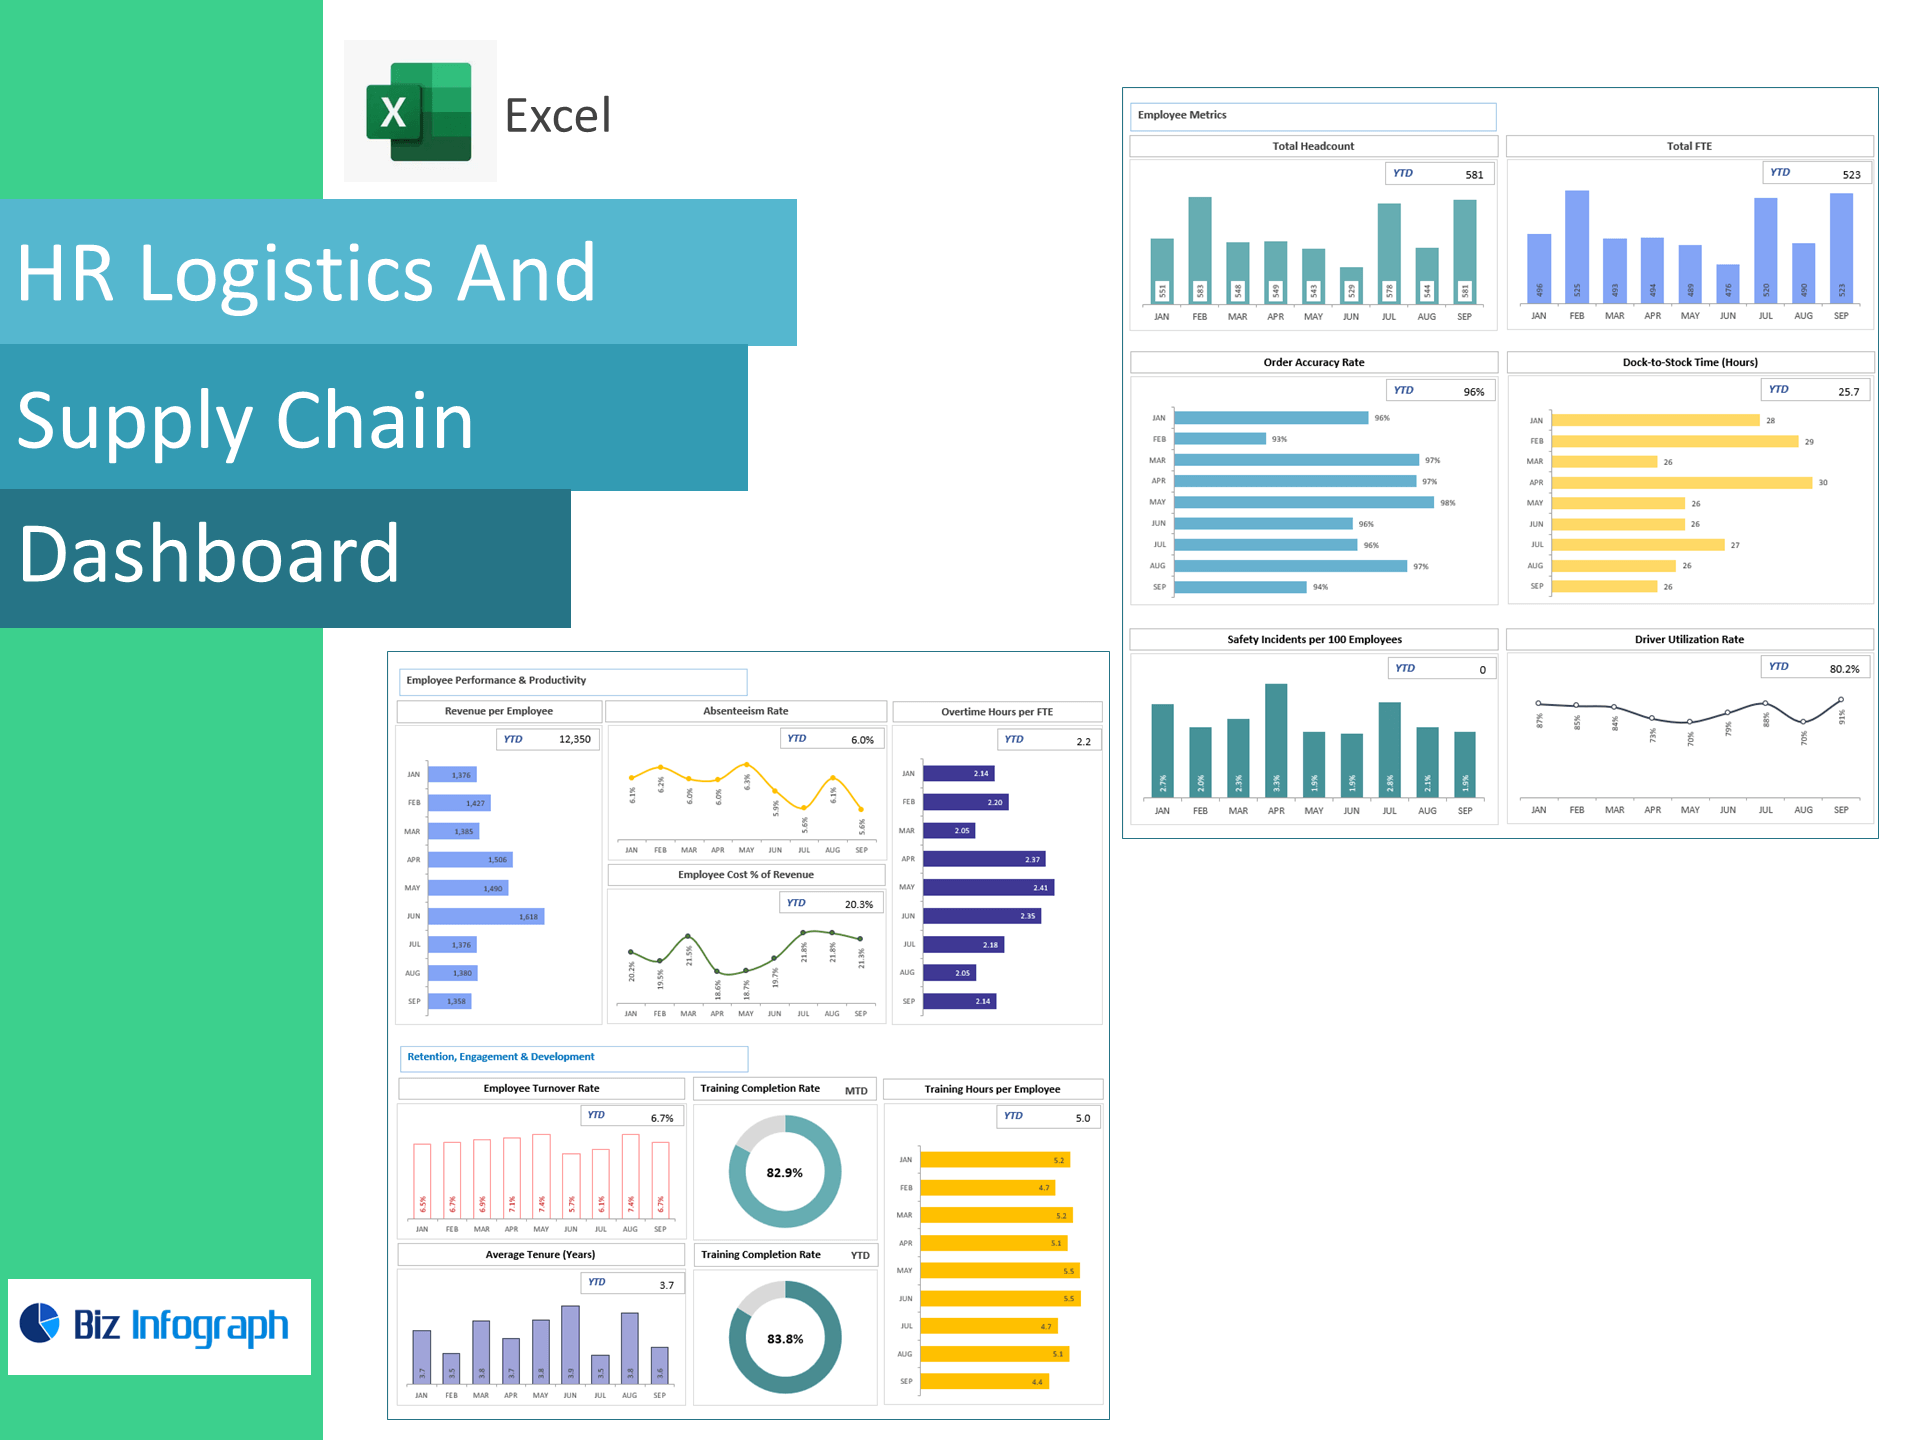
The Logistics and Supply Chain Excel Dashboard Package is a powerful all-in-one solution designed to give supply chain professionals, logistics managers, and operational decision-makers full visibility into key performance indicators across logistics operations. This package includes four expertly crafted dashboards: Logistics Operations Efficiency, Supply Chain Performance & Risk, Financial Performance, and HR Logistics & Supply Chain. Each dashboard leverages Excel’s dynamic features to visualize real-time metrics such as delivery timelines, risk indicators, warehousing KPIs, and workforce efficiency. With a clear, interactive layout and actionable insights, this package helps organizations optimize inventory, reduce delays, streamline workflows, and boost supply chain performance across the board.
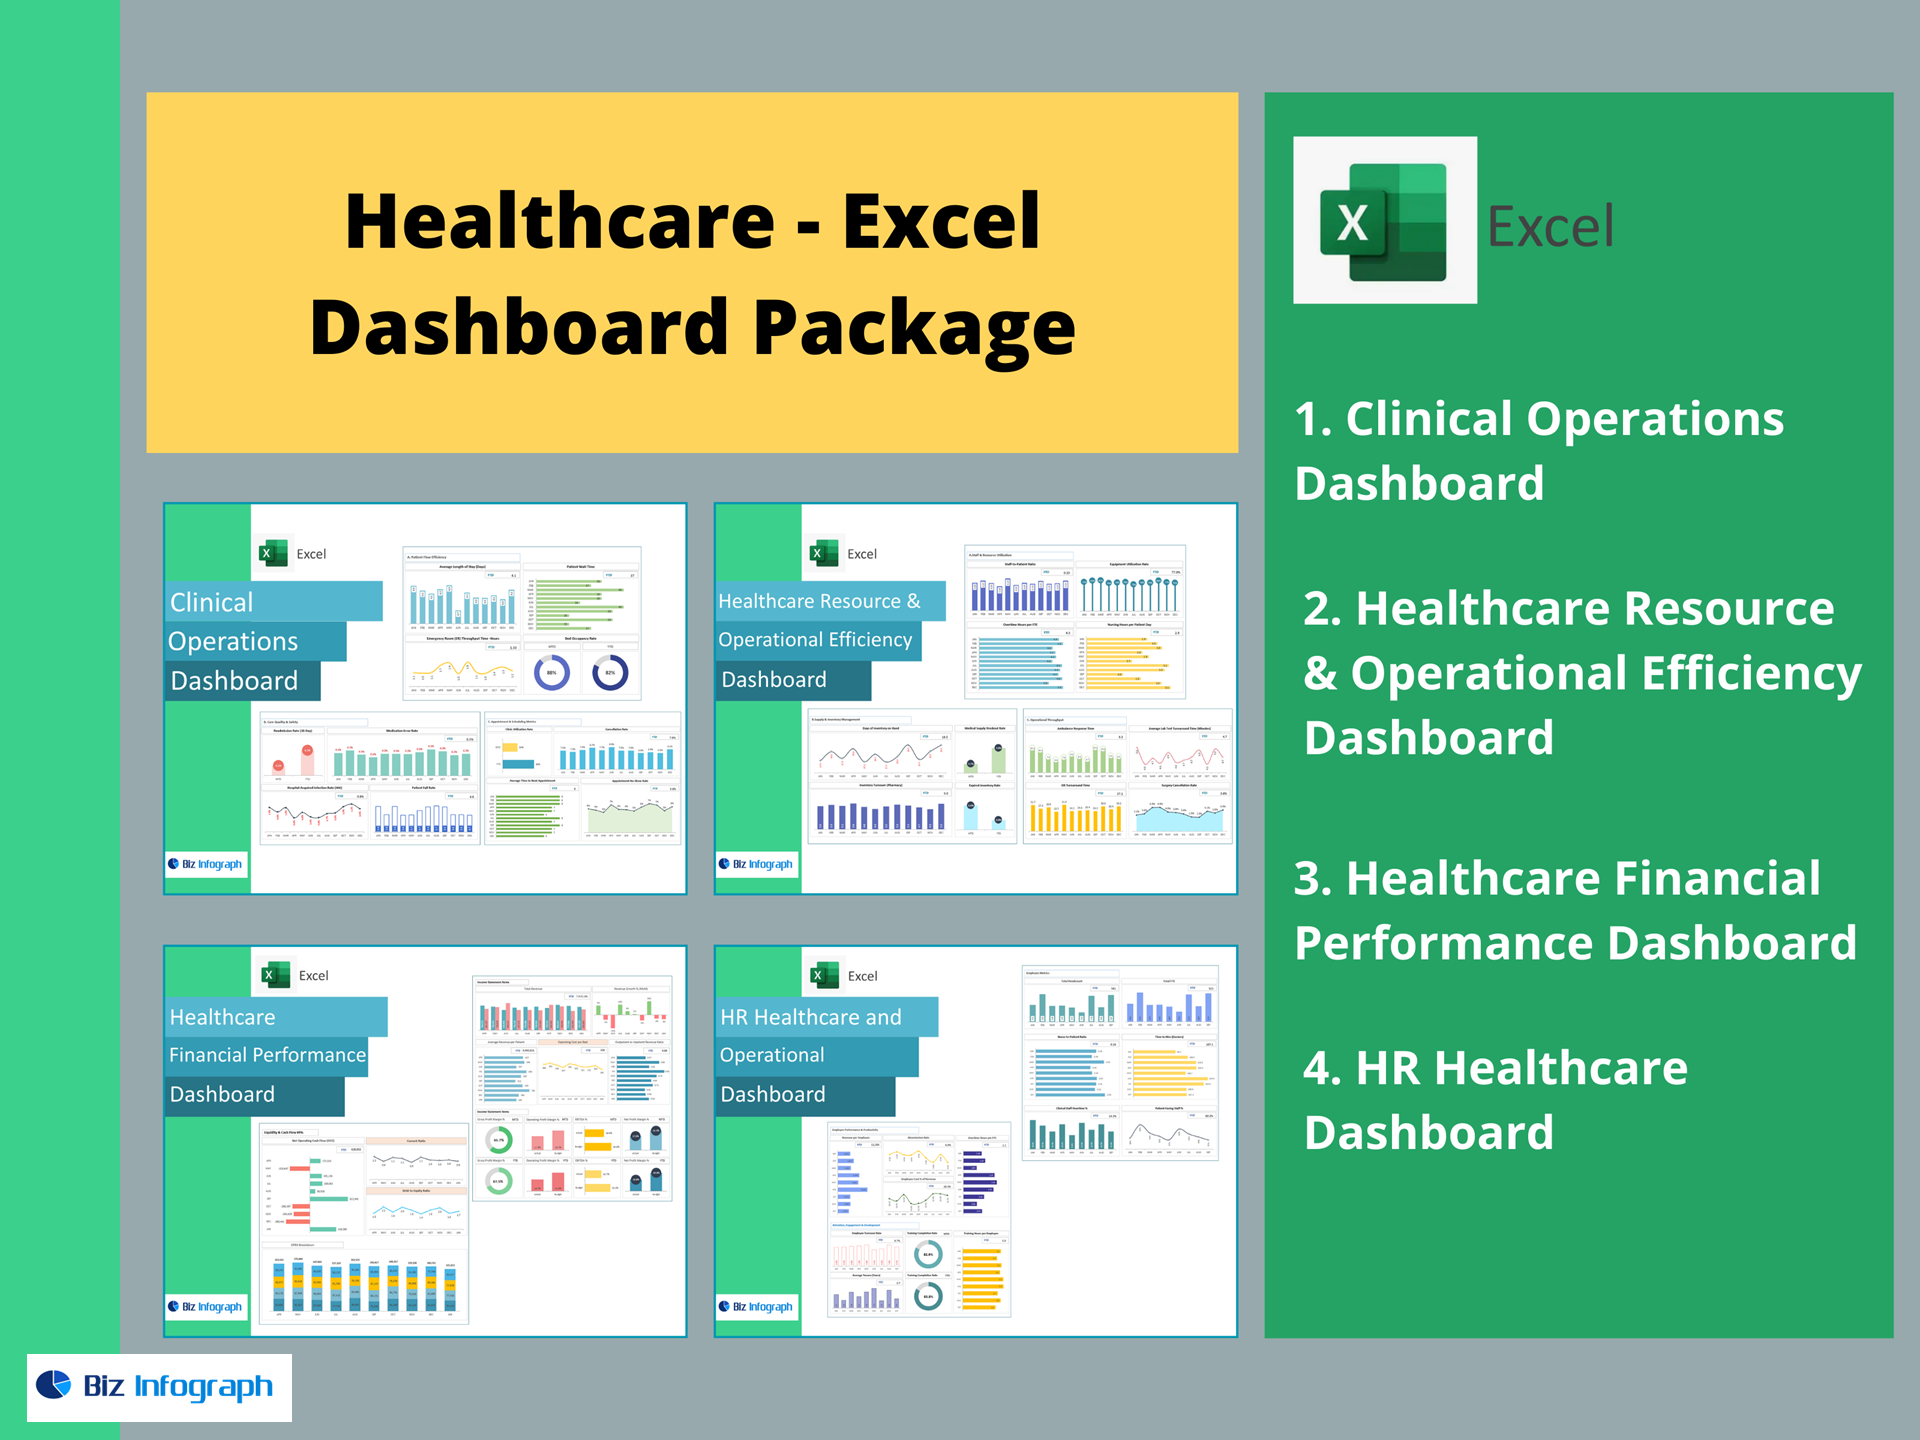
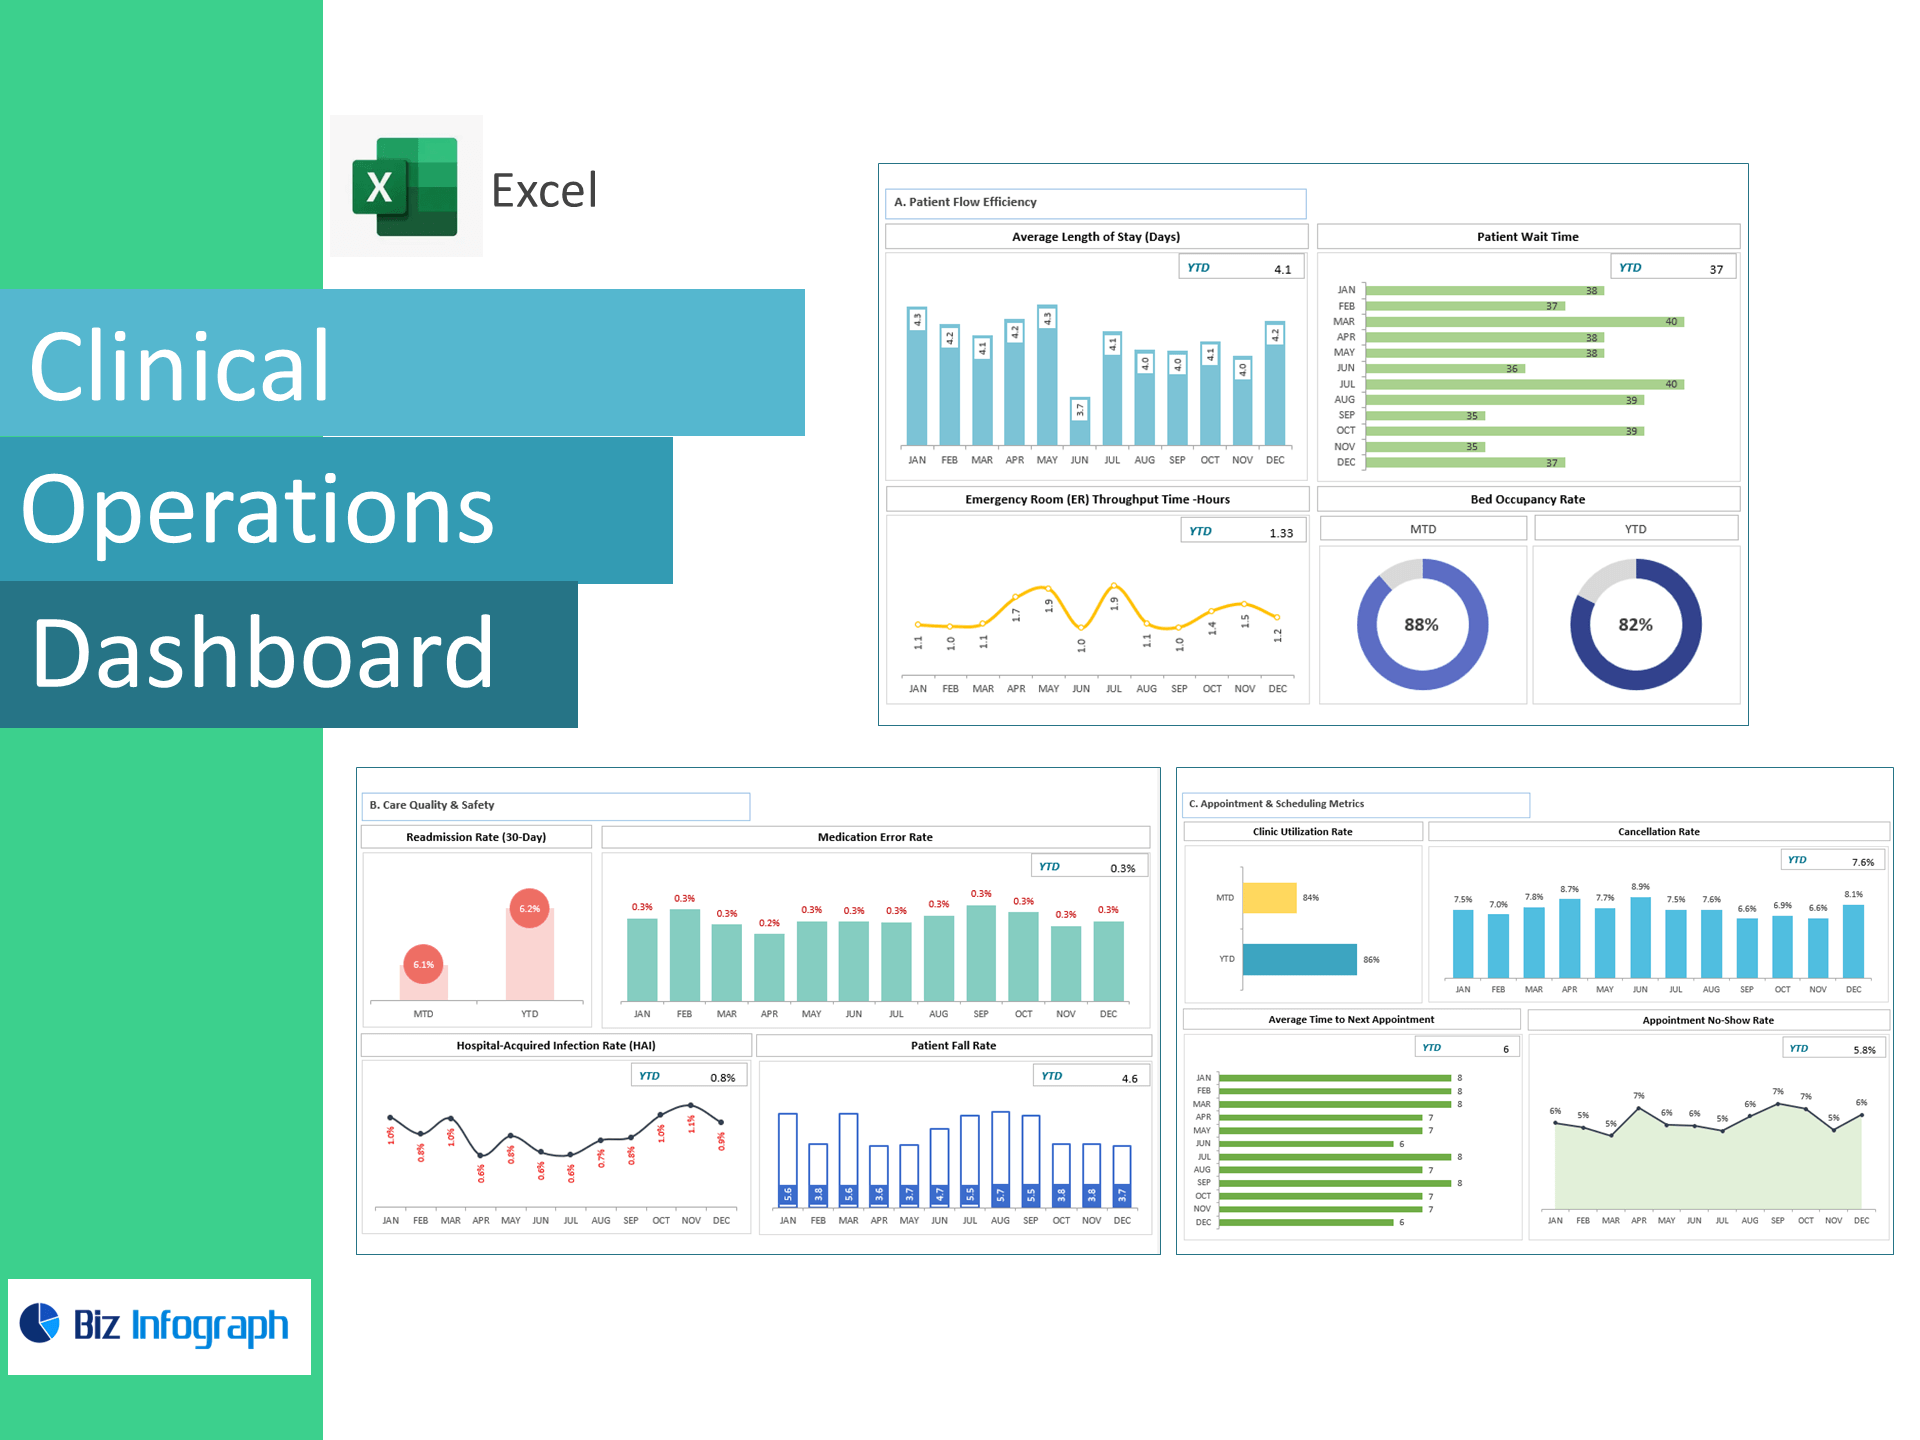
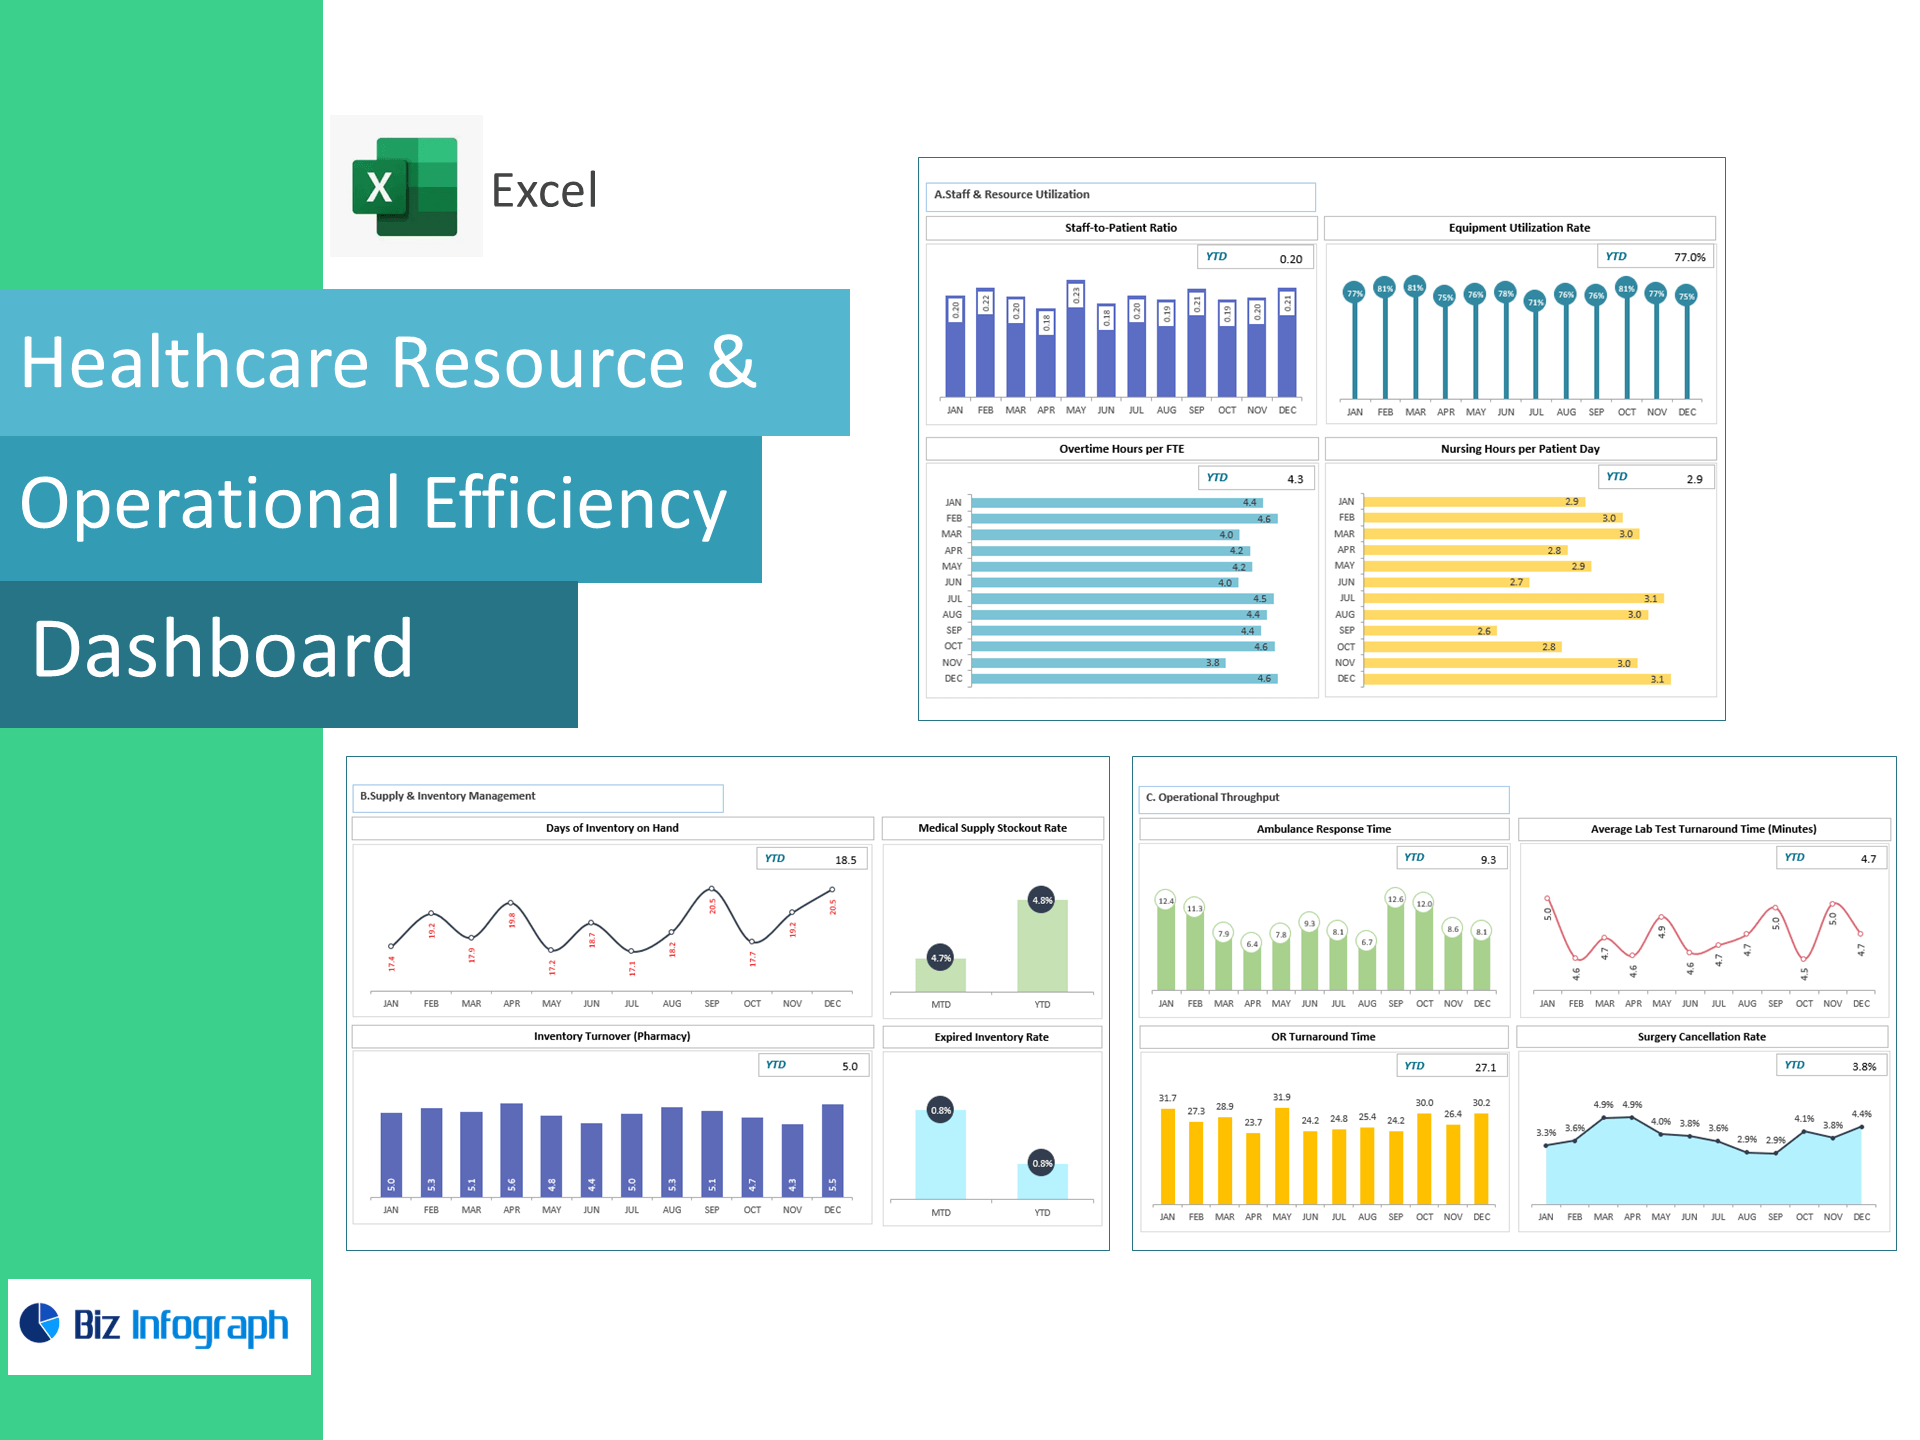
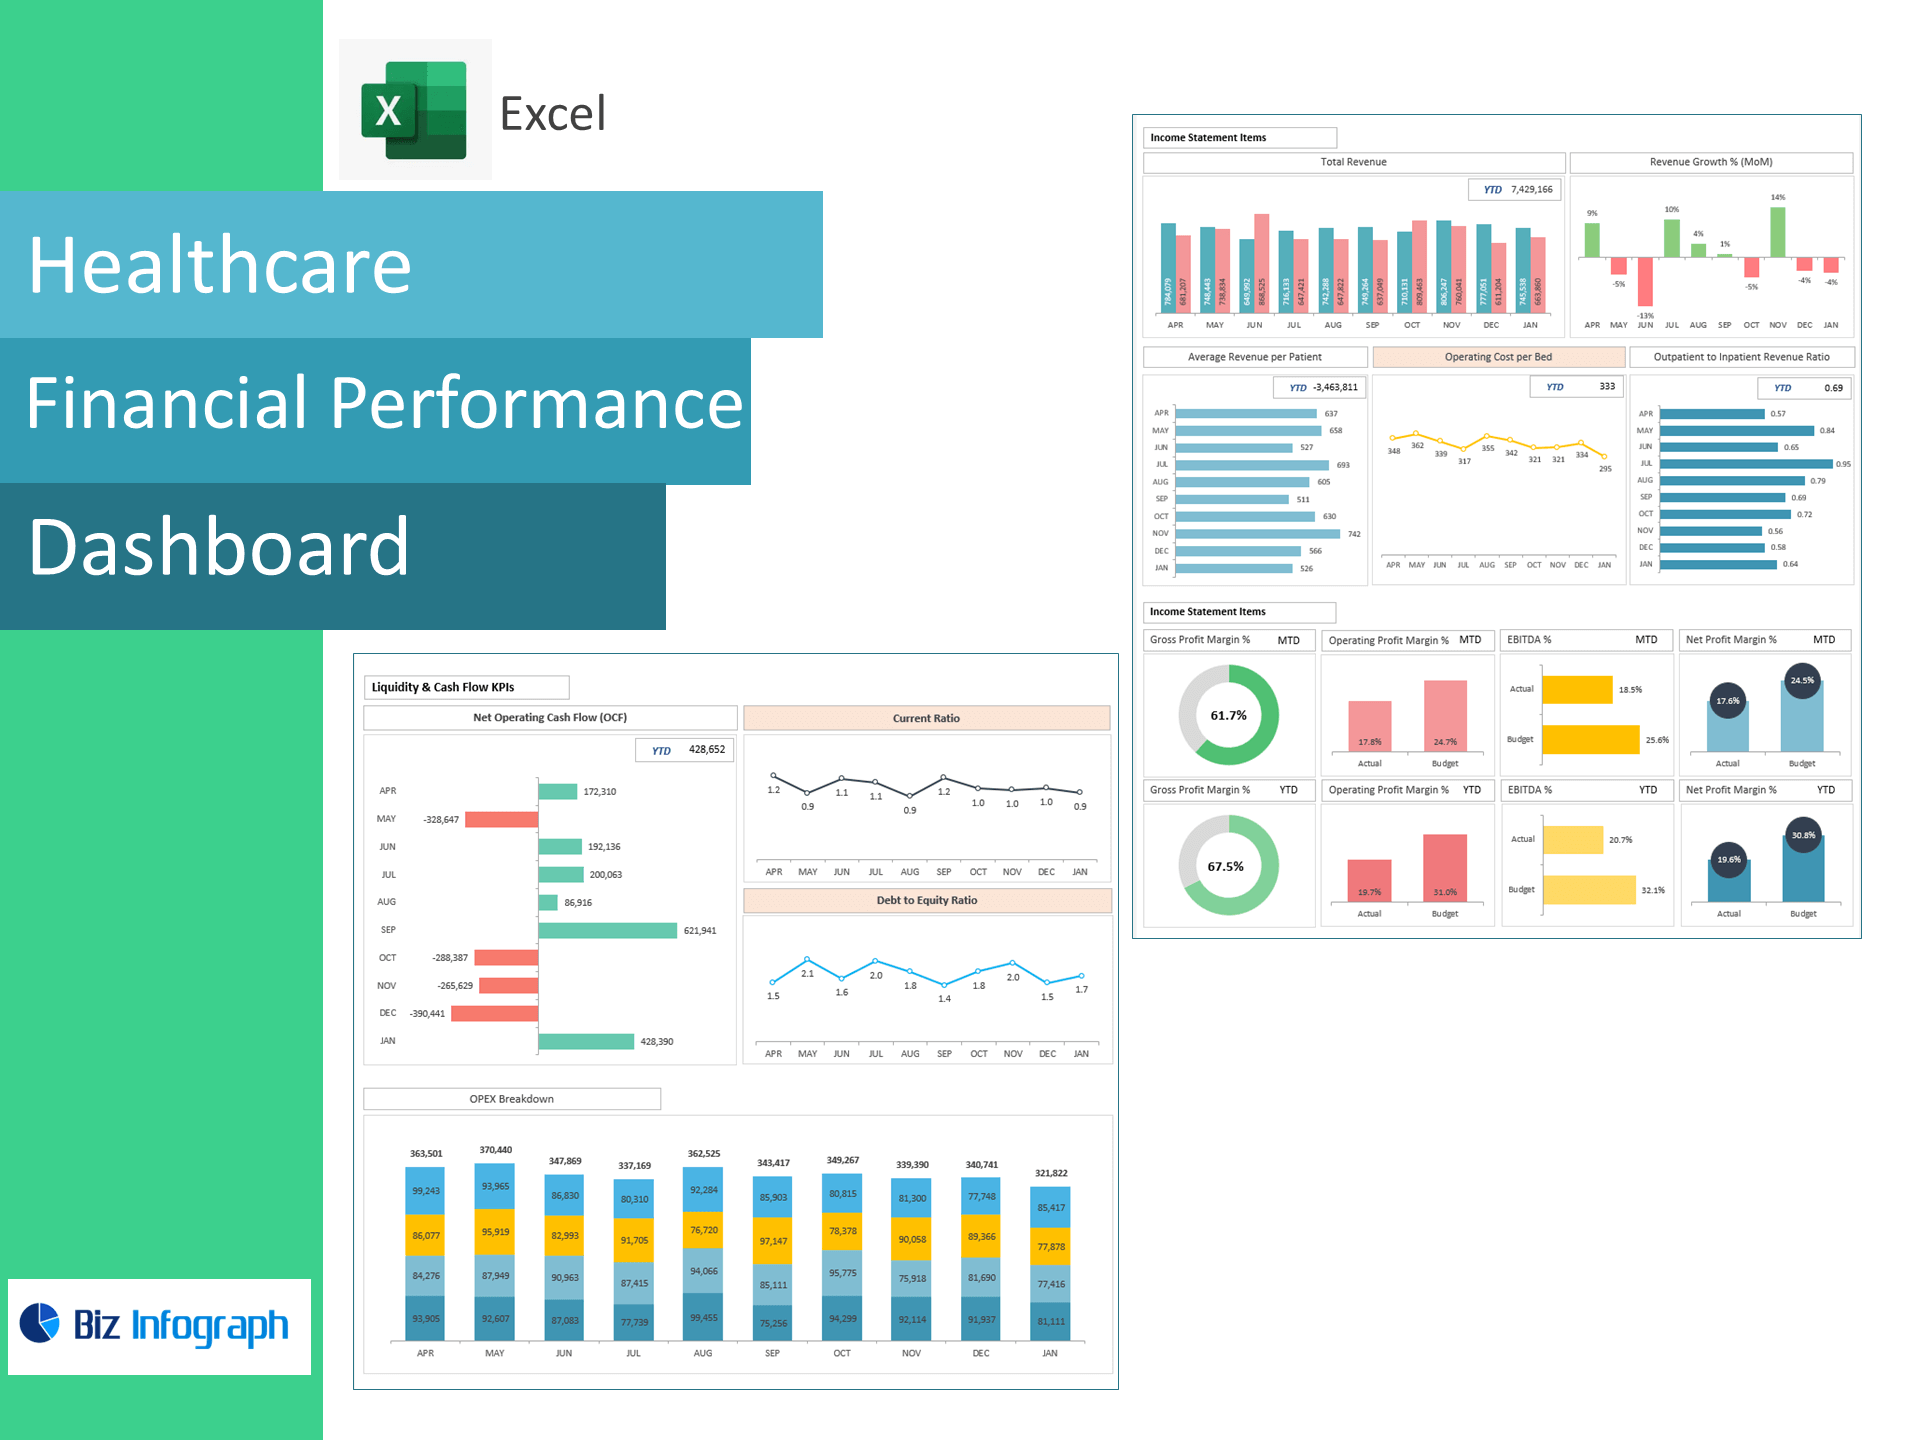
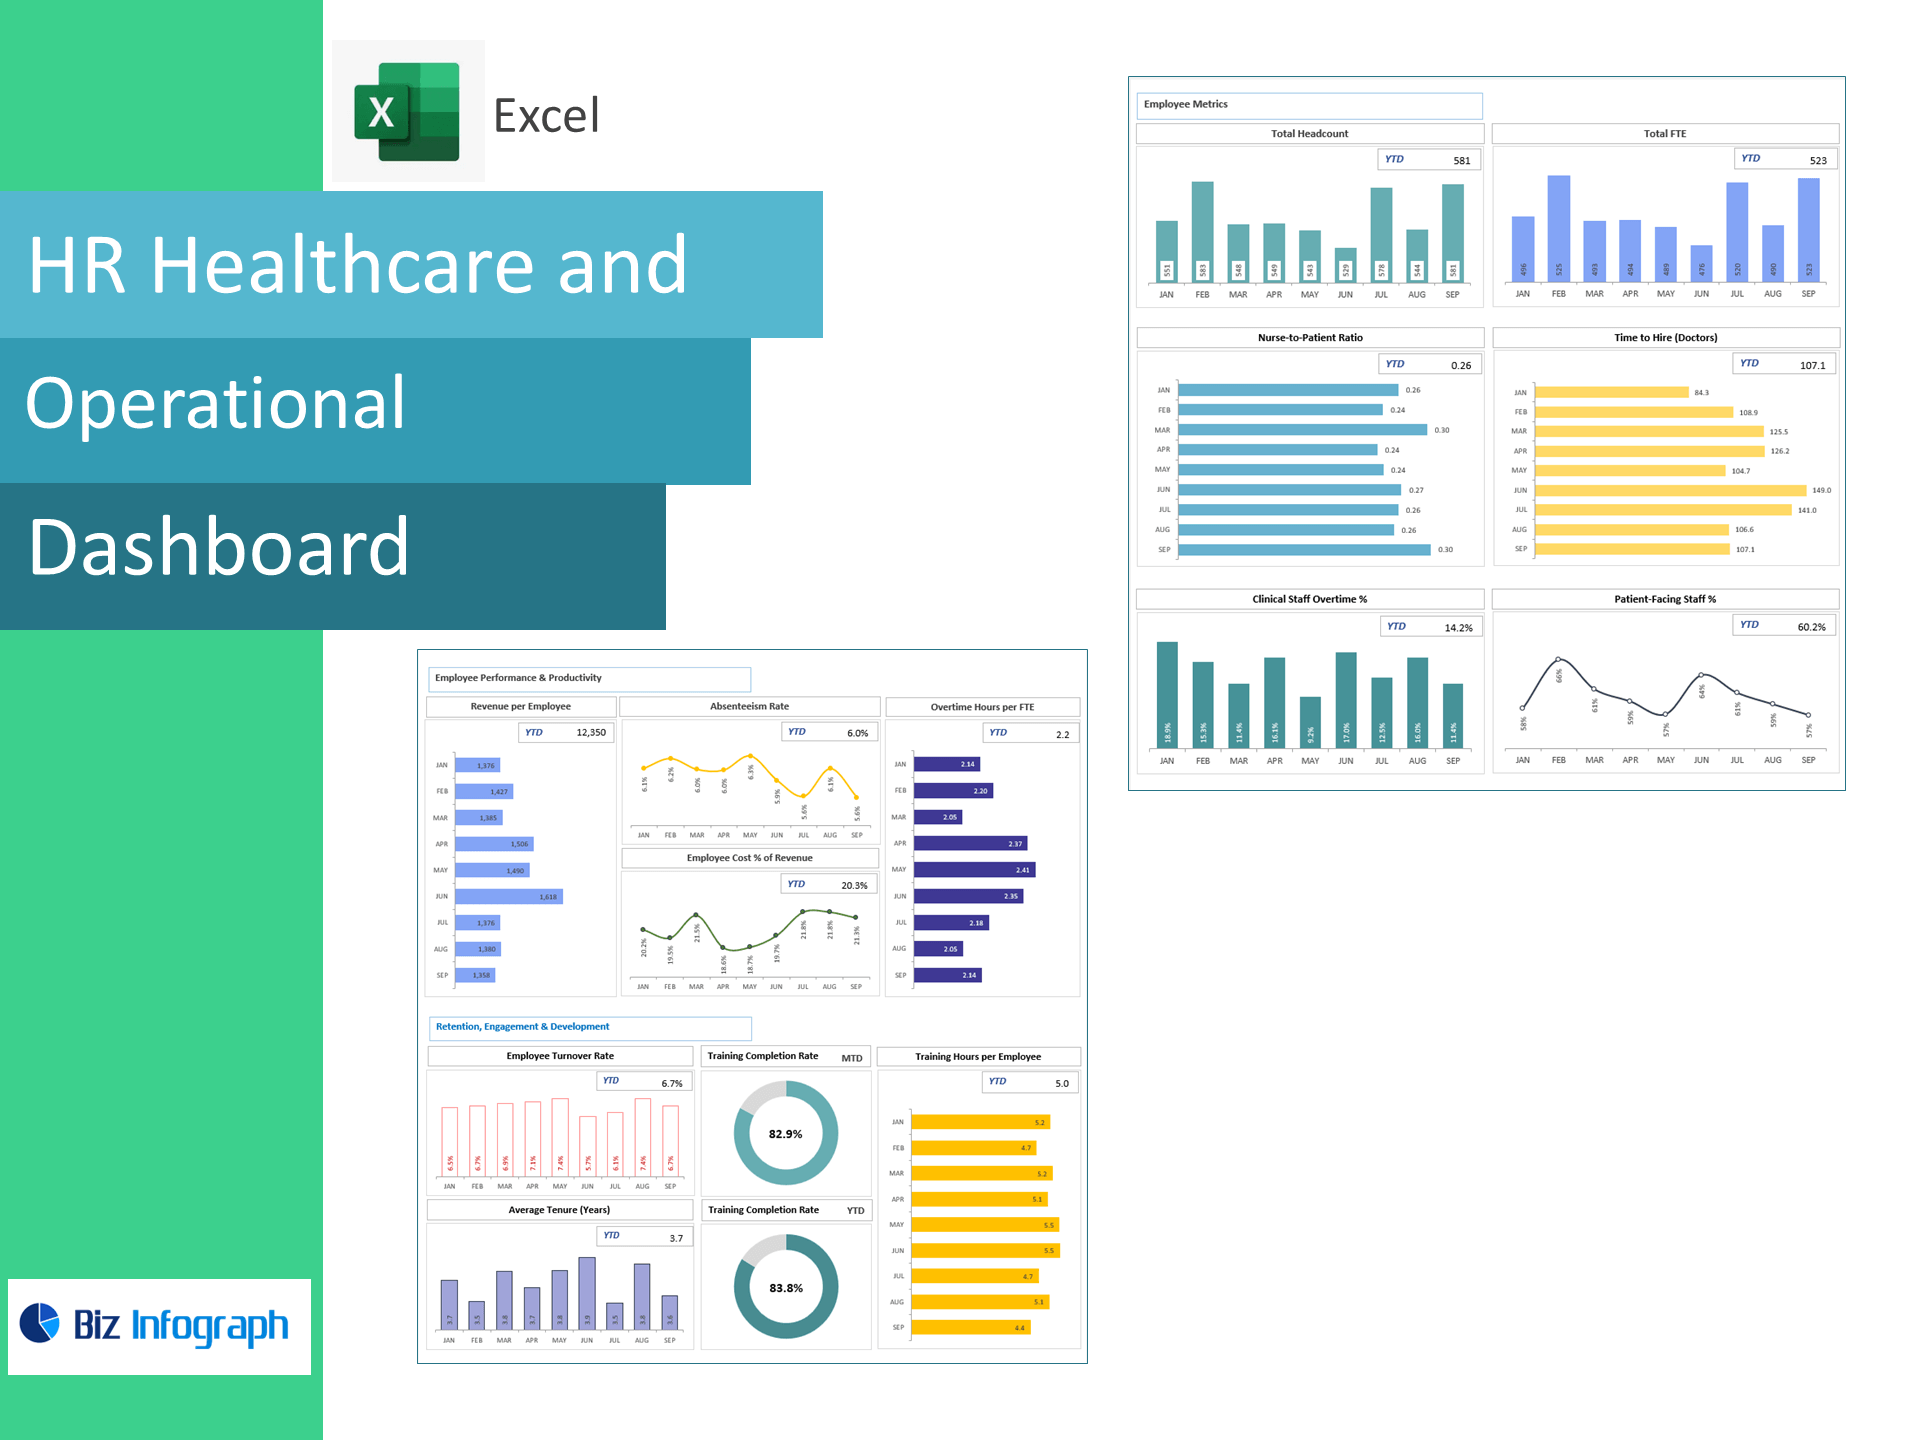
The Healthcare Dashboard Package is a powerful Excel-based toolkit designed to help healthcare organizations monitor, manage, and optimize performance across clinical, operational, financial, and HR functions. This all-in-one package includes four essential dashboards: Clinical Operations, Resource & Operational Efficiency, Financial Performance, and HR Healthcare Dashboard. With intuitive visuals and real-time data insights, healthcare professionals can track key metrics such as patient flow, staff utilization, revenue cycles, and resource allocation. Whether you're a hospital administrator, clinic manager, or healthcare analyst, this solution simplifies decision-making, supports compliance, and drives better outcomes through data-driven performance monitoring across the entire healthcare ecosystem.
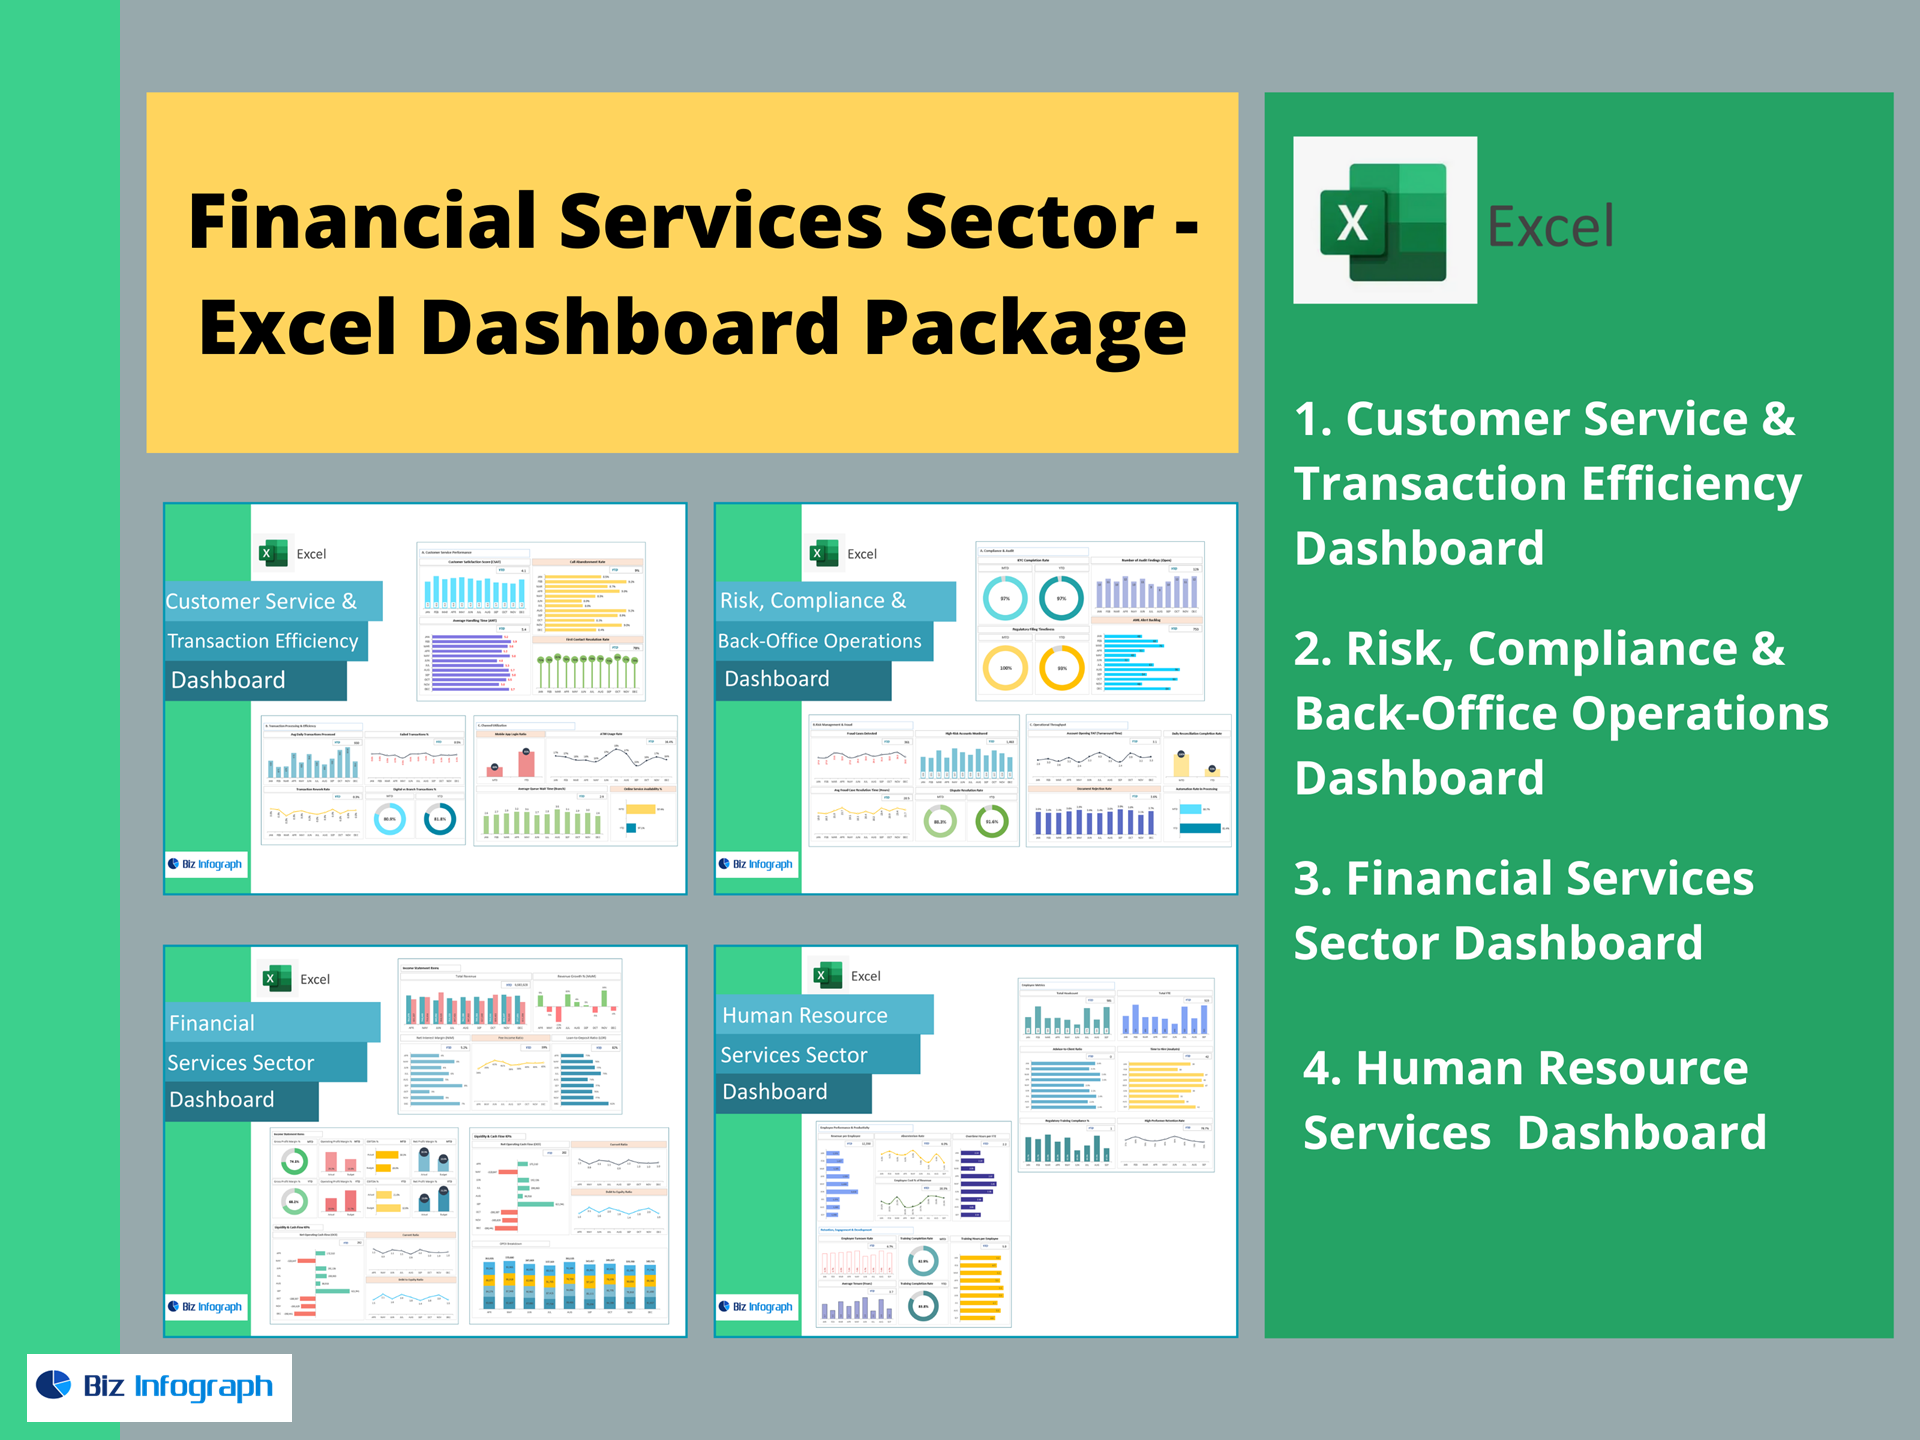
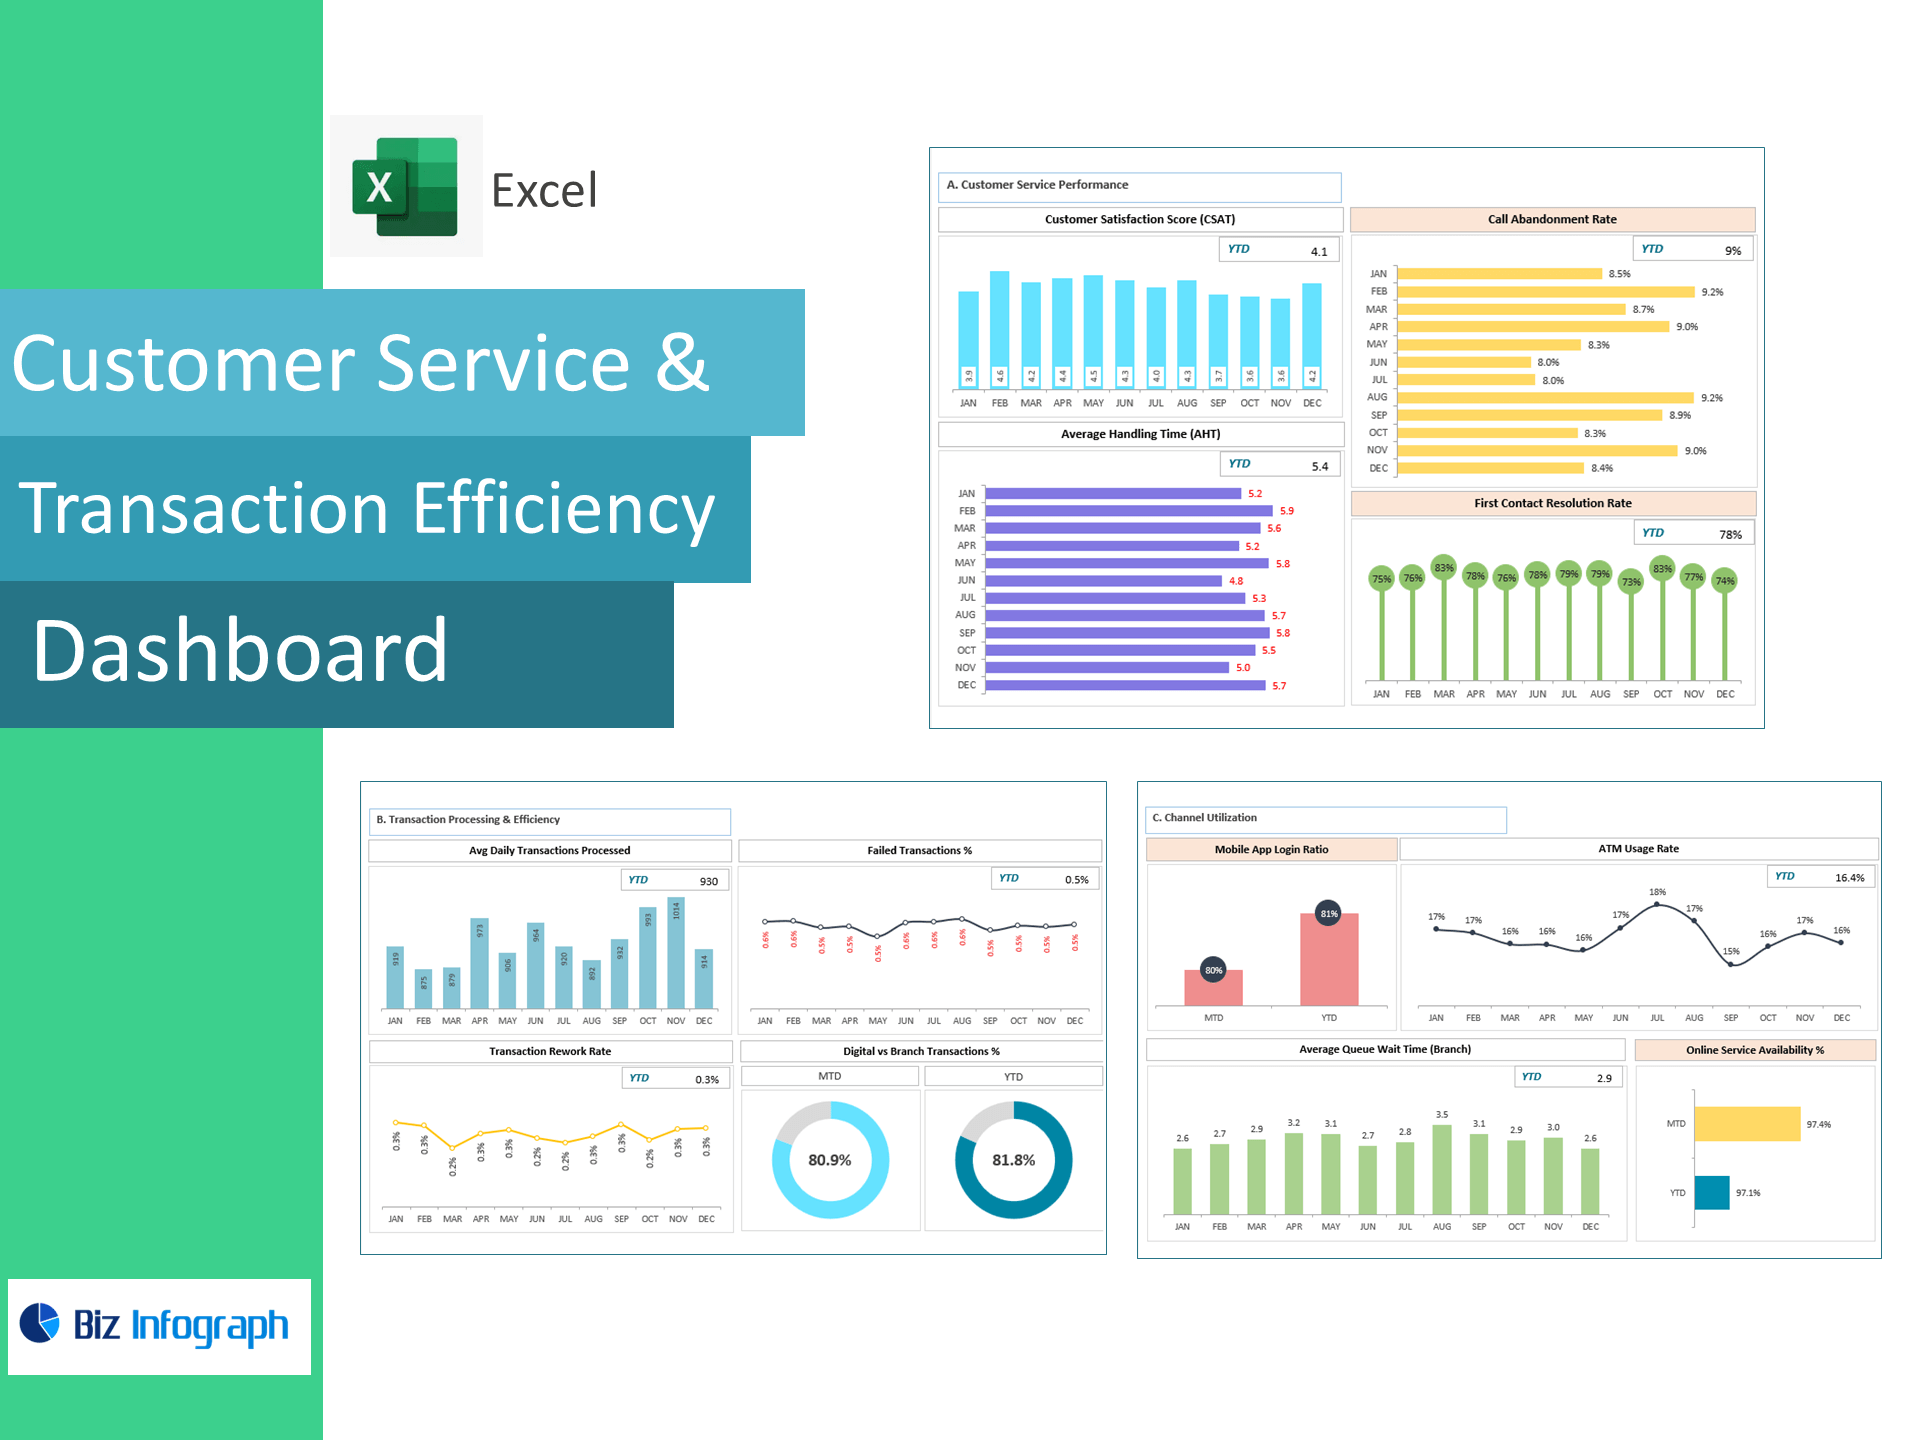
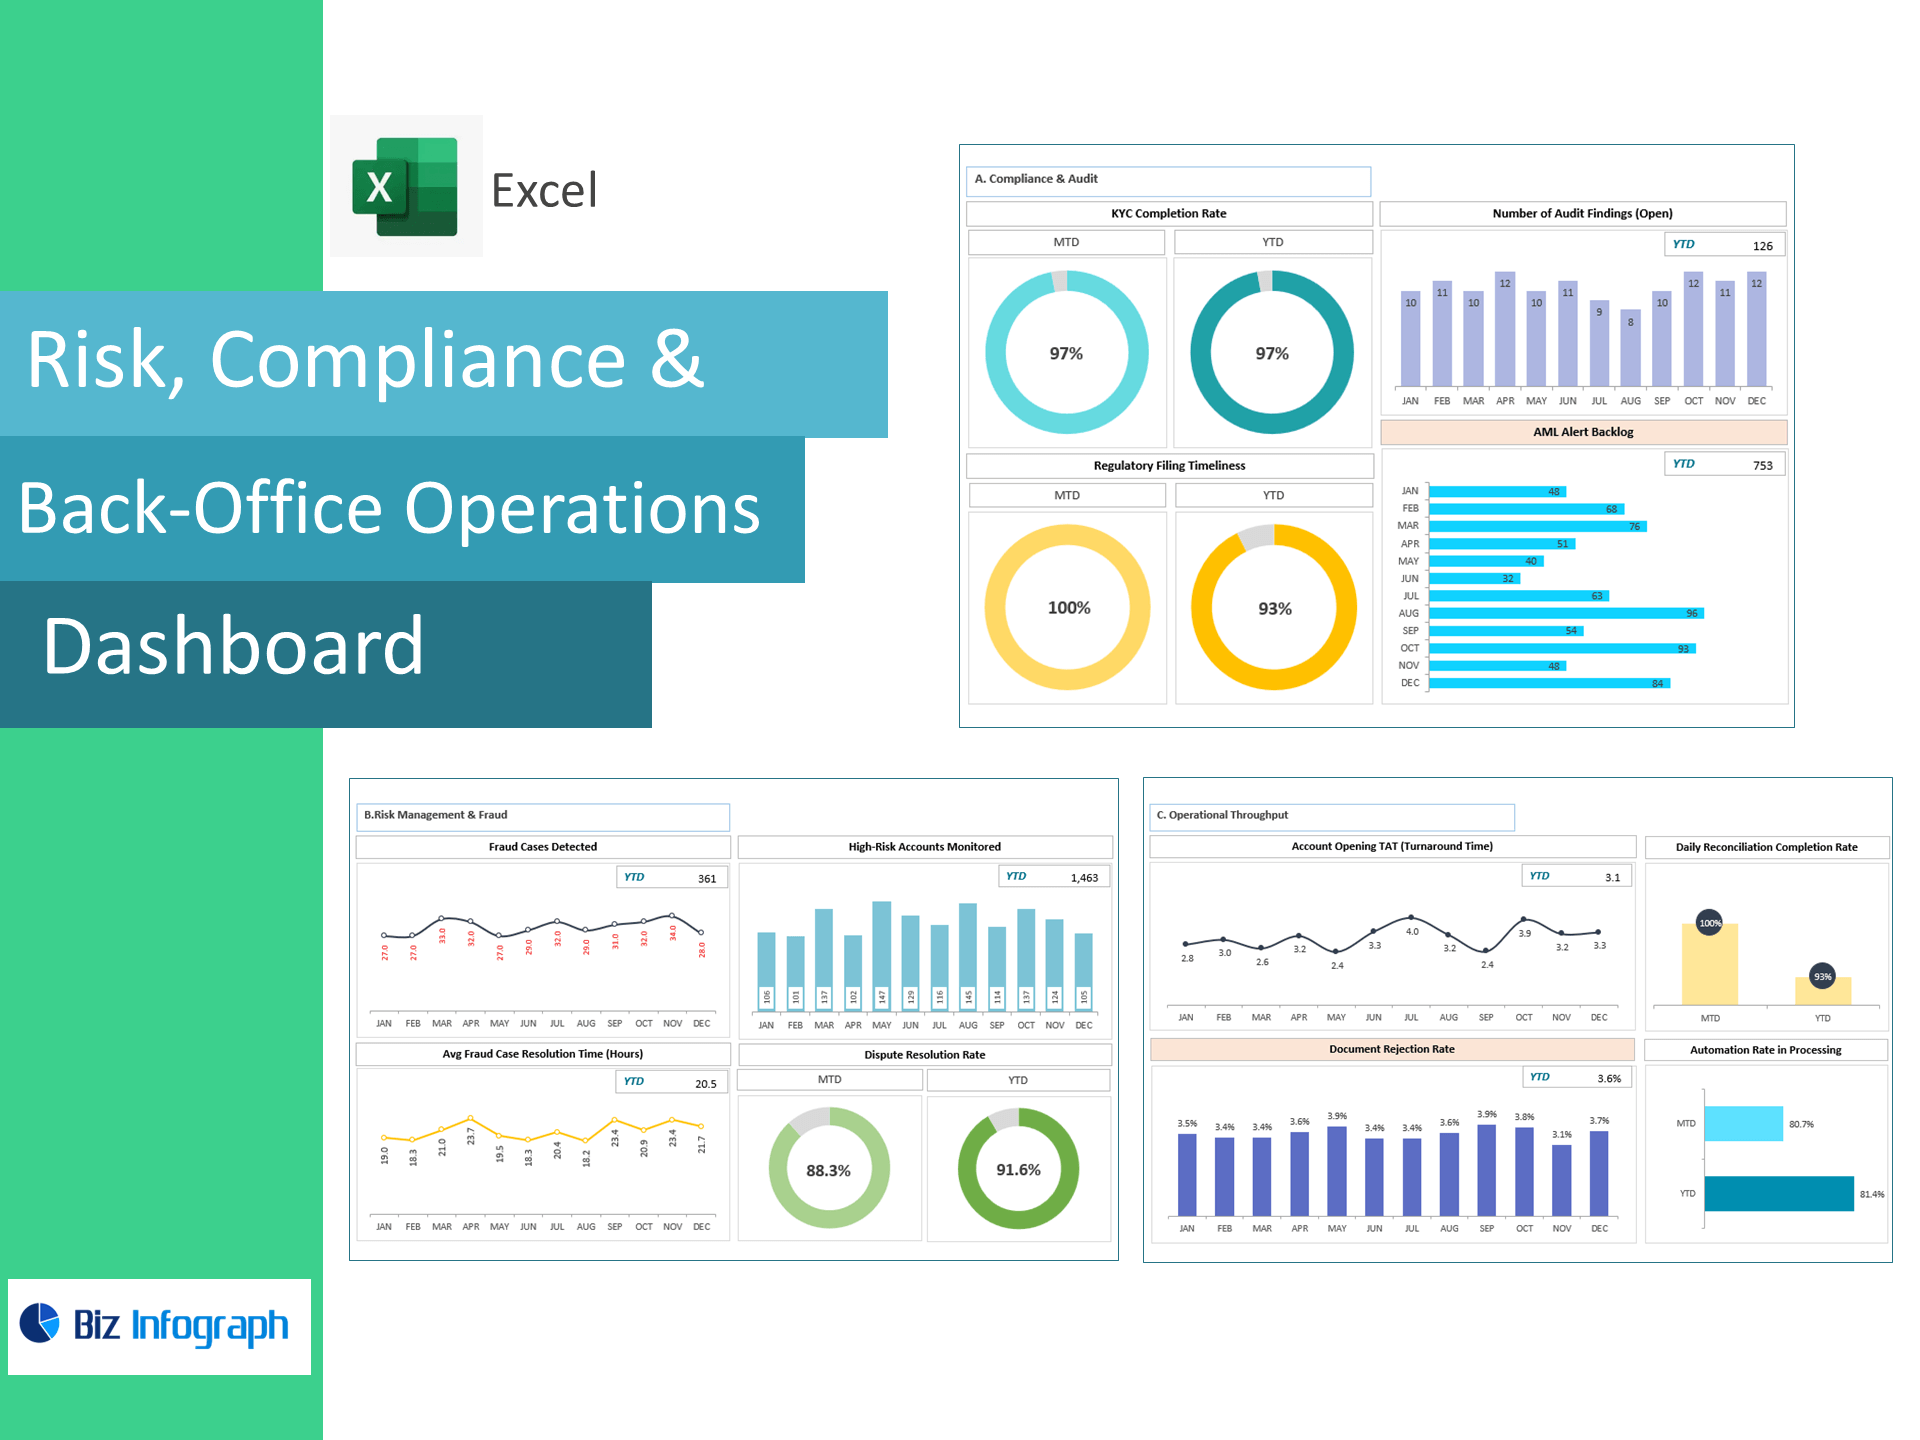
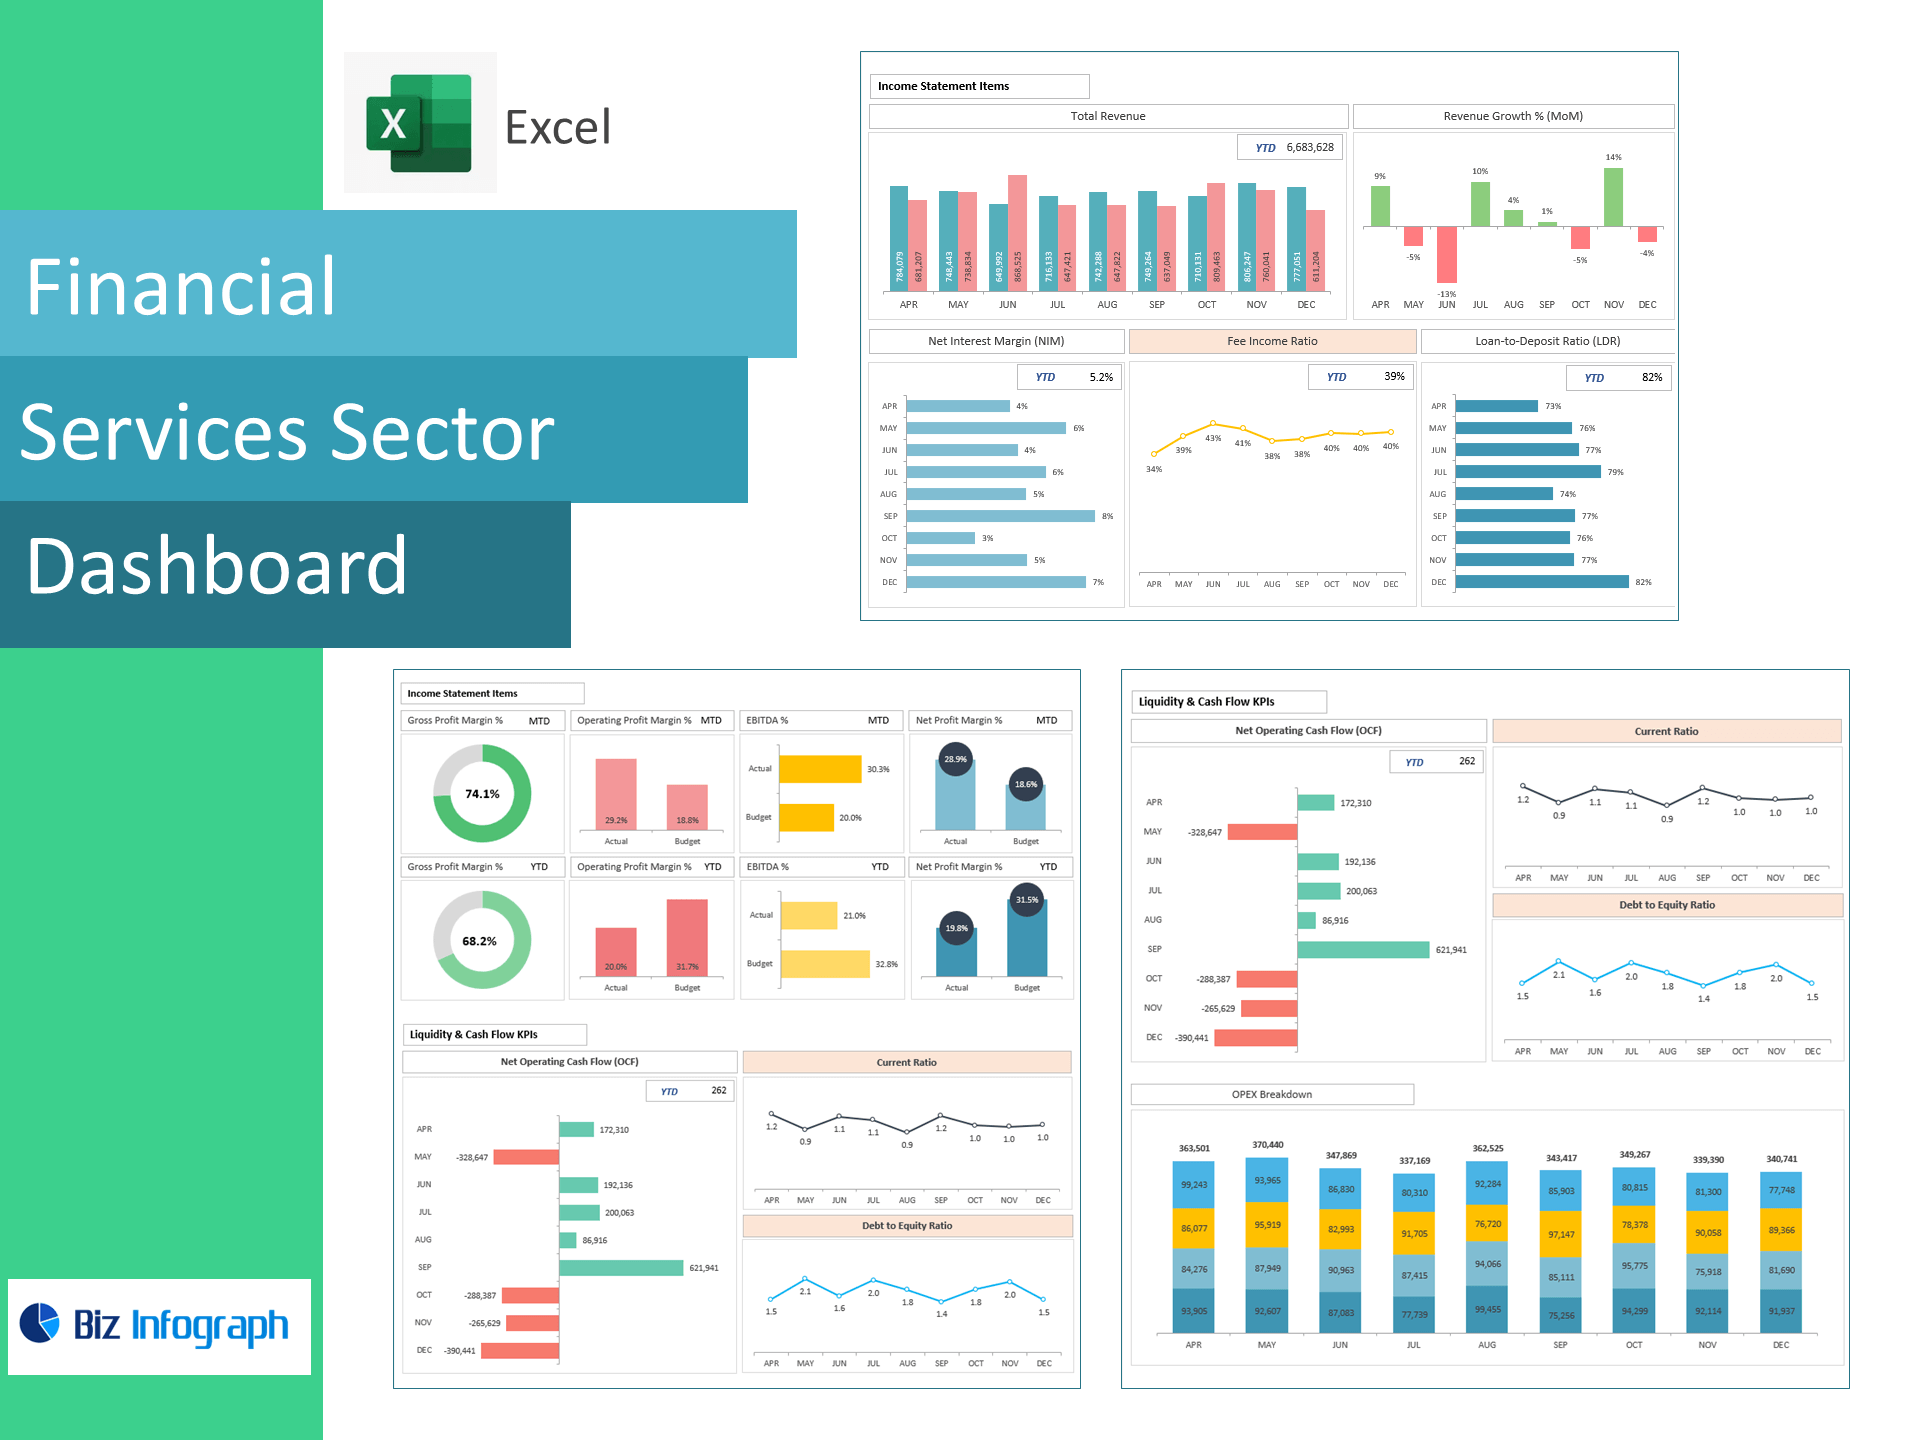
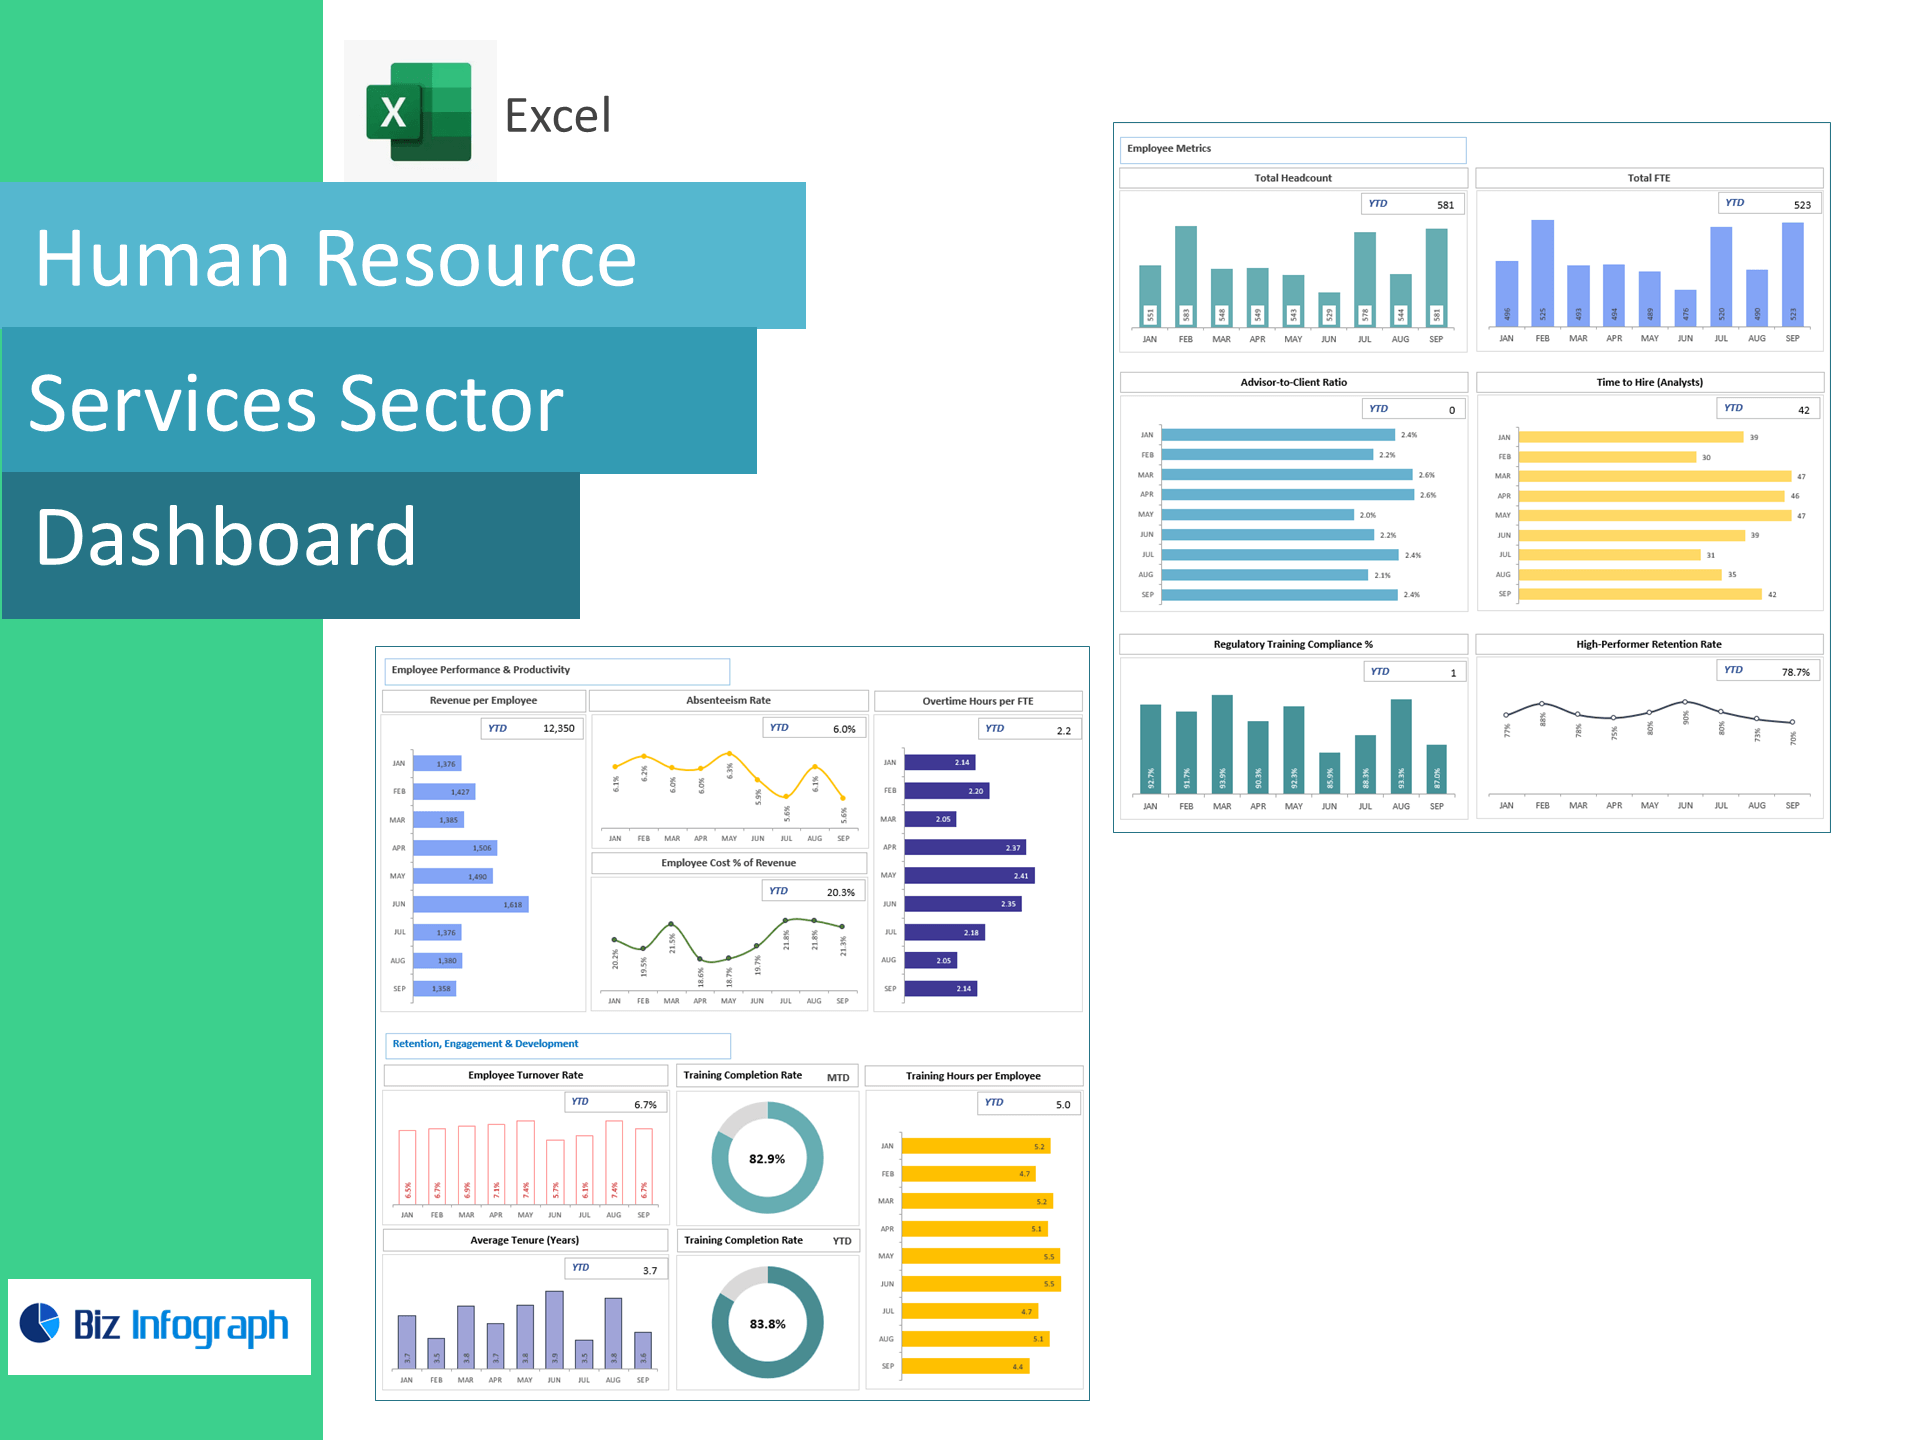
The Financial Services Dashboard Package is a comprehensive Excel-based solution tailored for banks, credit unions, fintech firms, and financial service providers to drive efficiency, compliance, and strategic decision-making. This package includes four purpose-built dashboards: Customer Service & Transaction Efficiency, Risk, Compliance & Back-Office Operations, Financial Sector Performance, and Human Resource Services. These dashboards provide real-time insights into key performance indicators (KPIs) such as transaction volume, customer satisfaction, regulatory compliance, operational risk, and workforce productivity. With intuitive visuals and automated data integration, this package empowers financial professionals to streamline reporting, monitor risk exposure, and enhance service delivery—ultimately improving profitability and operational resilience.
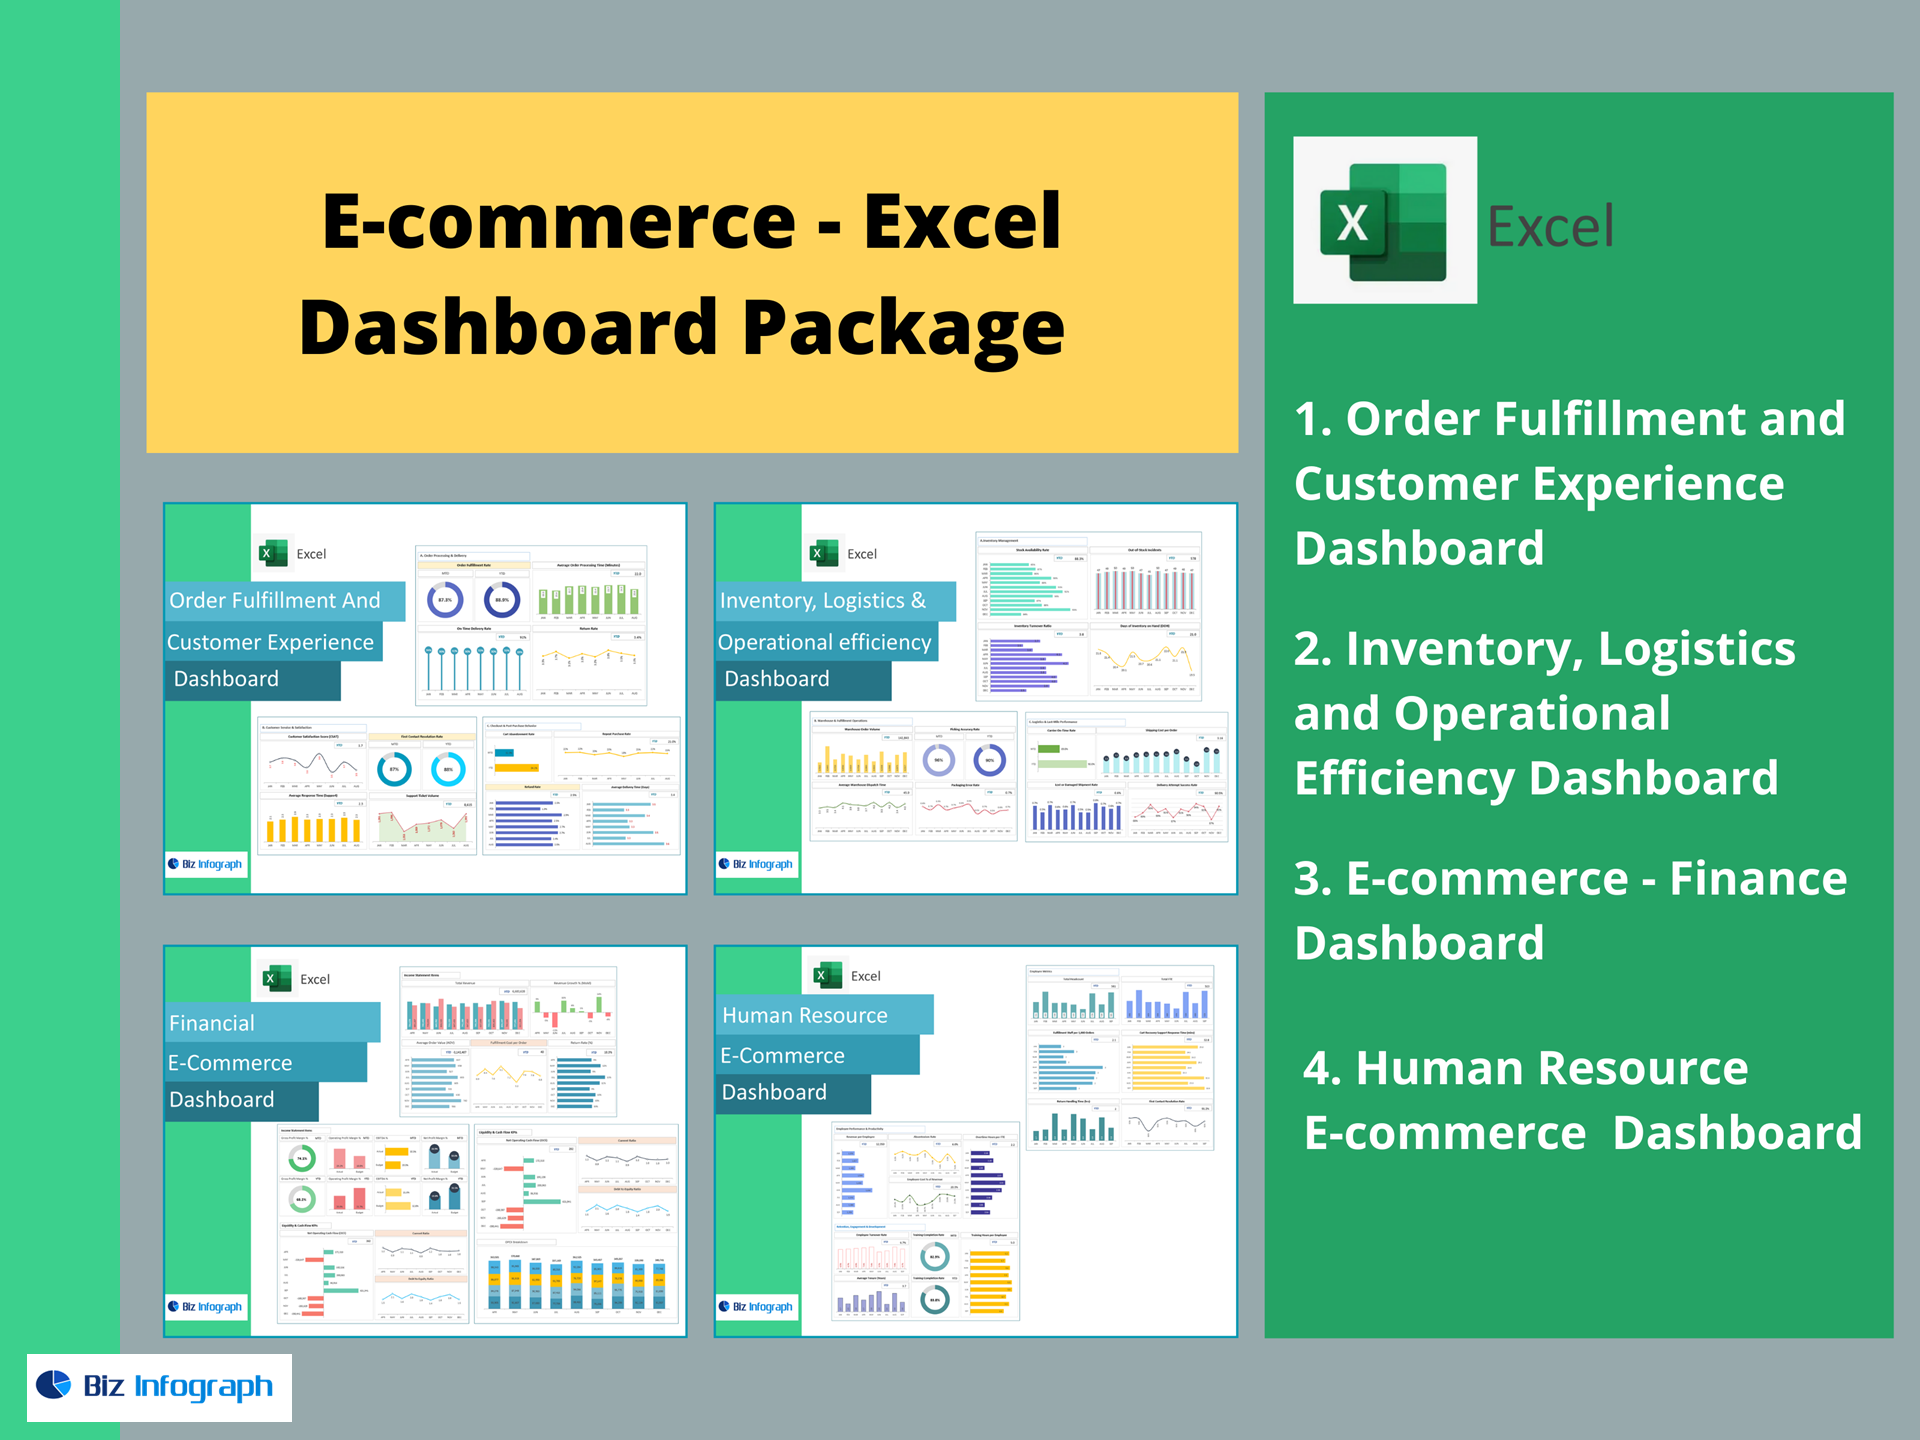
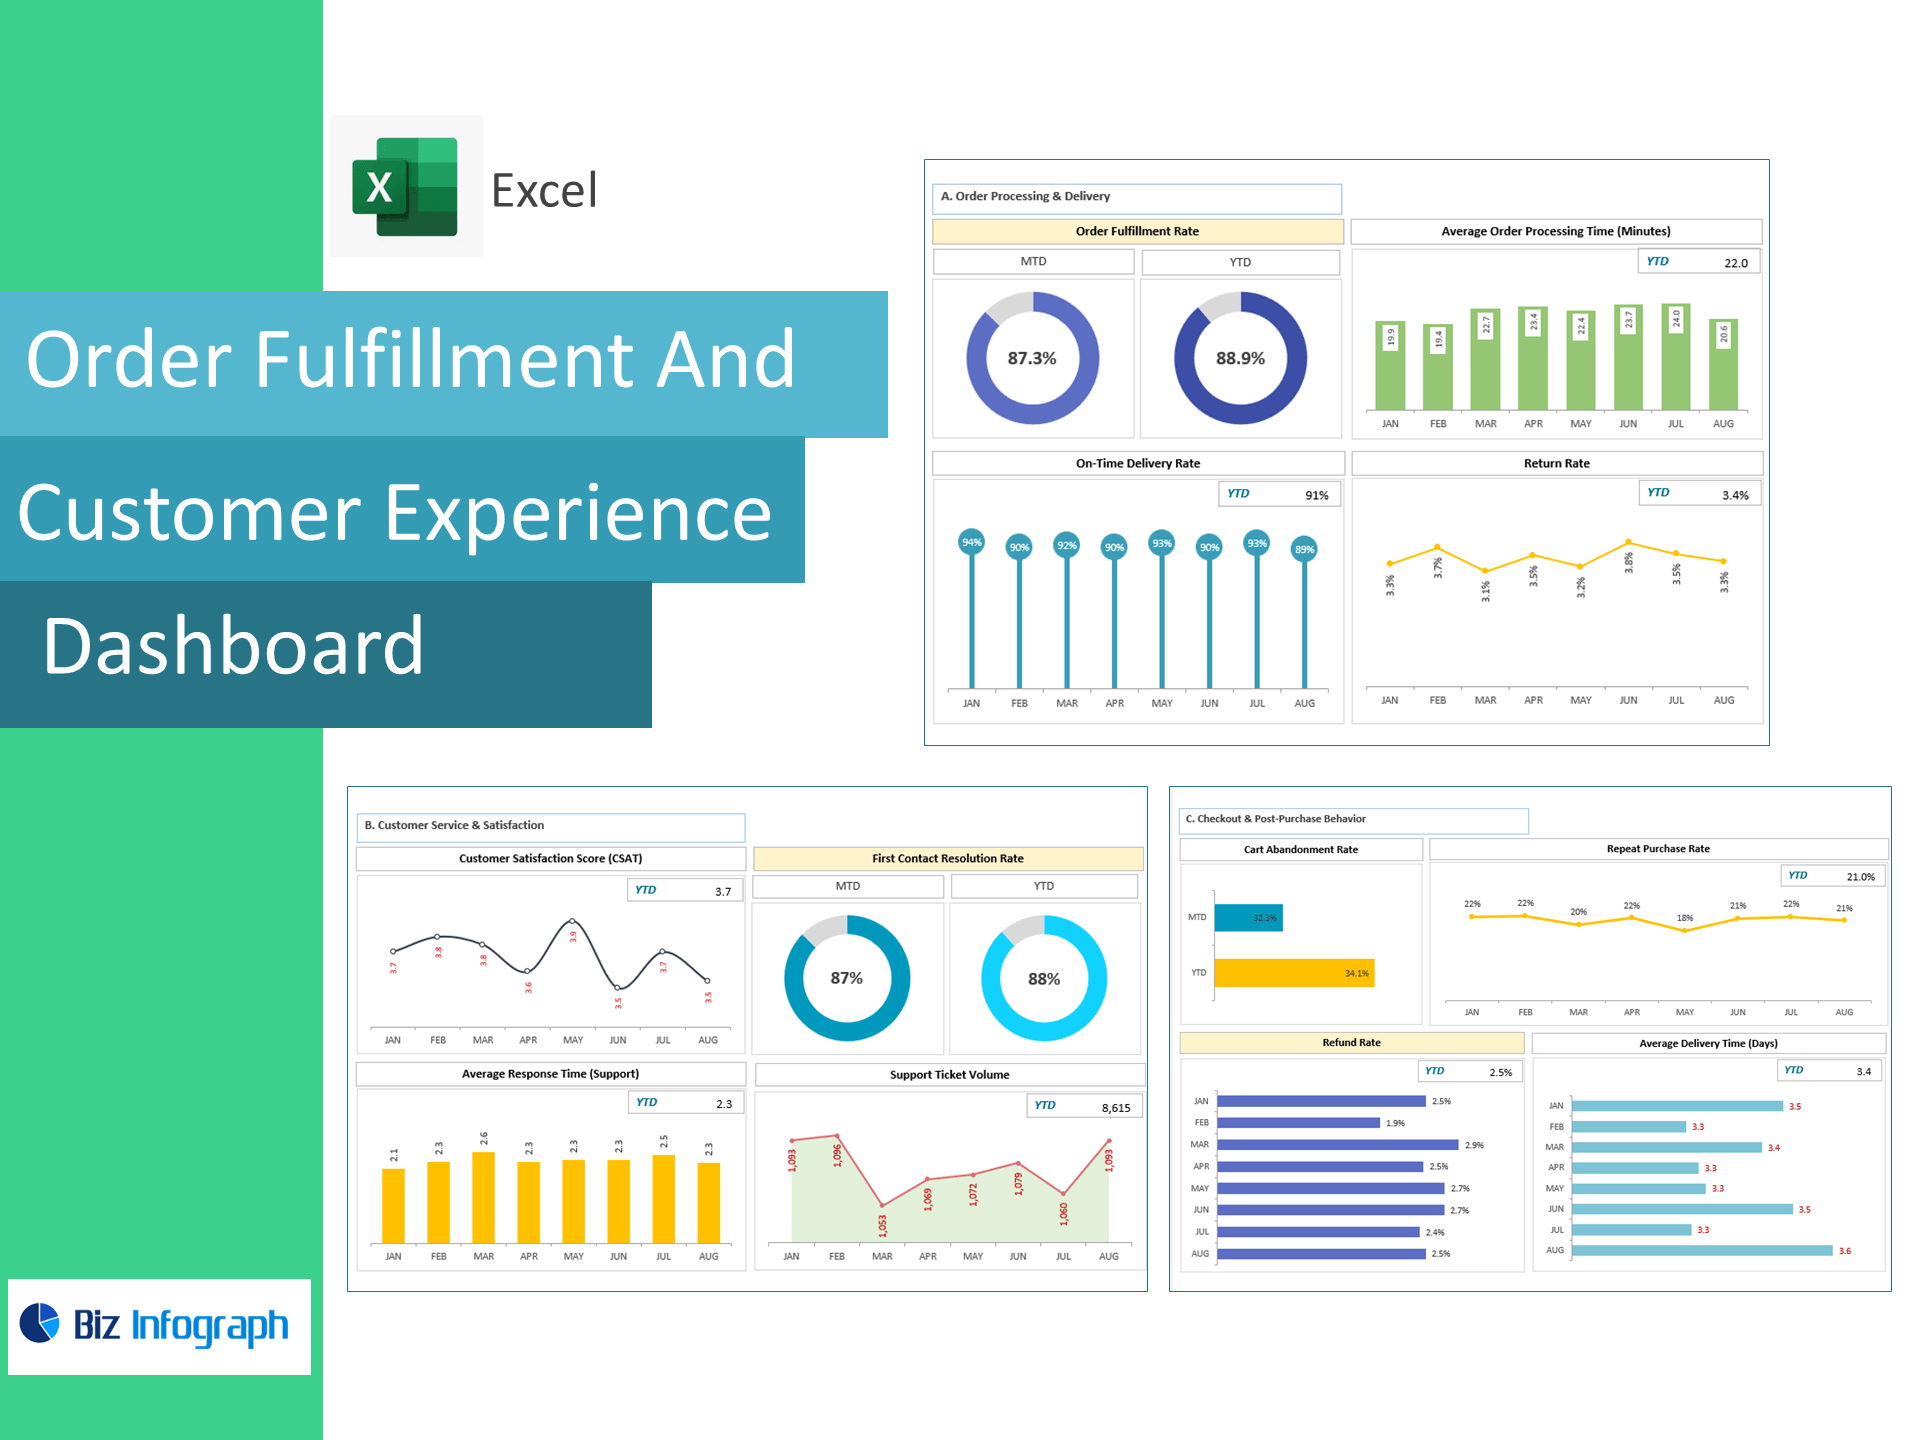
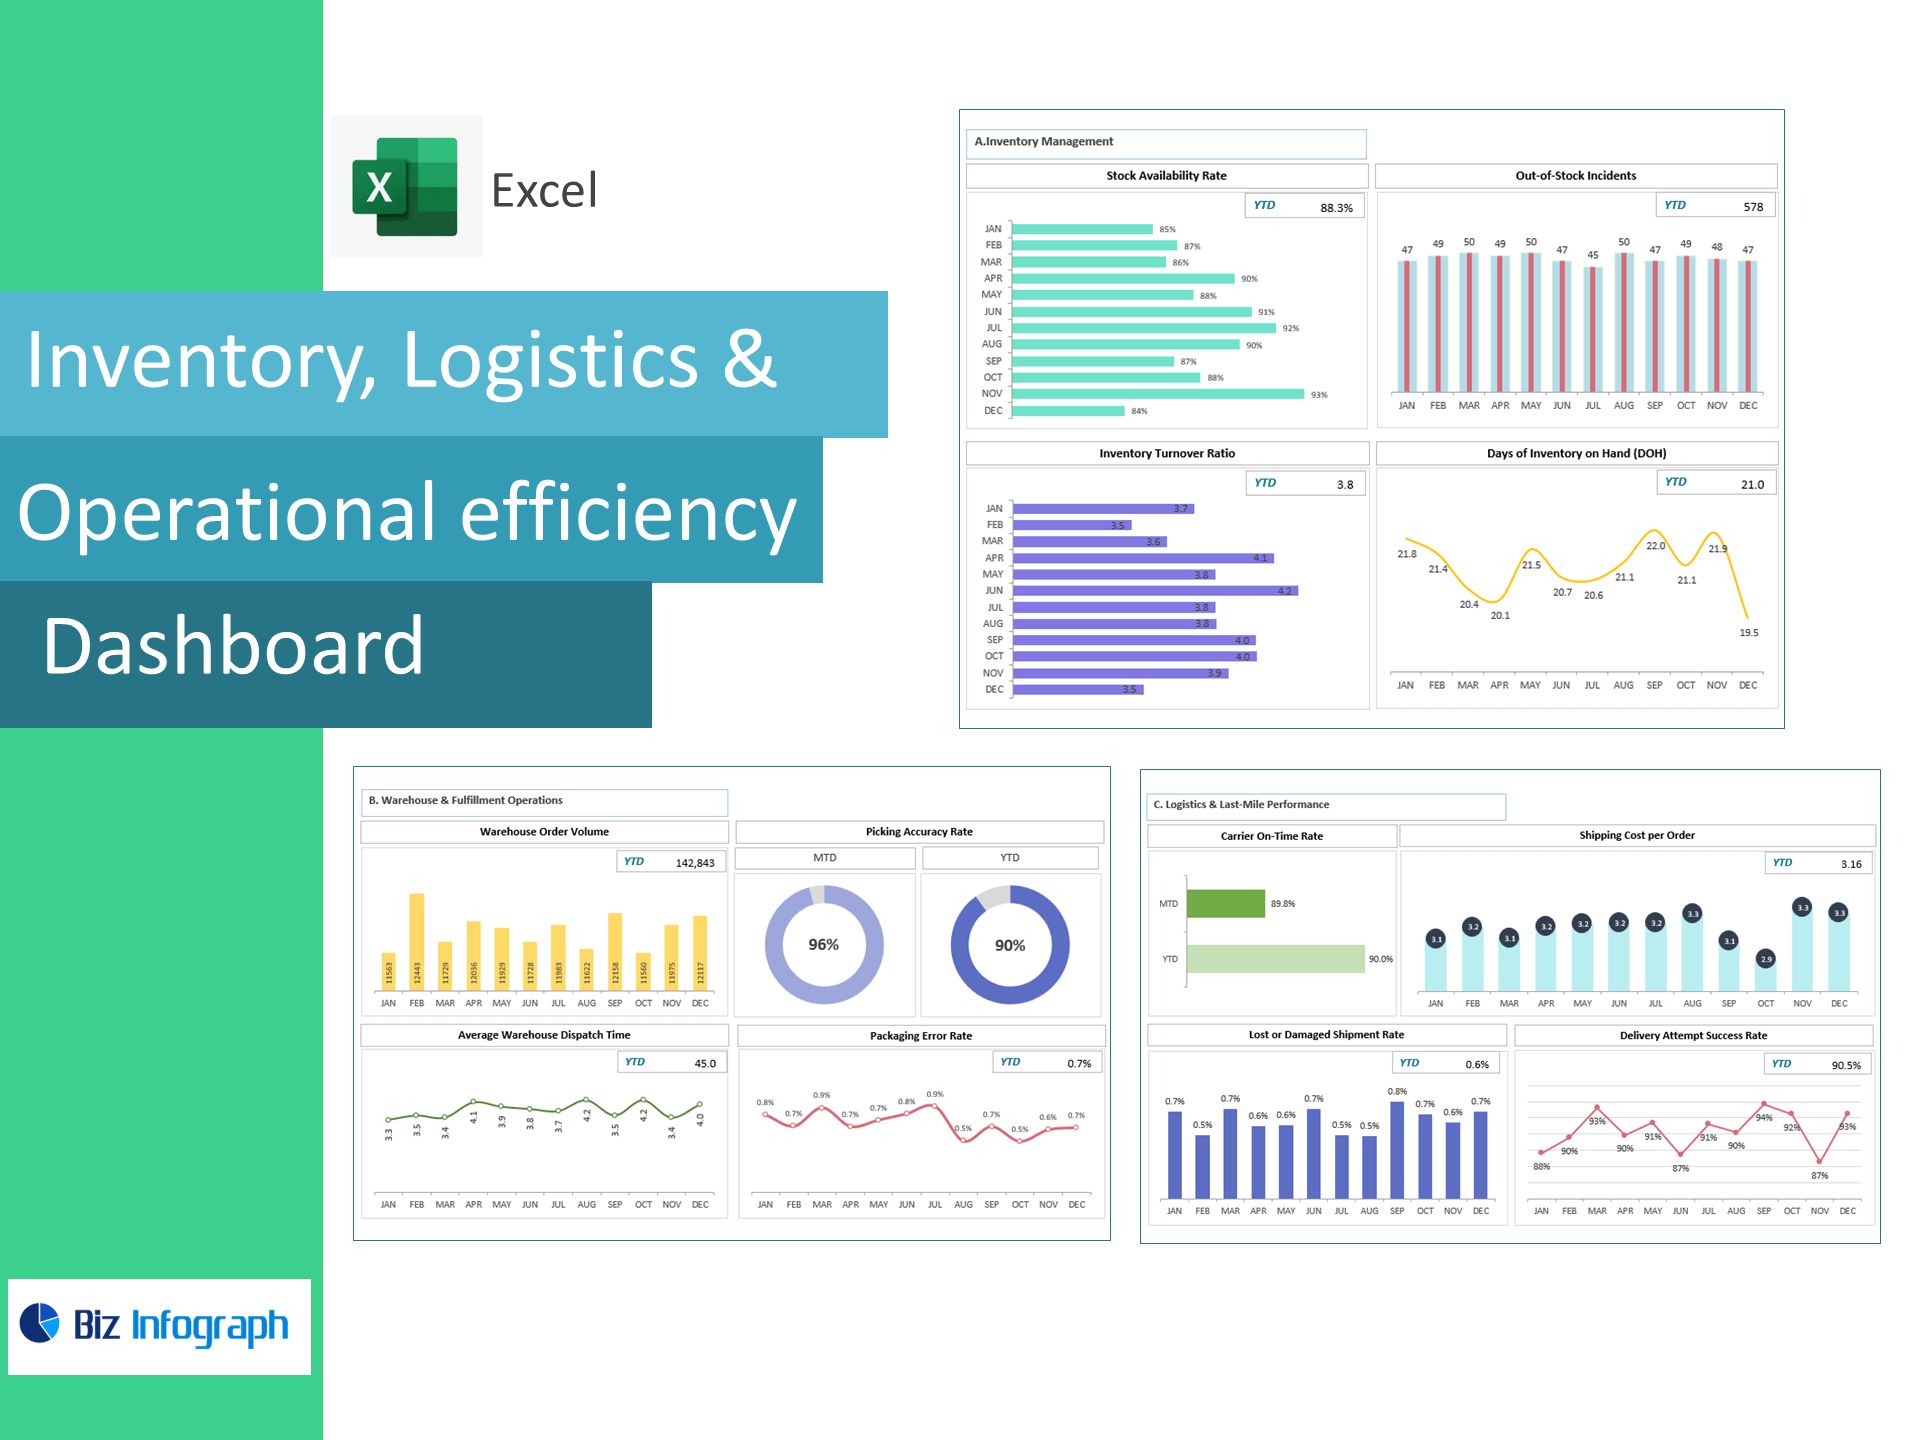
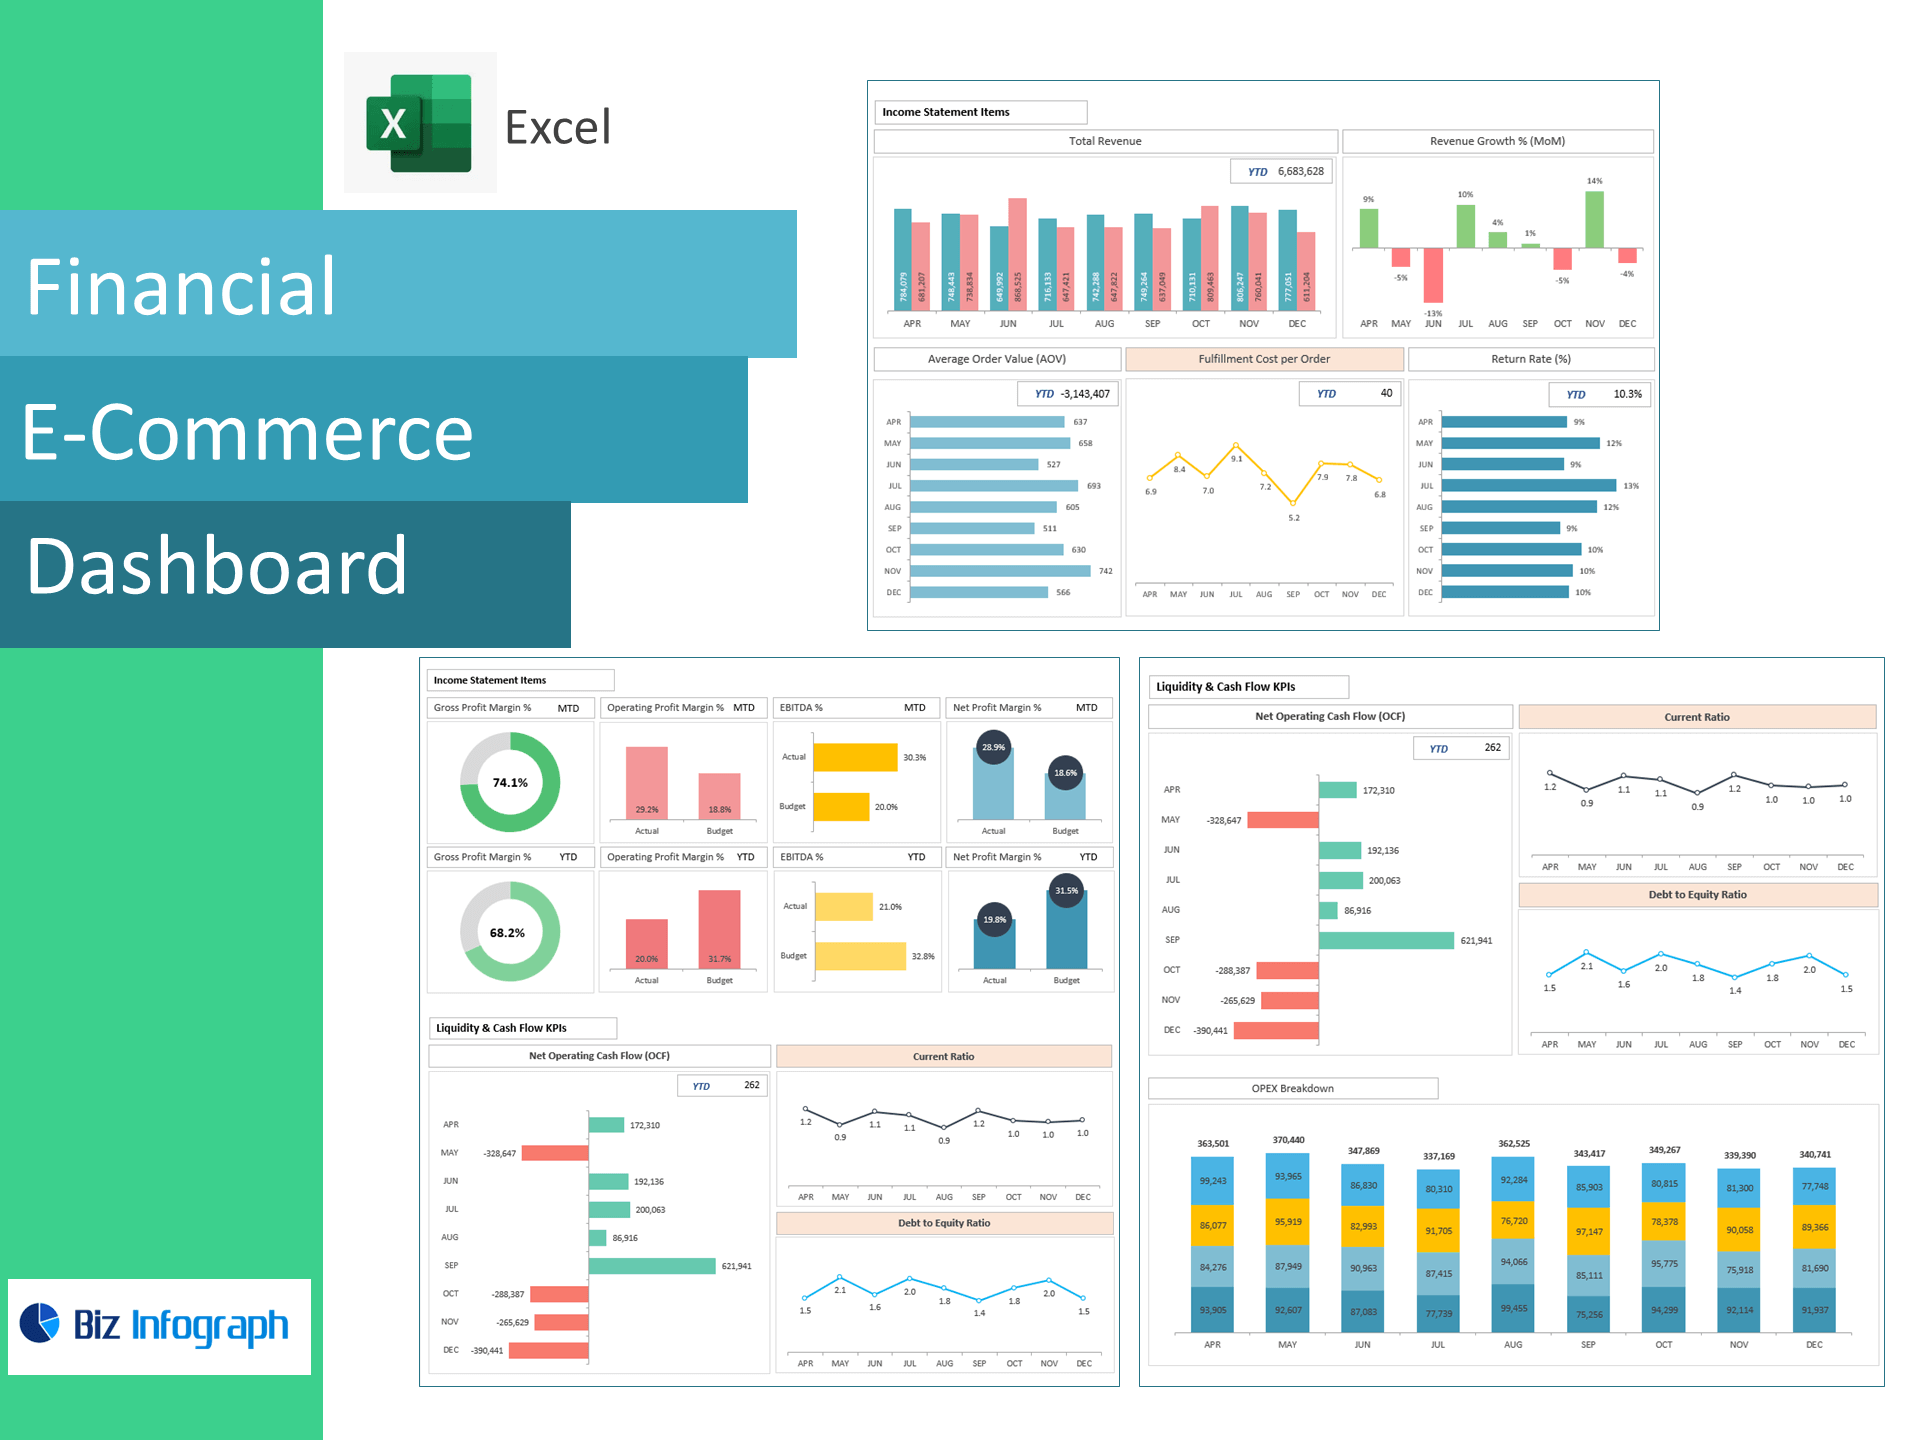
The E-commerce Dashboard Package is an all-in-one Excel solution designed to help online retailers and digital businesses track, analyze, and optimize their operations in real time. This package includes four focused dashboards: Order Fulfillment & Customer Experience, Inventory & Logistics Efficiency, E-commerce Finance, and Human Resource E-commerce Dashboard. These dashboards allow e-commerce teams to monitor key metrics such as order status, shipping times, customer satisfaction, inventory turnover, profit margins, and workforce productivity. With easy-to-read visuals, dynamic KPIs, and ready-to-use templates, this package empowers businesses to make informed decisions, reduce costs, enhance customer experience, and scale faster in a competitive digital marketplace.
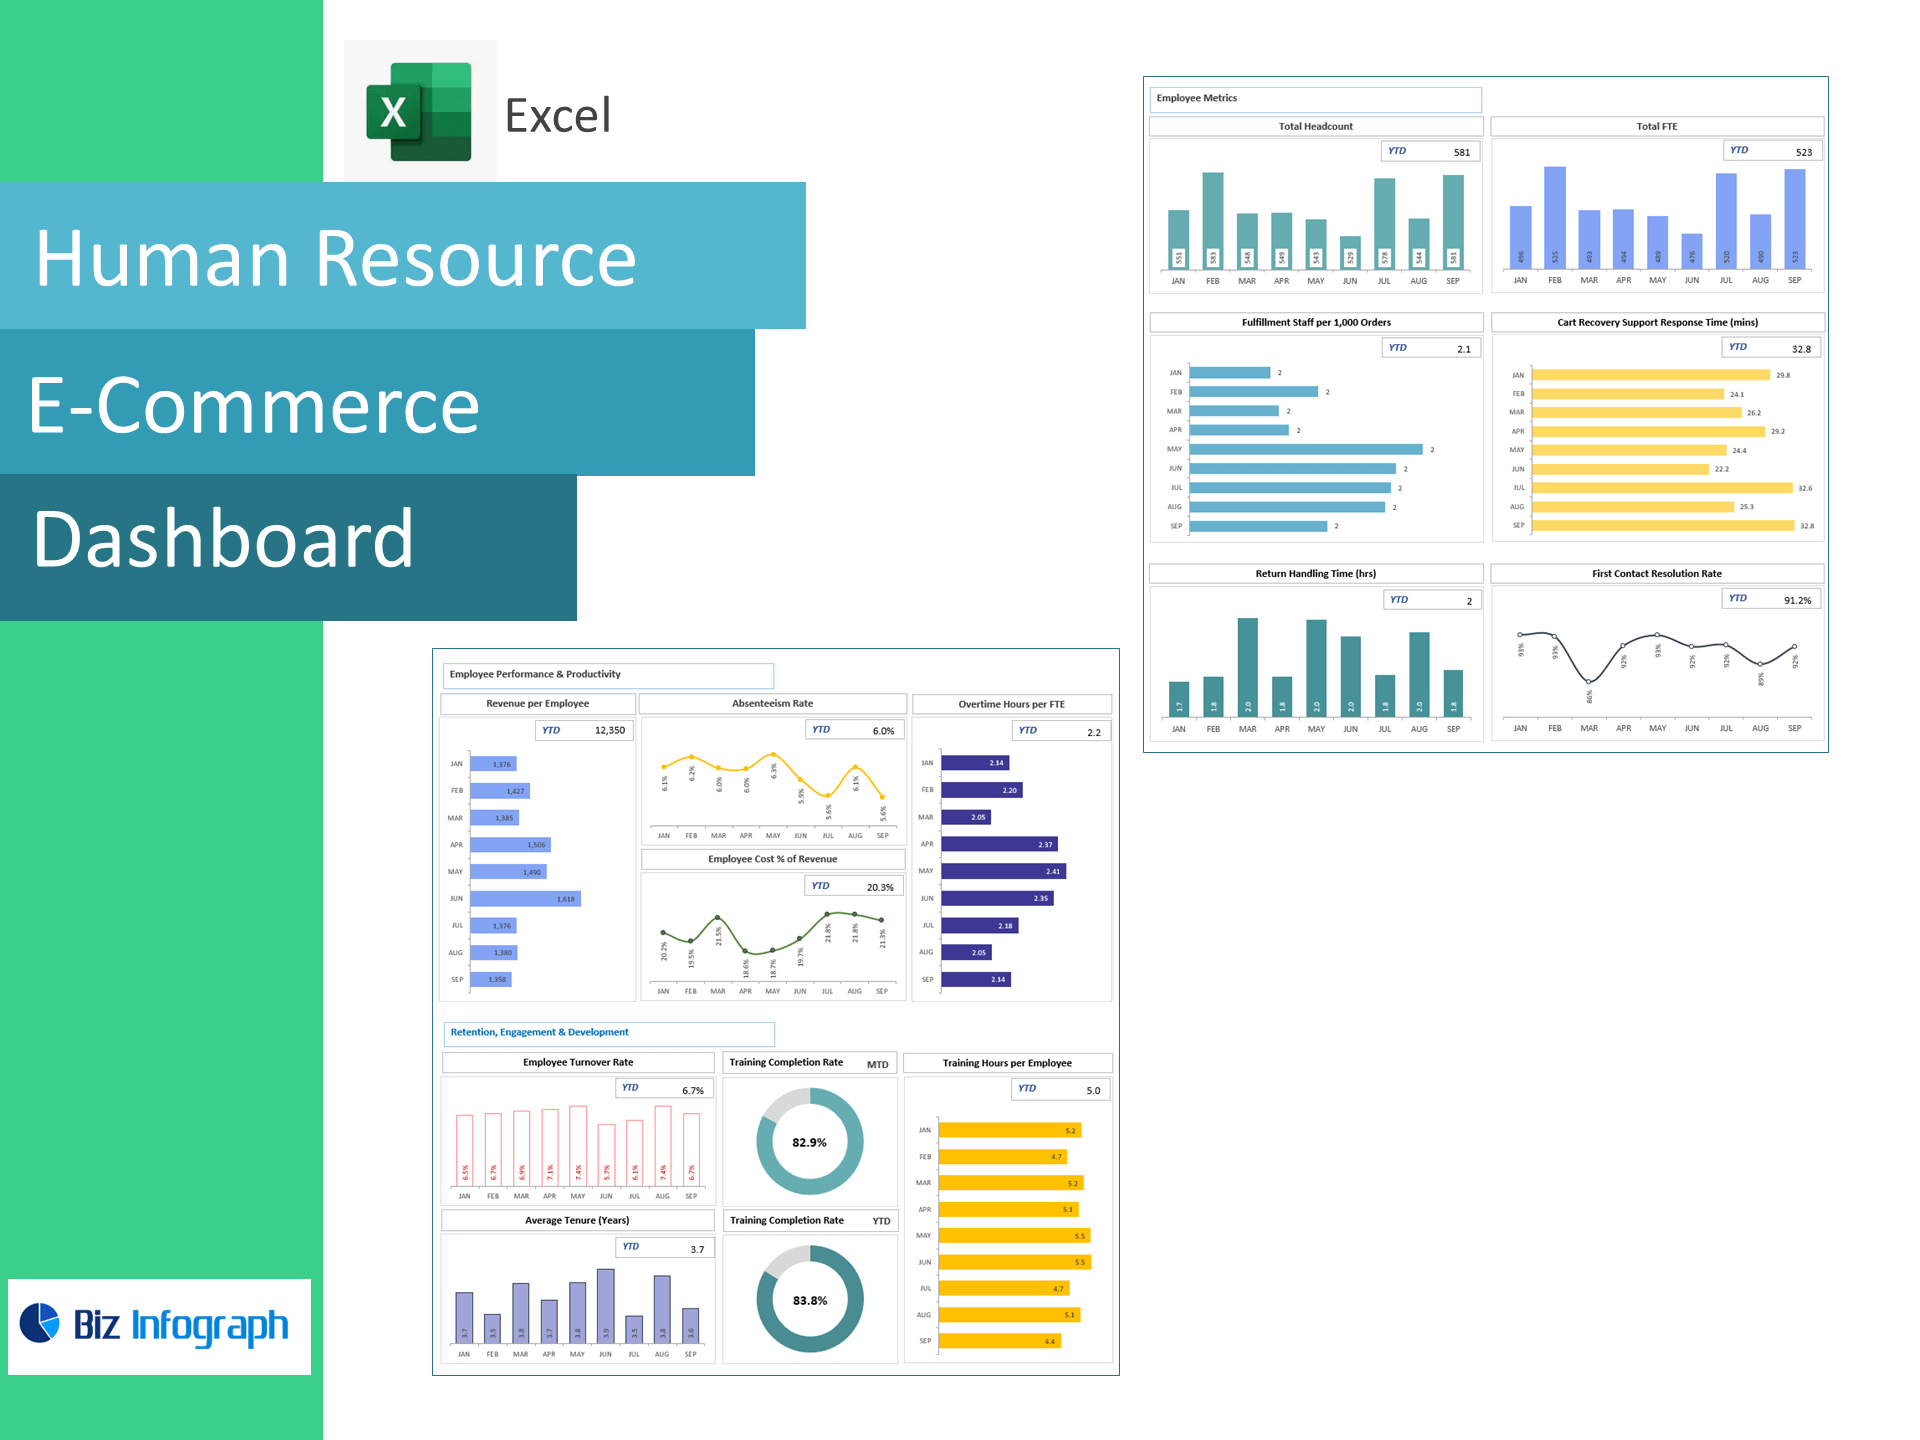
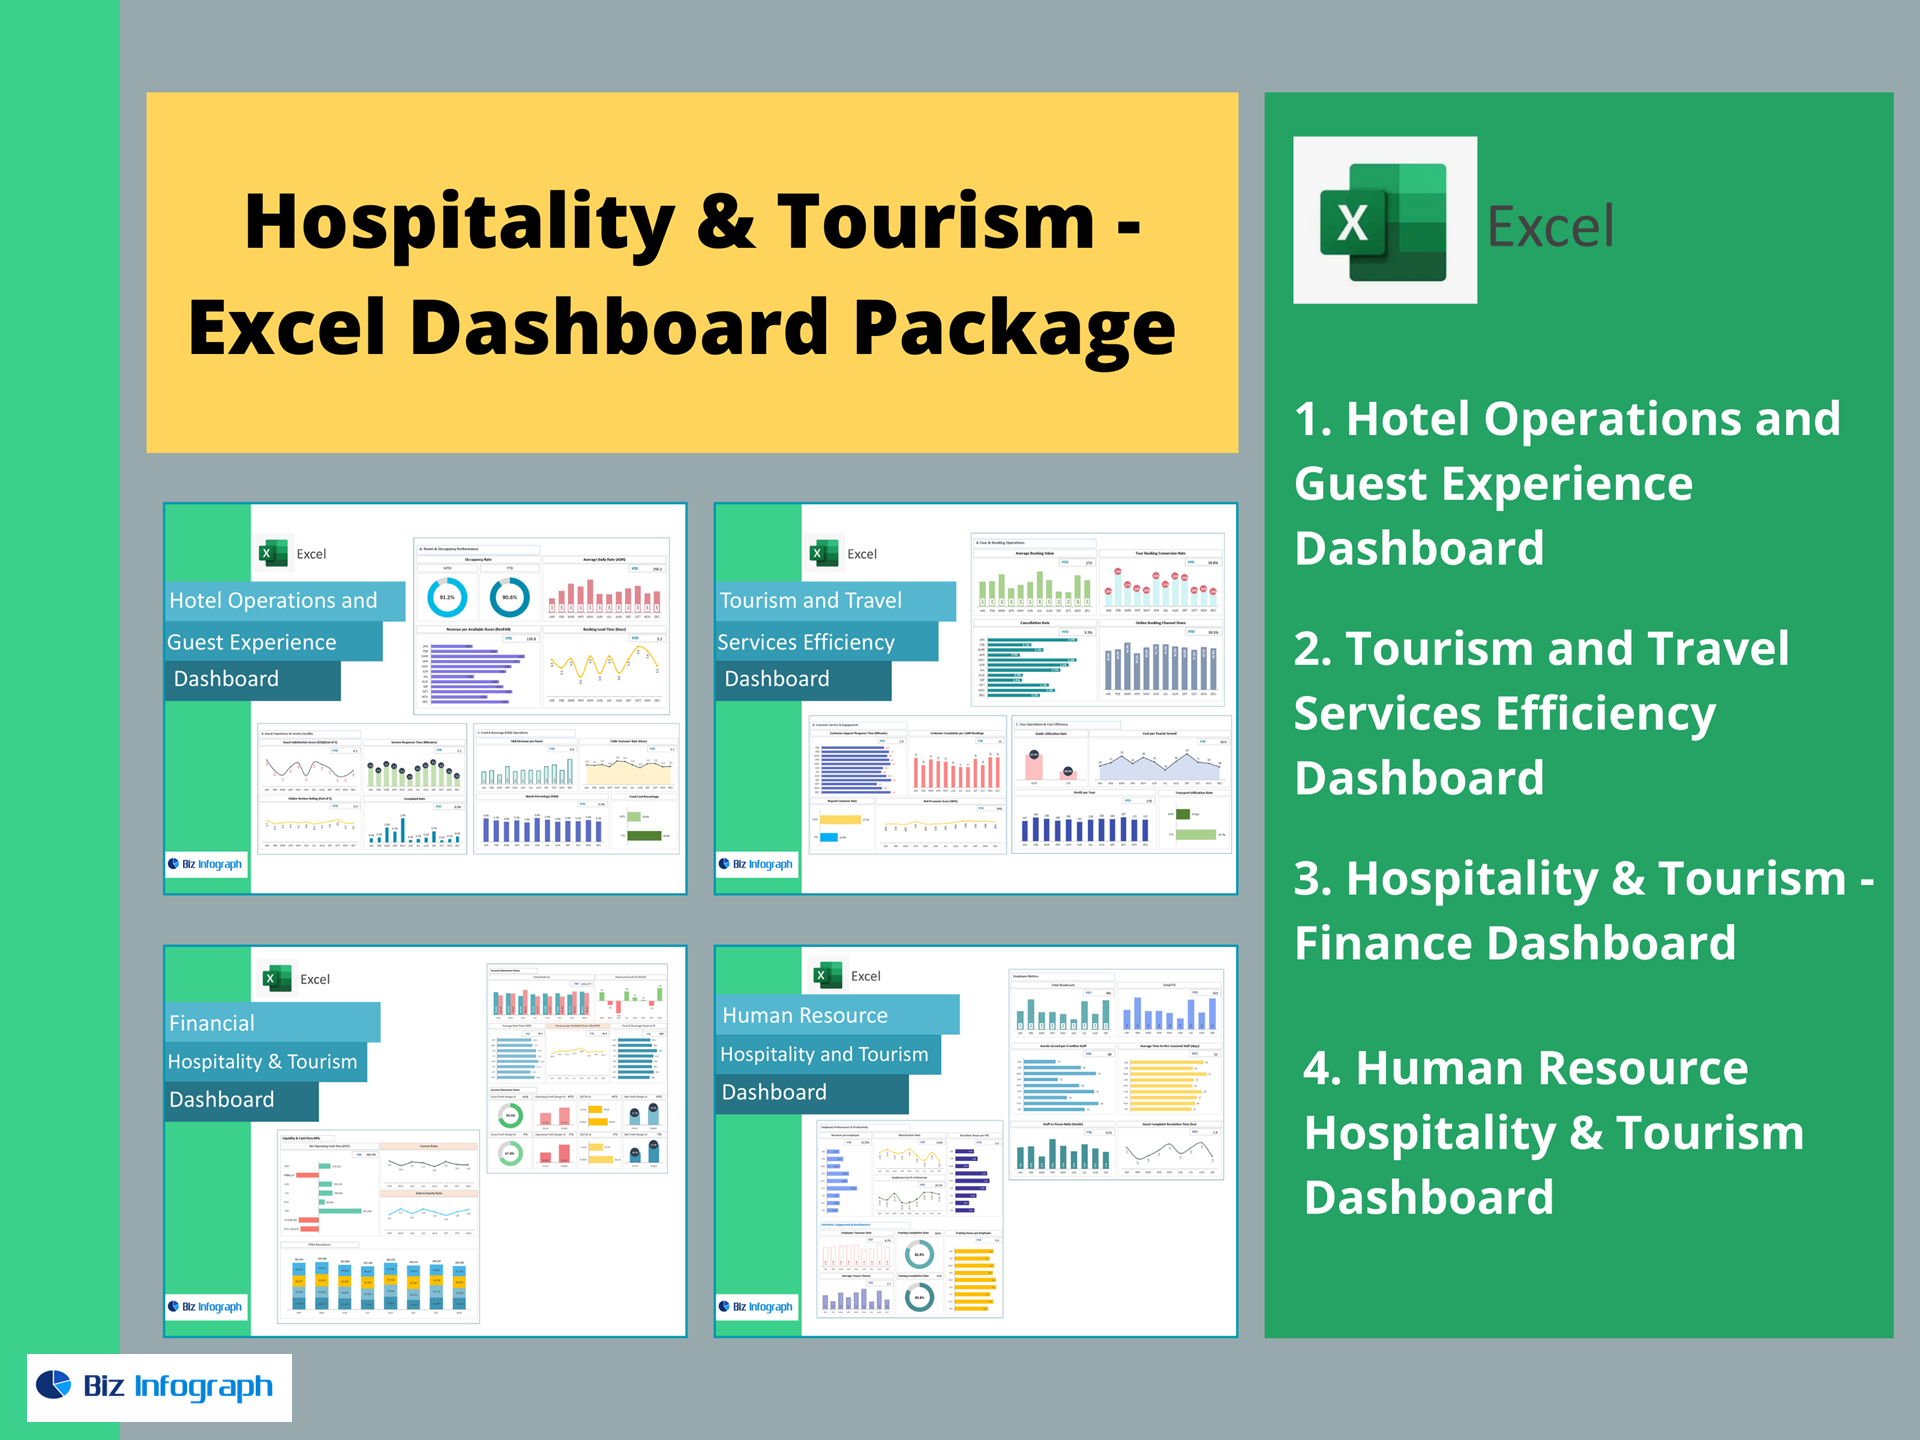
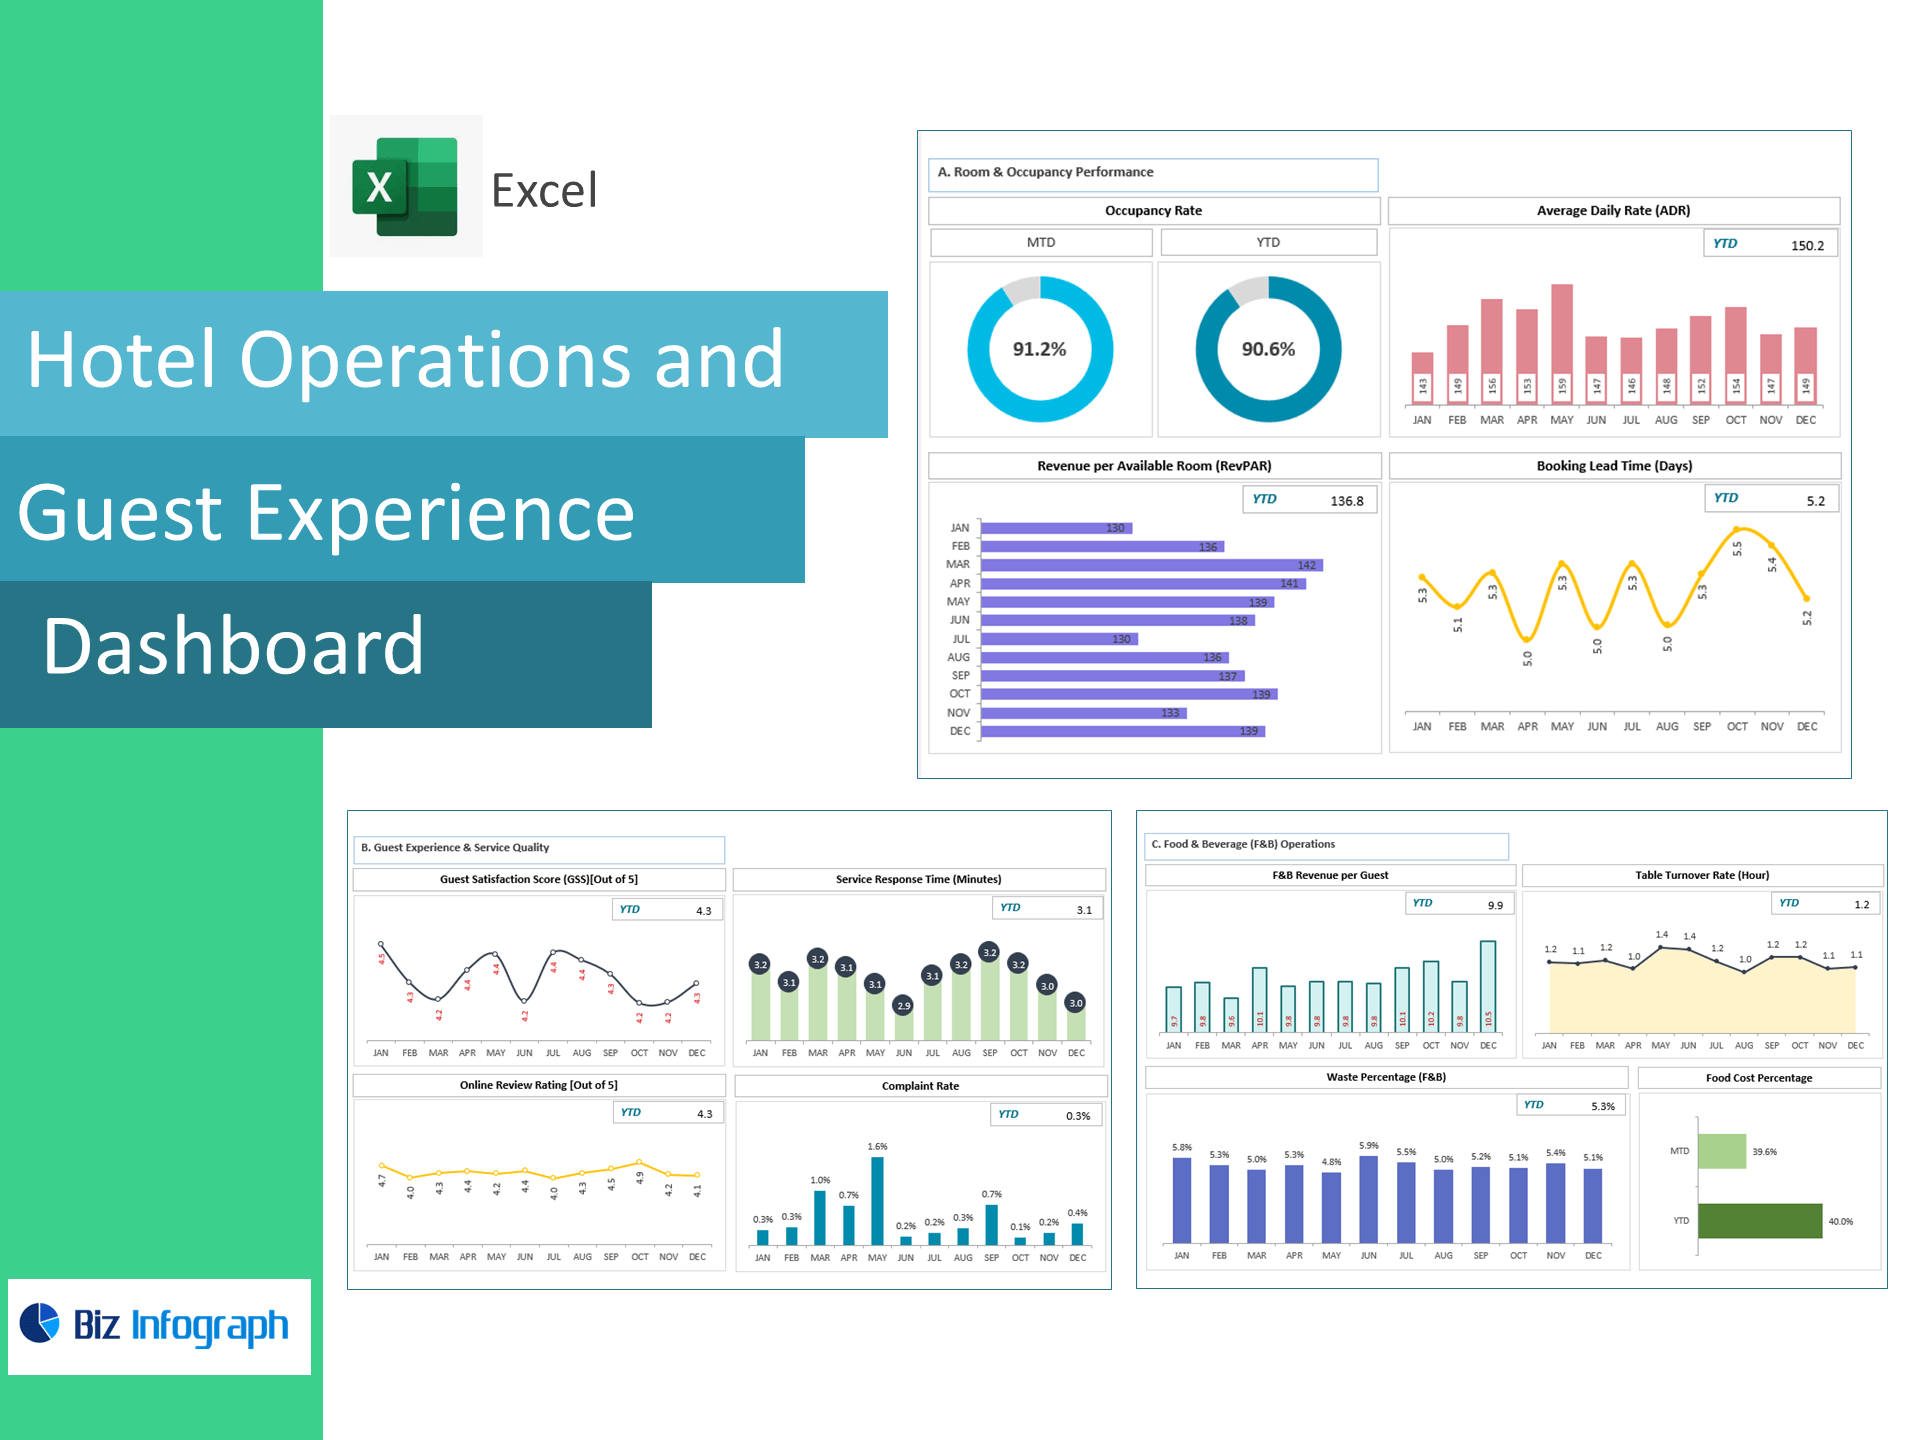
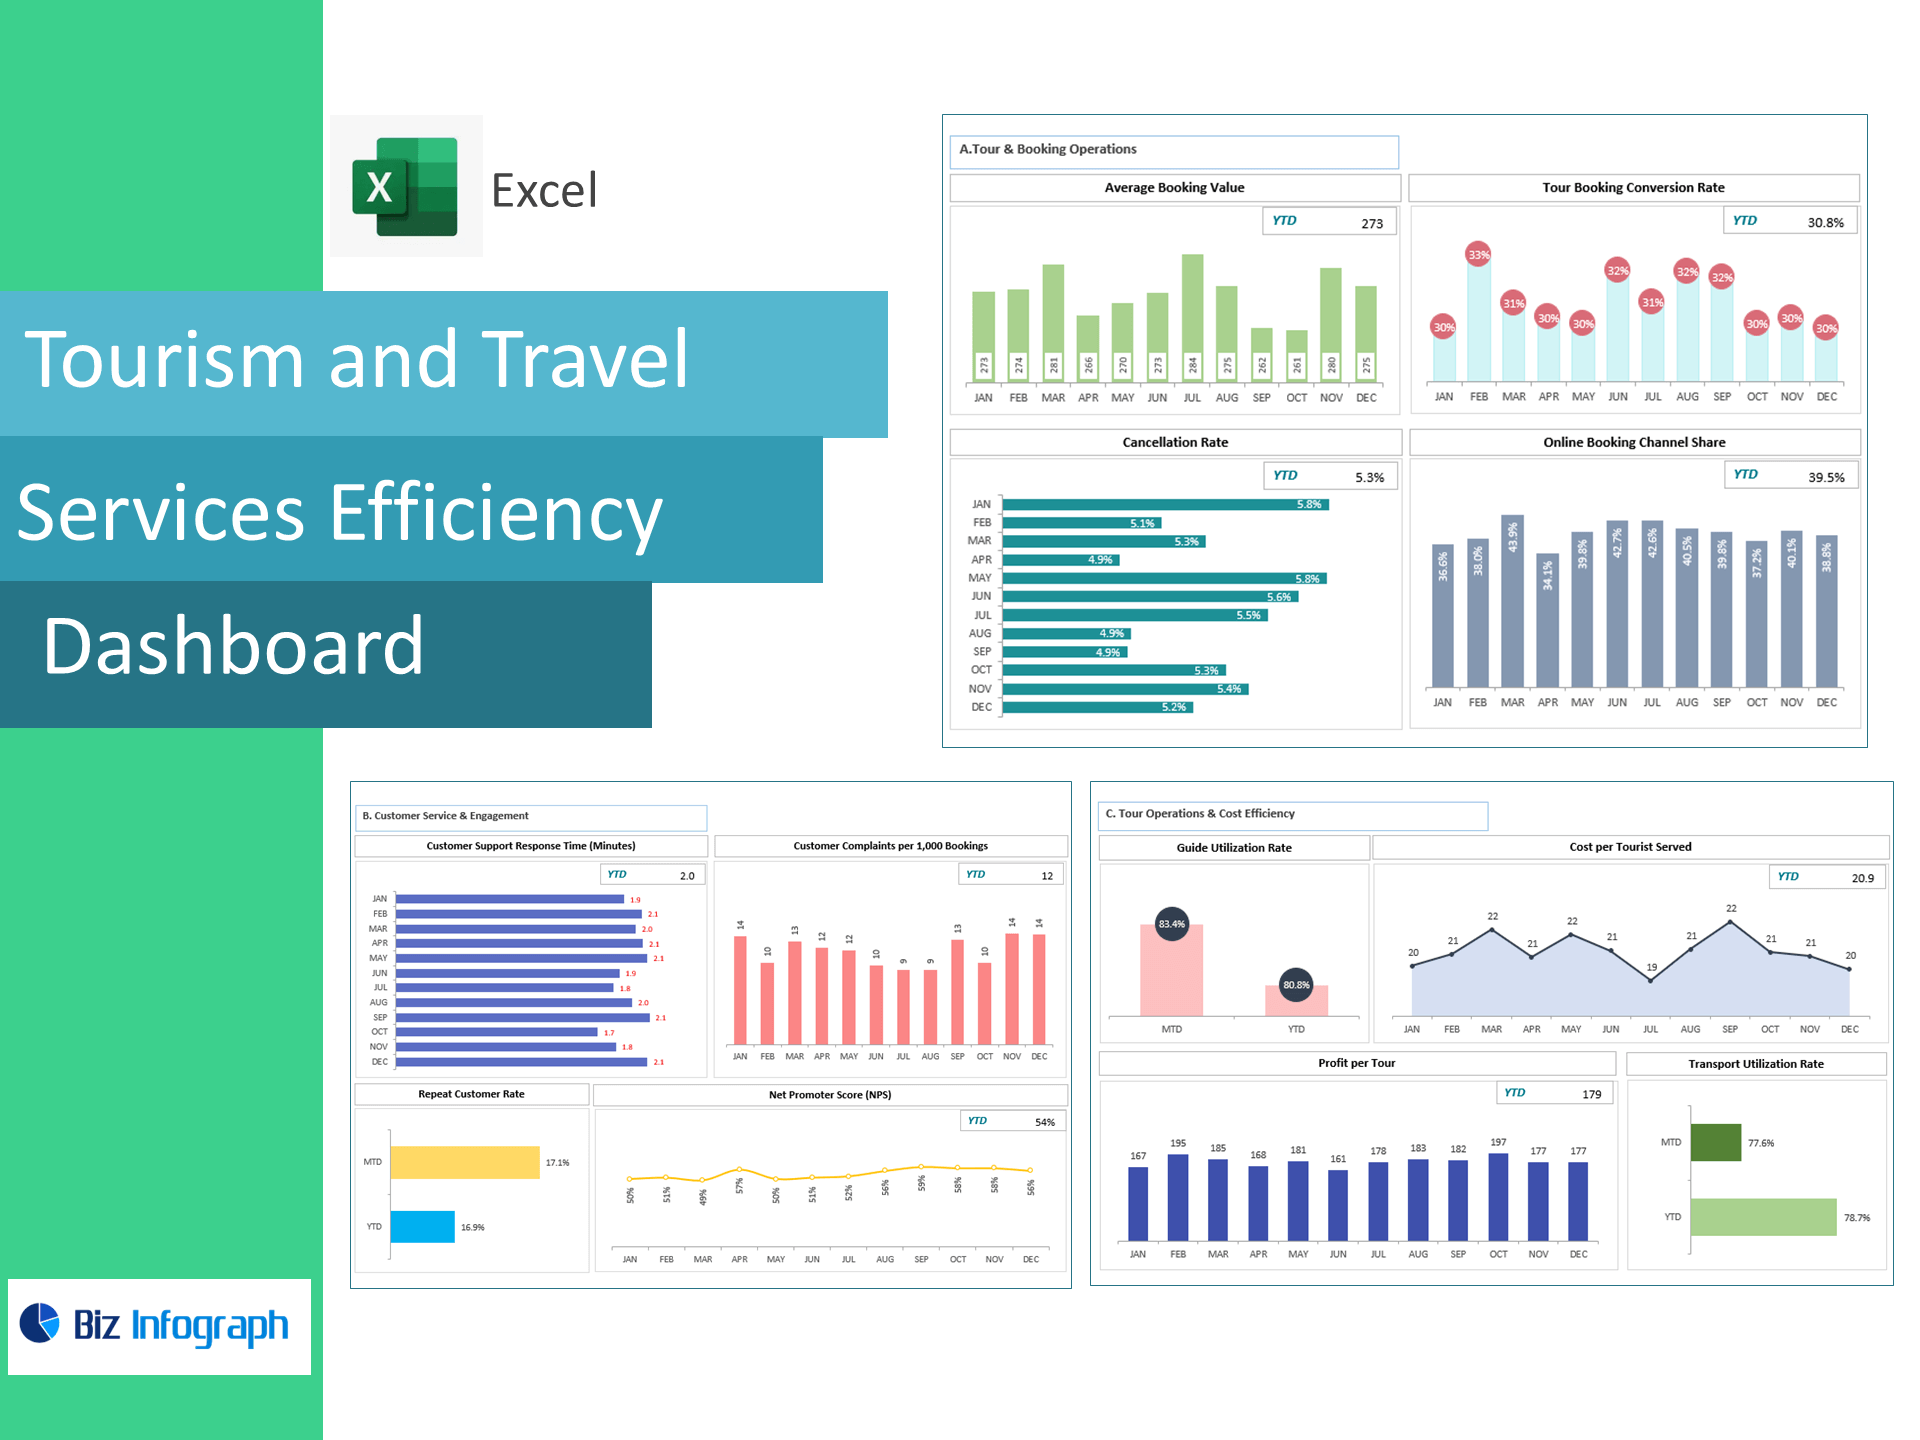
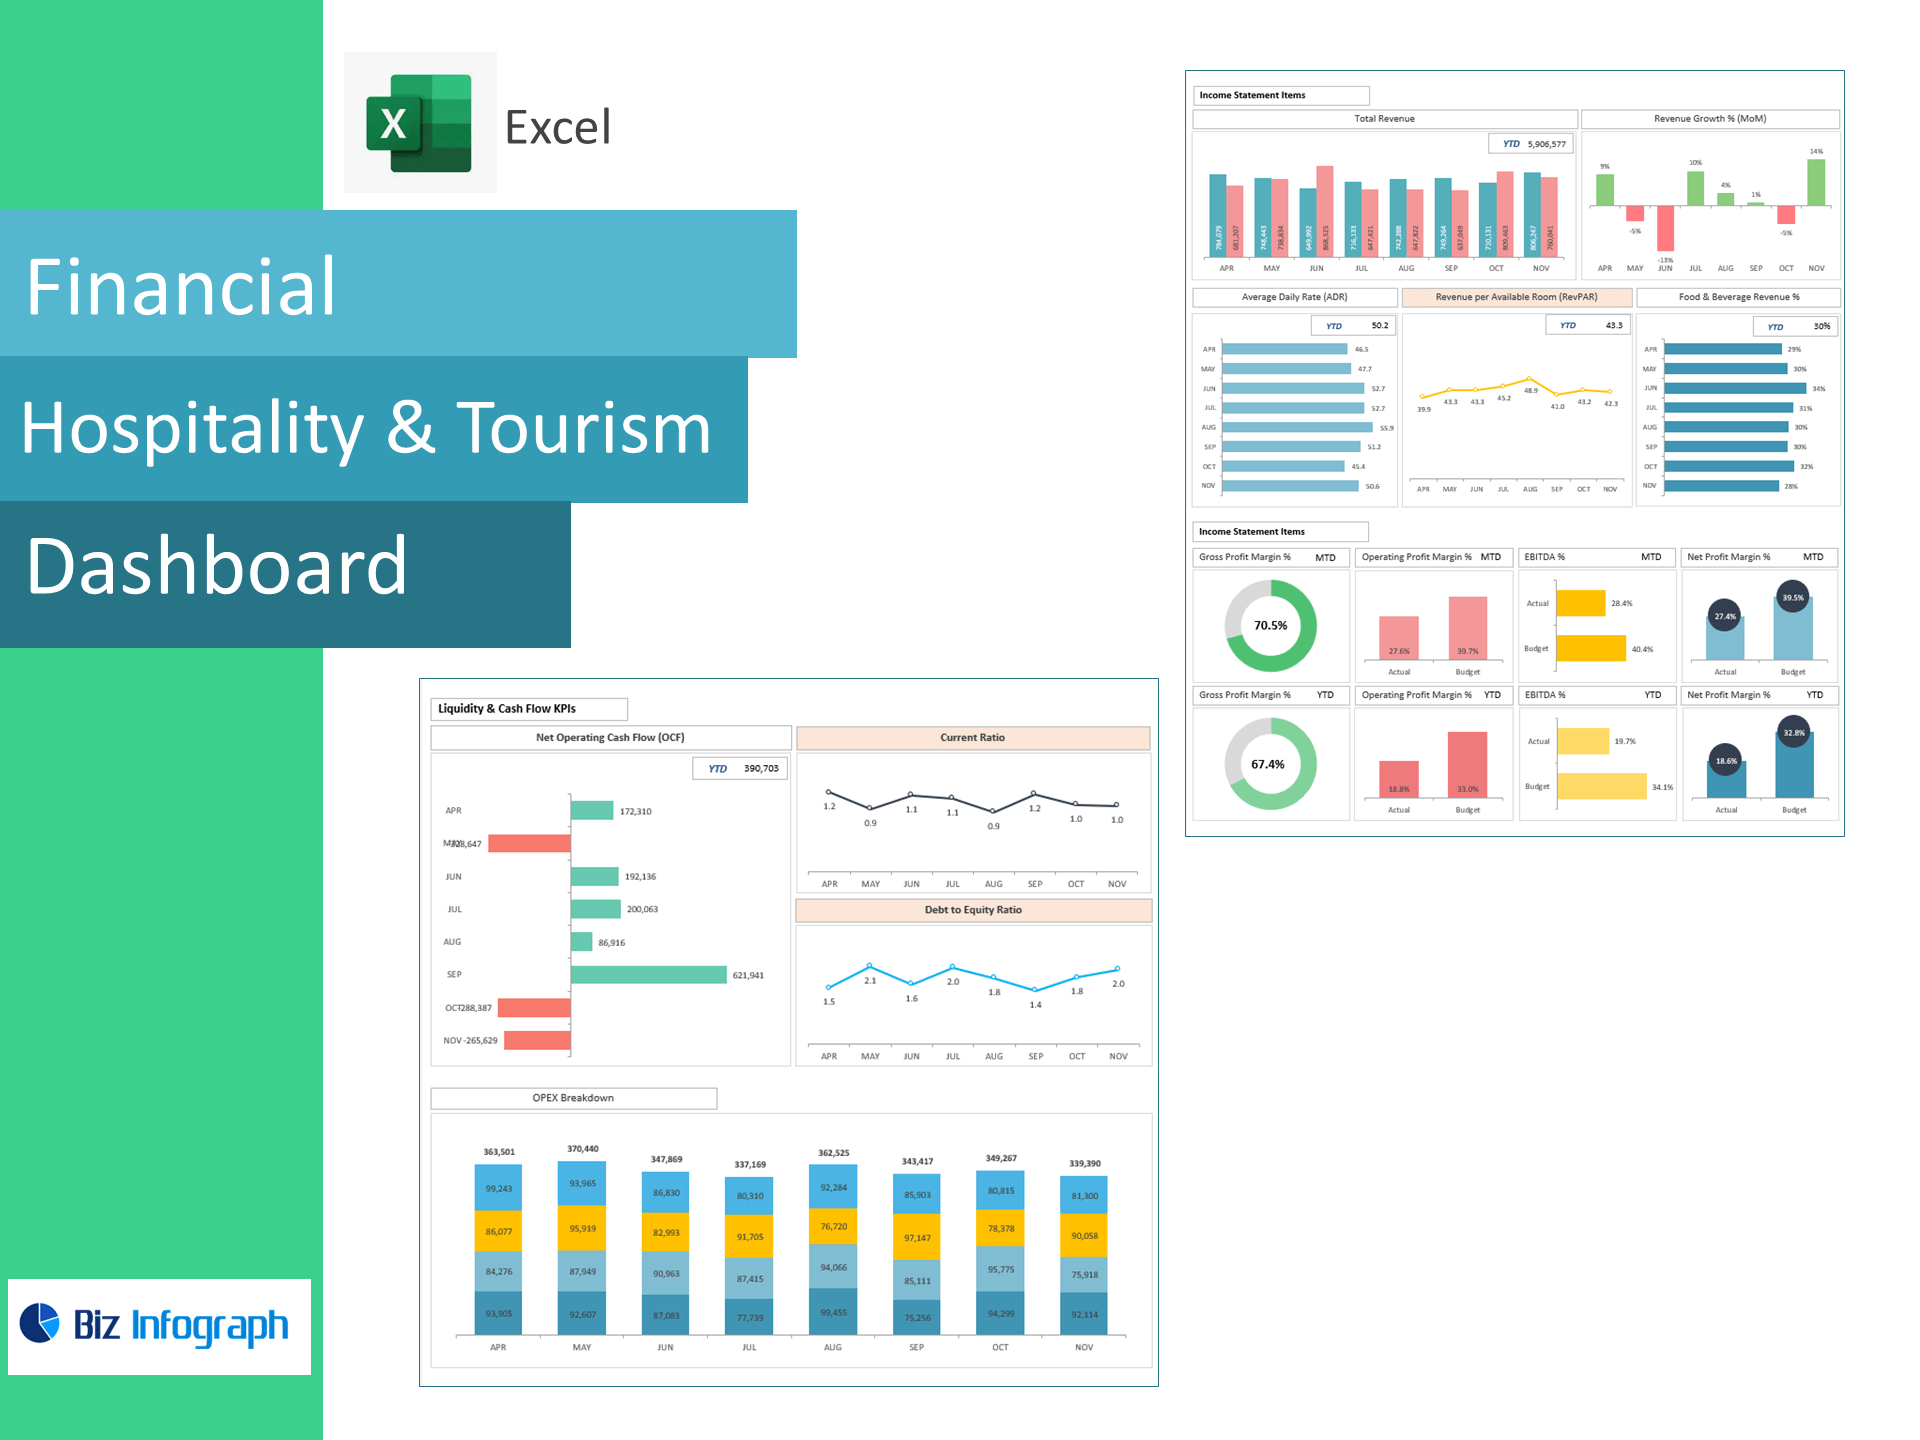
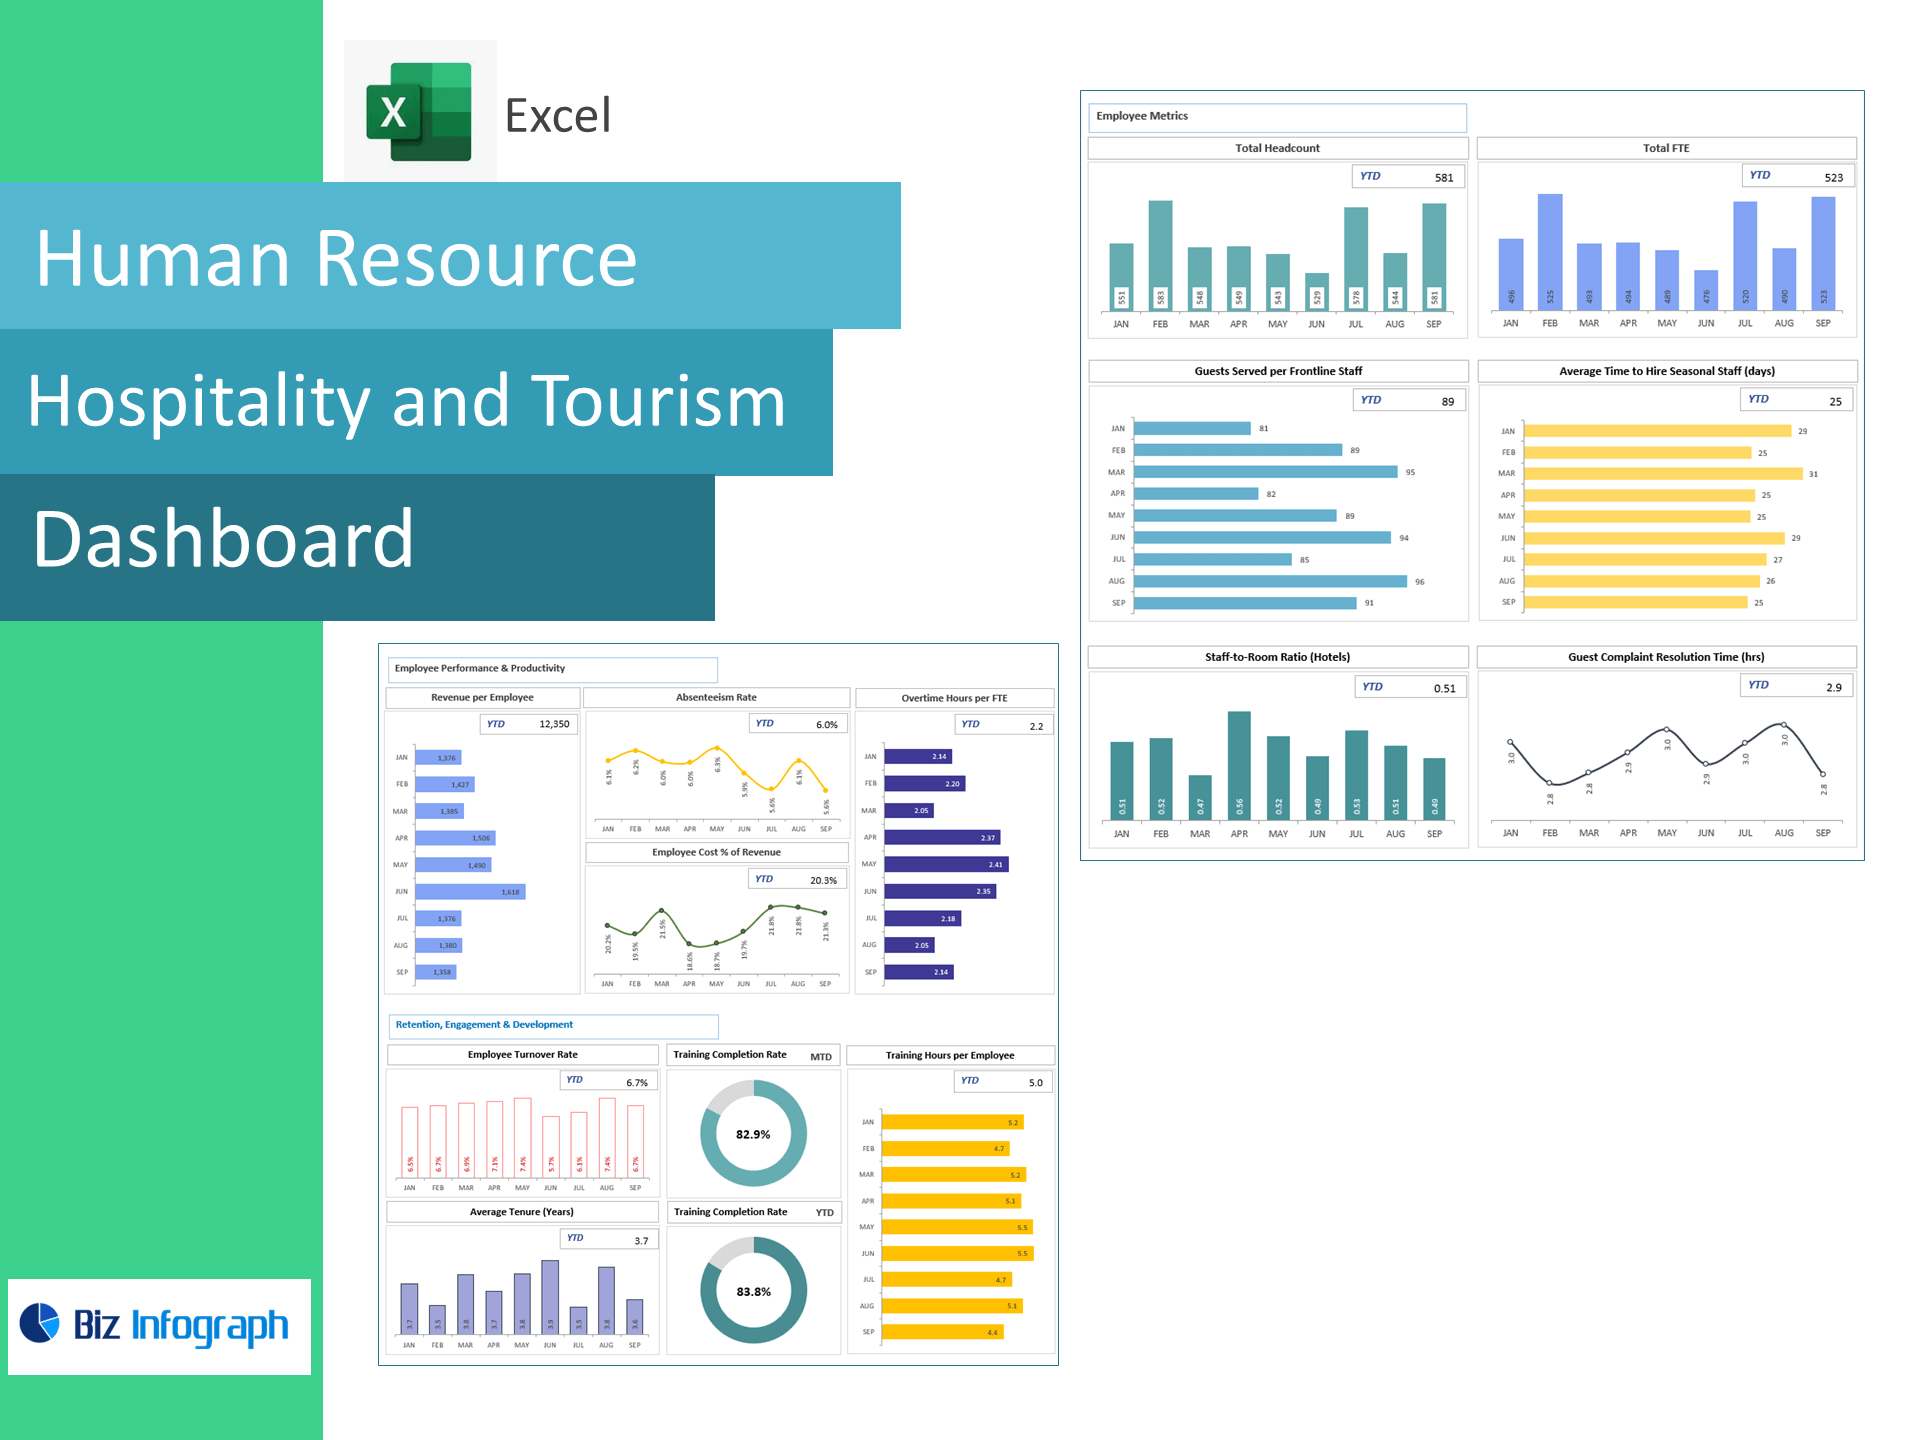
The Hospitality & Tourism Dashboard Package is a powerful Excel-based solution tailored for hotel managers, tourism operators, and travel service providers to track performance, enhance guest experiences, and drive operational efficiency. This package includes four insightful dashboards: Hotel Operations & Guest Experience, Tourism and Travel Services Efficiency, Hospitality & Tourism Finance, and Human Resource Management. From monitoring occupancy rates and RevPAR to analyzing travel service quality, staff productivity, and financial performance, each dashboard provides real-time data visualization and actionable insights. Designed to streamline decision-making and optimize guest satisfaction, this package equips hospitality and tourism professionals with the tools to thrive in a competitive industry.
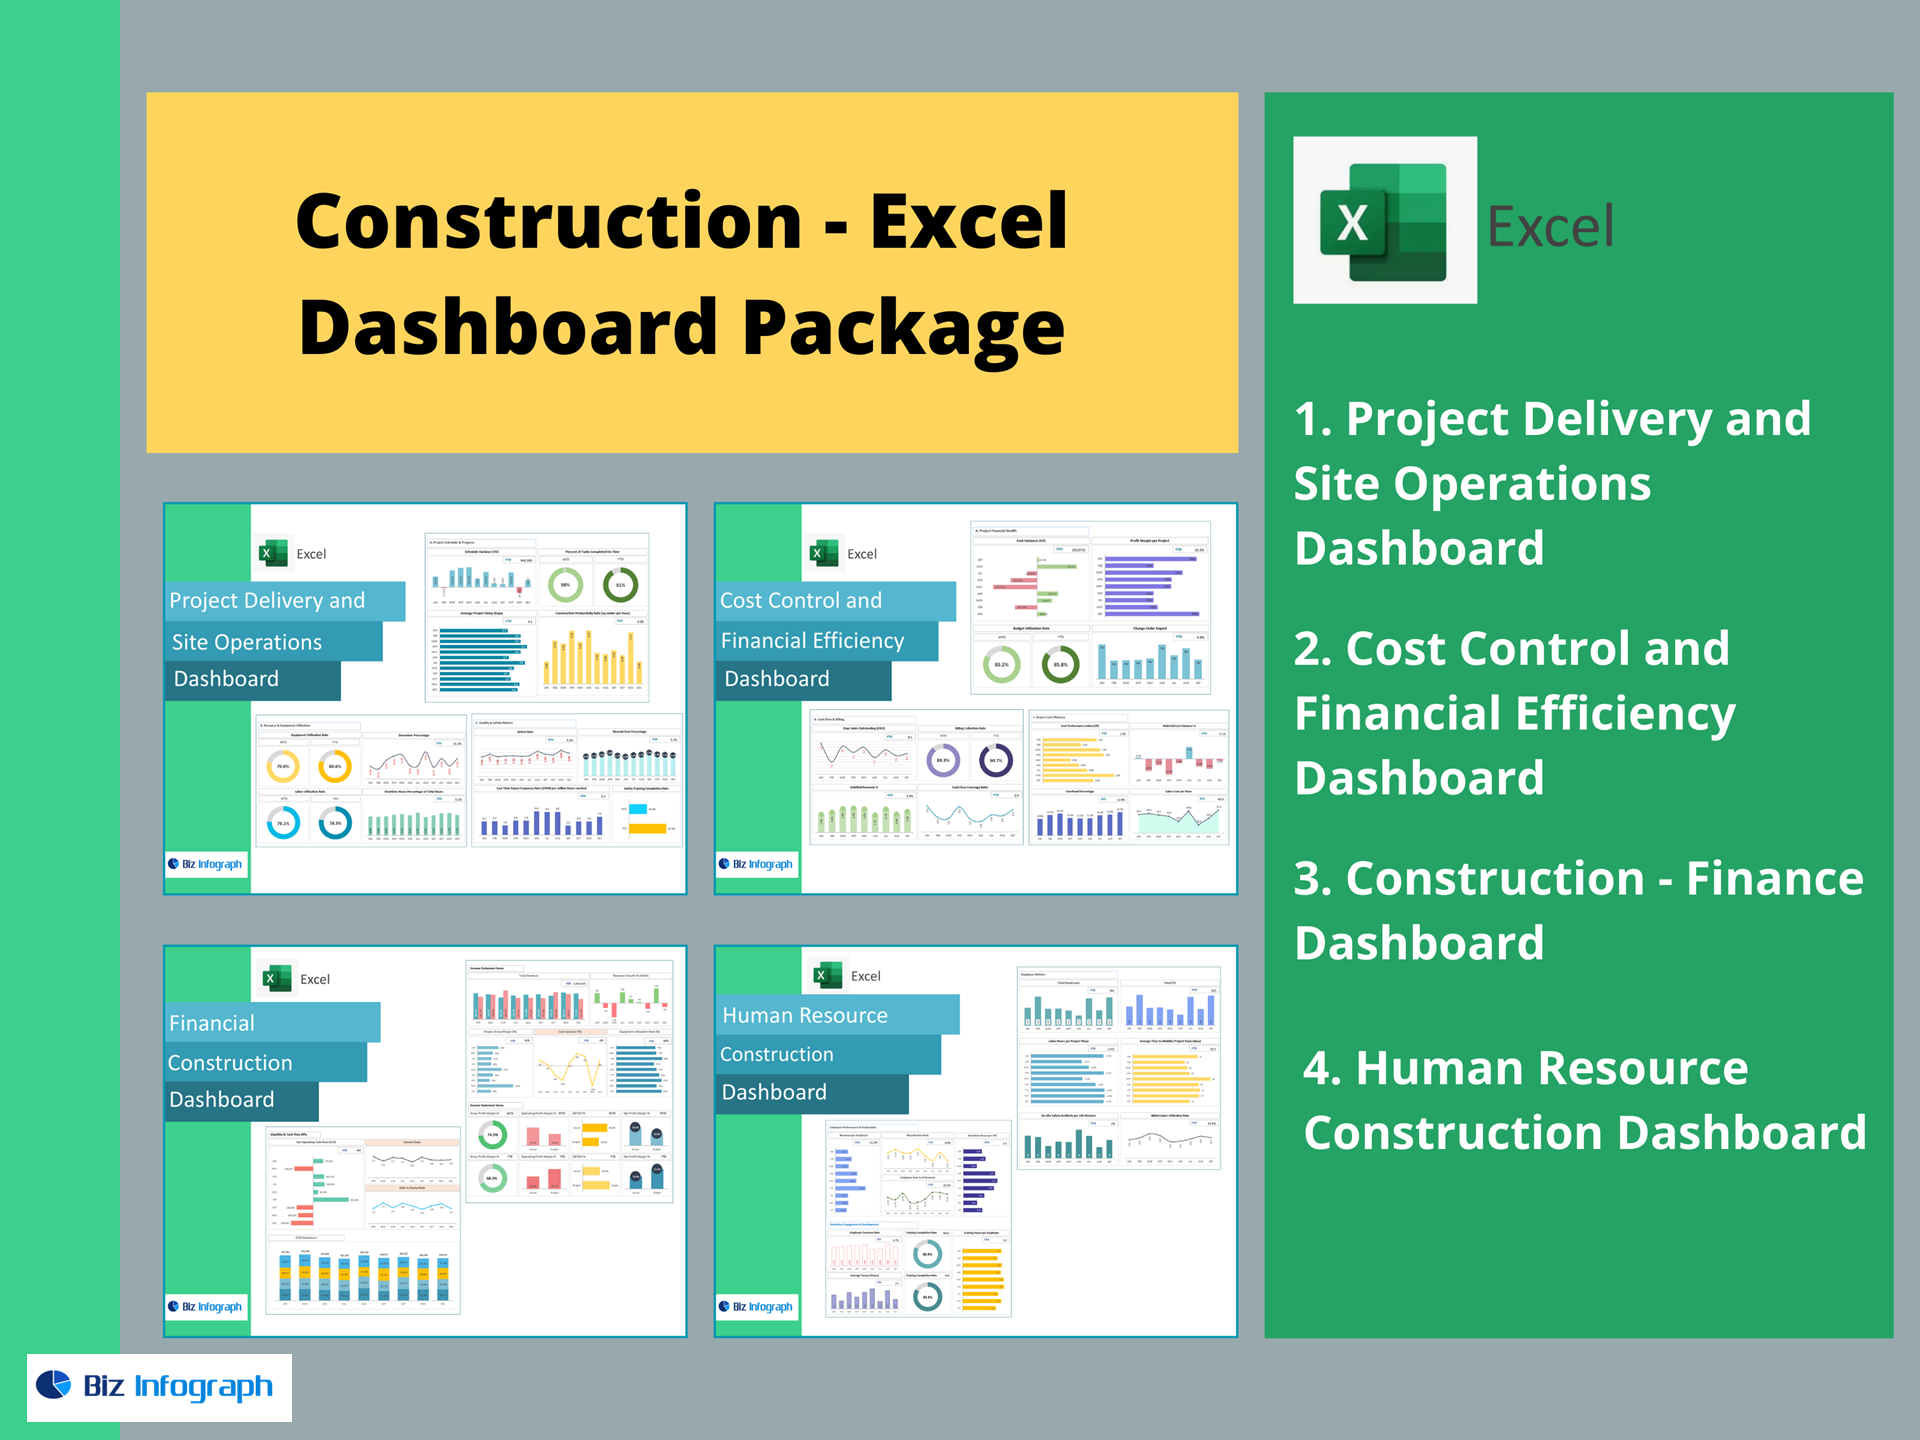
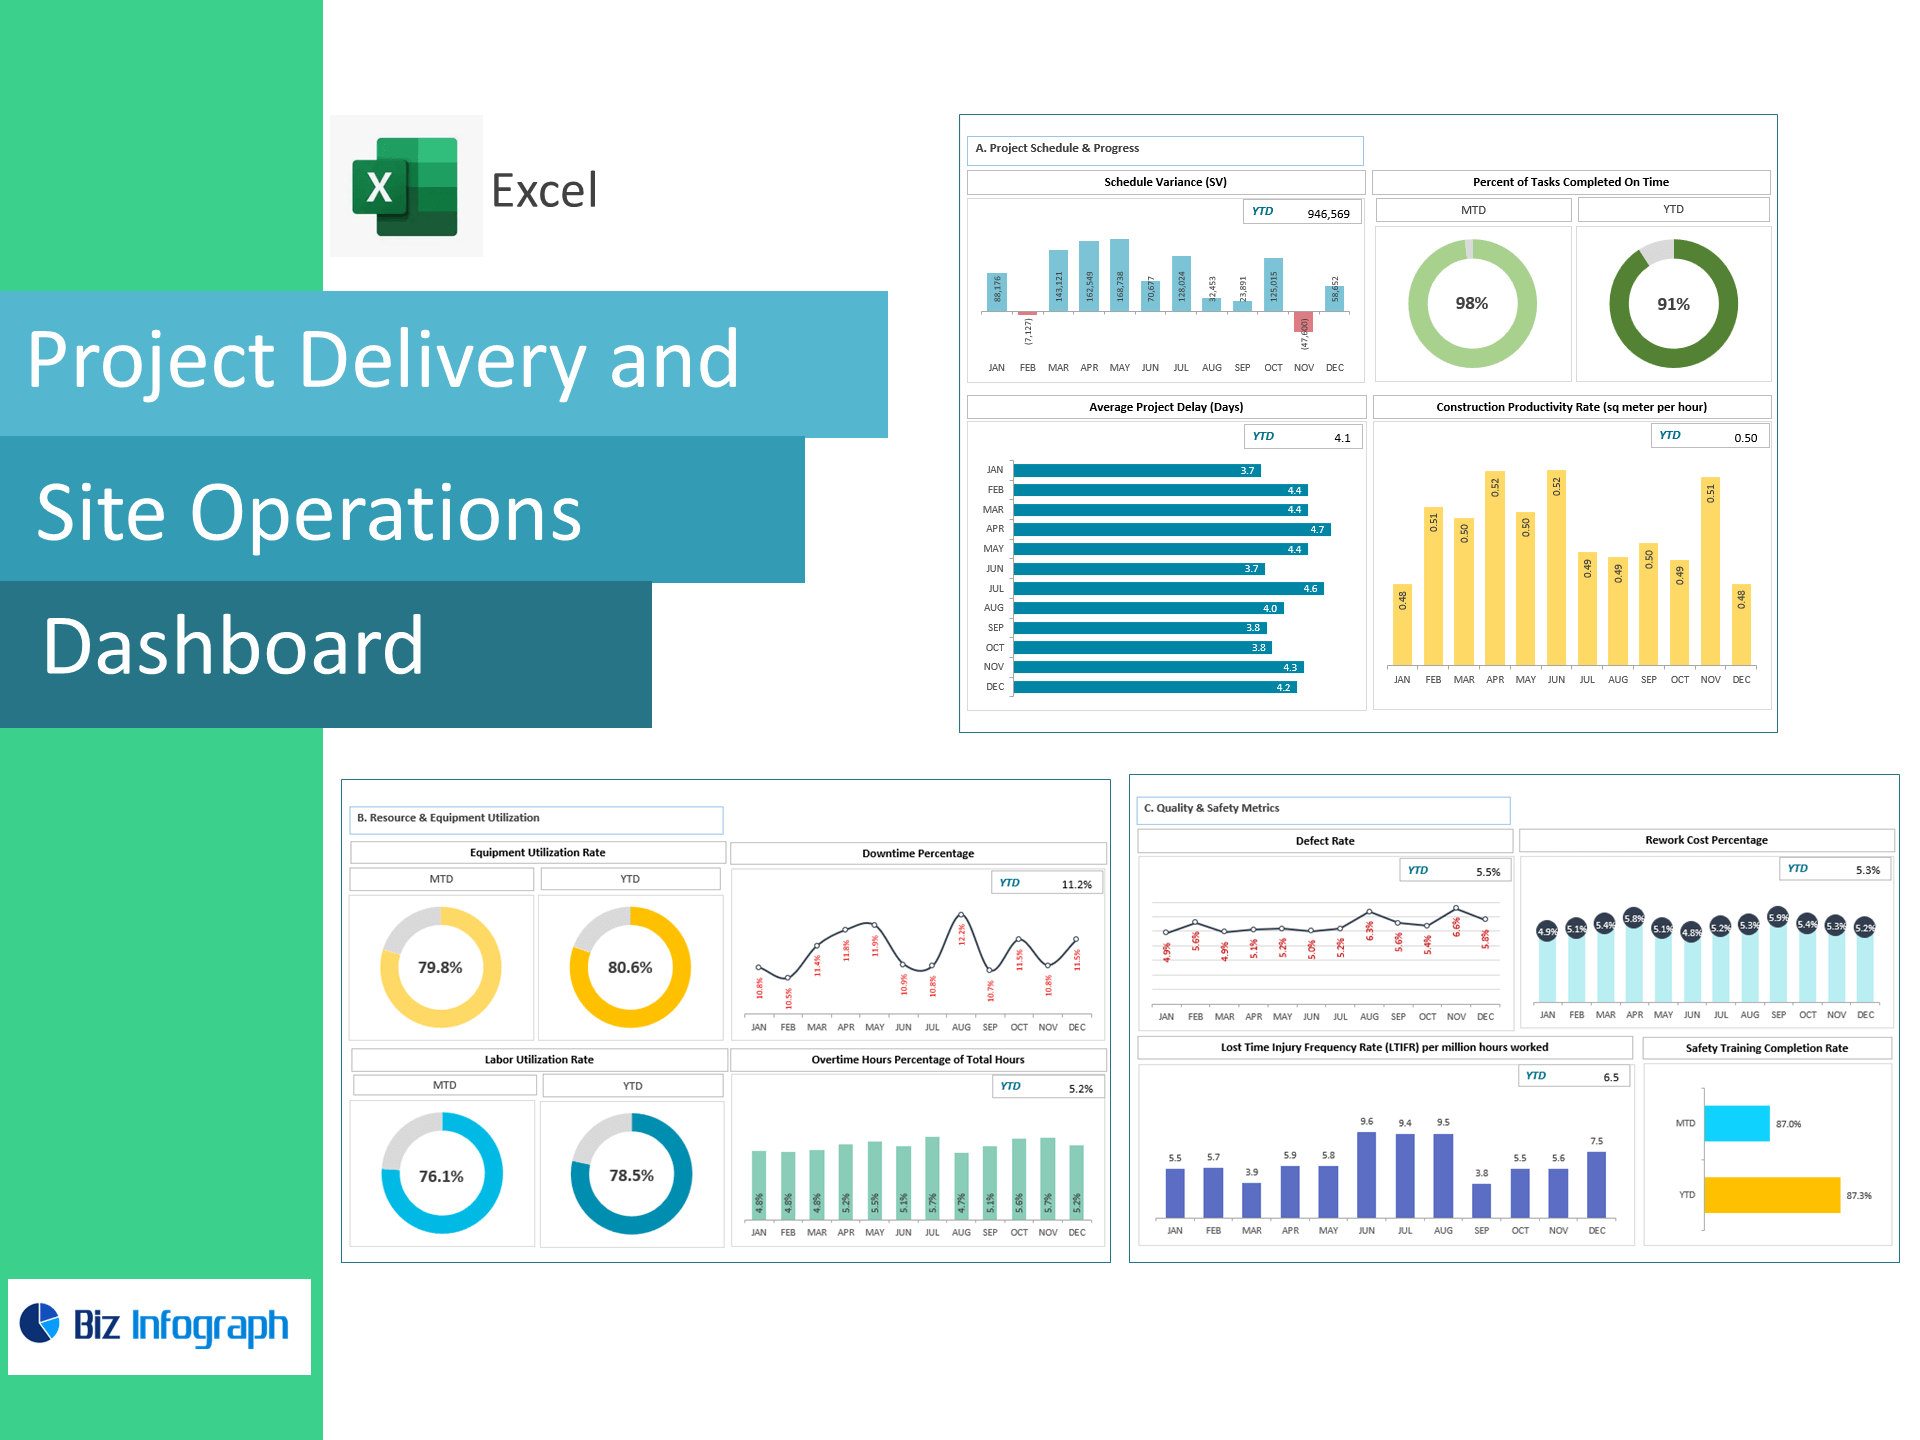
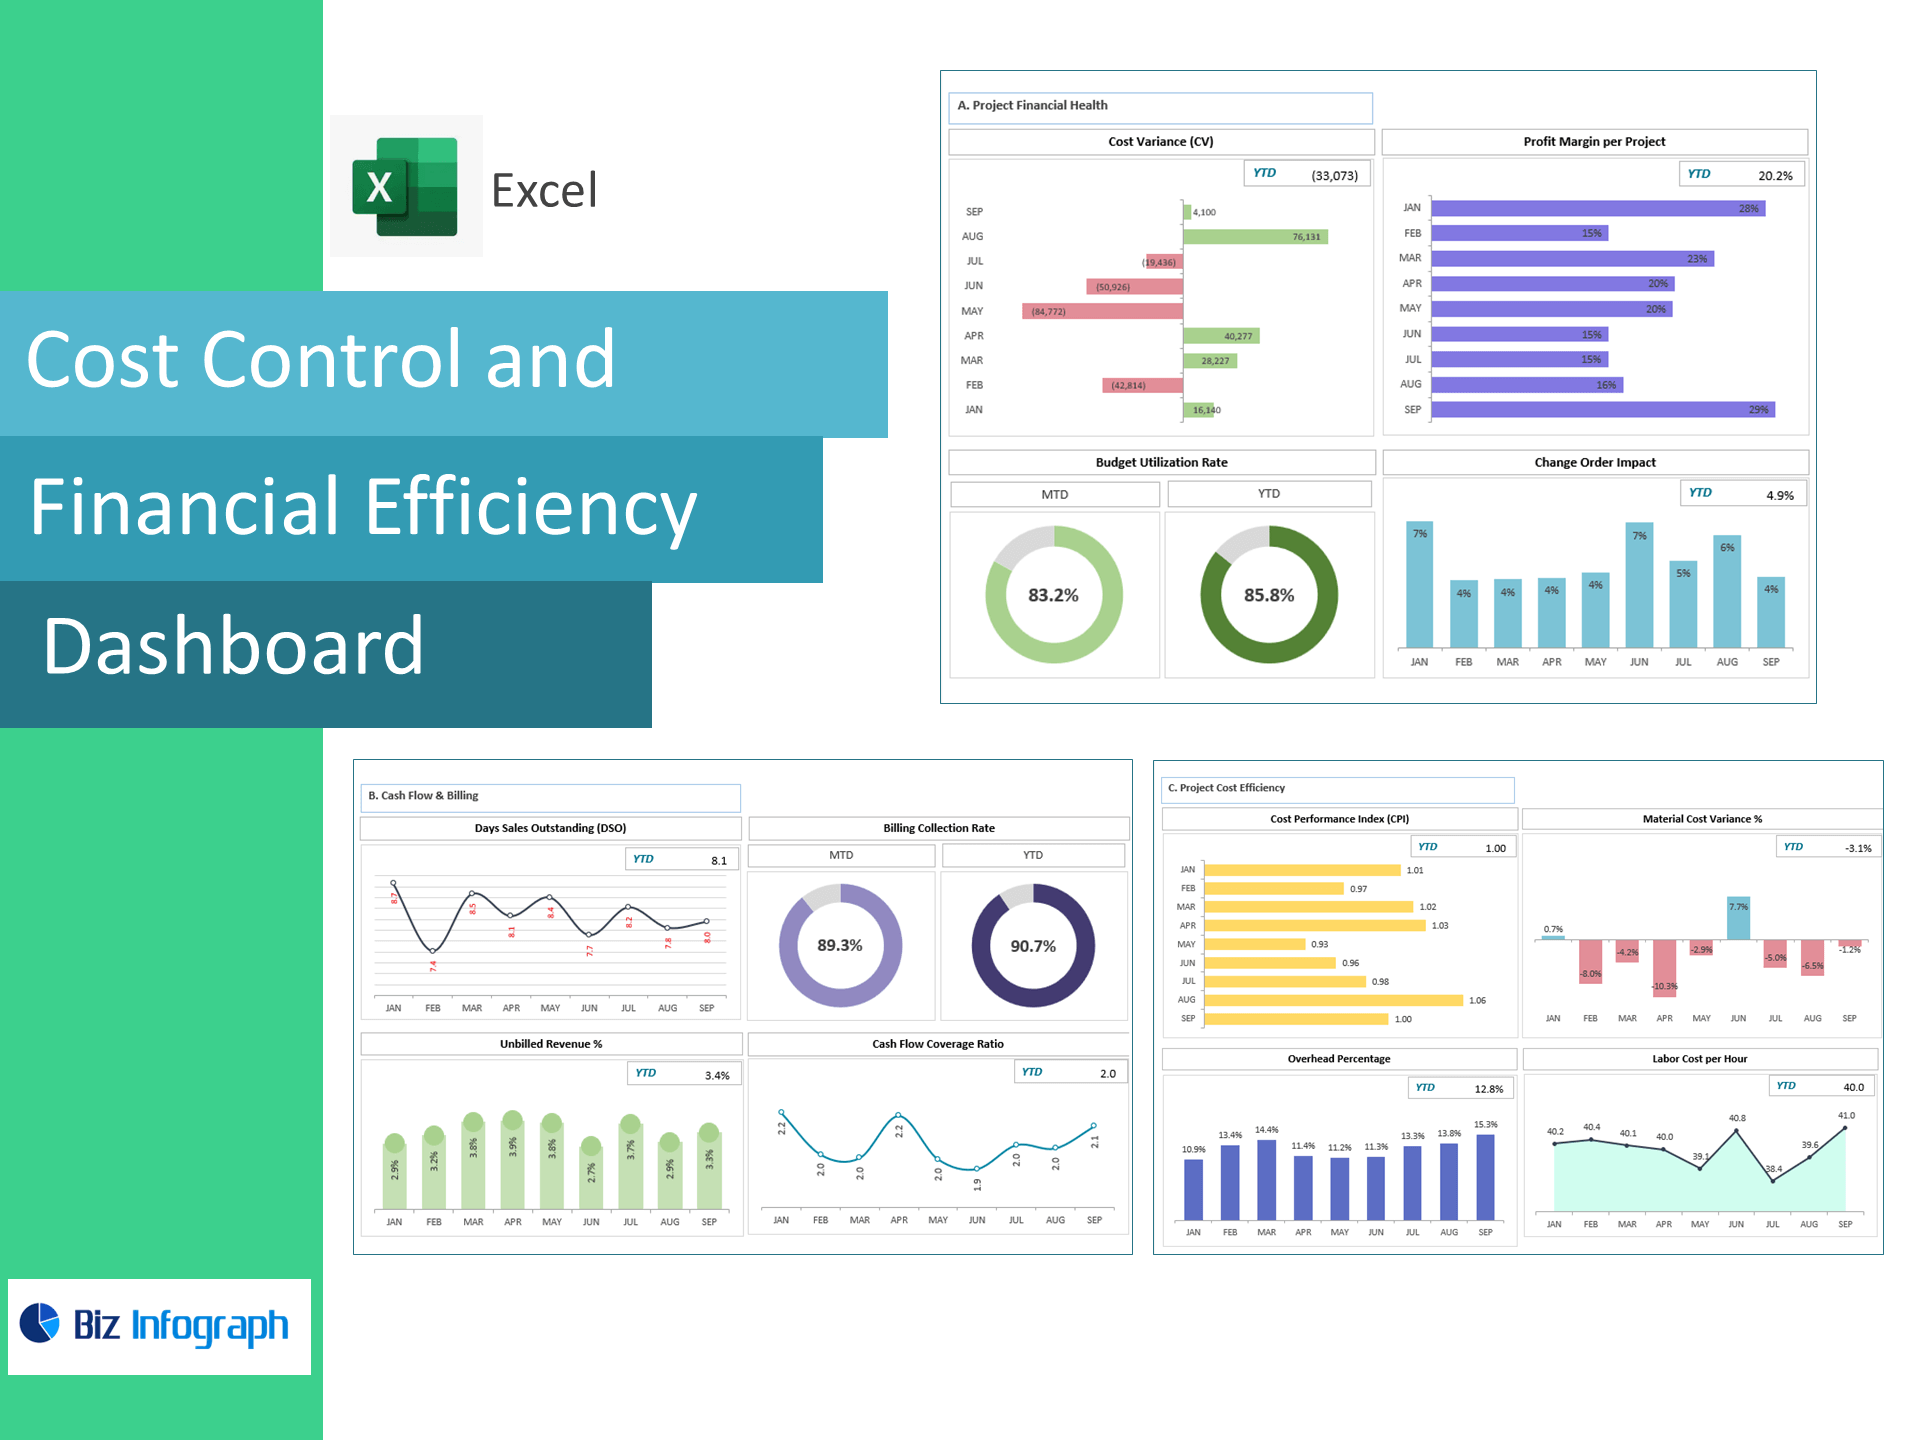
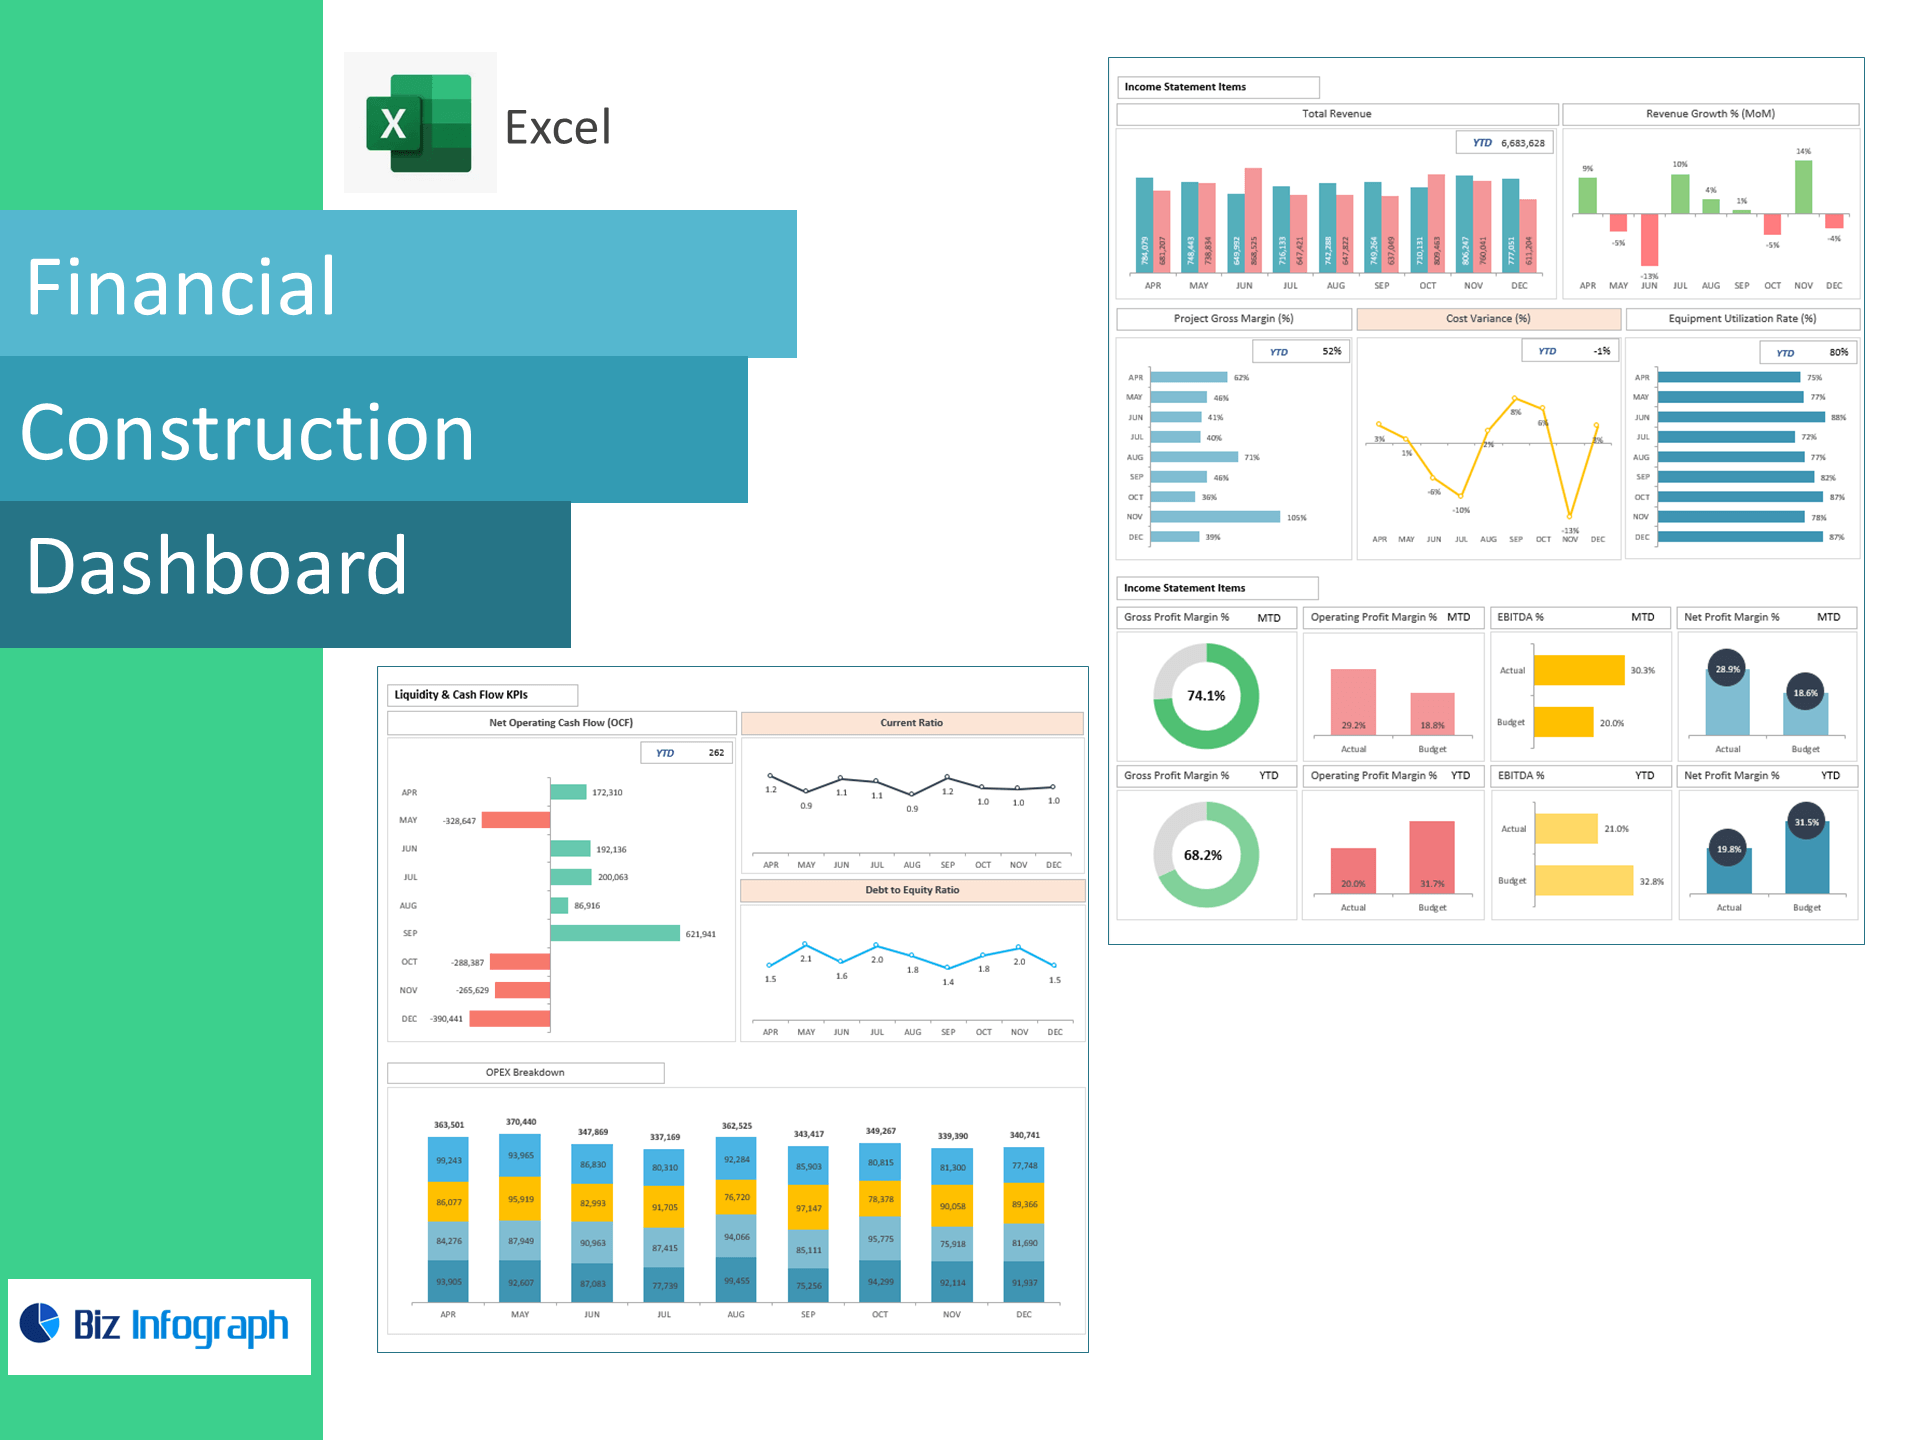
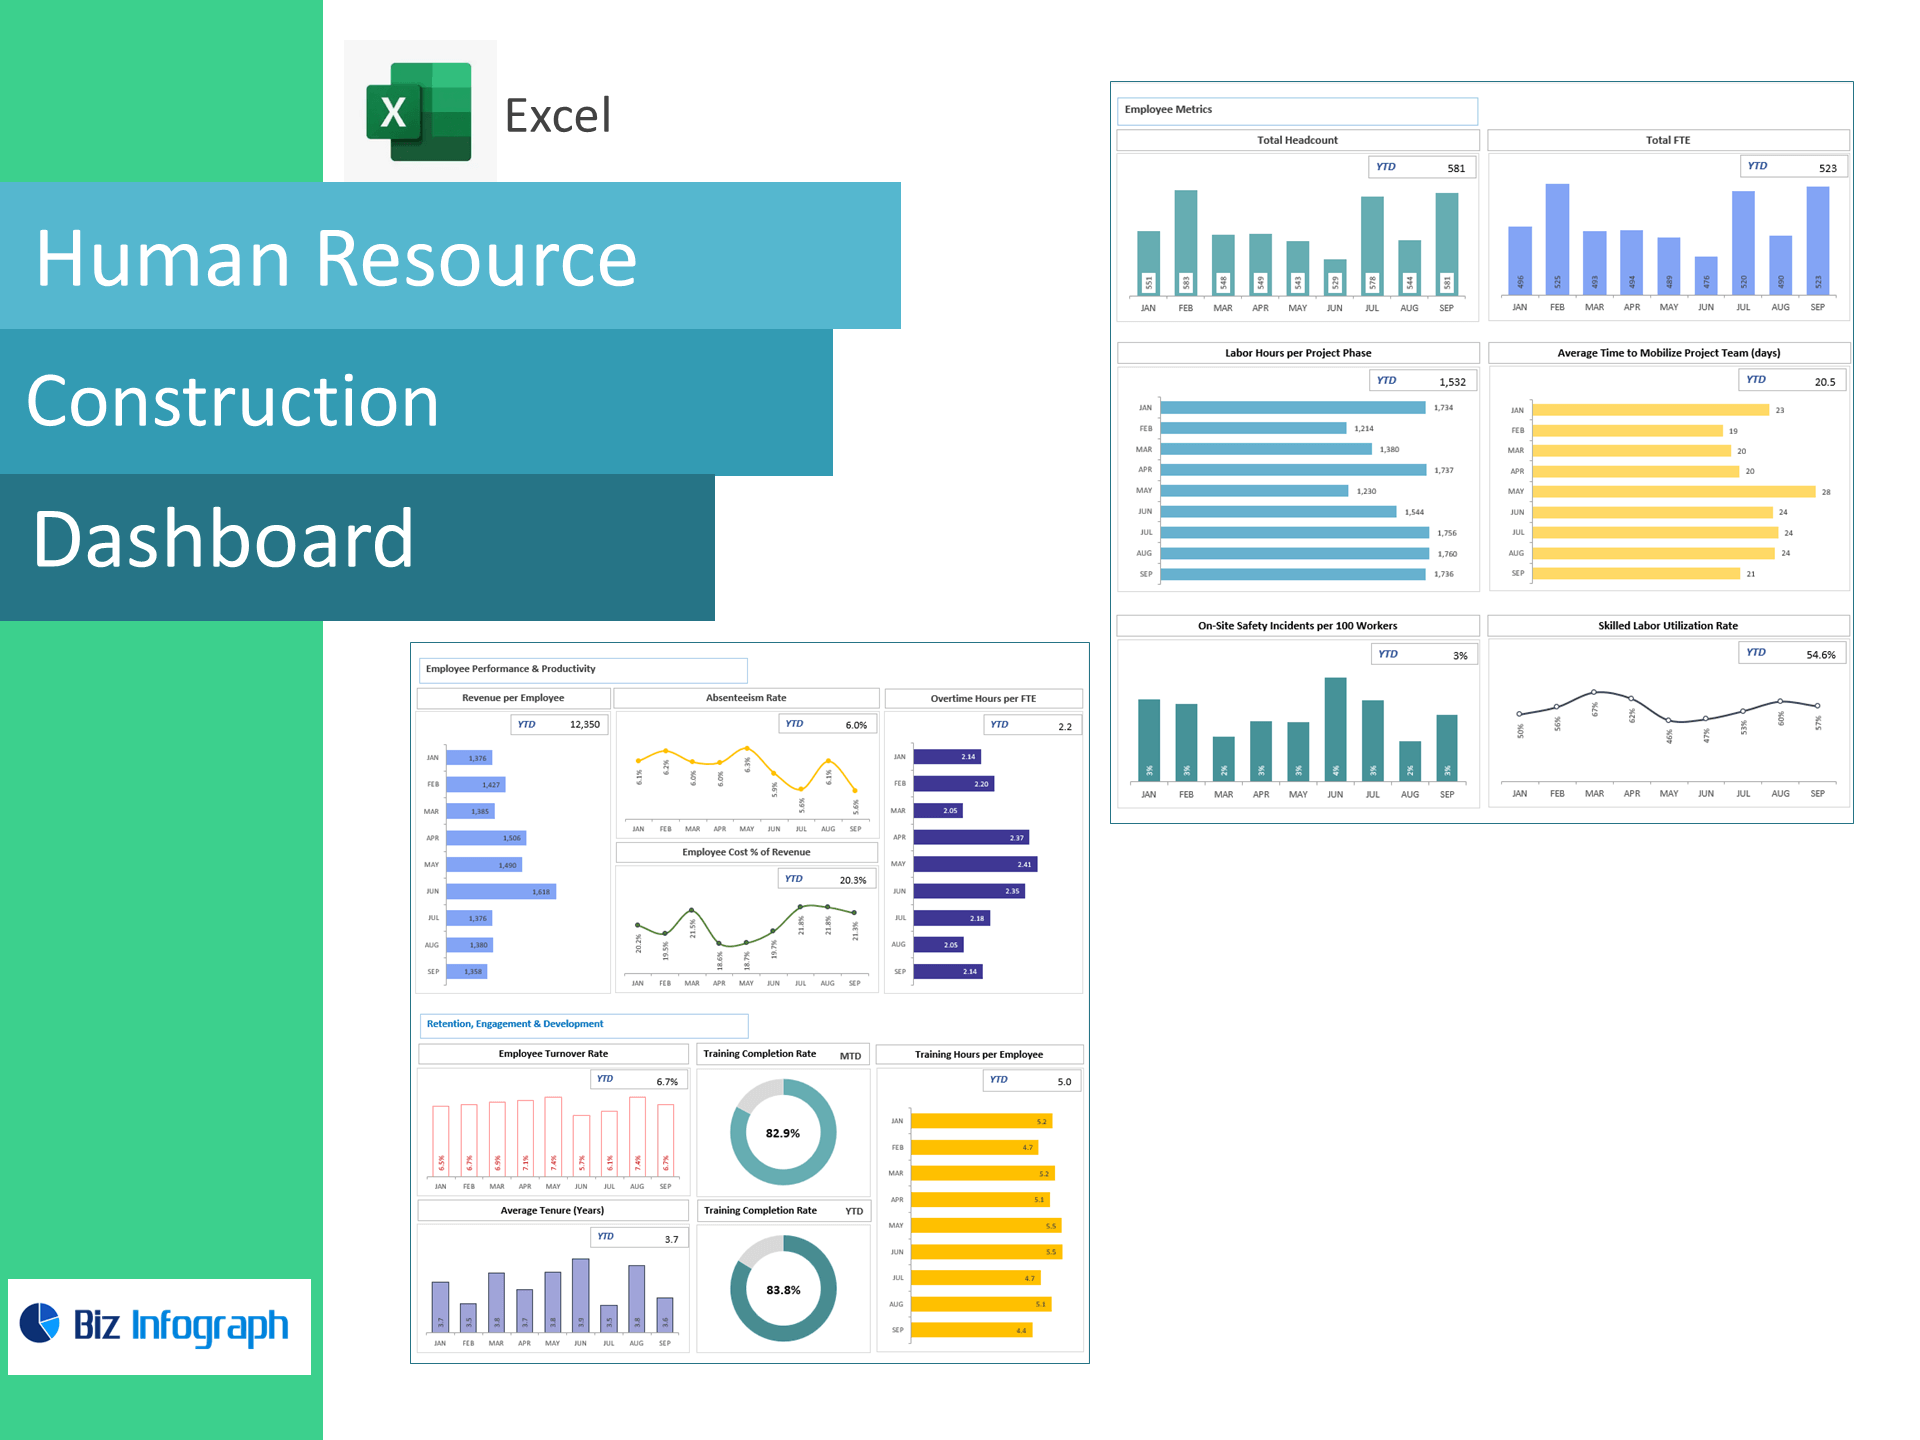
The Construction Dashboard Package is a comprehensive Excel-based solution designed to streamline construction project management, cost tracking, and workforce oversight. It features four expertly crafted dashboards: Project Delivery and Site Operations, Cost Control and Financial Efficiency, Construction Finance, and Human Resource Construction. These dashboards provide real-time insights into project timelines, budget adherence, labor allocation, and site productivity—enabling project managers and stakeholders to monitor progress, control expenses, and ensure timely delivery. Whether managing a single site or a portfolio of projects, this package supports data-driven decisions, enhances operational visibility, and boosts overall efficiency in construction business workflows.
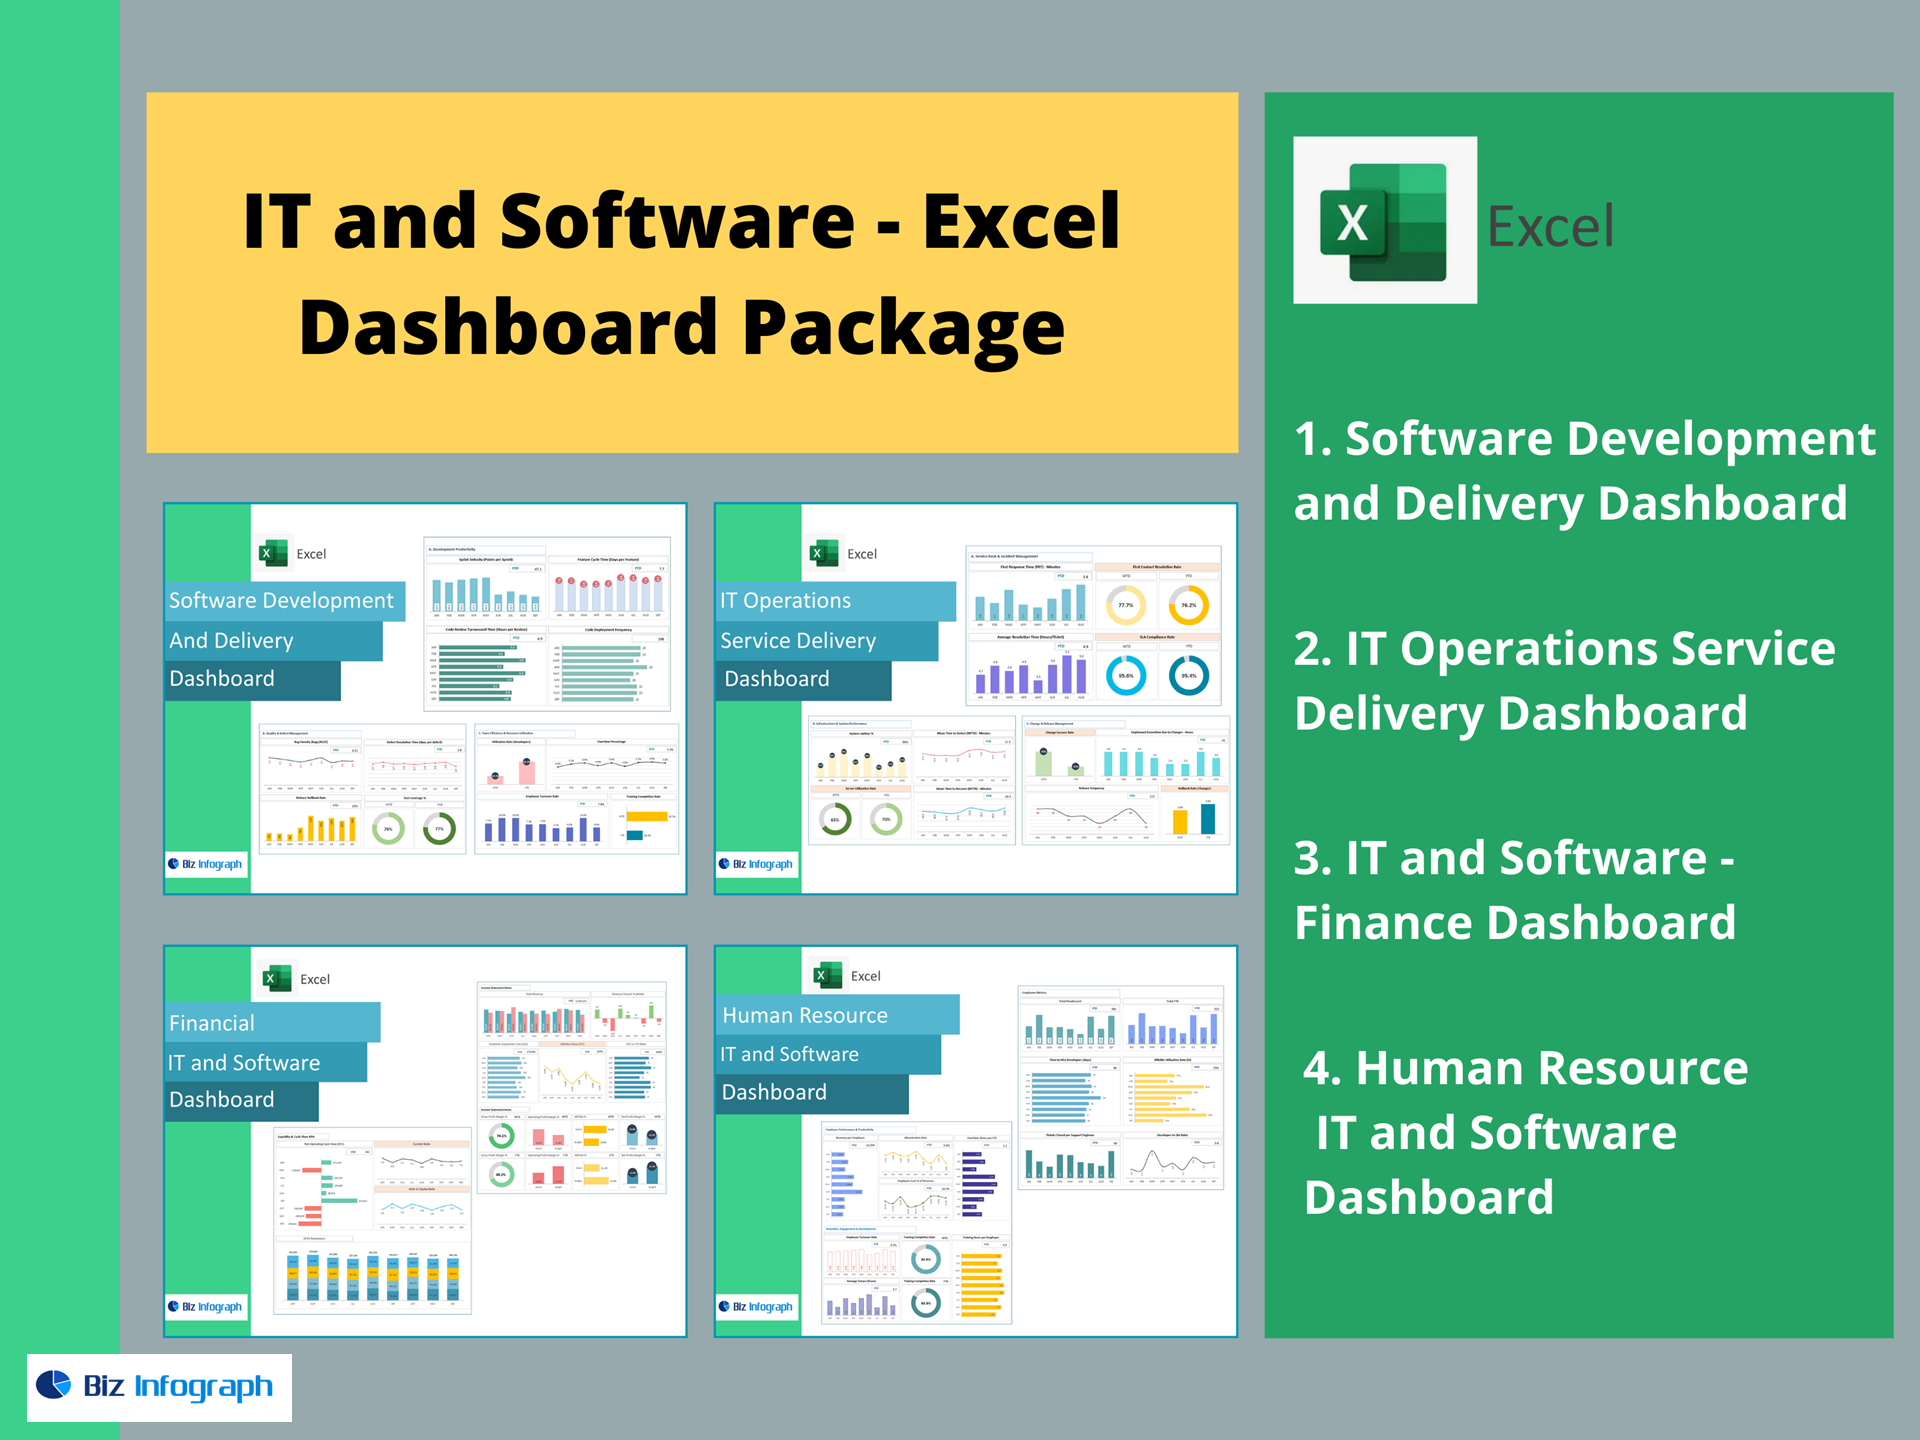
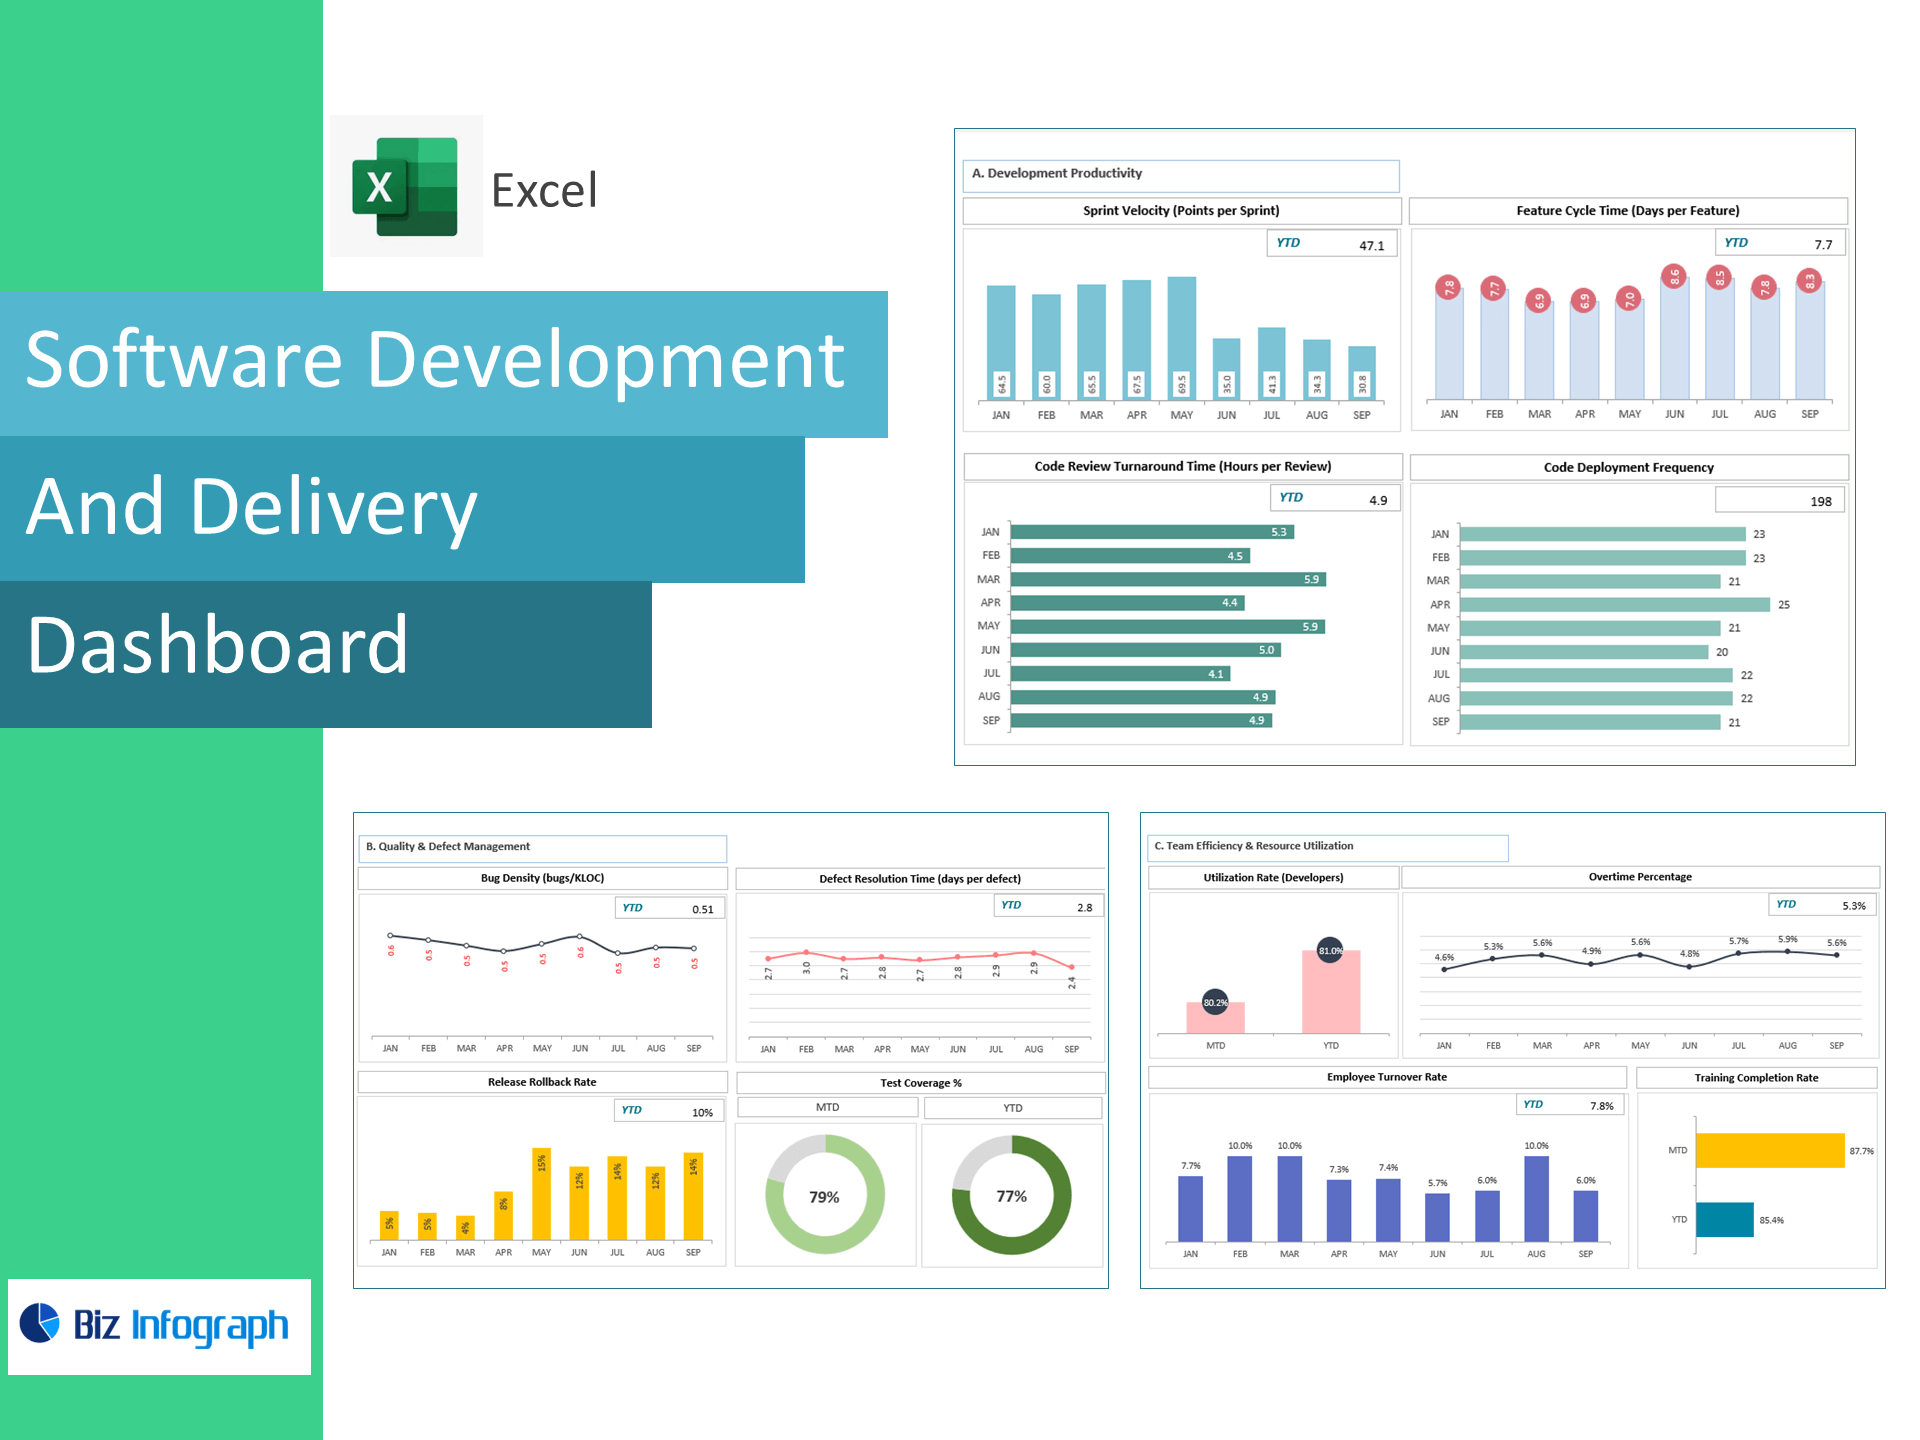
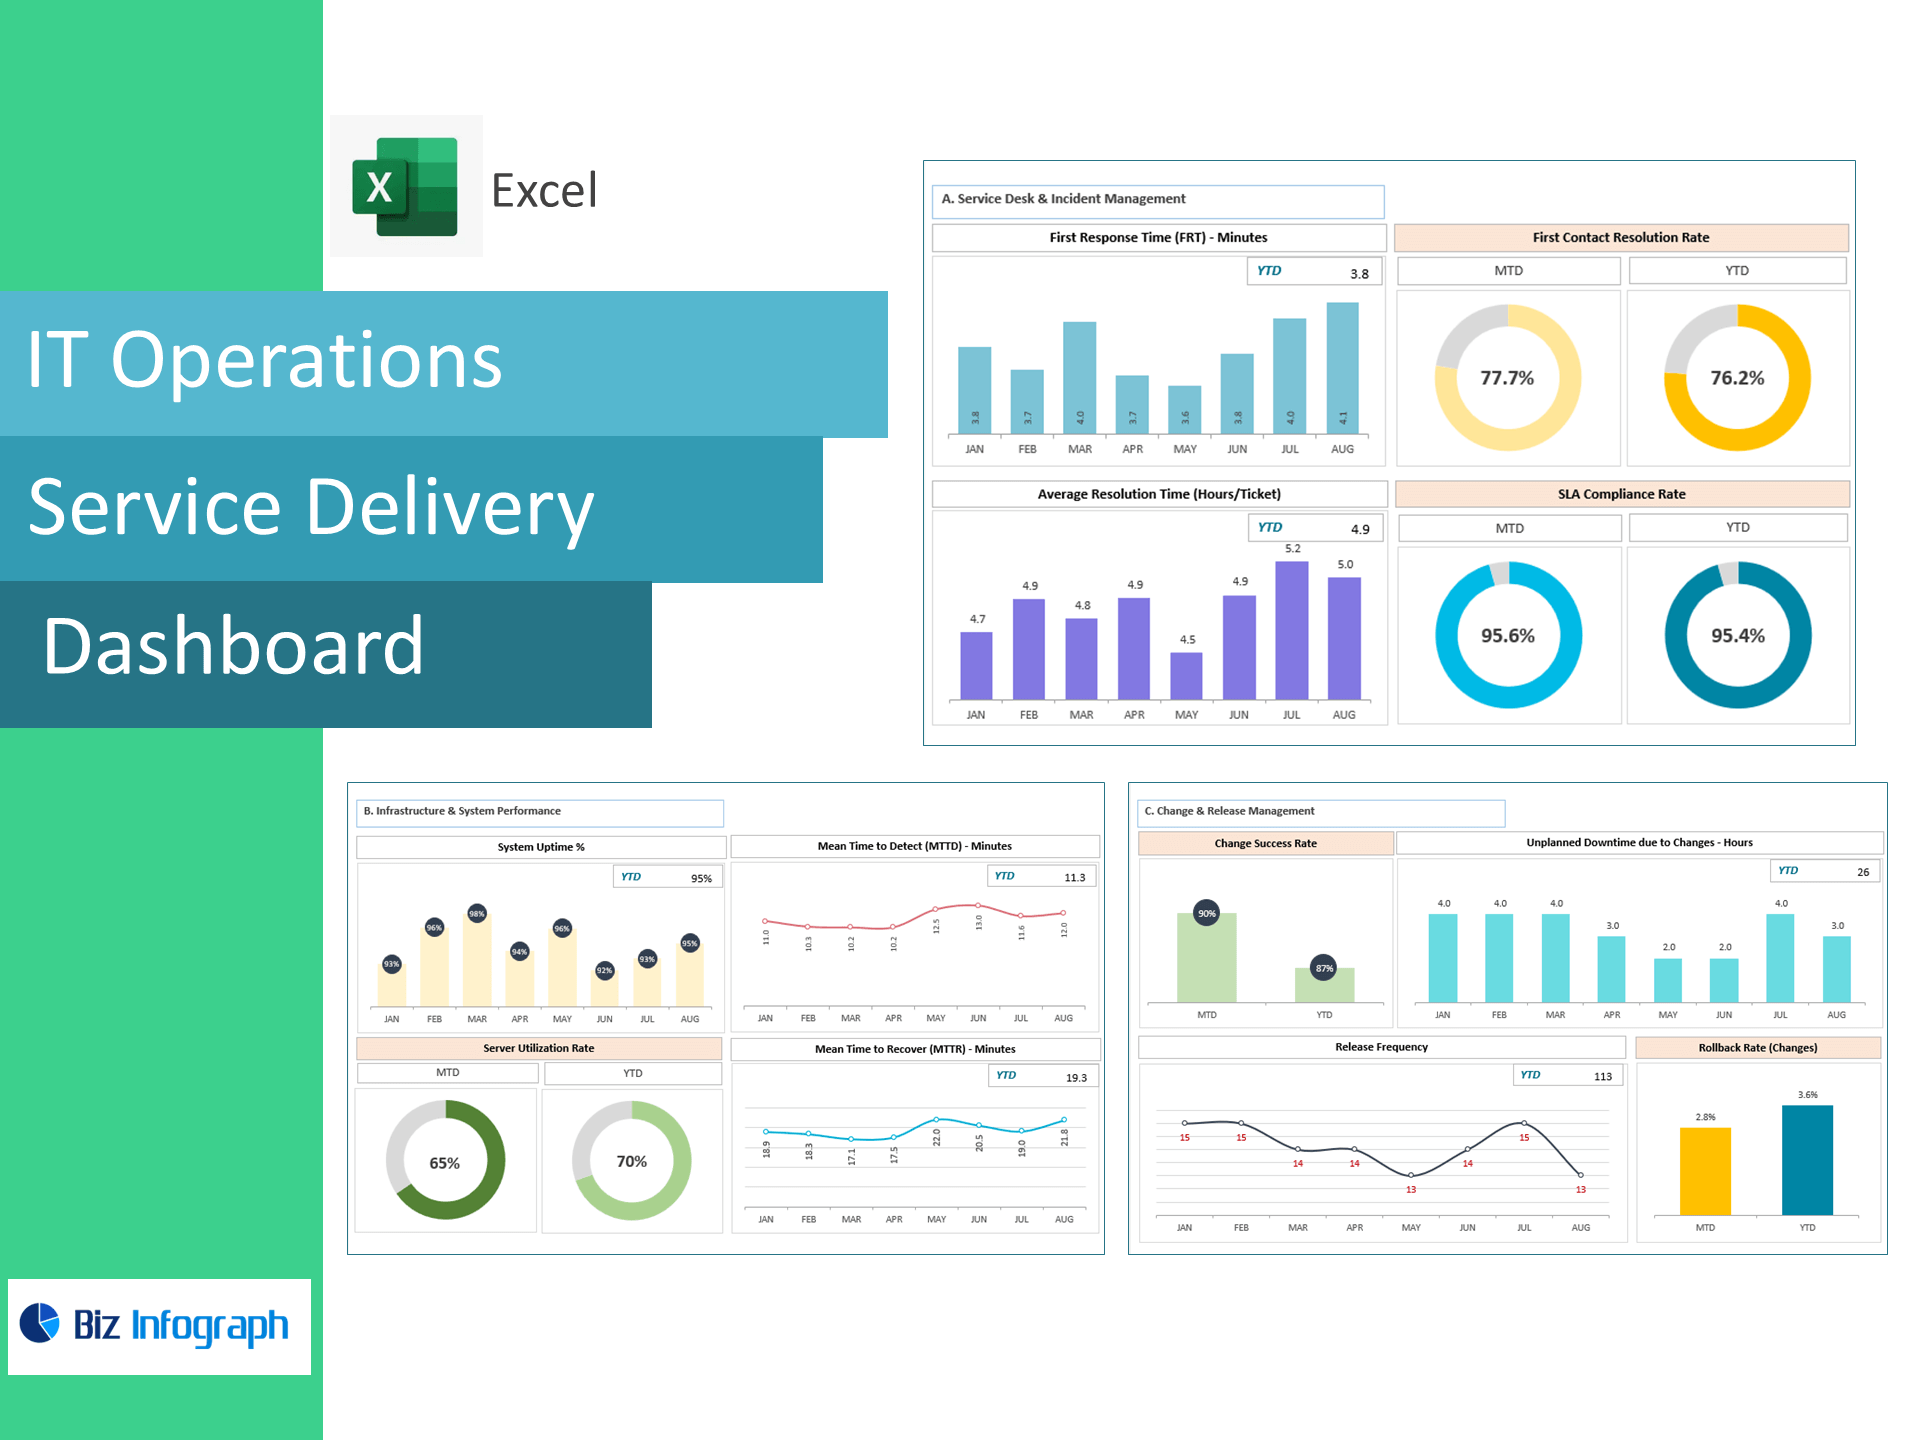
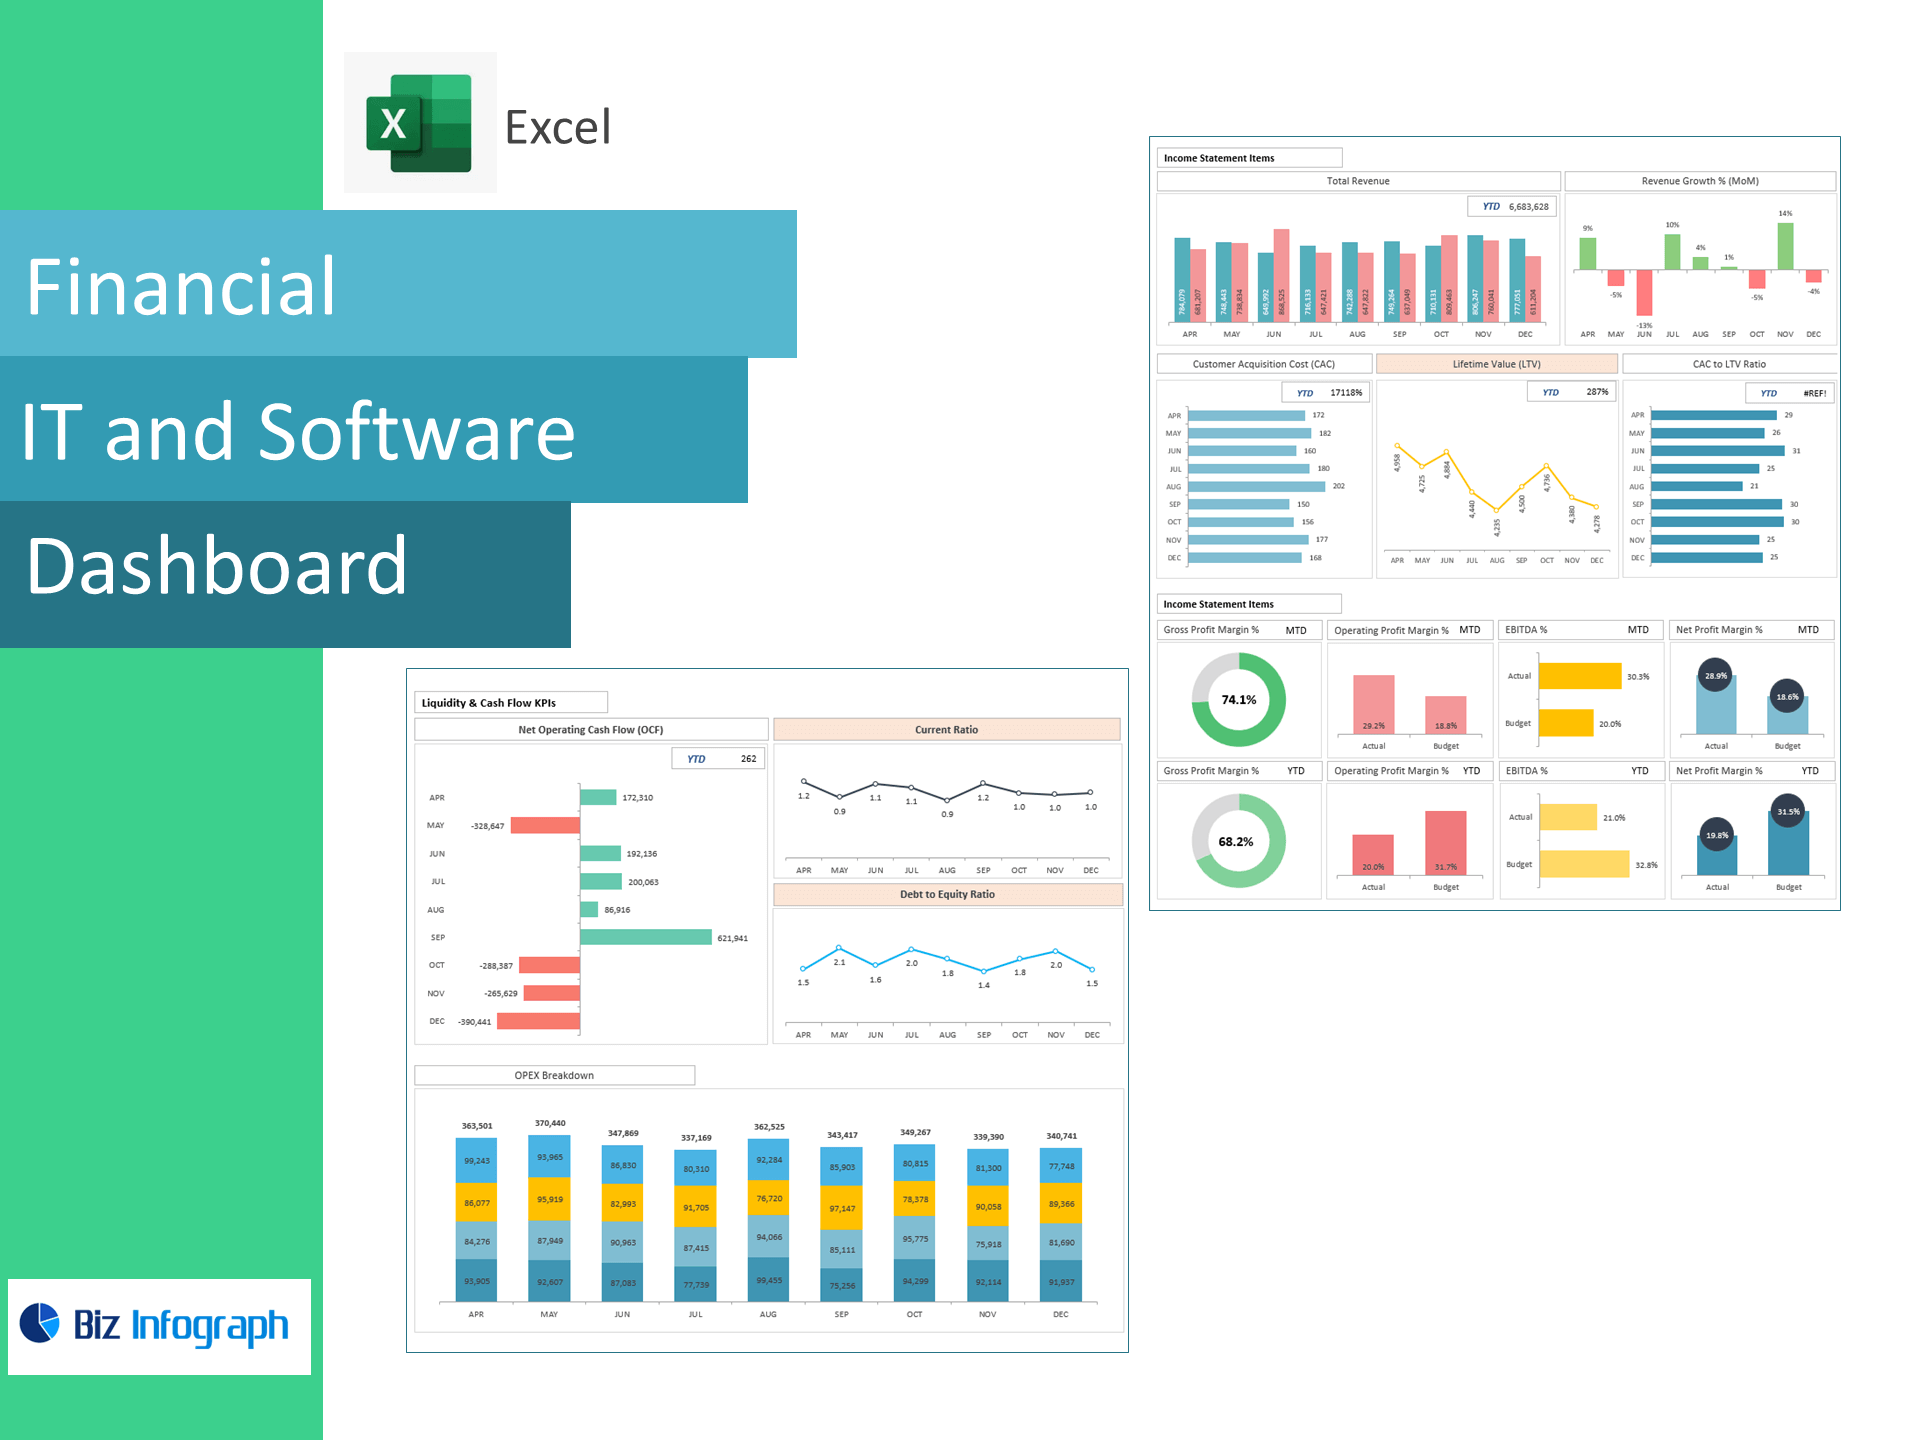
The IT & Software Dashboard Package is a robust Excel-based solution tailored for software companies, IT departments, and service teams aiming to enhance performance visibility and operational control. This package includes four professionally designed dashboards: Software Development and Delivery, IT Operations Service Delivery, IT and Software Finance, and Human Resource IT & Software Dashboard. Each dashboard helps track key metrics such as sprint progress, service uptime, incident resolution, project budgets, and resource allocation—empowering IT leaders to make data-driven decisions. With real-time insights and interactive visuals, this package streamlines workflows, improves service quality, and supports the successful execution of software and IT strategies.

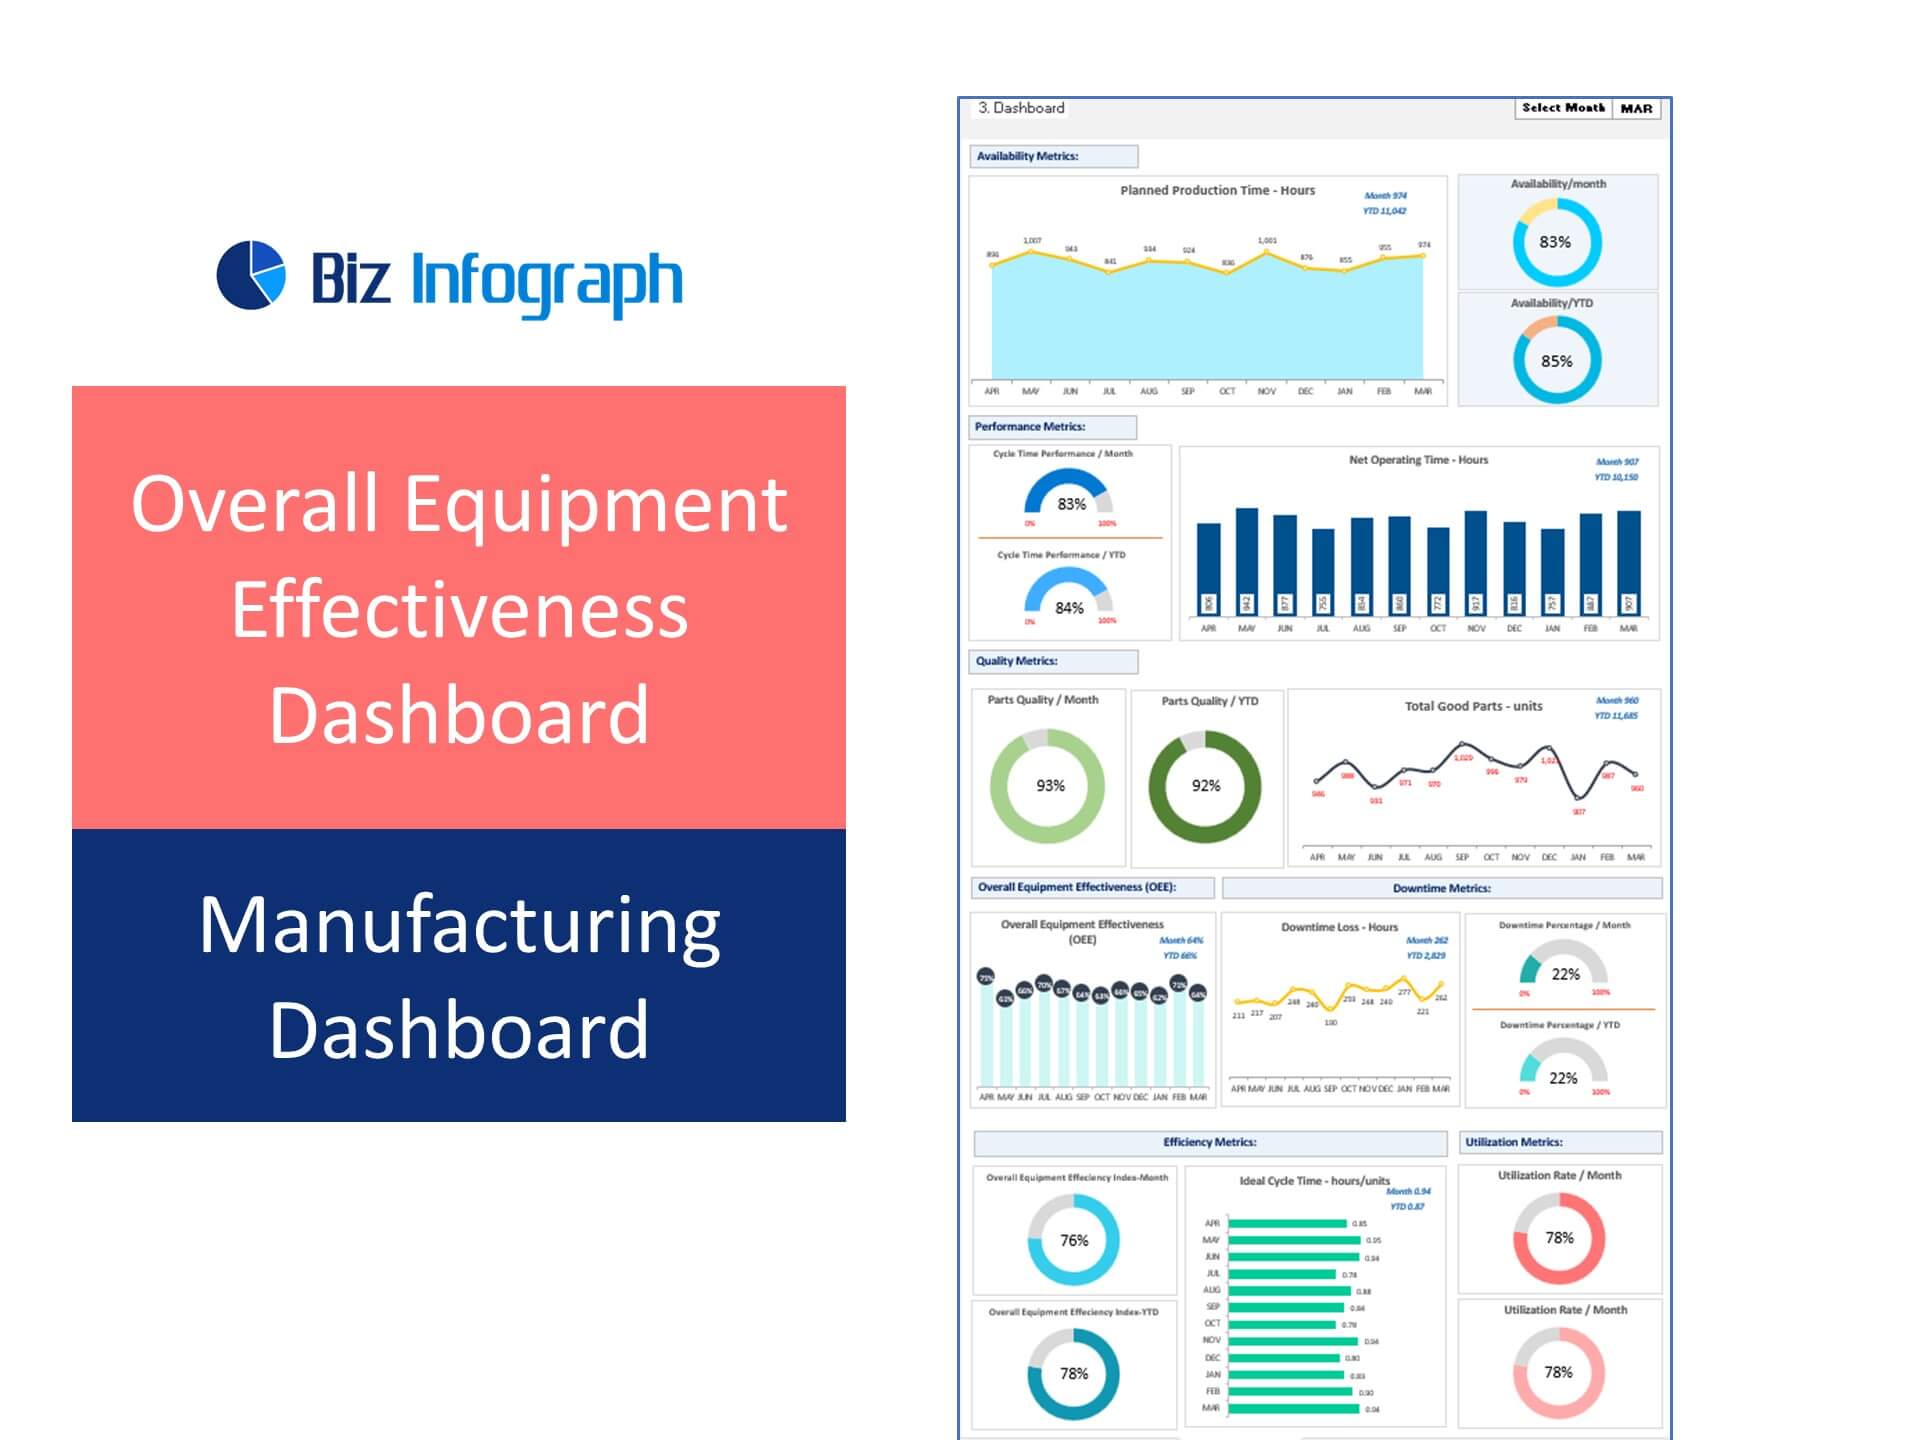
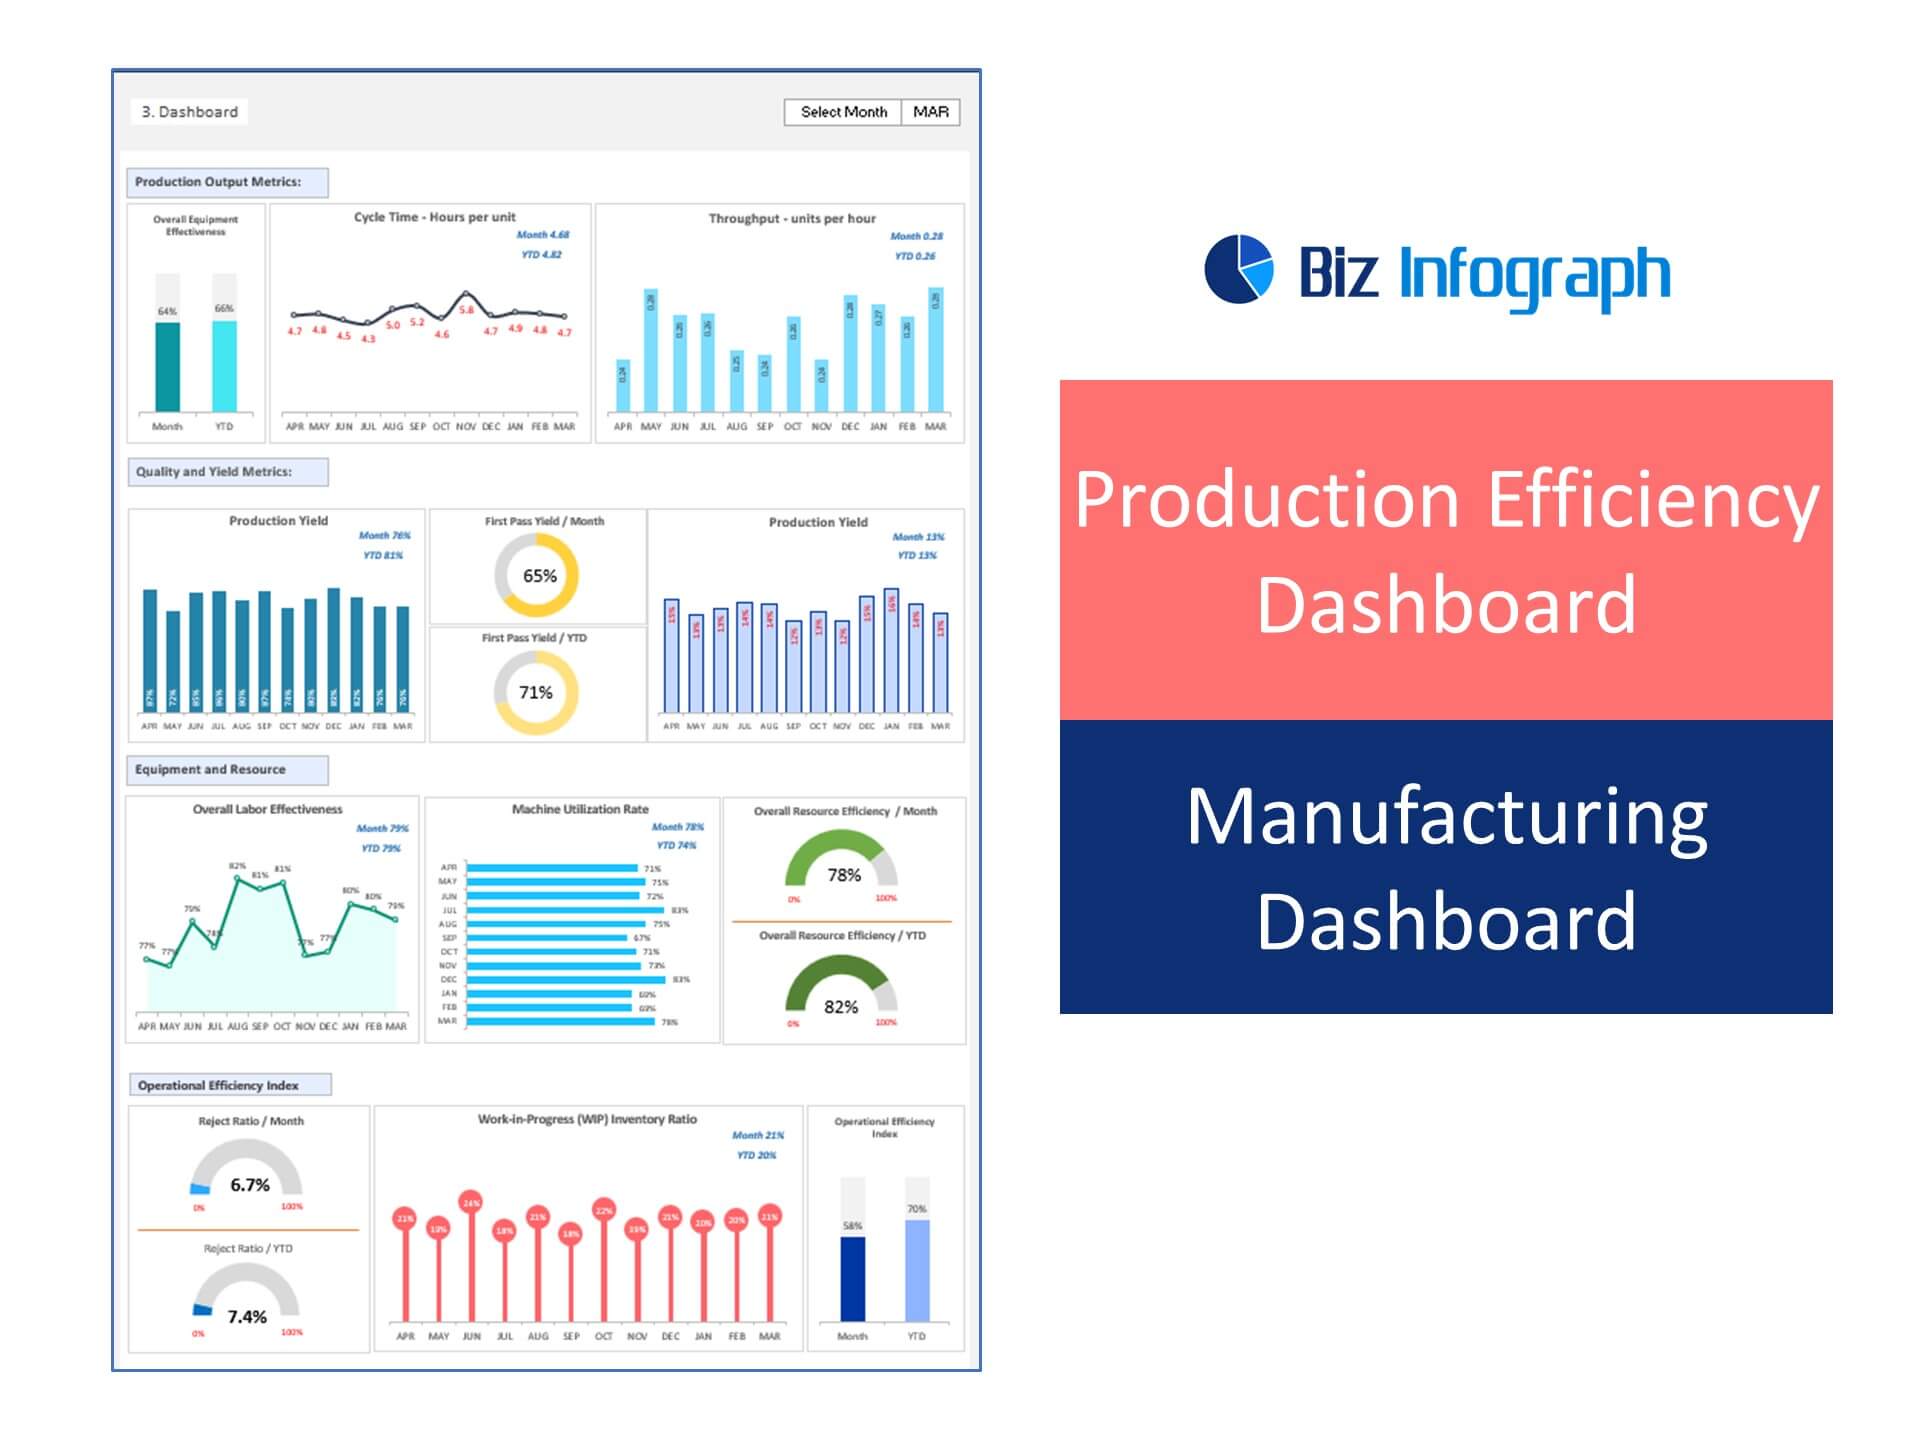
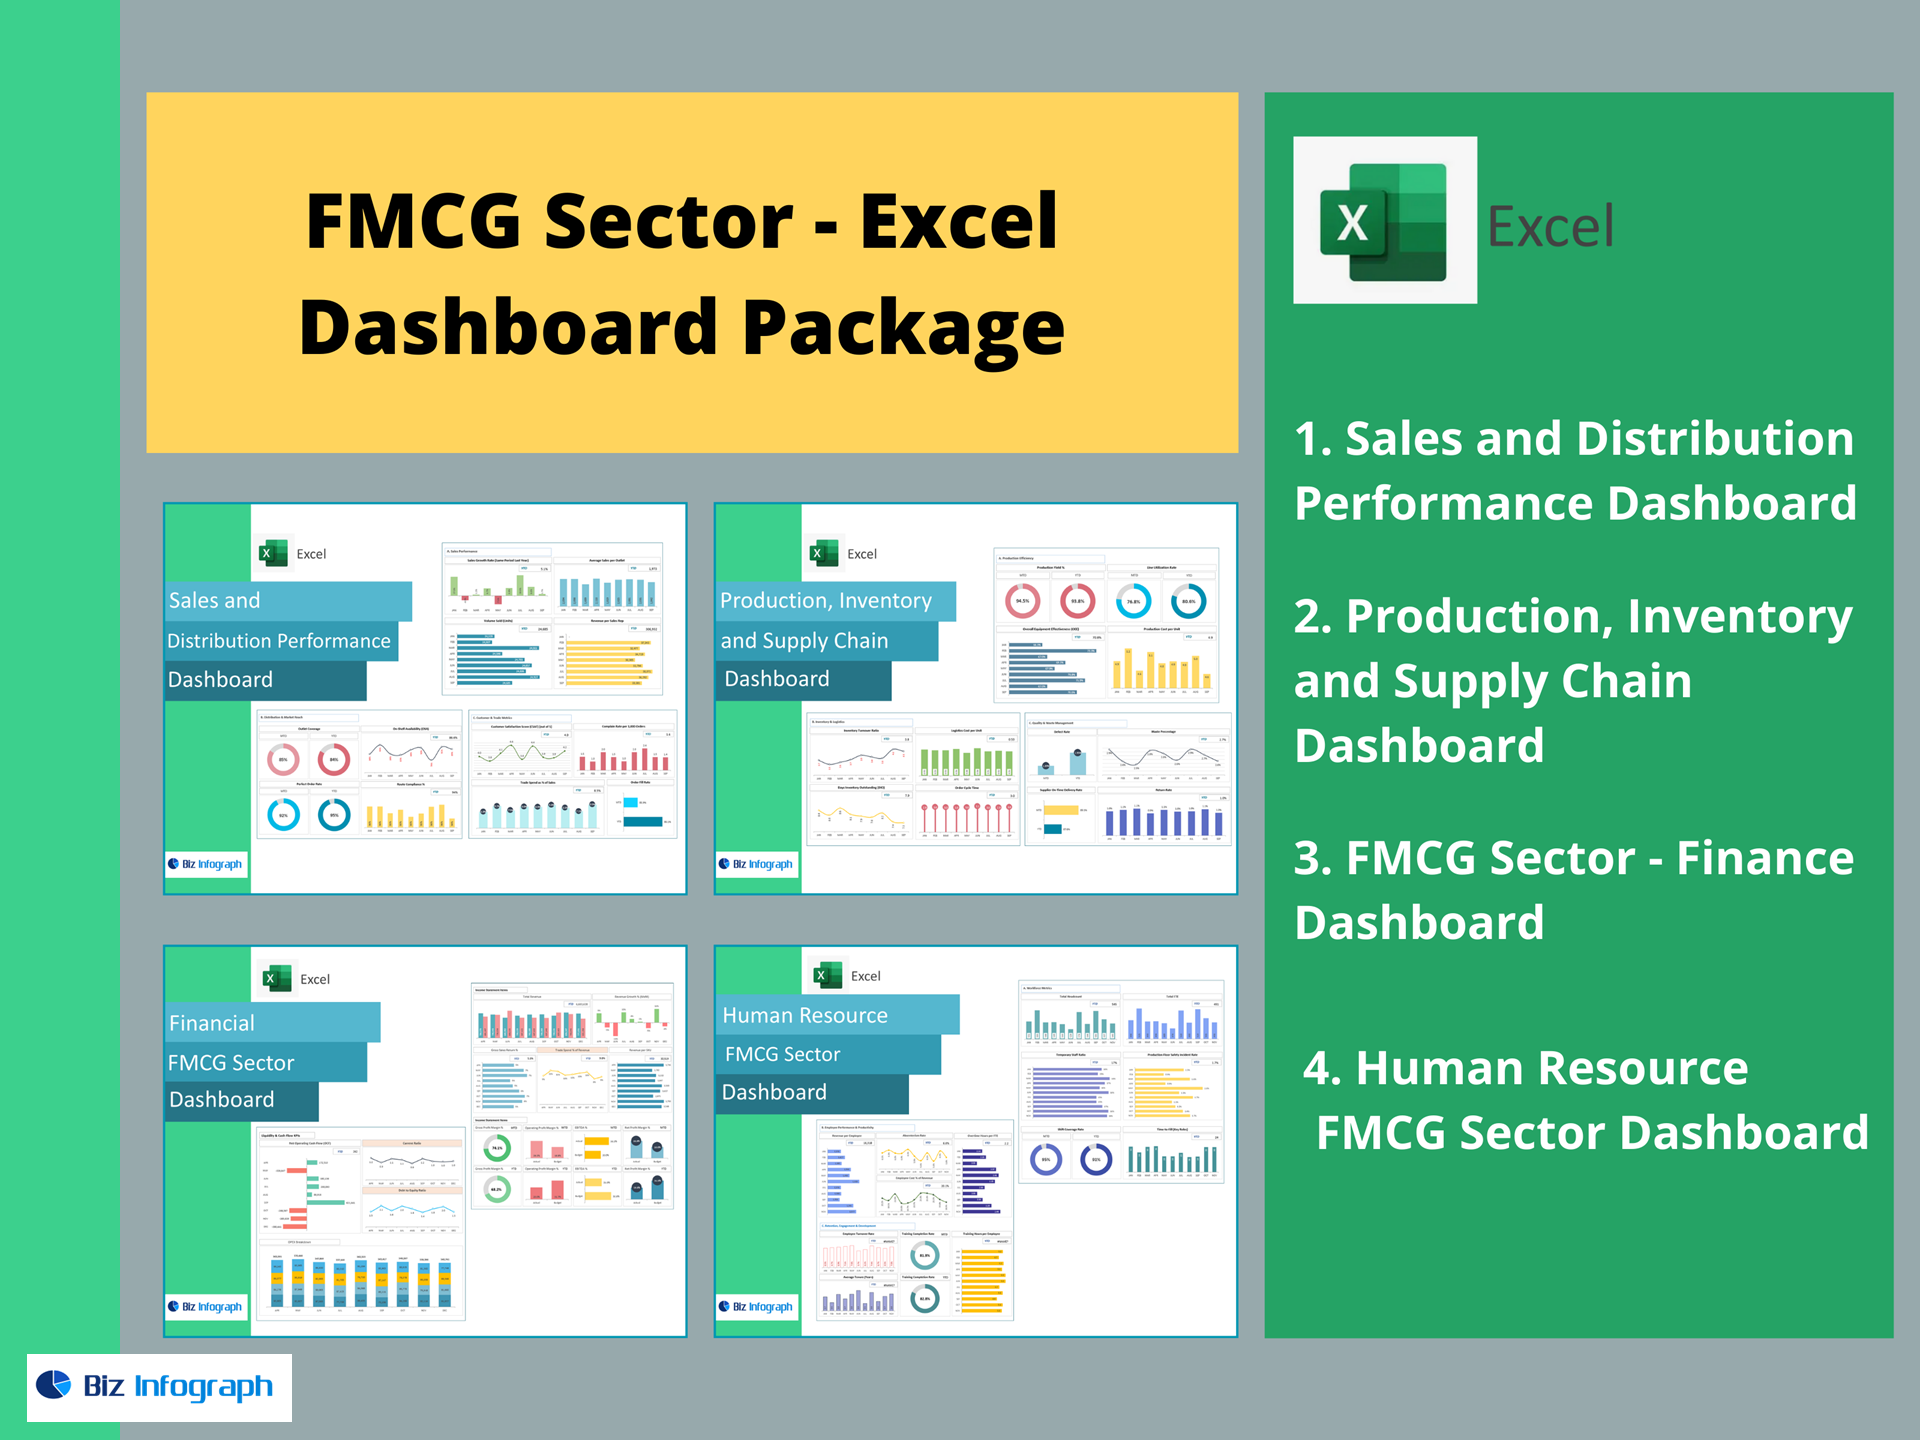
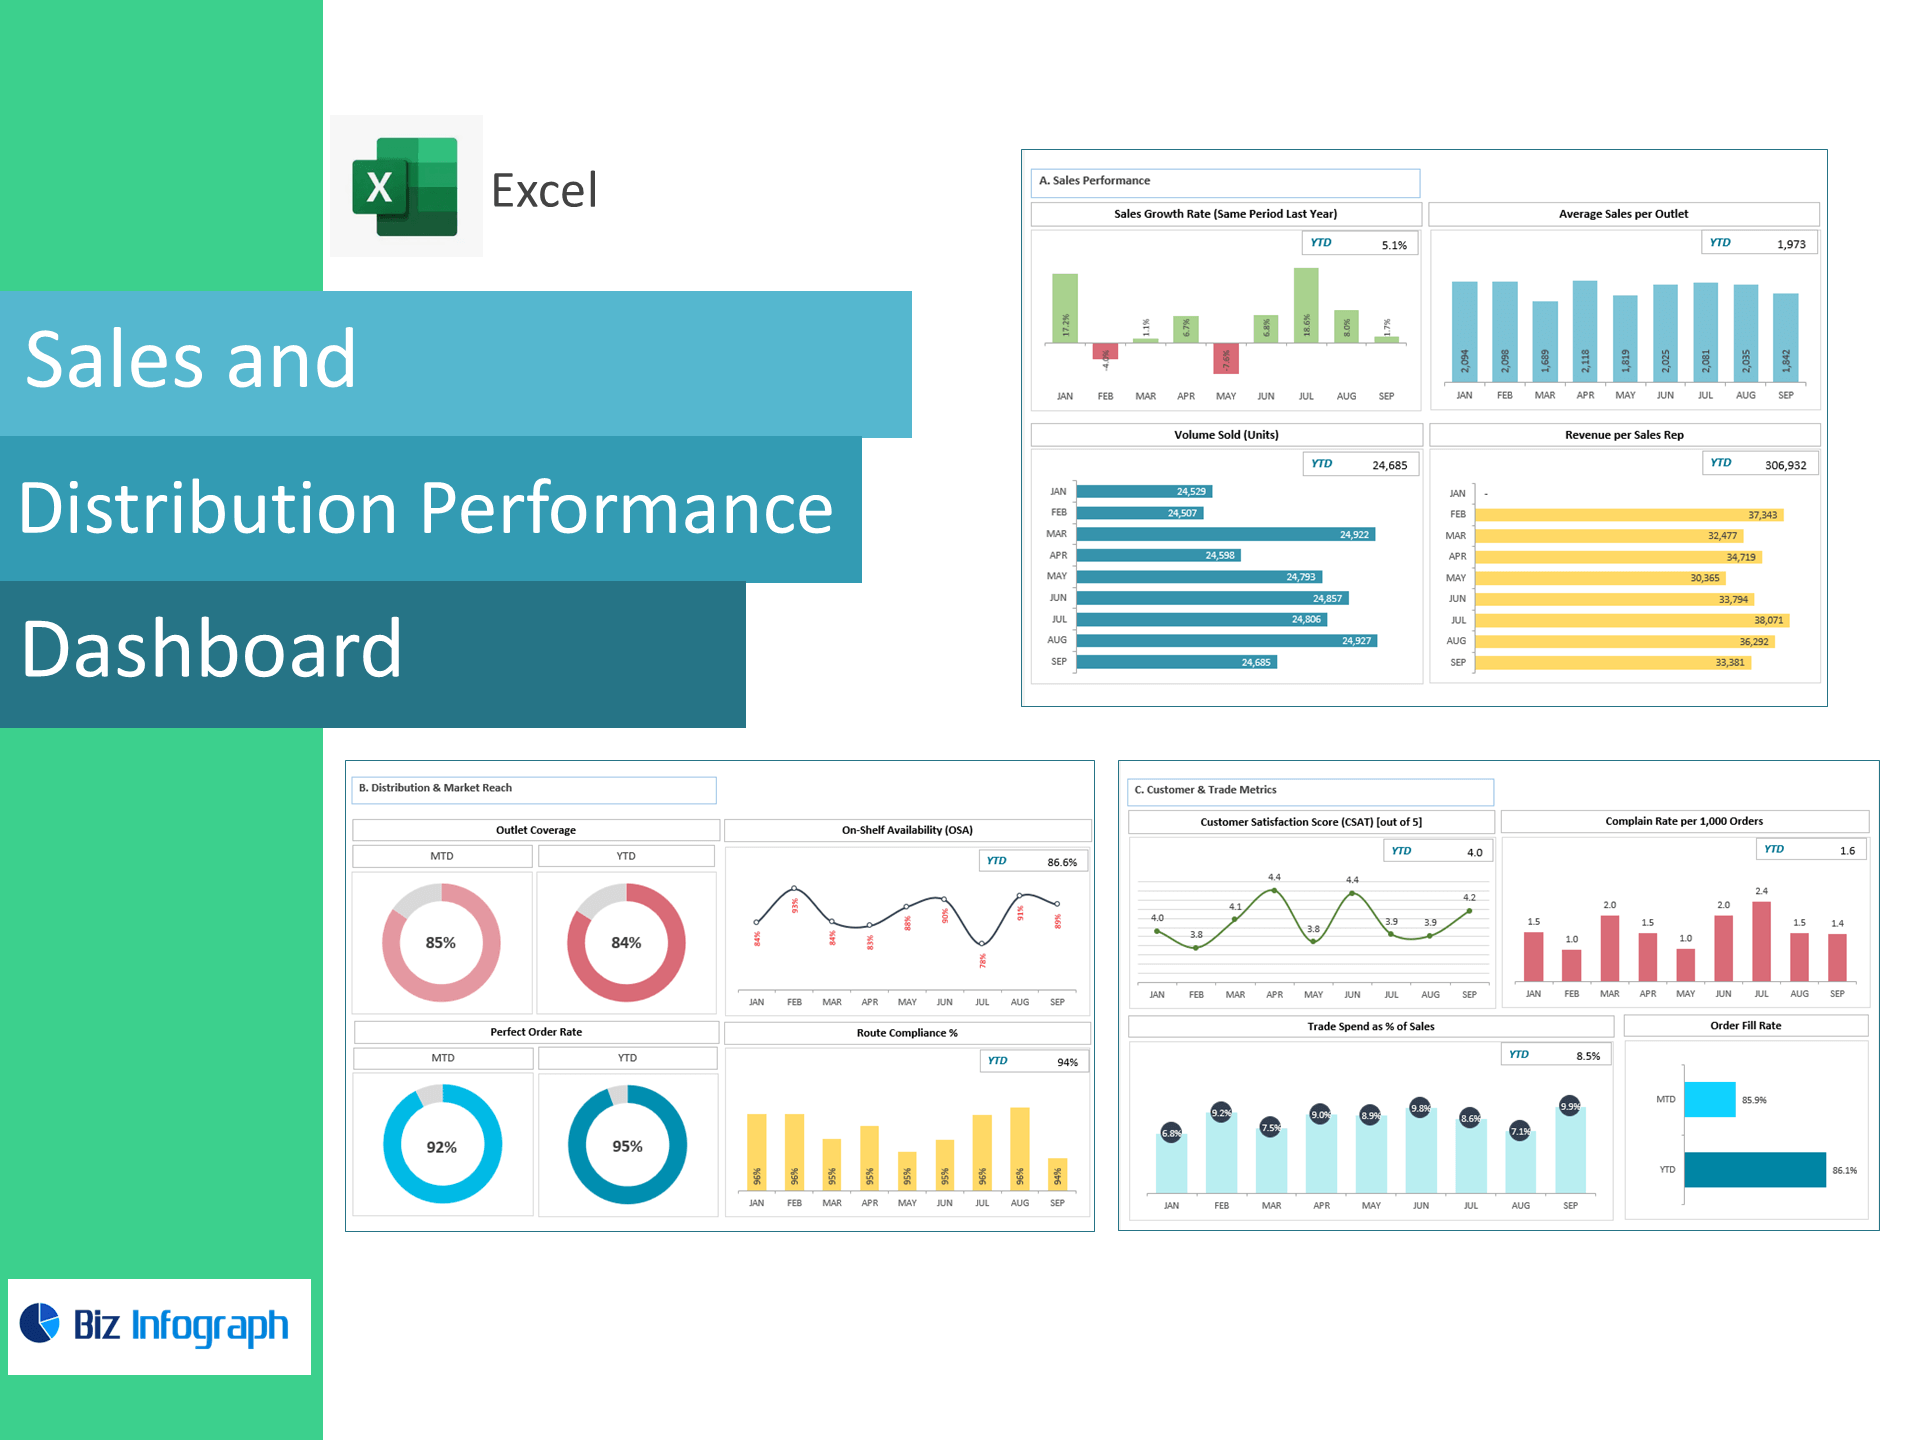
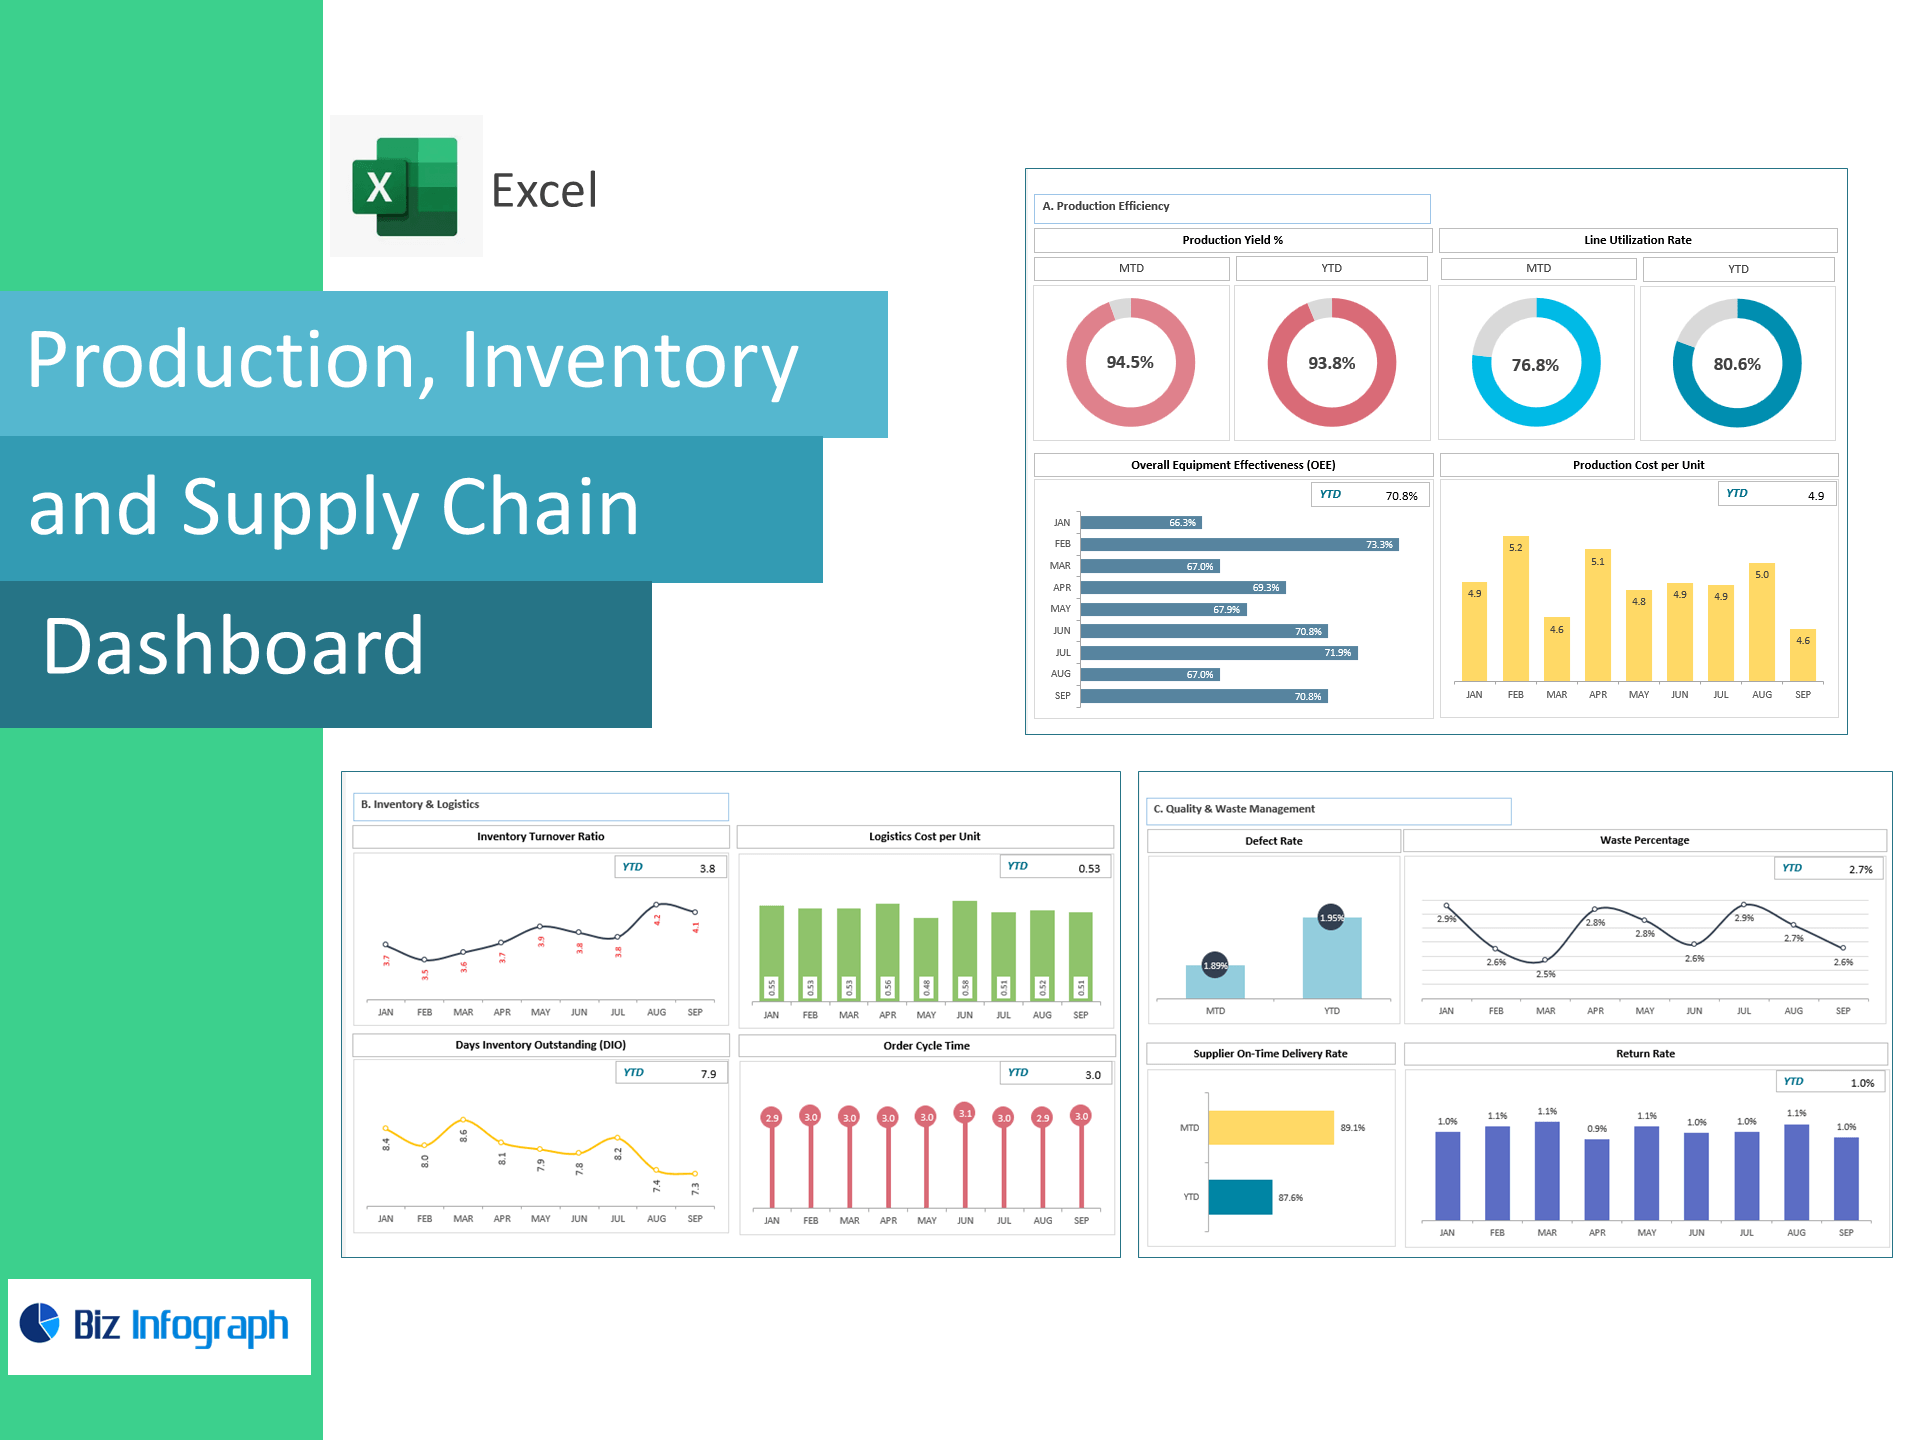
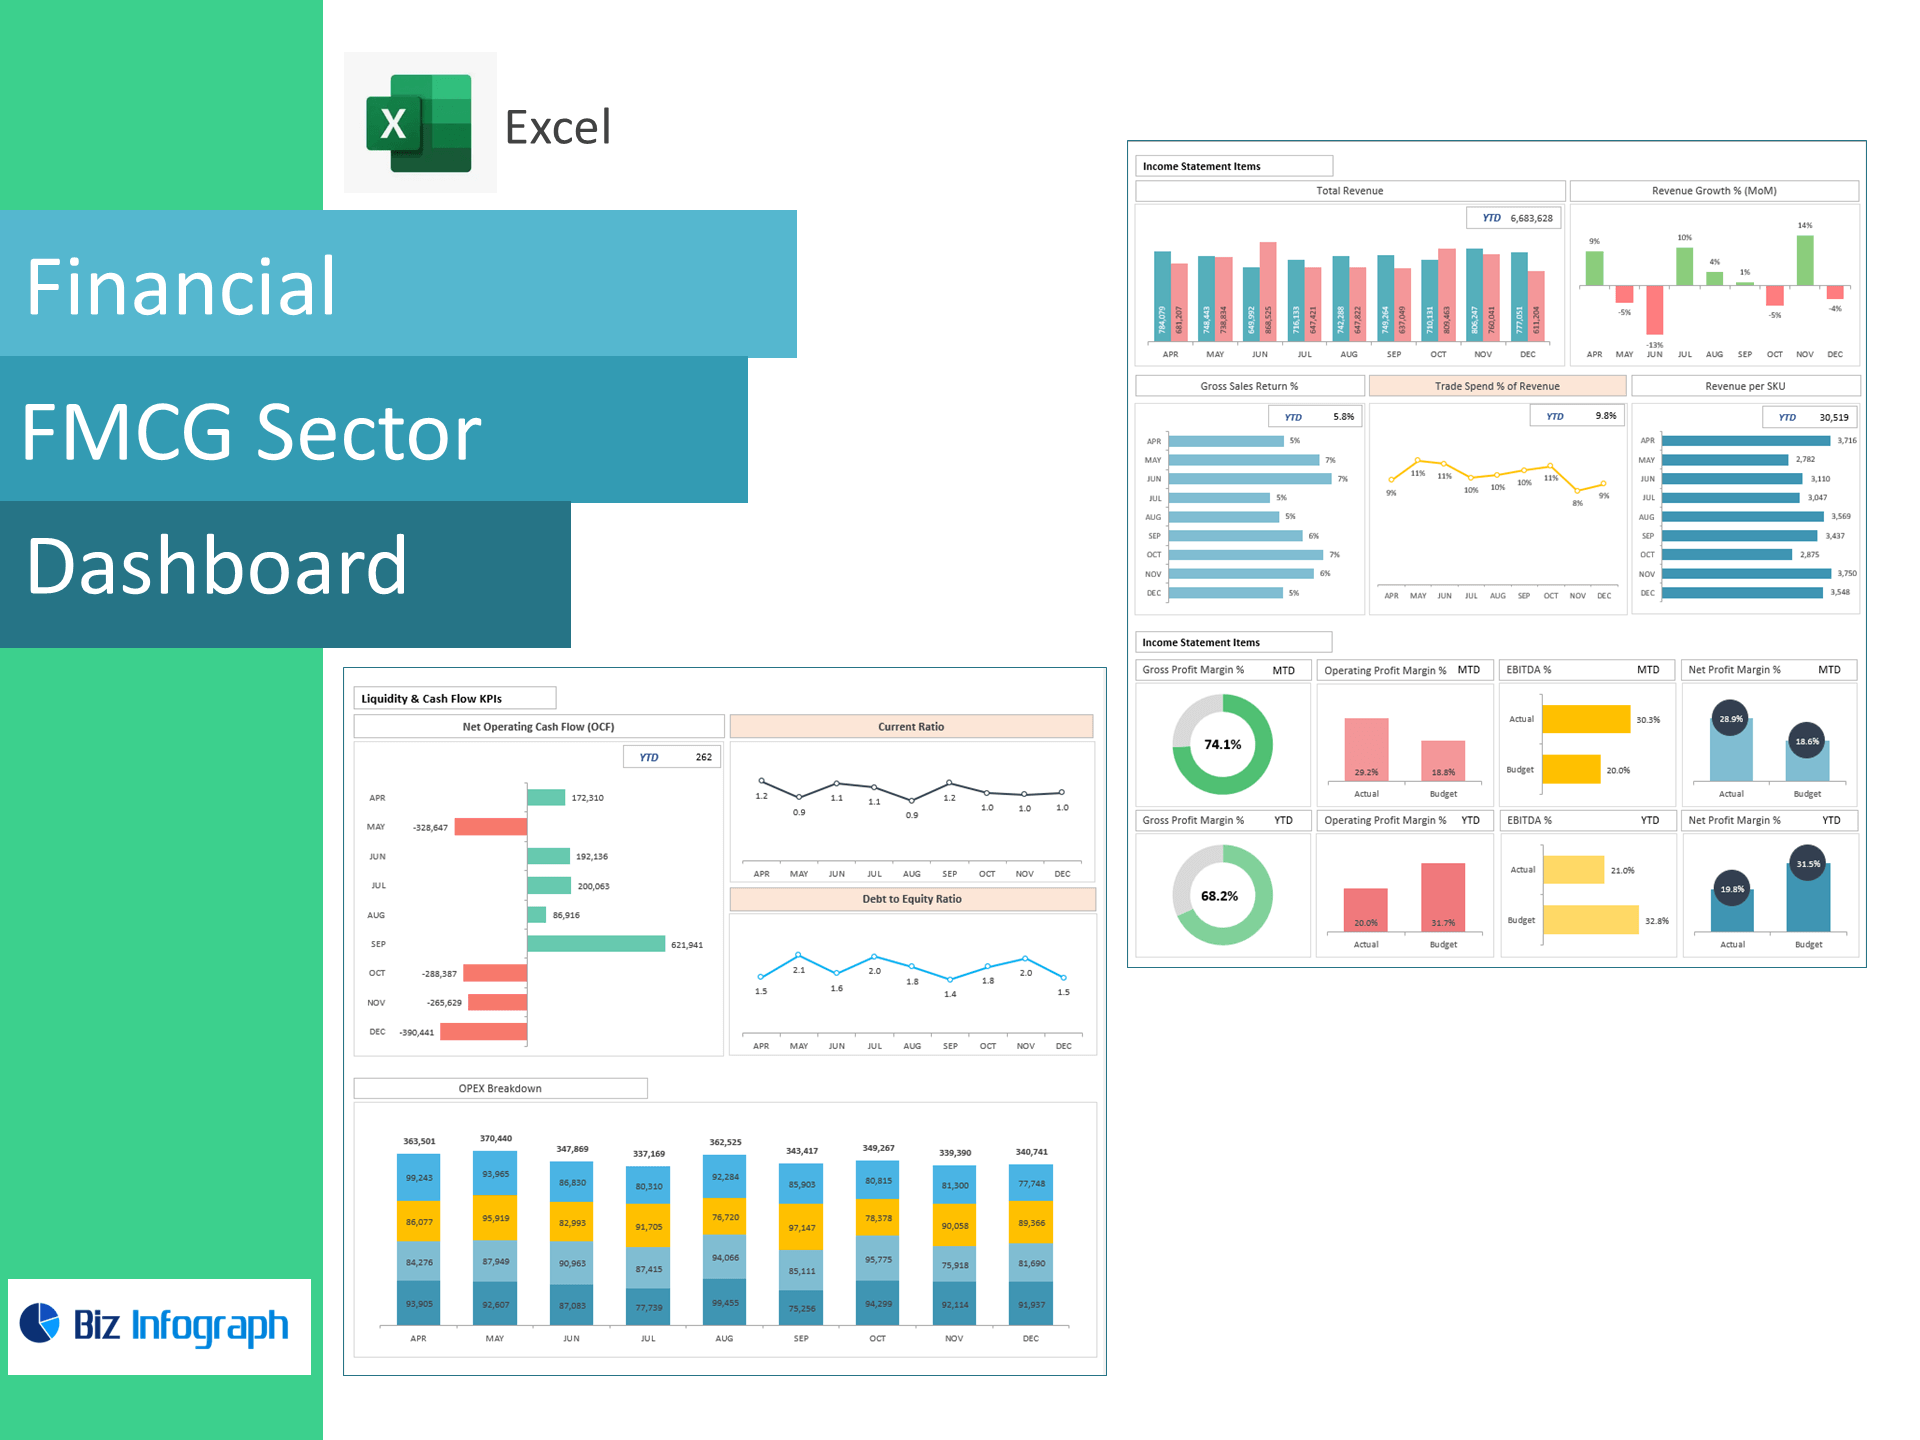
The FMCG Dashboard Package is a powerful Excel-based toolkit designed to help fast-moving consumer goods companies streamline and monitor key business functions. This comprehensive package includes four essential dashboards: Sales and Distribution Performance, Production, Inventory and Supply Chain, Finance, and Human Resource dashboards tailored for the FMCG sector. Each dashboard provides real-time insights into critical KPIs such as stock levels, sales targets, production flow, and workforce metrics, enabling managers to make timely, data-driven decisions. Whether you're overseeing multiple distribution channels or optimizing production efficiency, this package ensures full visibility across operations, improving profitability, supply chain agility, and organizational performance in the competitive FMCG environment.

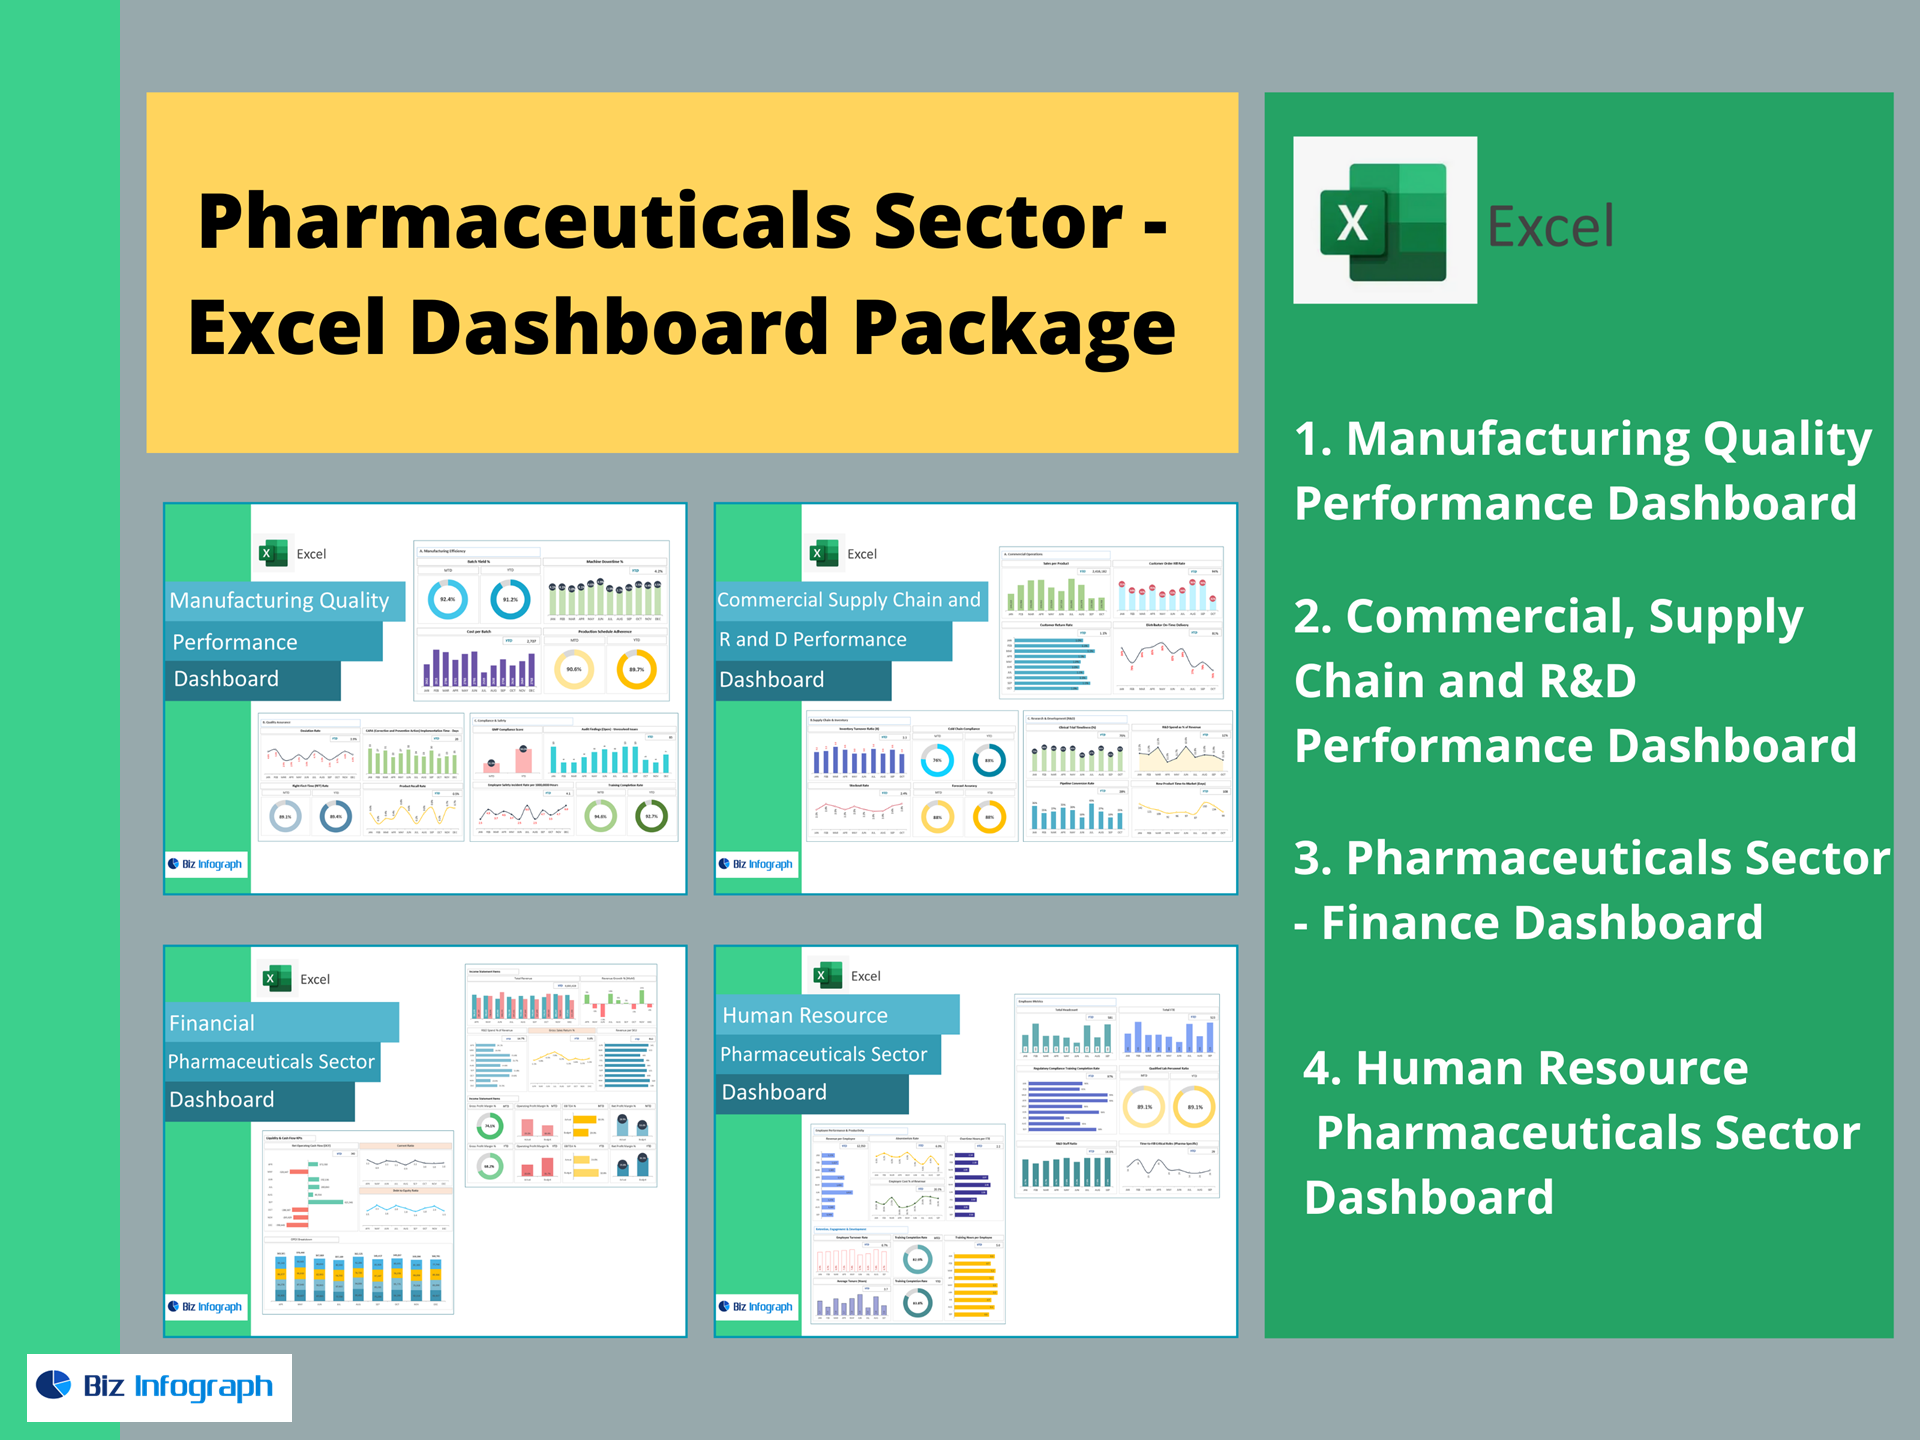
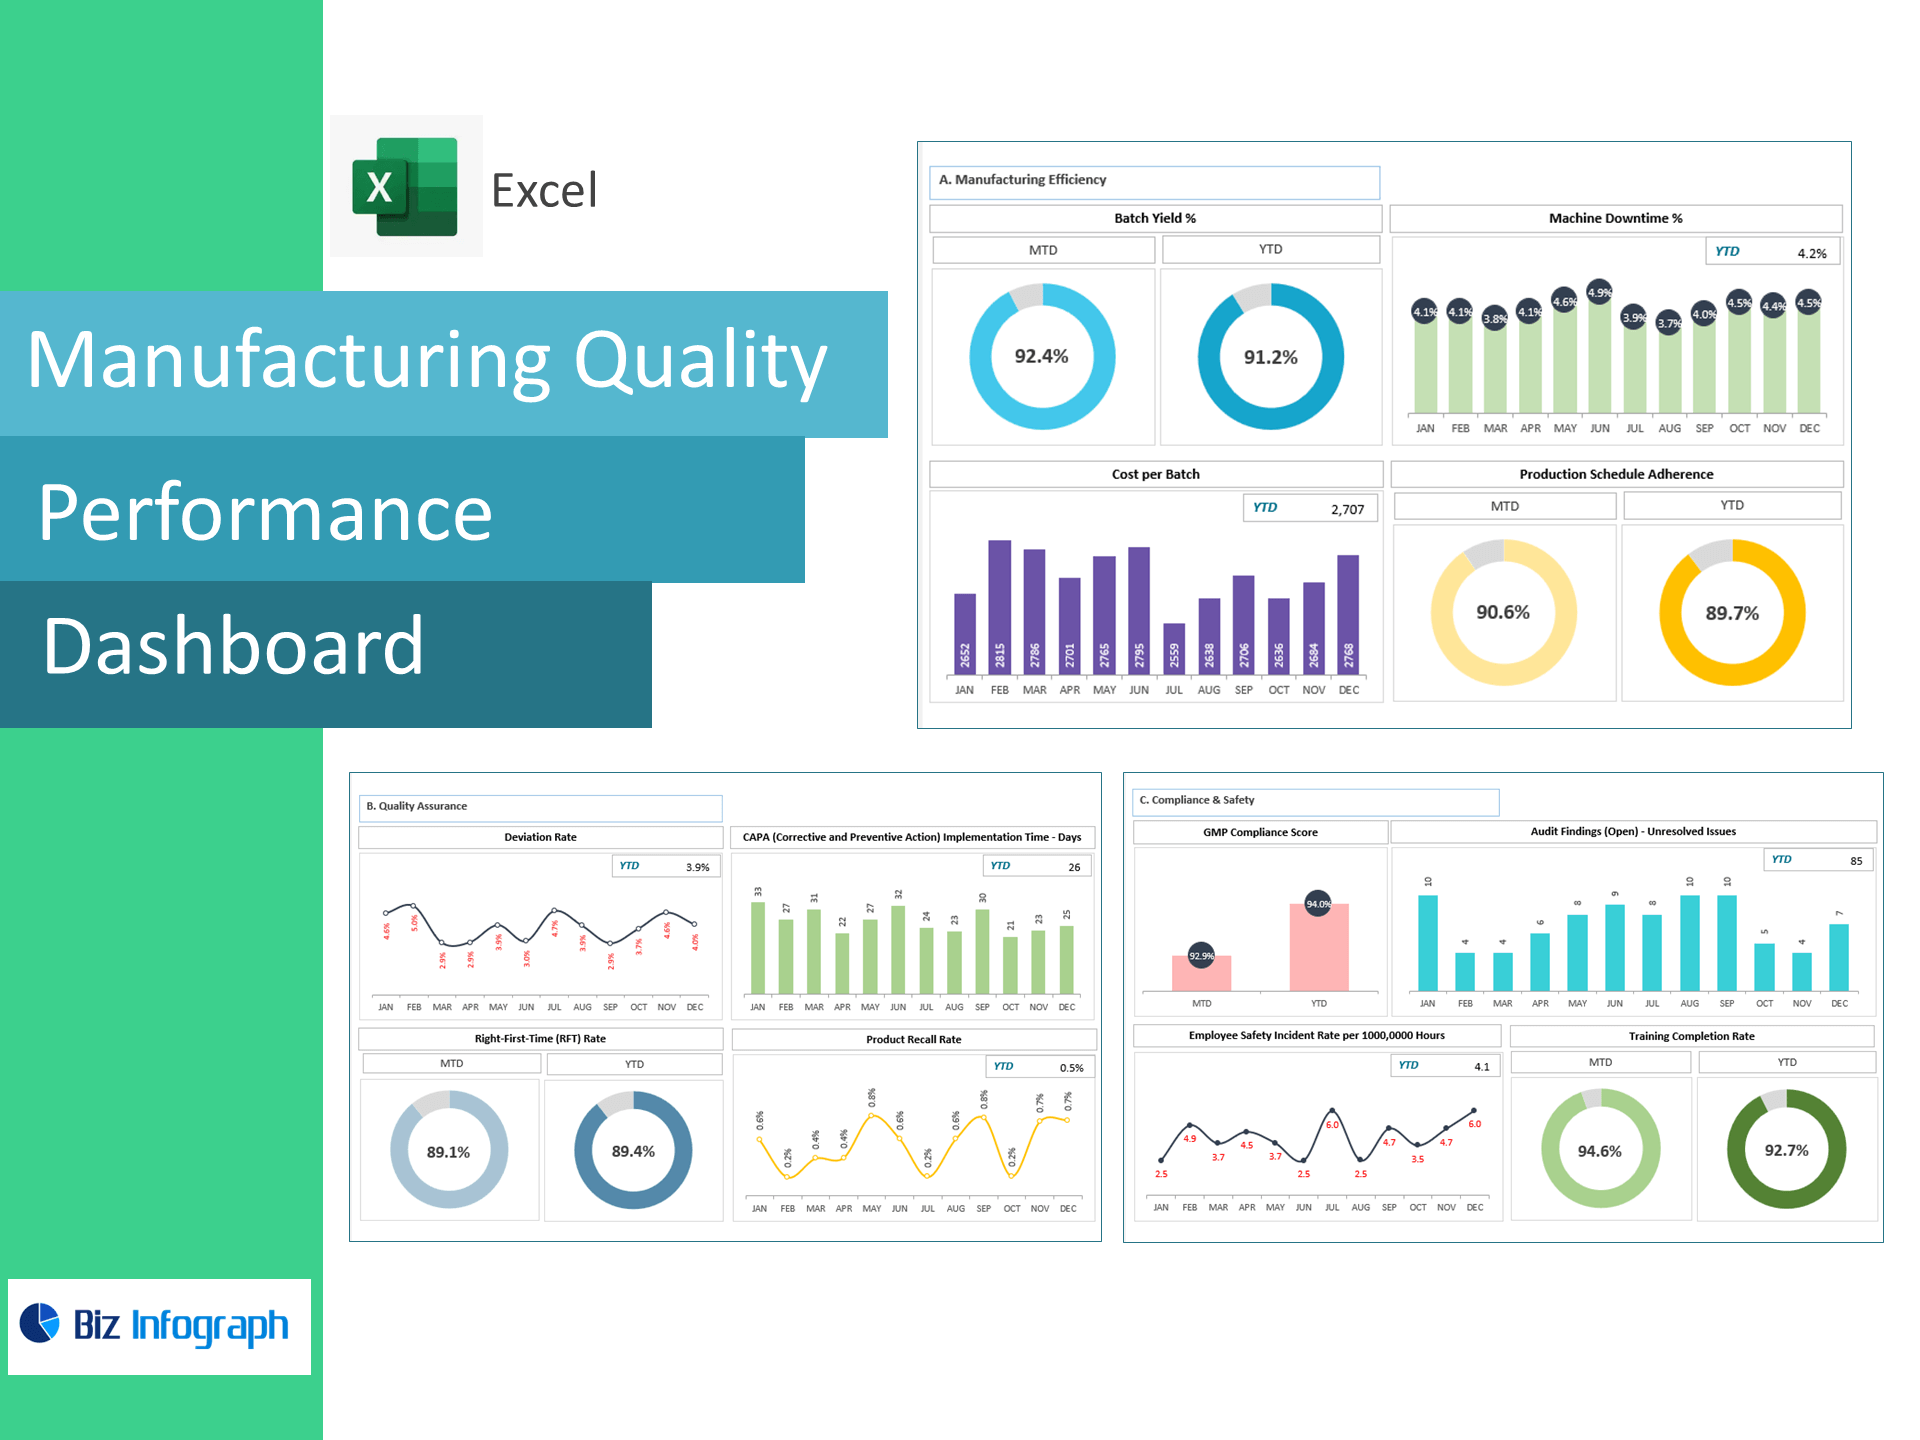
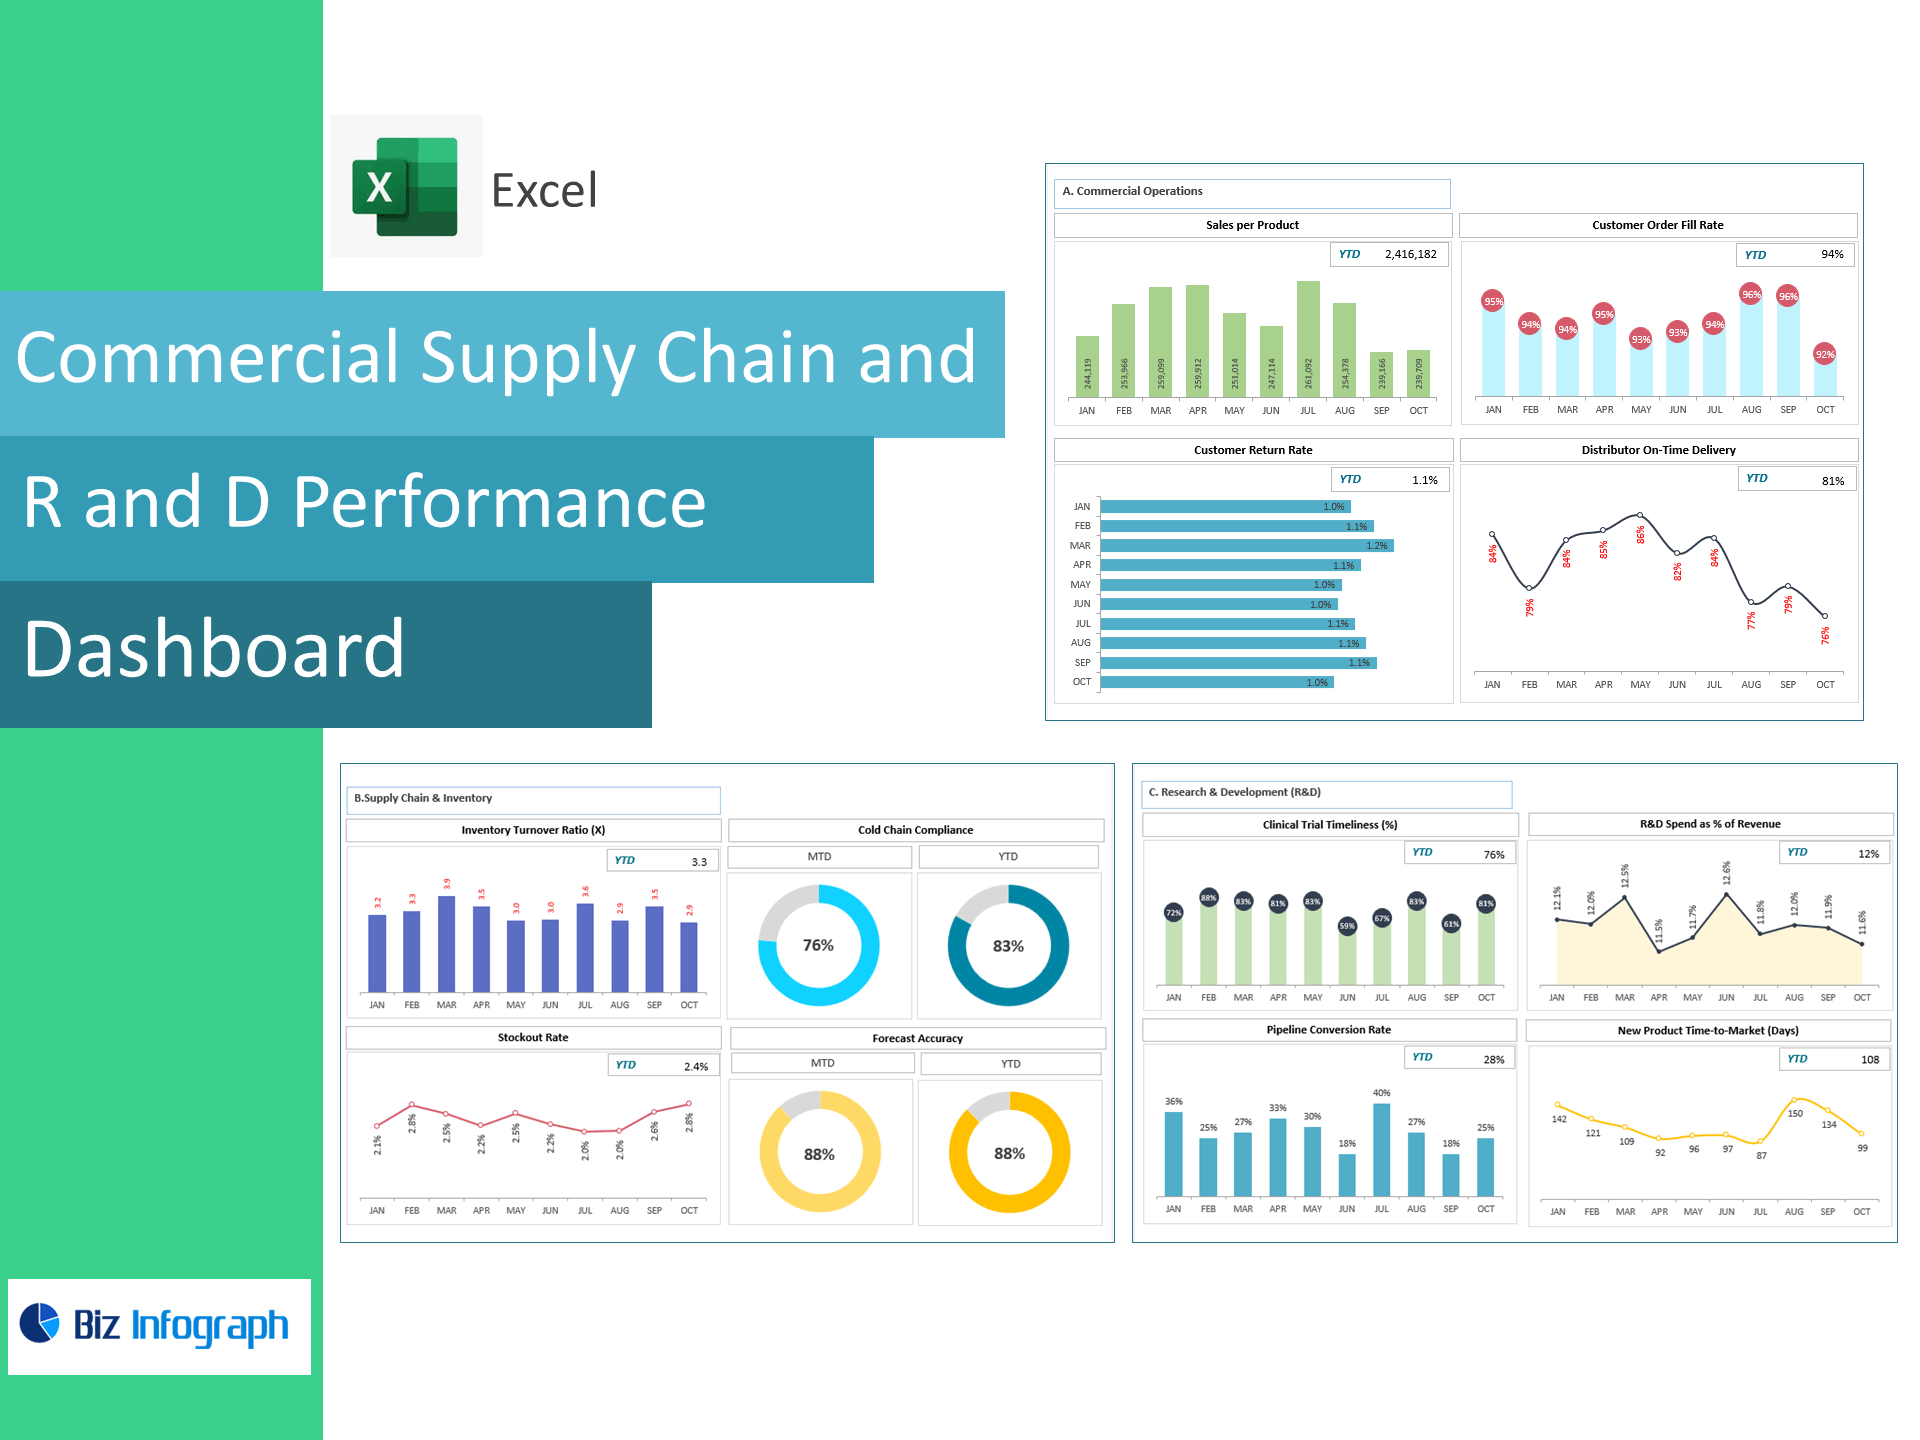
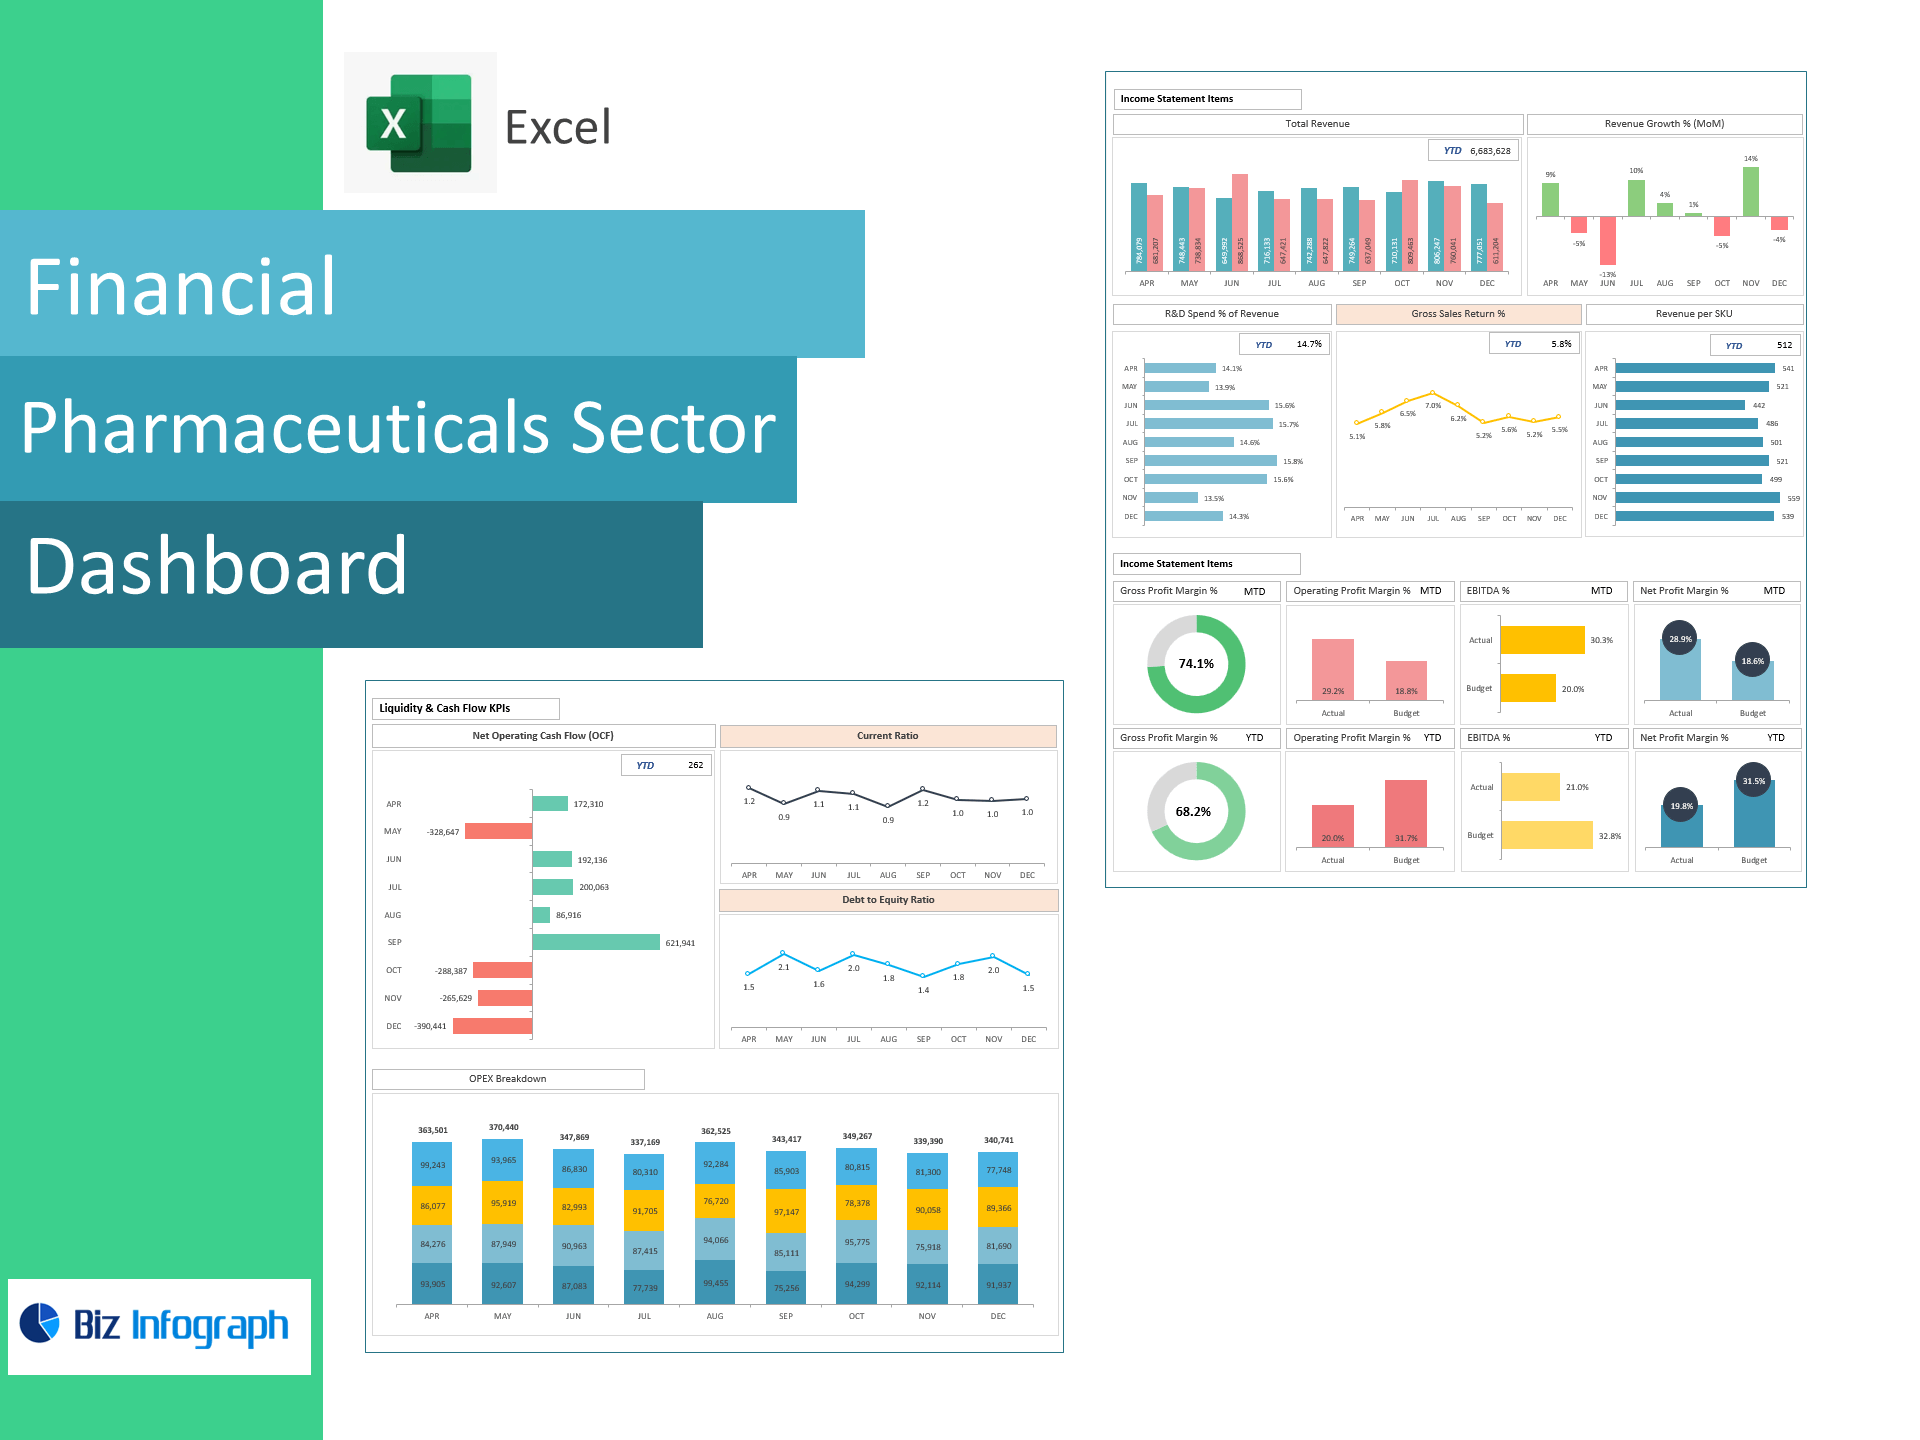
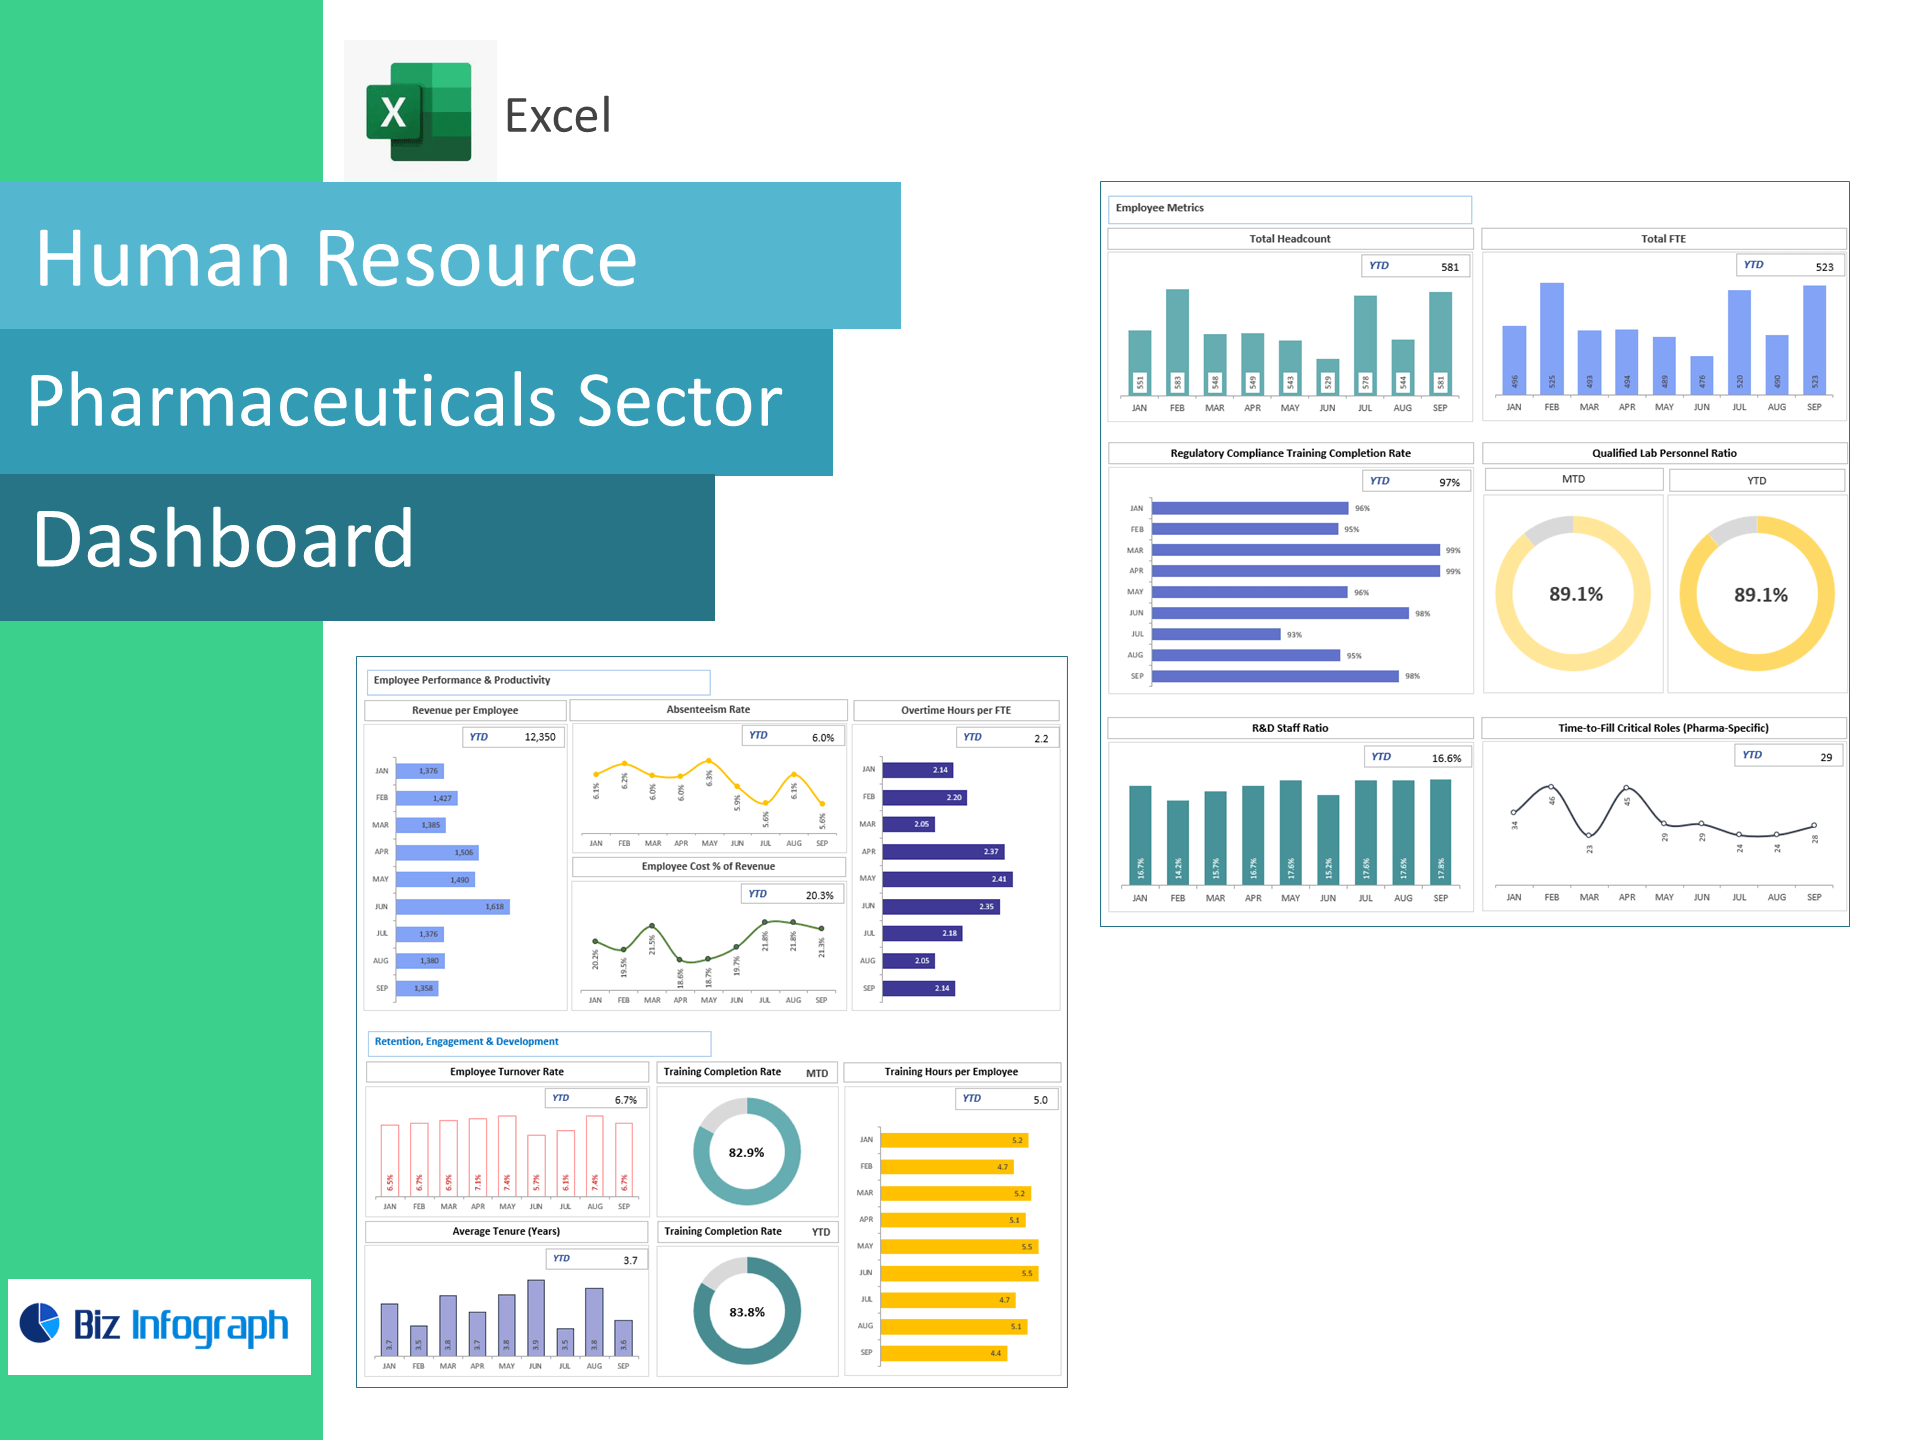
The Pharmaceuticals Dashboard Package is a comprehensive Excel-based solution tailored for pharmaceutical companies aiming to optimize performance, compliance, and decision-making across operations. This package features four powerful dashboards: Manufacturing Quality Performance, Commercial Supply Chain & R&D, Finance, and Human Resource Dashboards. Designed to track critical KPIs such as batch quality, R&D productivity, inventory turnover, regulatory compliance, and financial metrics, this tool provides real-time visibility into each segment of pharmaceutical operations. Whether managing production quality, streamlining supply logistics, or ensuring workforce efficiency, this dashboard package helps pharmaceutical managers ensure safety, compliance, and profitability—making it an essential asset for data-driven operations in the pharmaceutical industry.
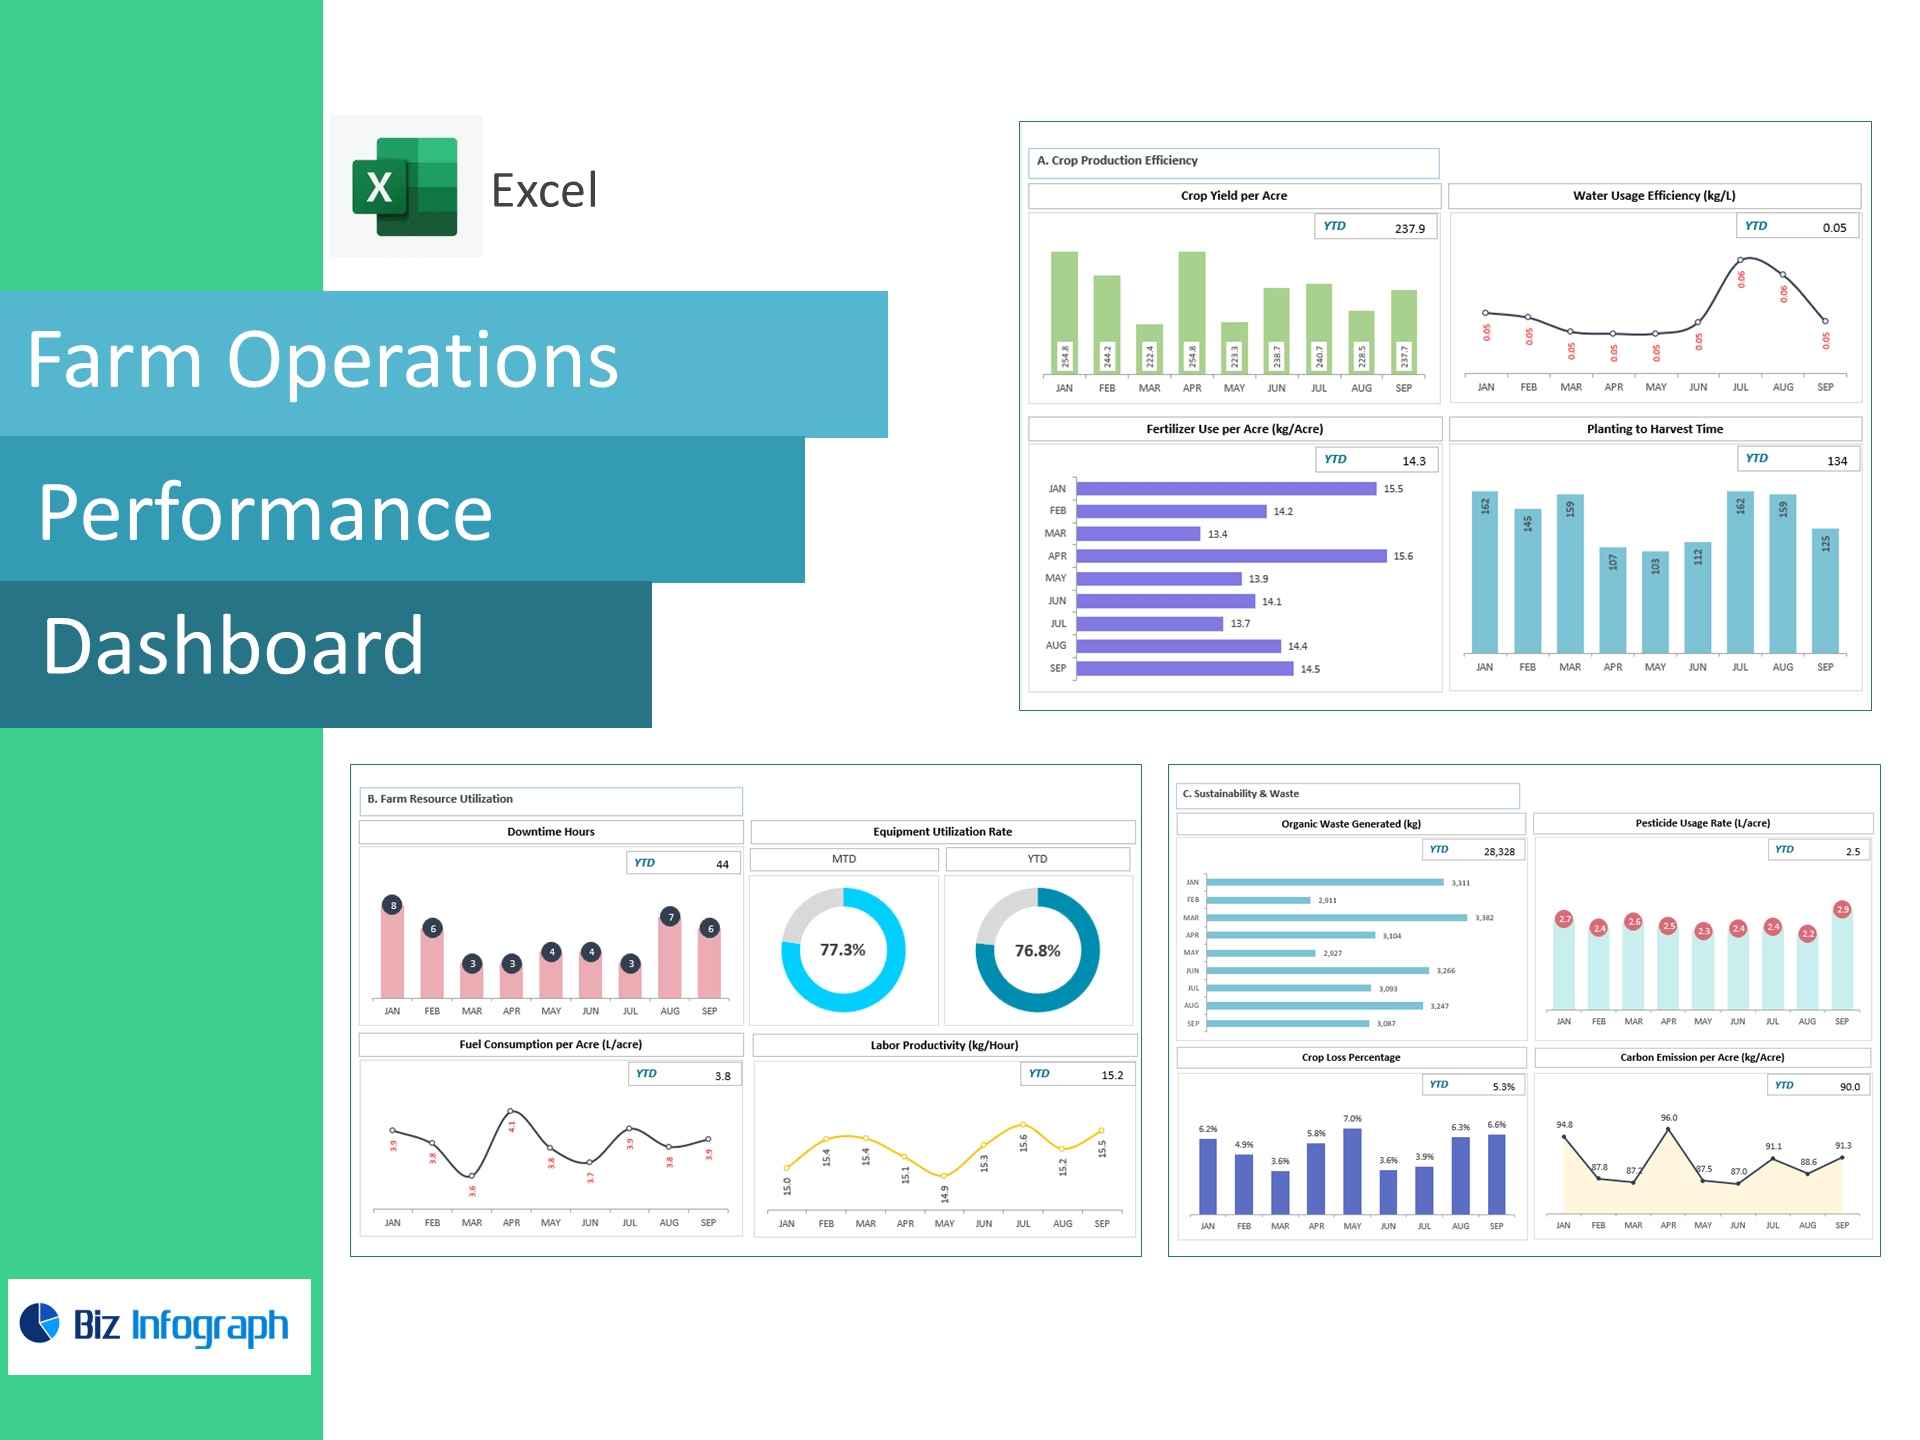
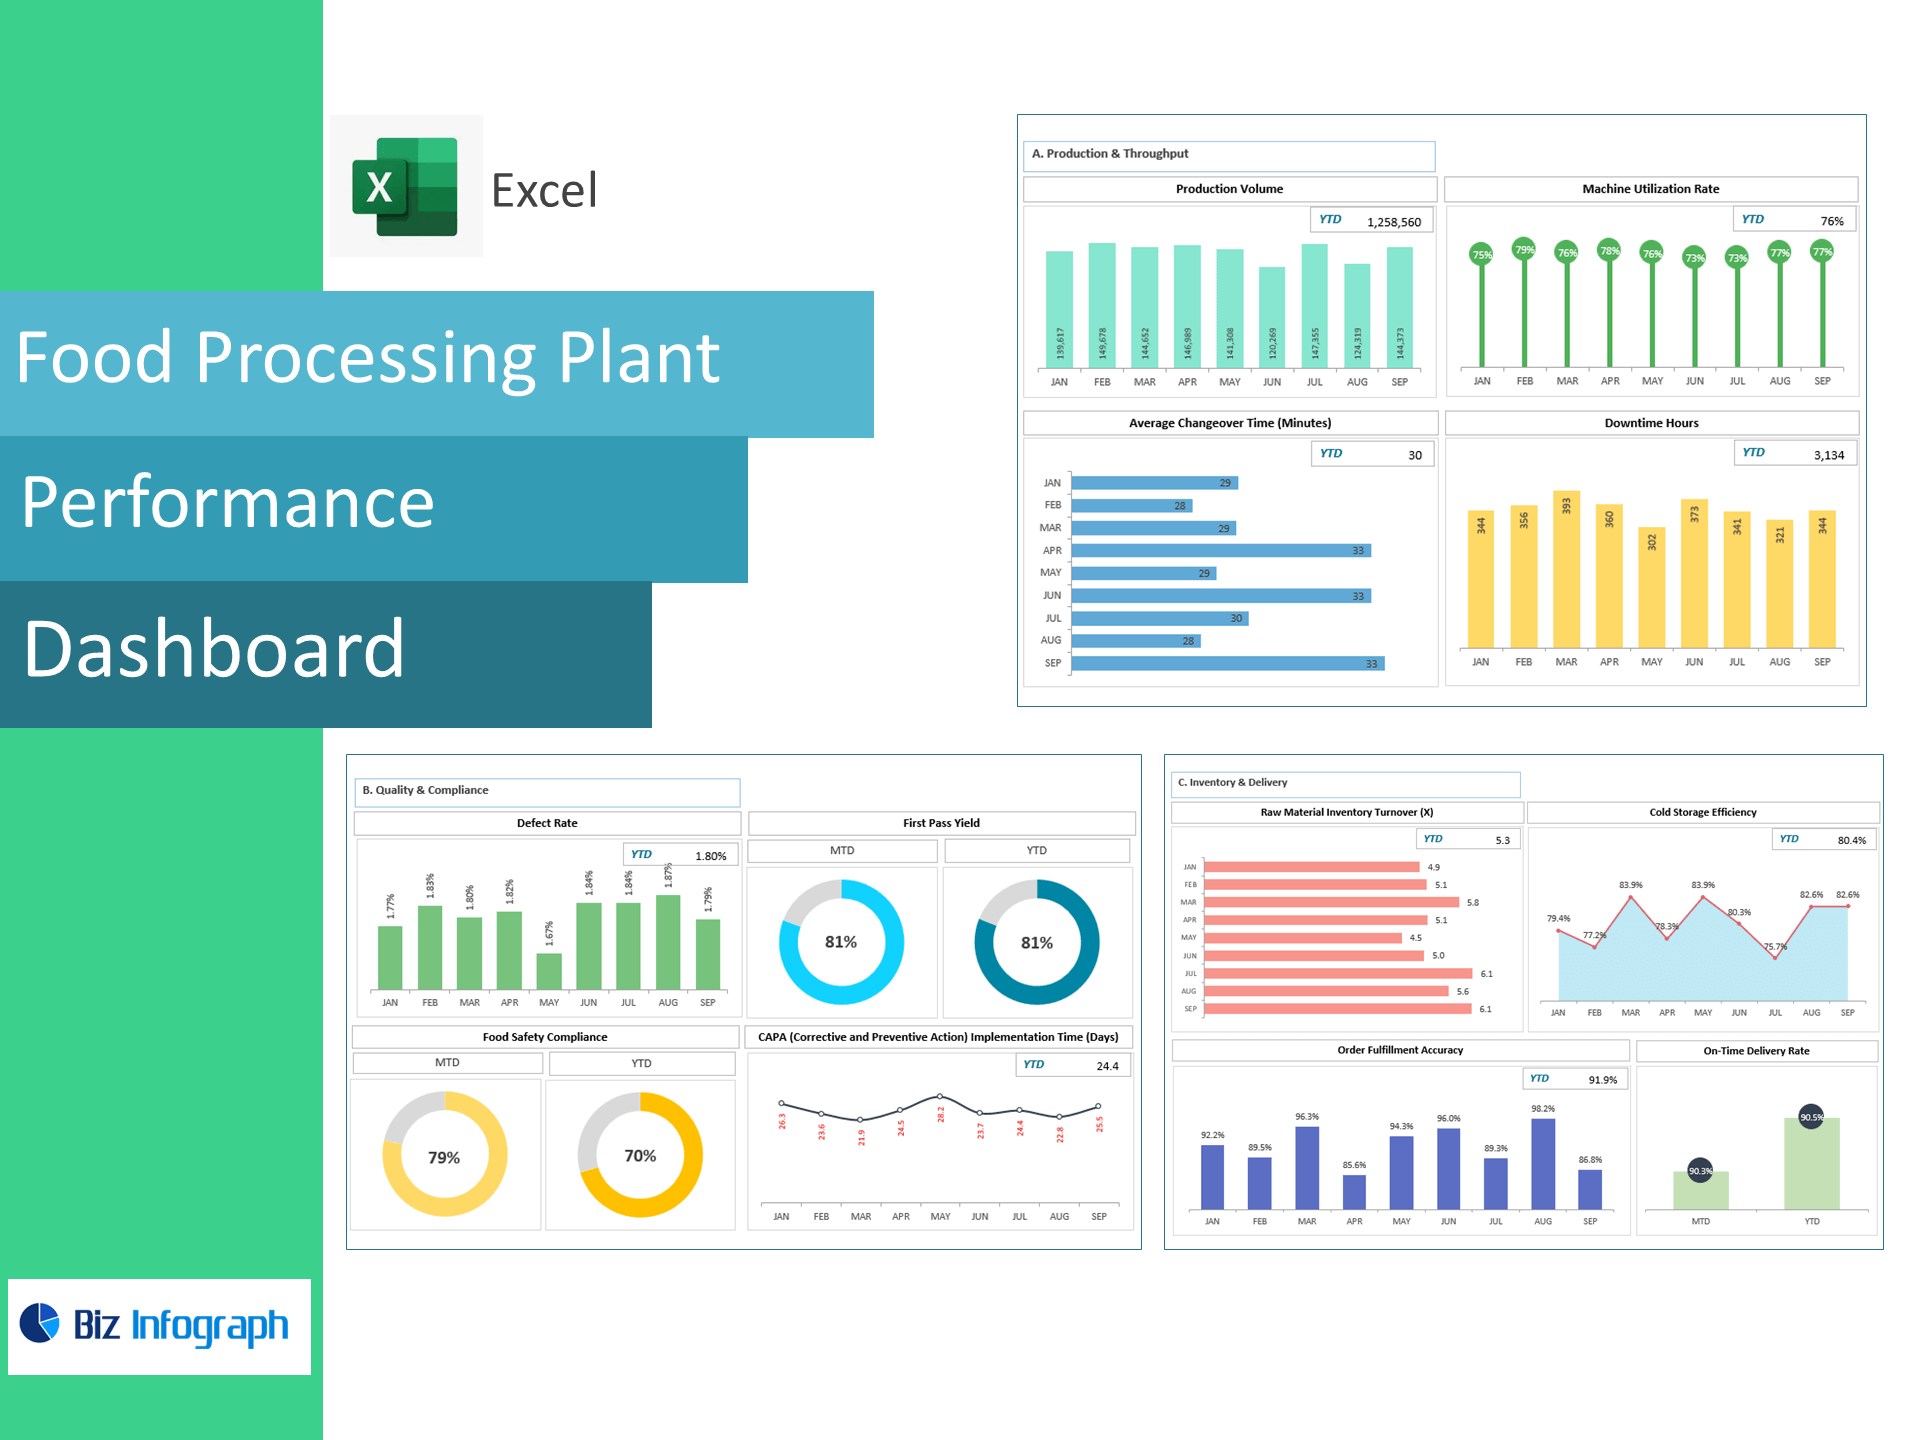
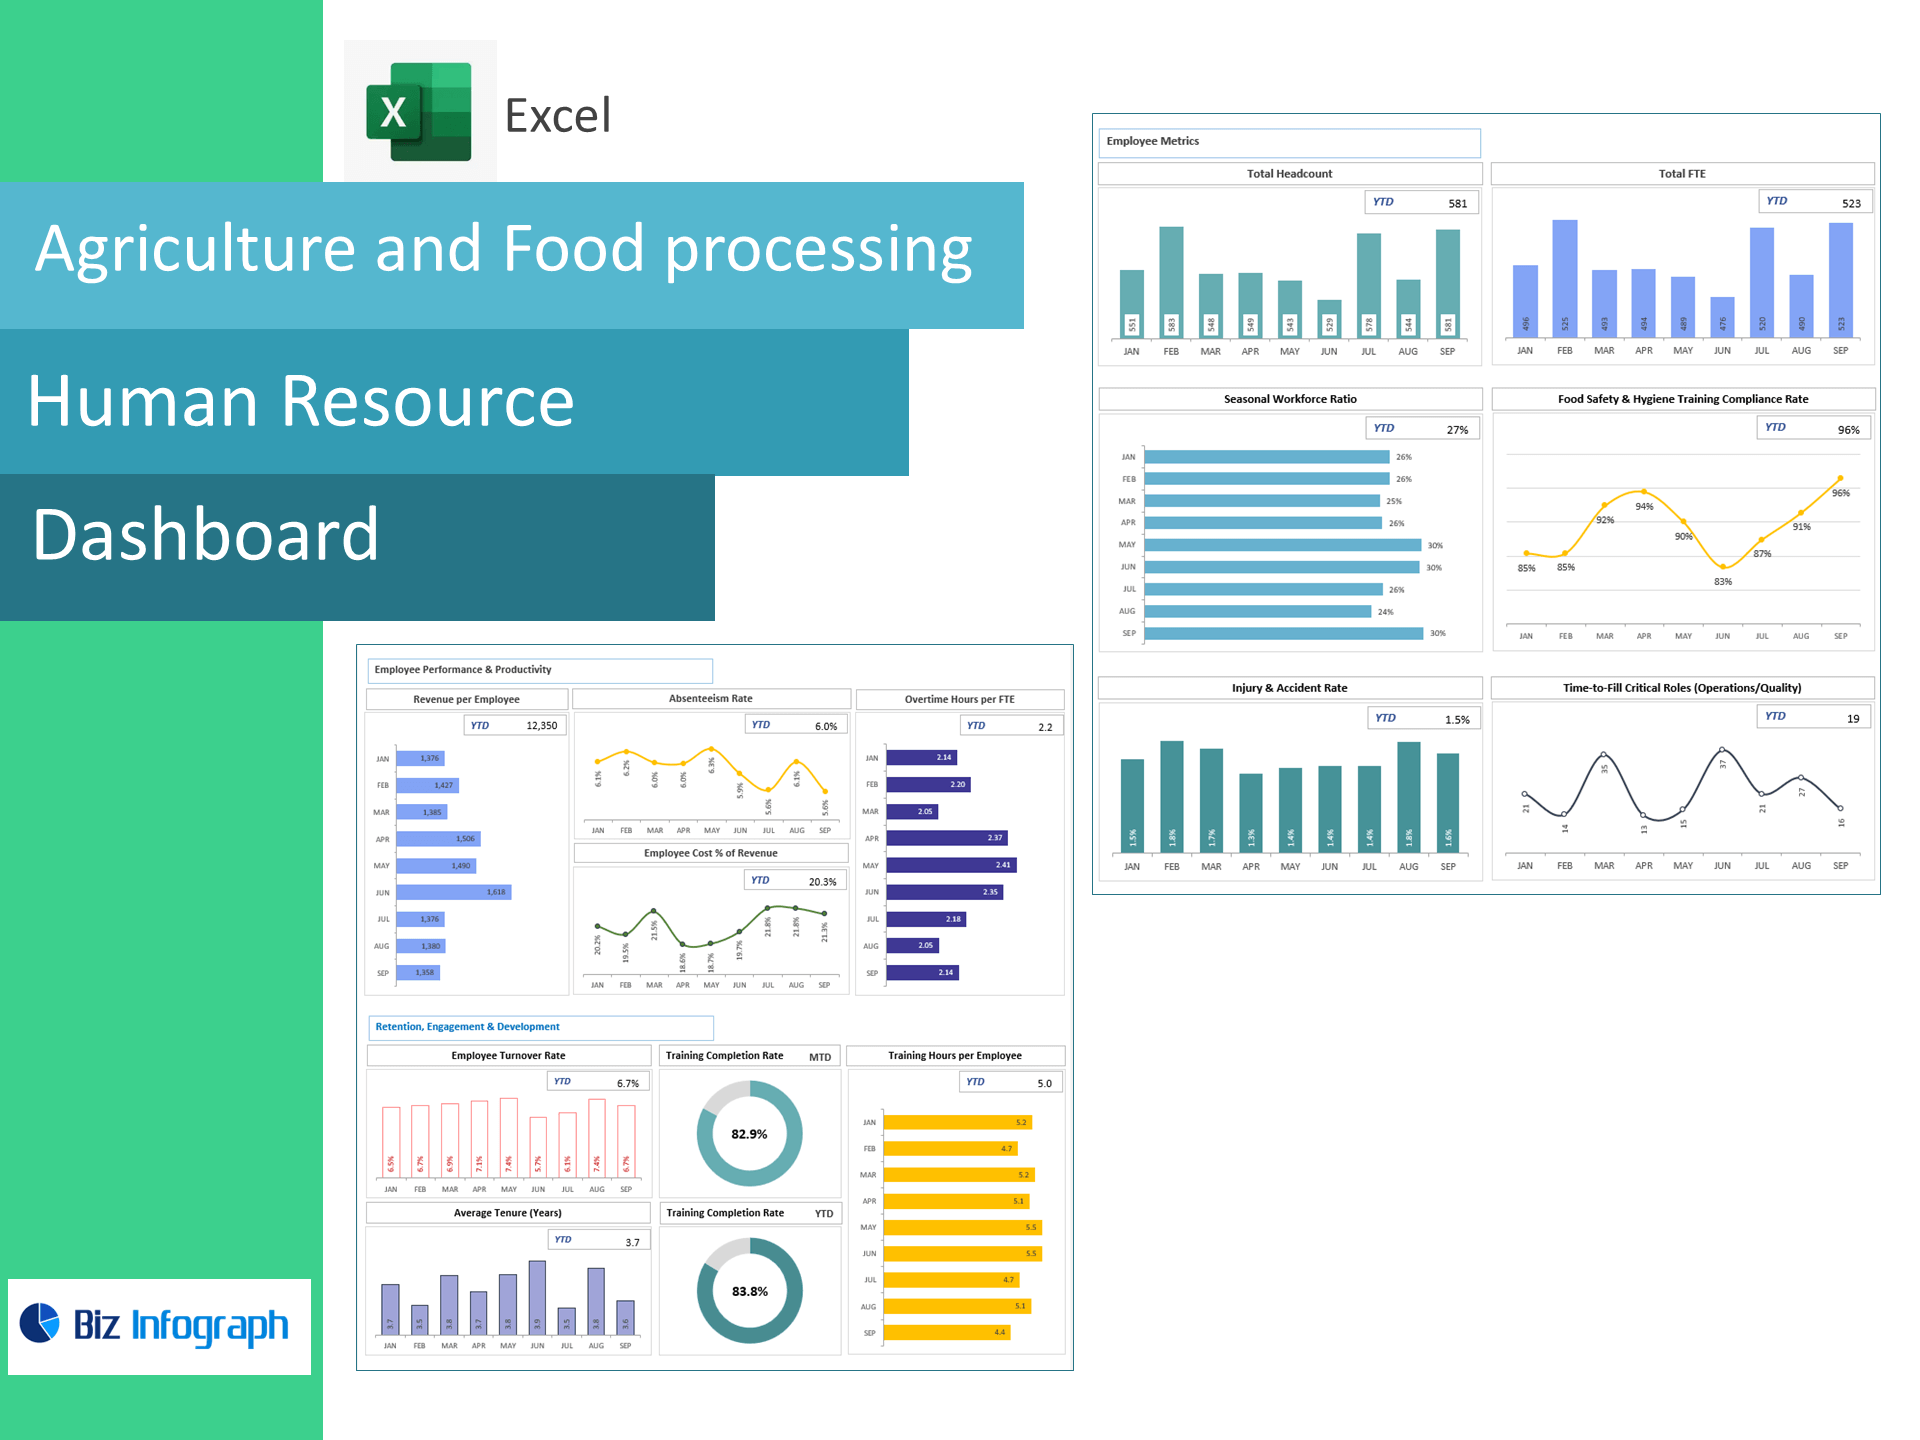
The Agriculture and Food Processing Dashboard Package is a powerful Excel-based toolkit designed to streamline operations and enhance visibility across farm management and food production activities. This package includes four specialized dashboards: Farm Operations Performance, Food Processing Plant Performance, Finance, and Human Resource Dashboards. Each dashboard enables real-time tracking of essential KPIs such as crop yield, production efficiency, resource utilization, financial health, and workforce performance. With visually intuitive charts and automated metrics, this solution helps agribusinesses and food processing units make informed, data-driven decisions. Whether you're managing harvest timelines or monitoring processing throughput, this package delivers the insights you need to boost productivity and profitability.


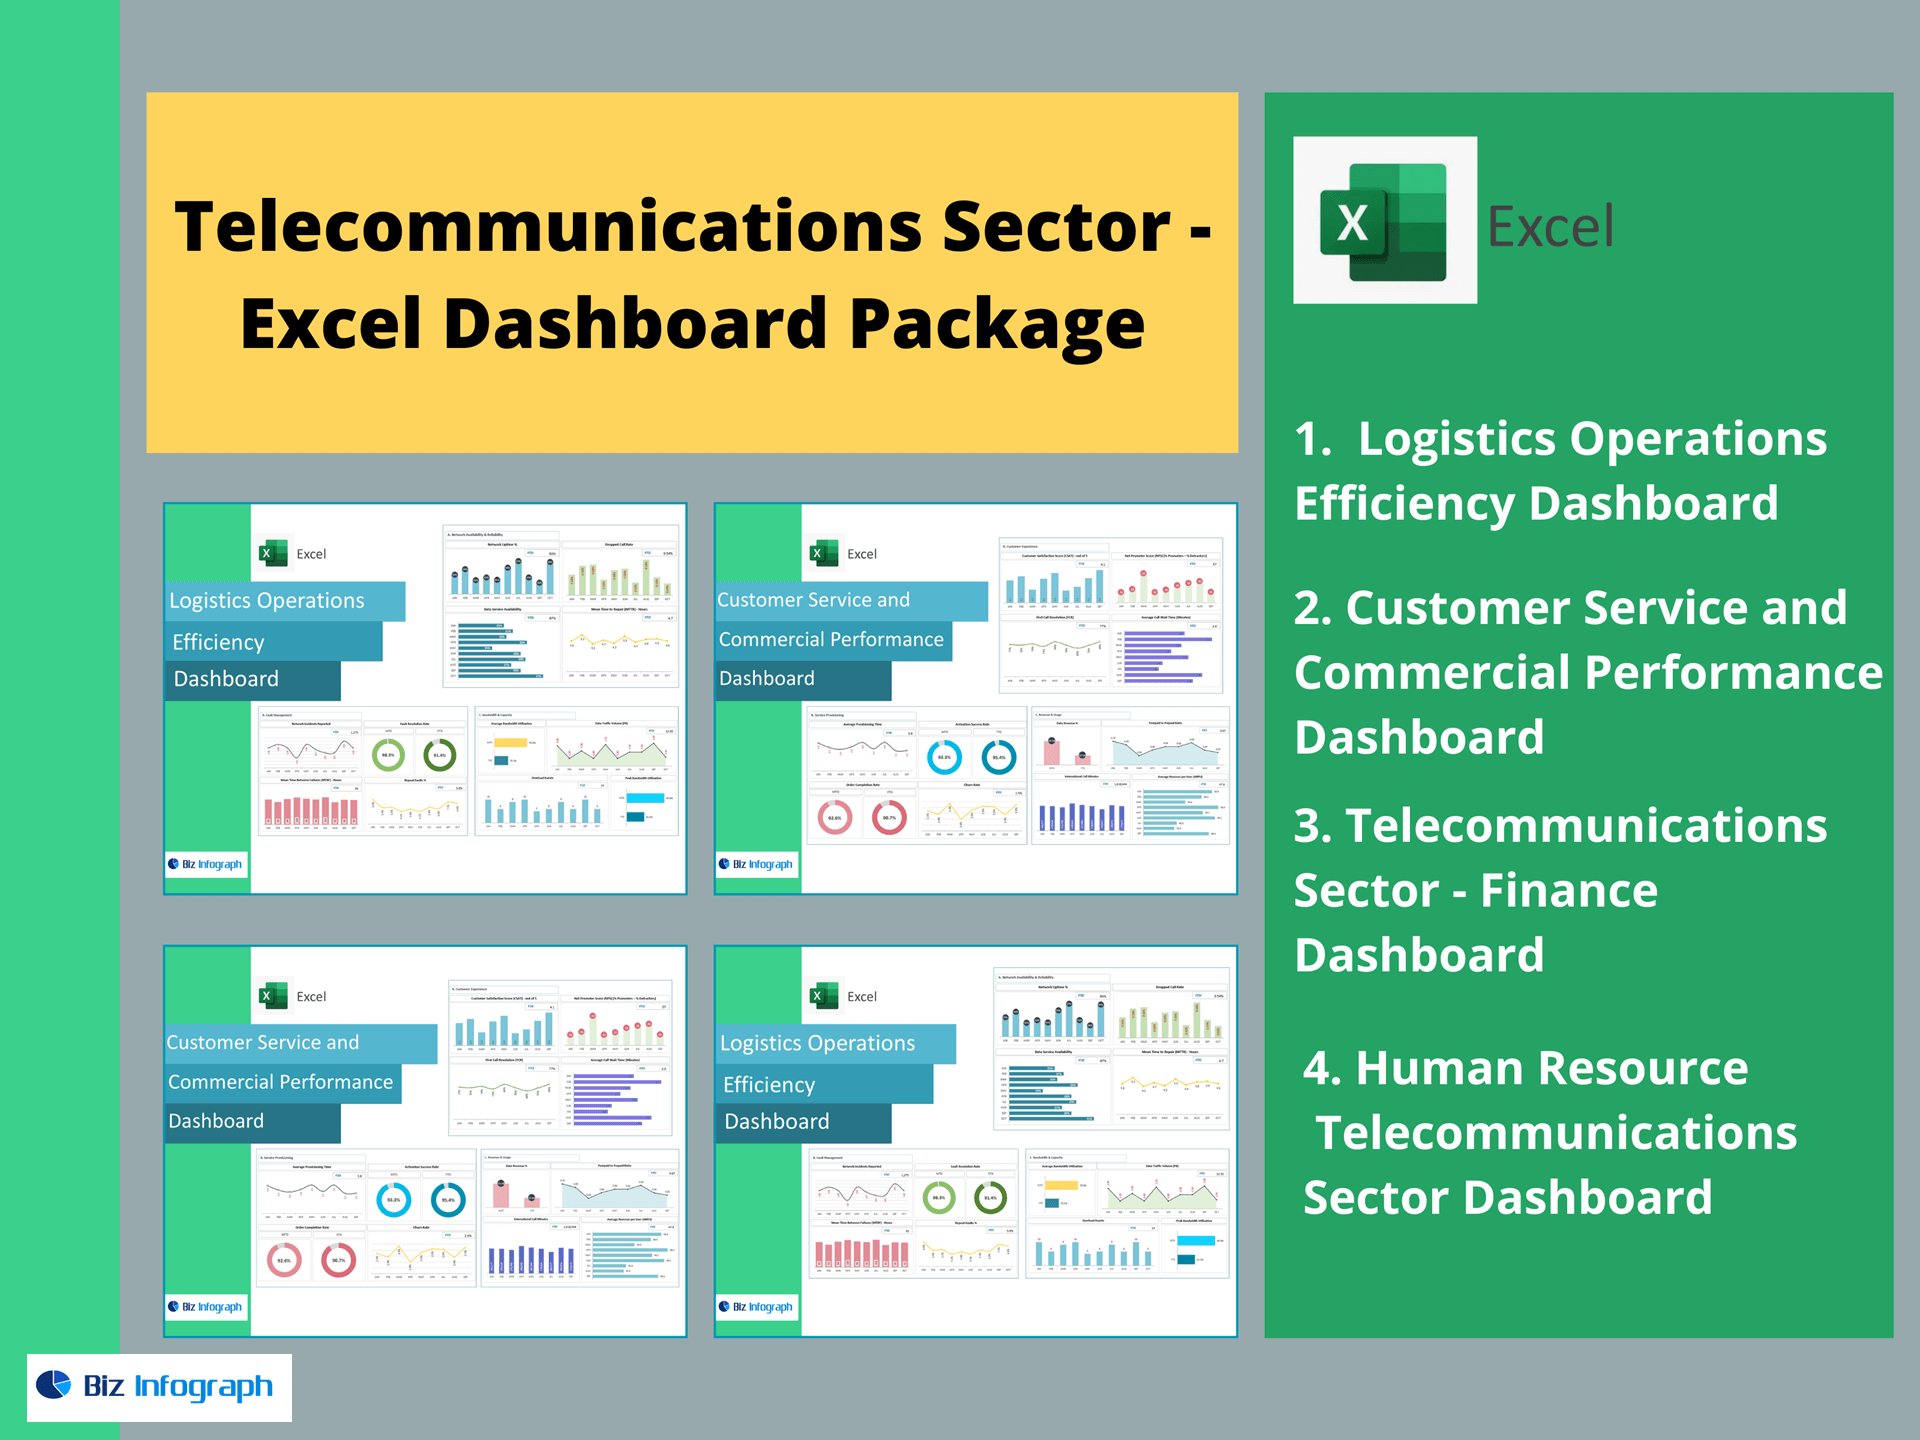
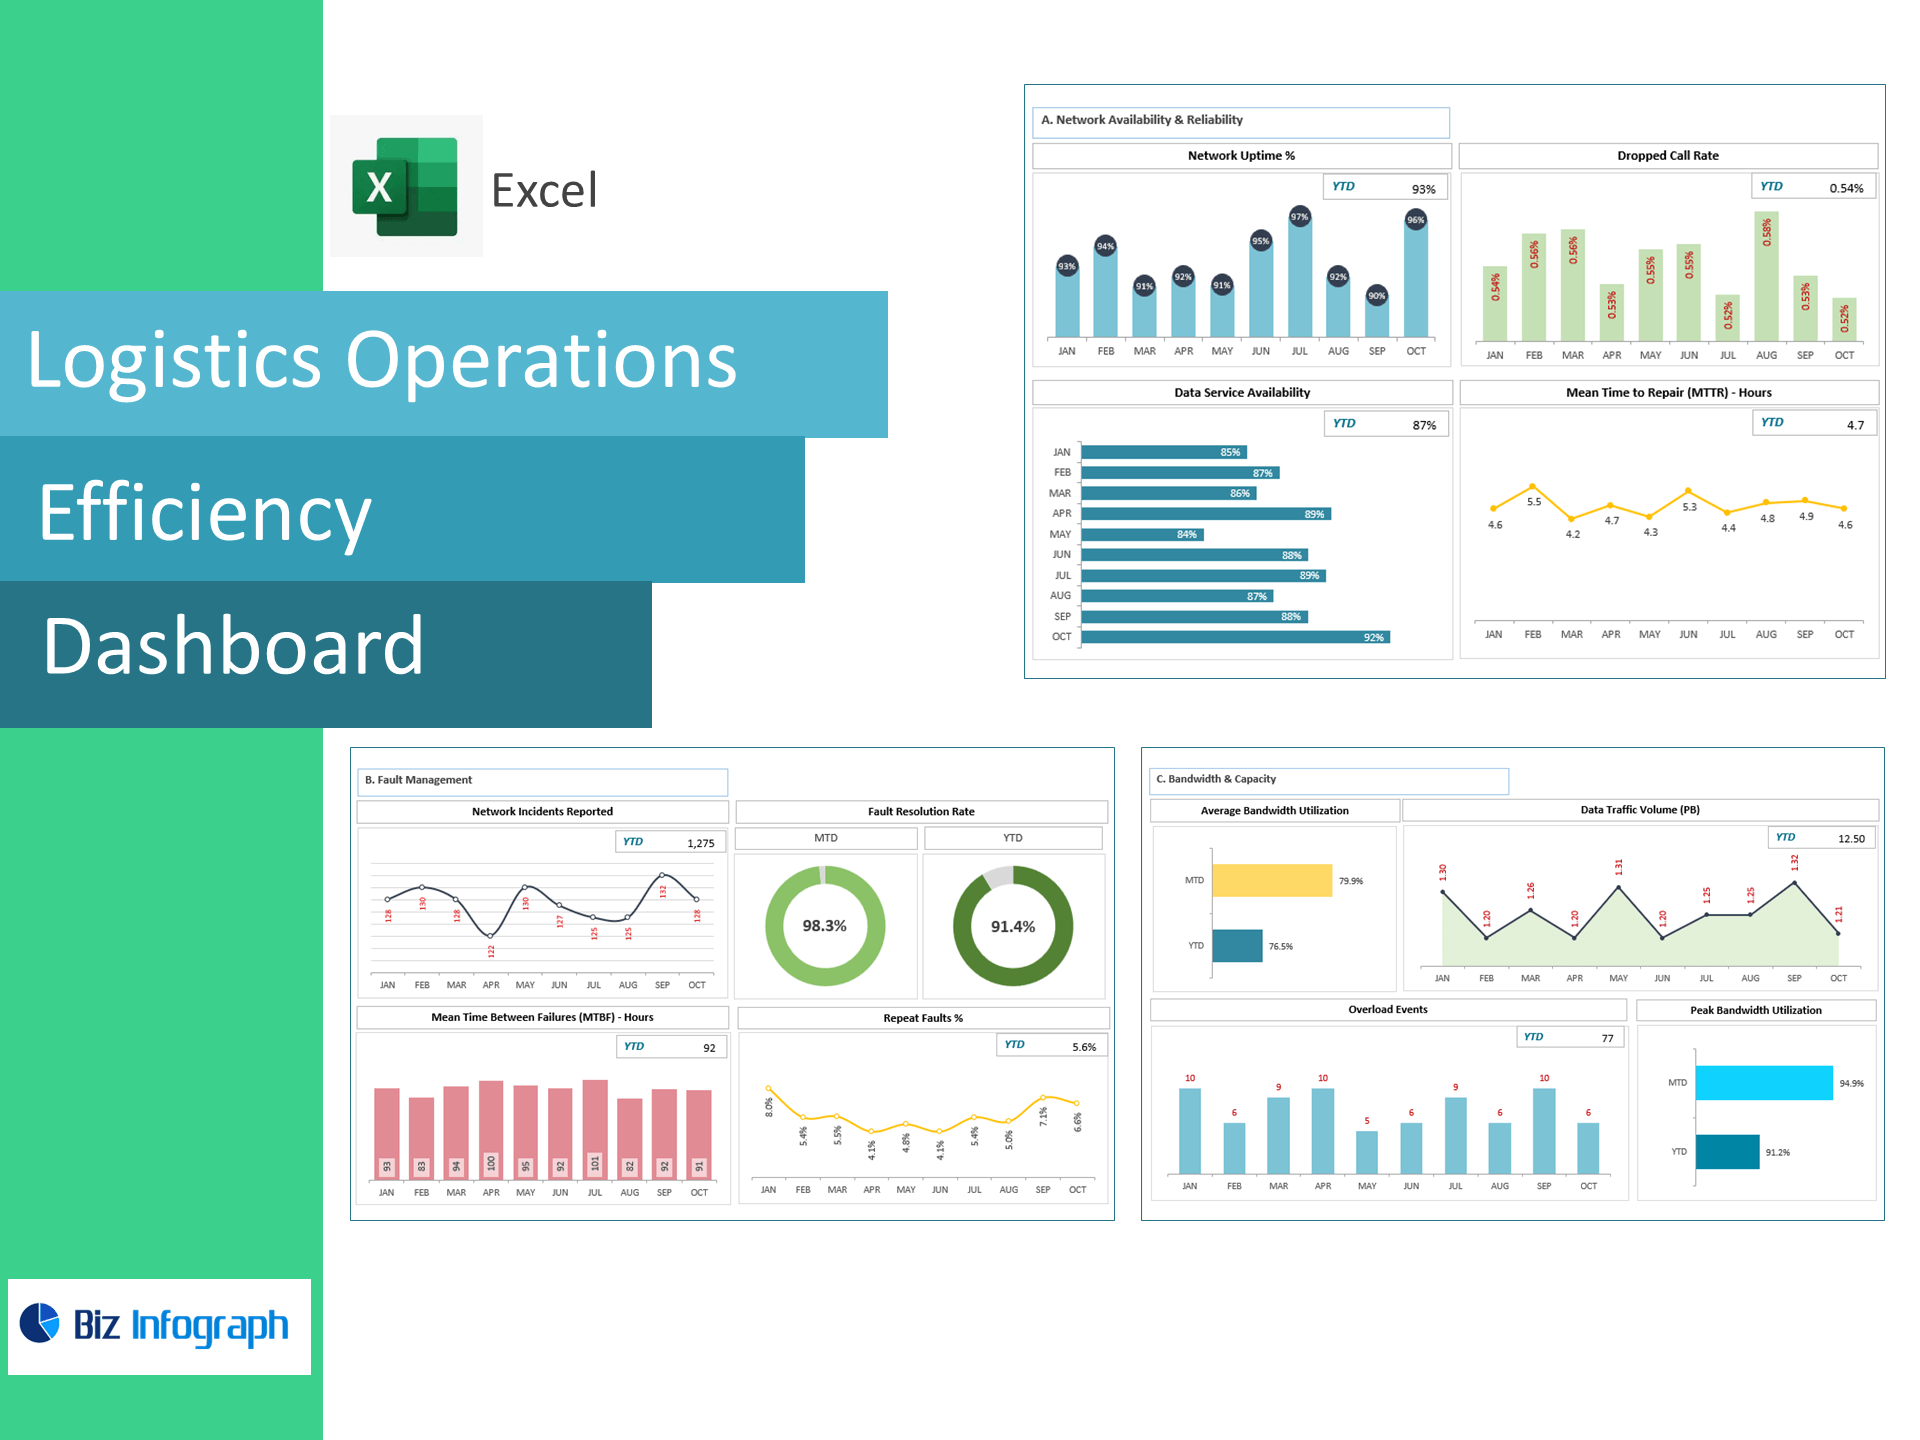
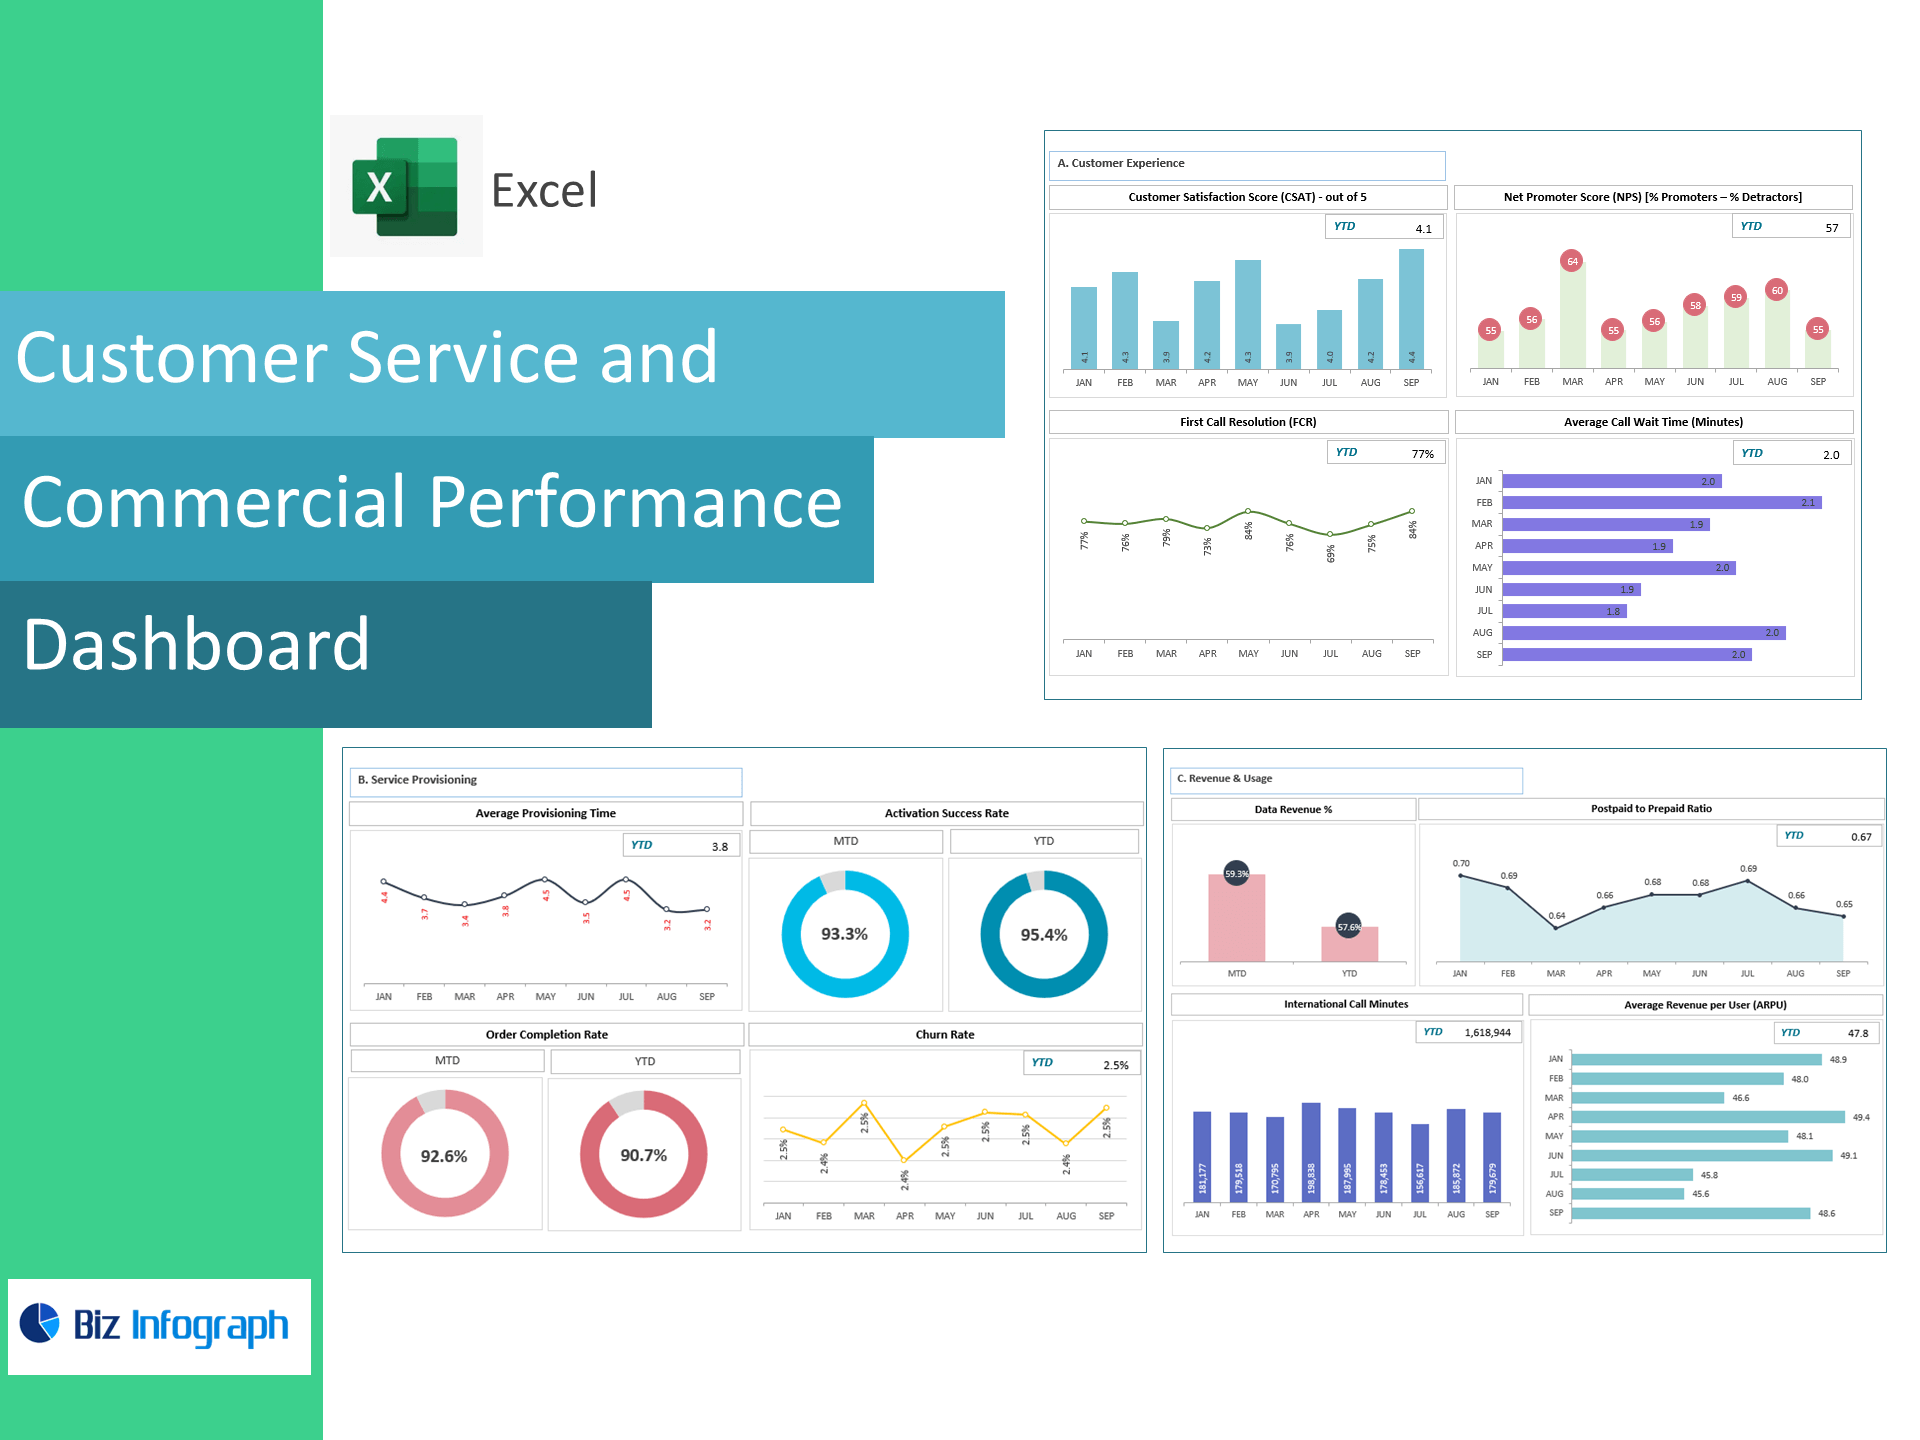
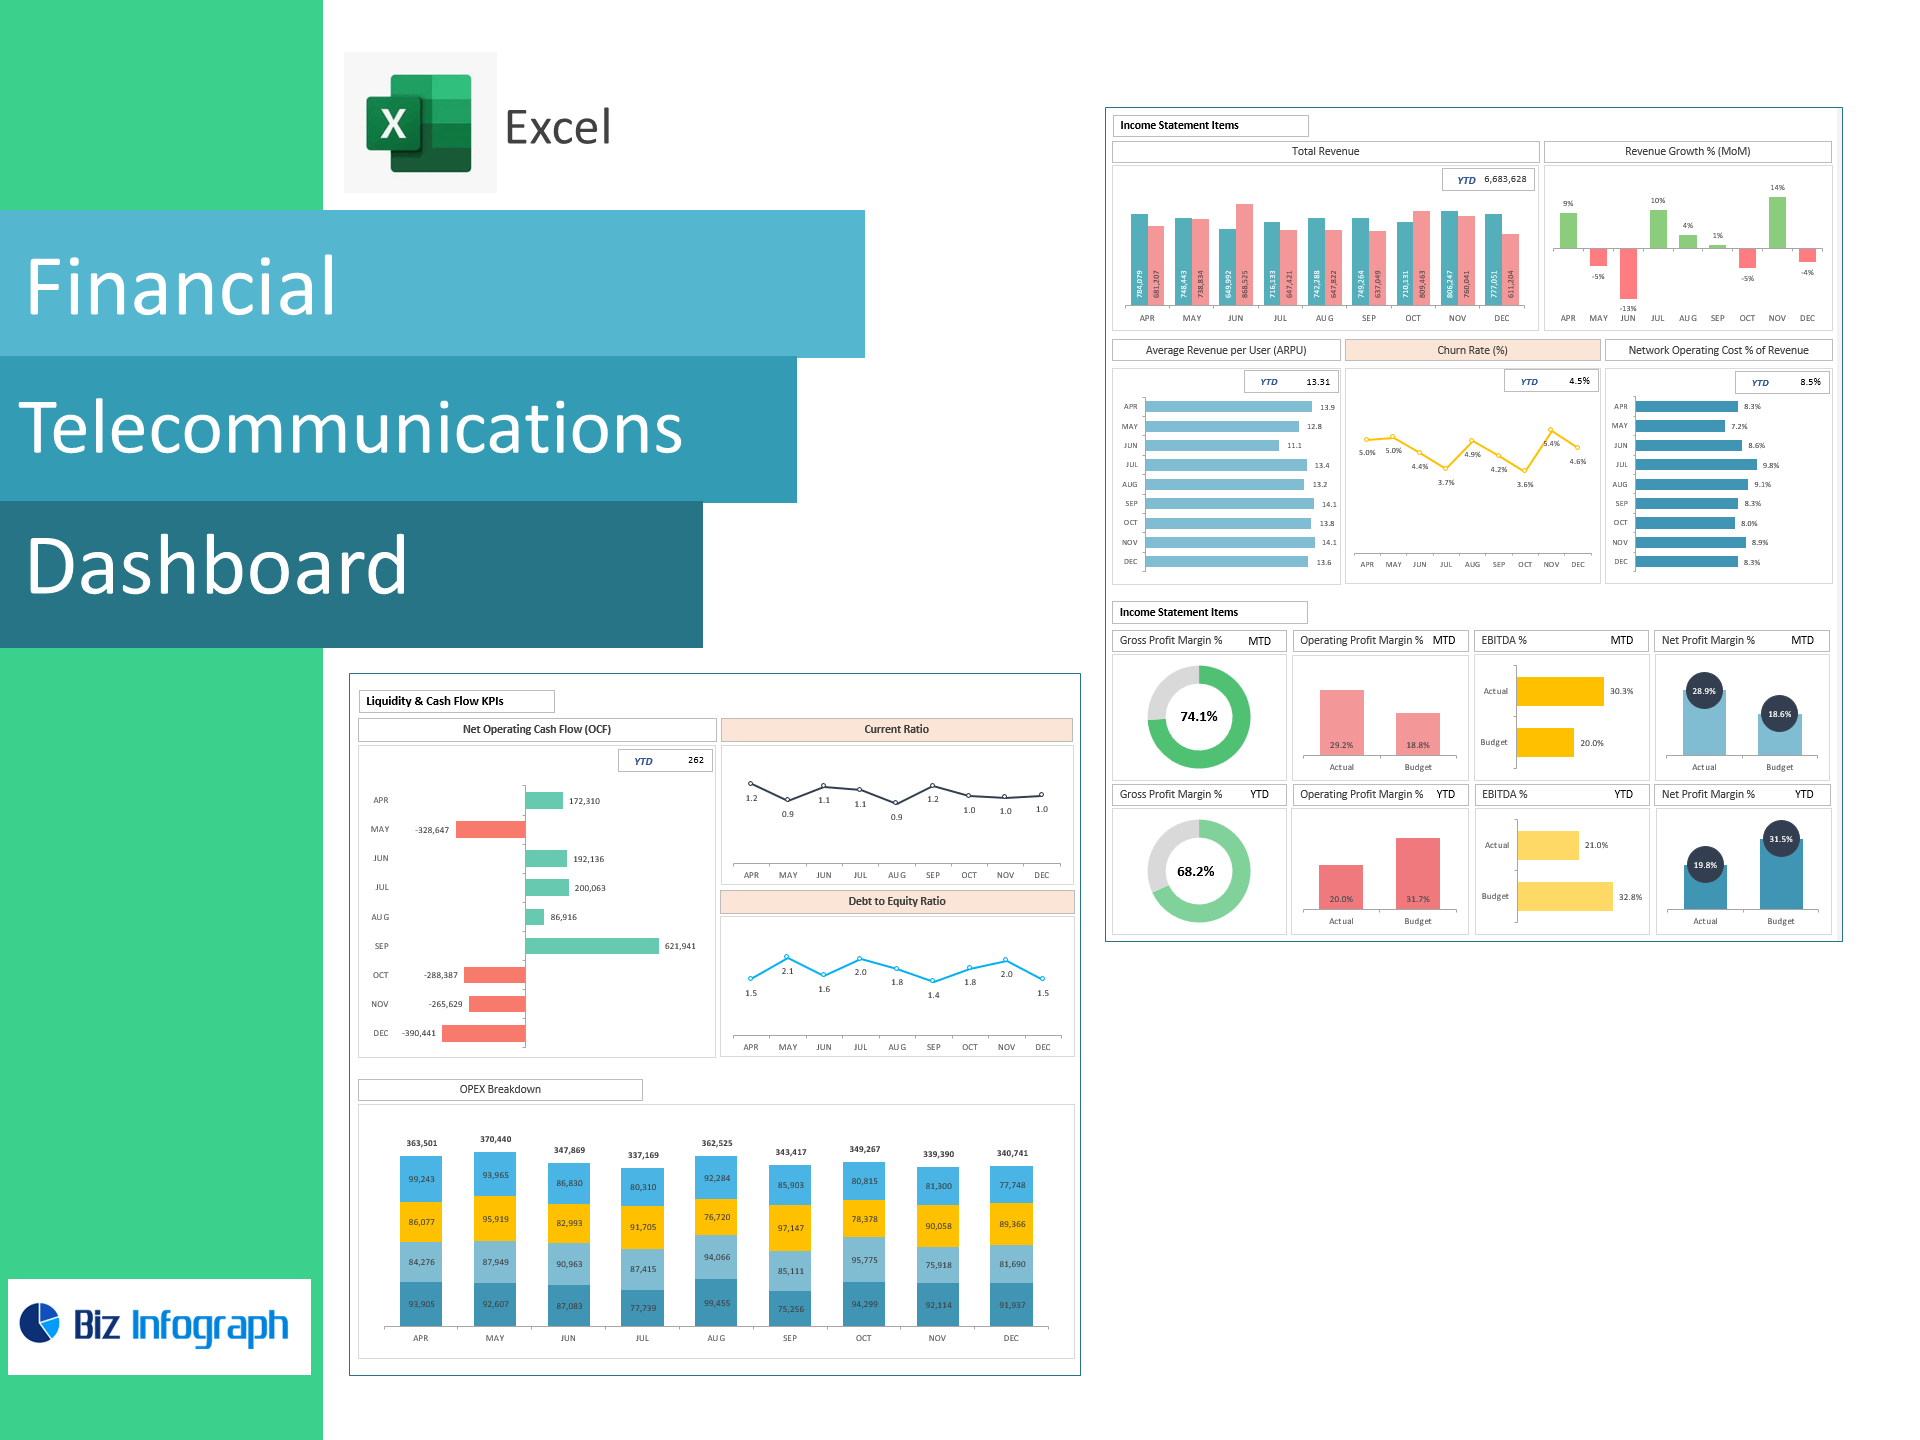
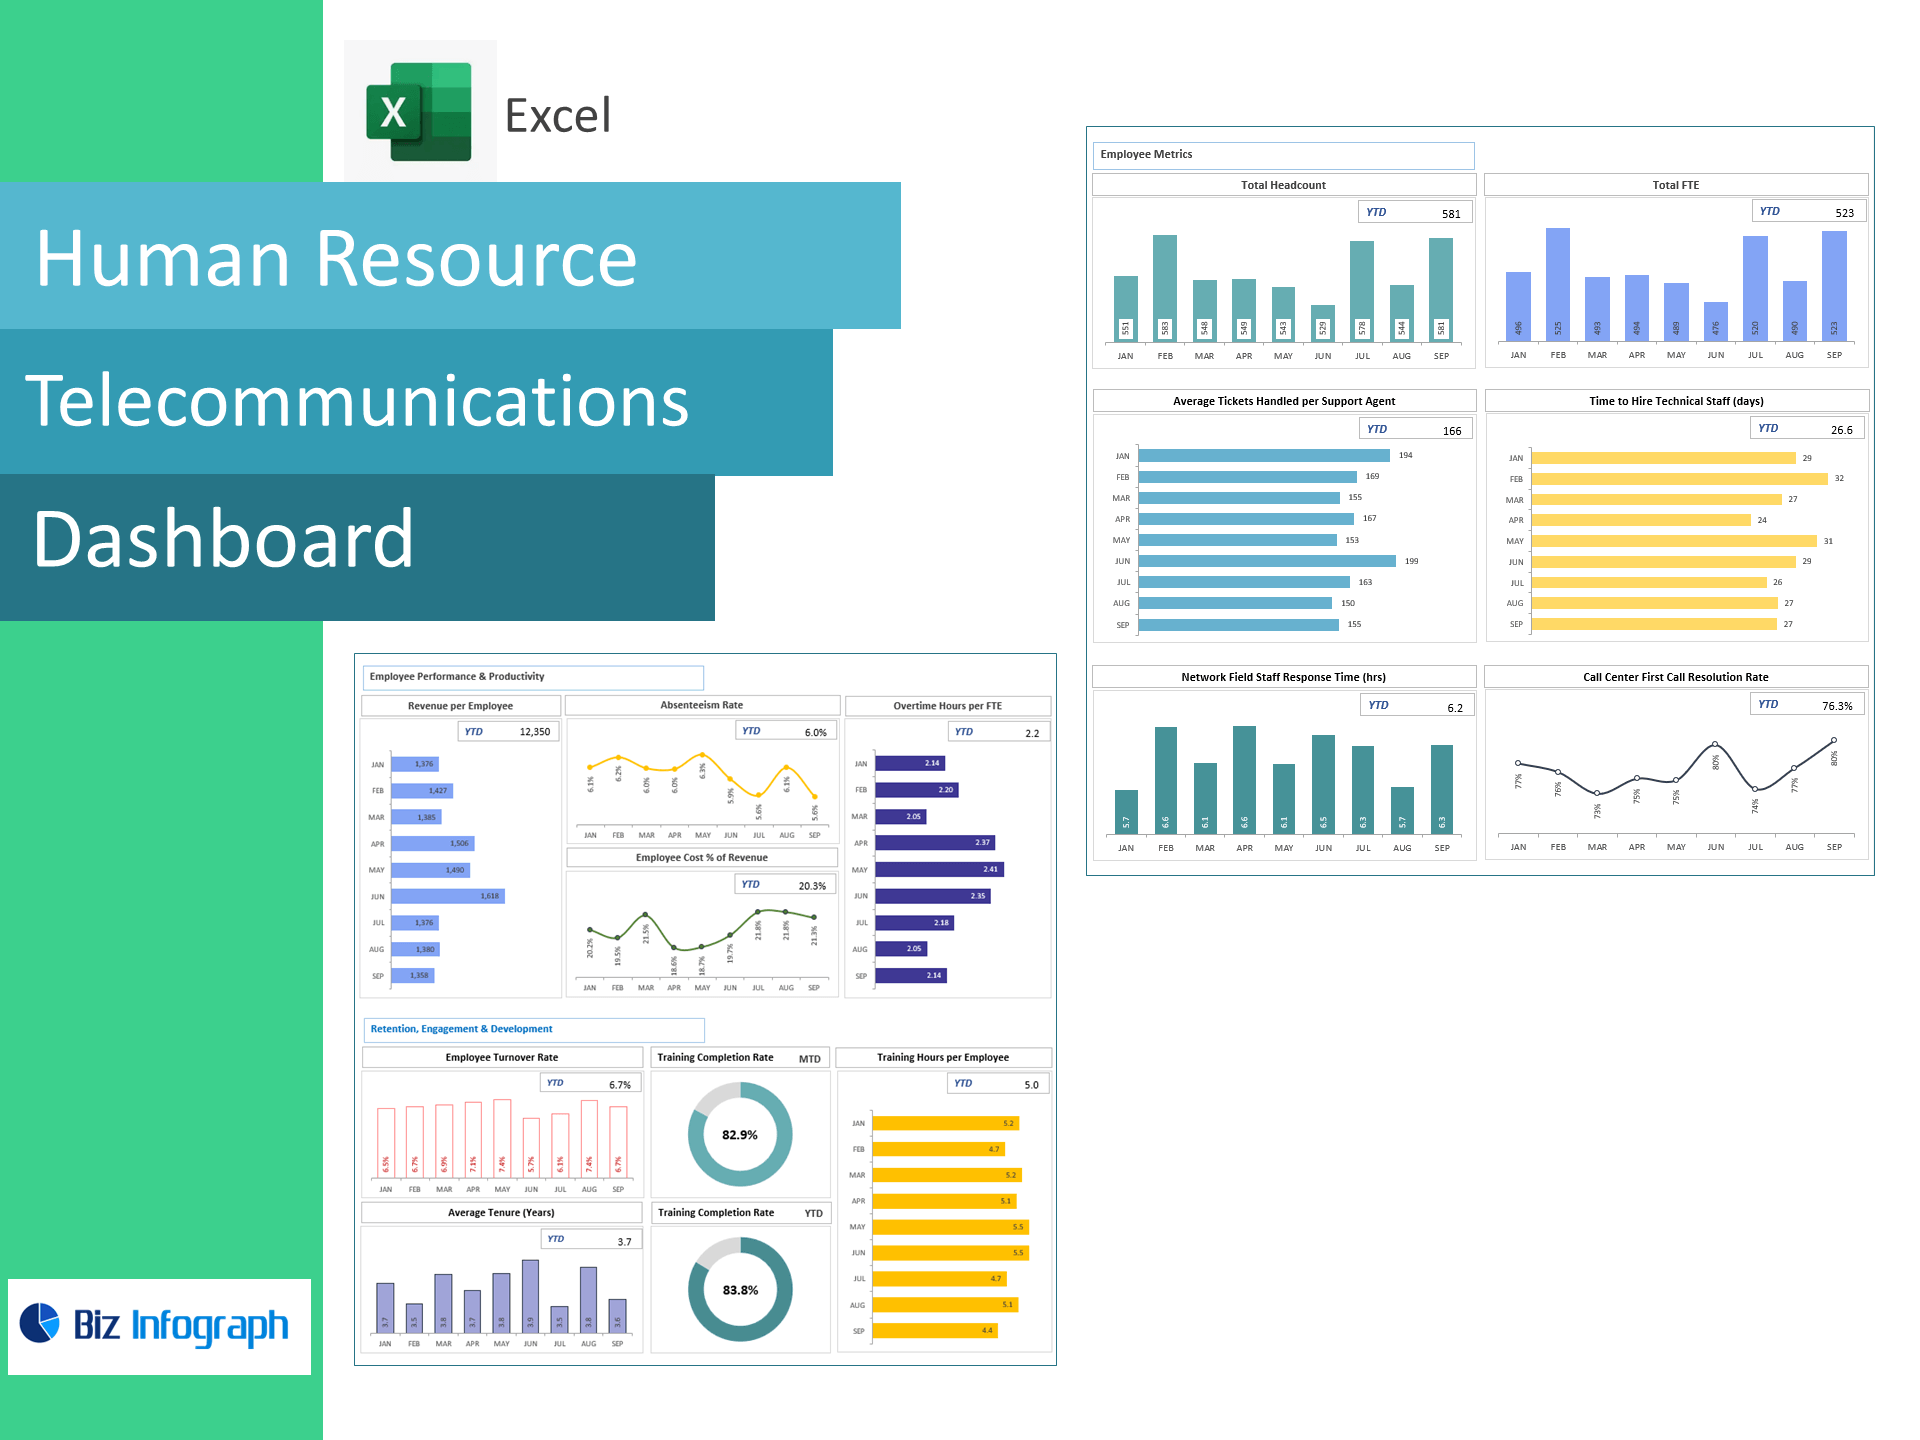
The Telecommunications Dashboard Package is a dynamic Excel-based solution tailored for telecom companies aiming to optimize operational efficiency, customer service, financial health, and workforce performance. This package includes four purpose-built dashboards: Logistics Operations Efficiency, Customer Service & Commercial Performance, Finance, and Human Resource Dashboards. Each dashboard delivers real-time insights into key telecom KPIs—such as network logistics, customer satisfaction, revenue performance, and employee metrics—empowering telecom leaders to make fast, data-driven decisions. Whether managing service delivery, streamlining logistics, or improving financial oversight, this dashboard suite provides a centralized, easy-to-use platform that transforms raw data into actionable intelligence for sustainable performance in a competitive industry.
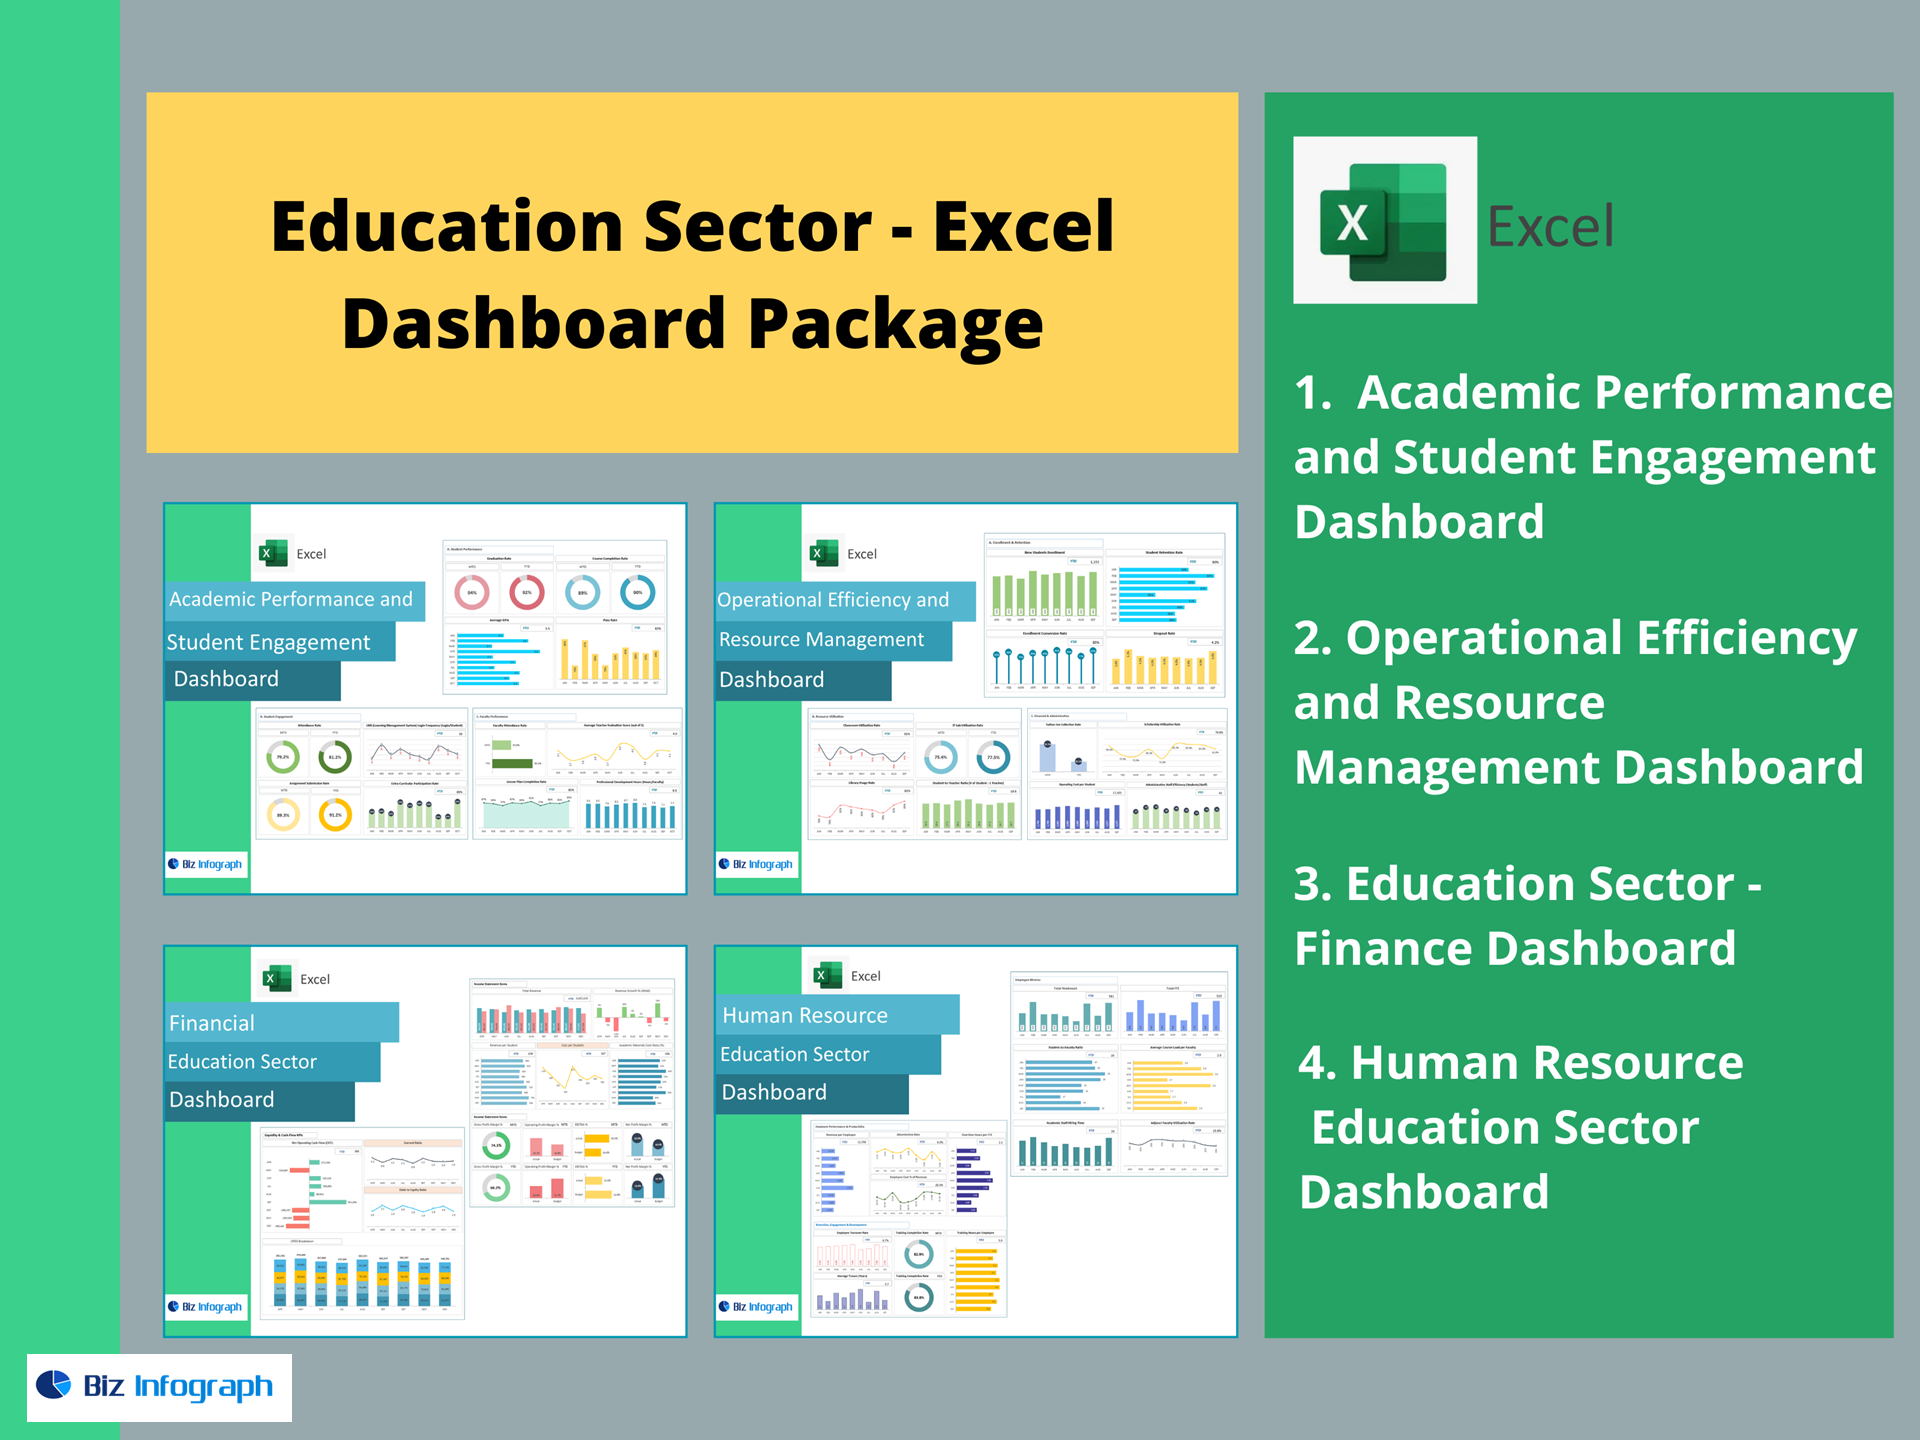
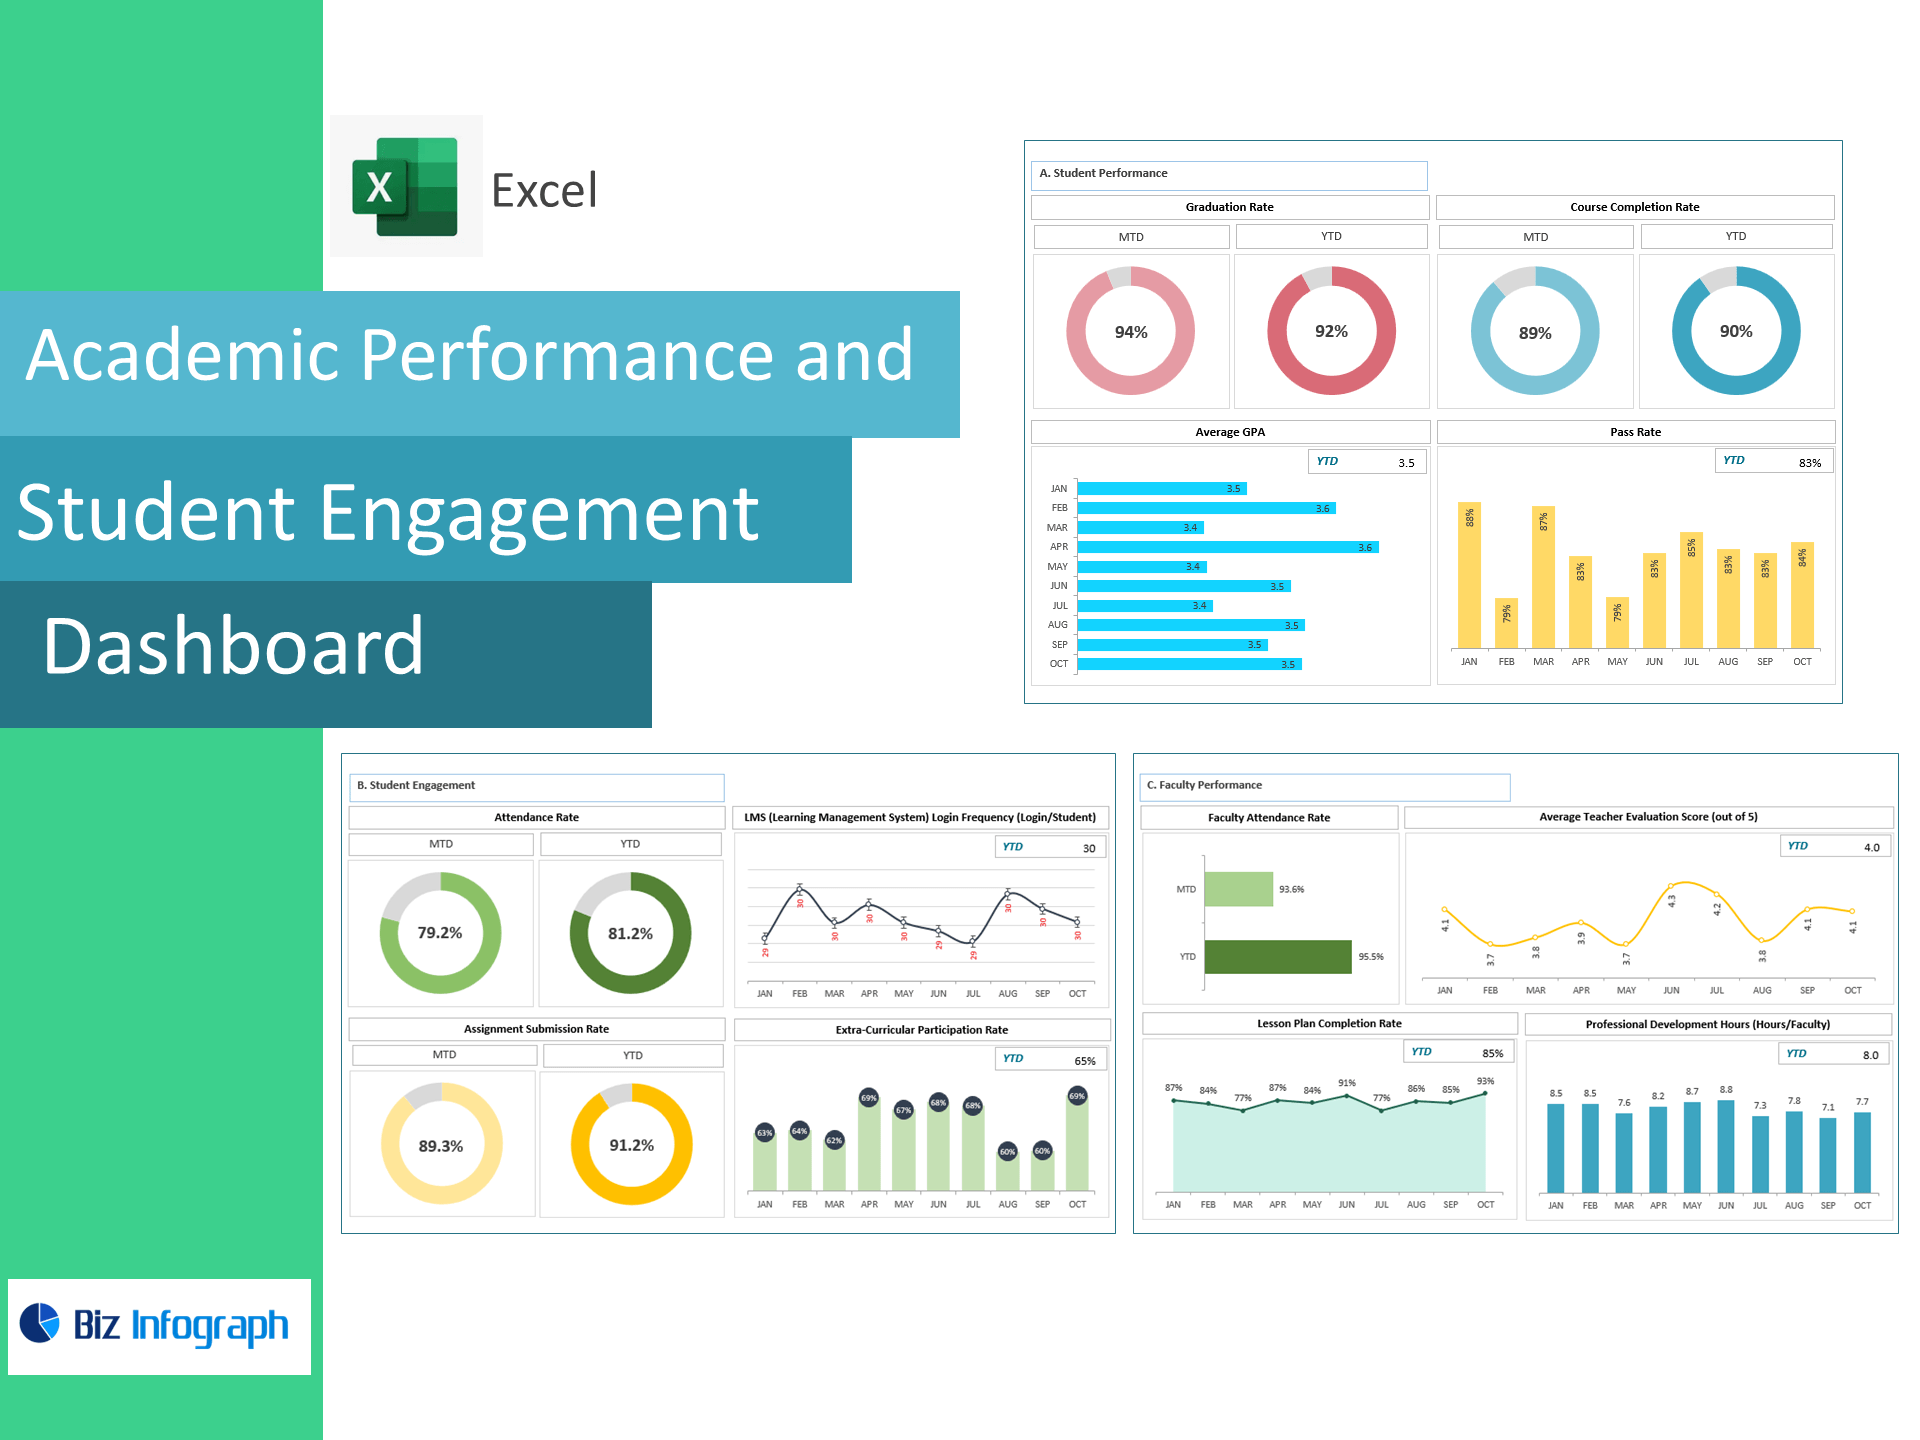
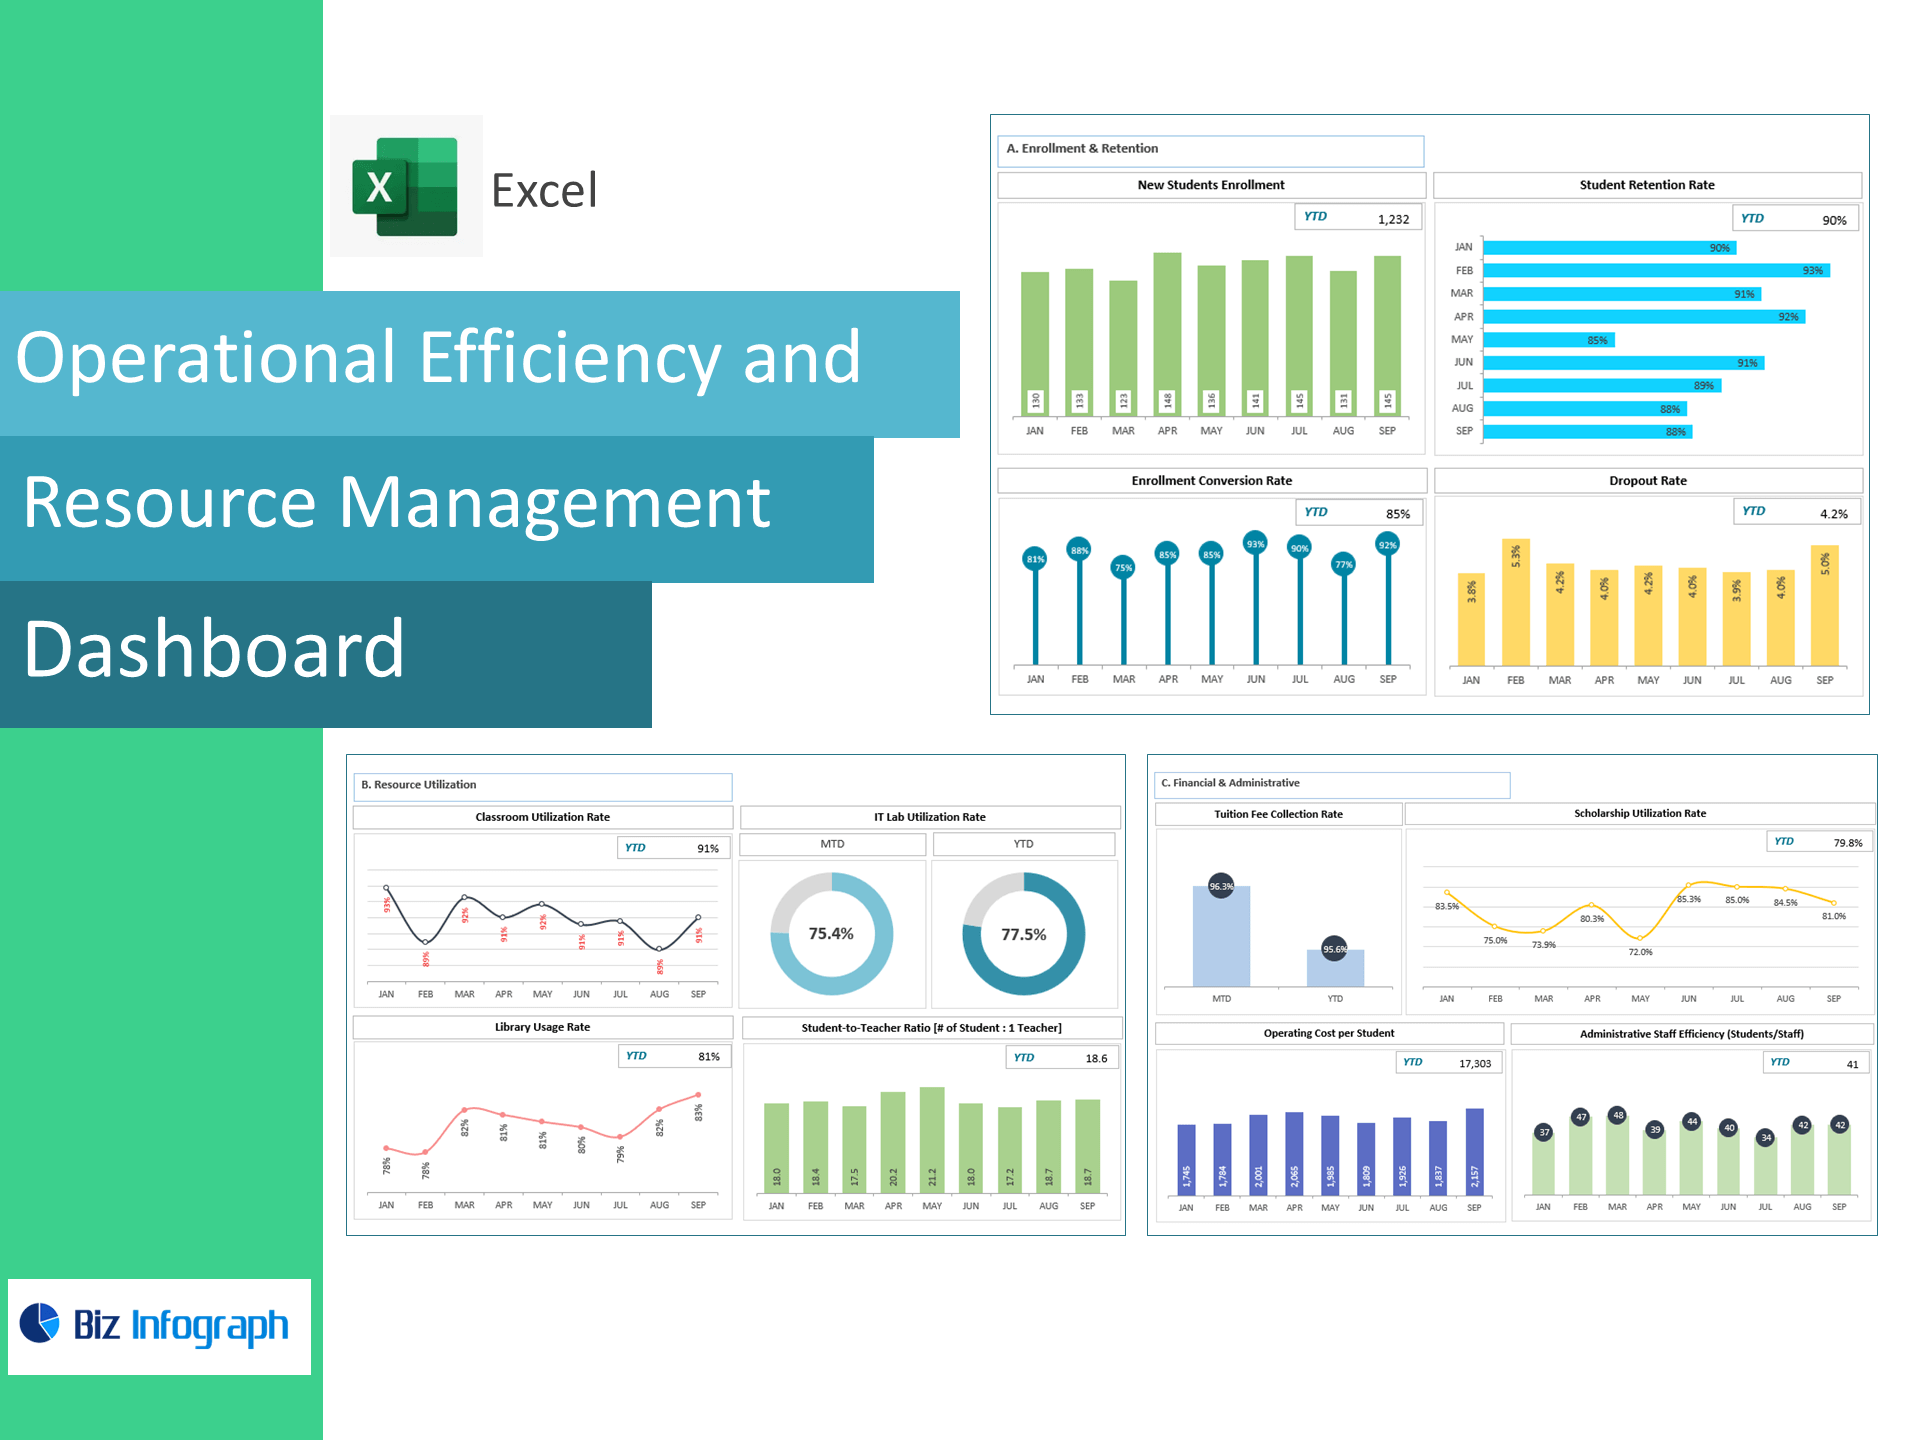
The Education Dashboard Package is a comprehensive Excel-based solution designed for schools, colleges, and universities to monitor and improve academic and operational performance. This package features four specialized dashboards: Academic Performance and Student Engagement, Operational Efficiency and Resource Management, Finance, and Human Resource dashboards. It helps educators and administrators track critical KPIs such as student attendance, academic outcomes, budget utilization, and faculty performance—all in one visual, interactive interface. By offering a clear view of data trends and resource allocation, the dashboard supports data-driven decisions that enhance student success, optimize operations, and align educational strategies with institutional goals.
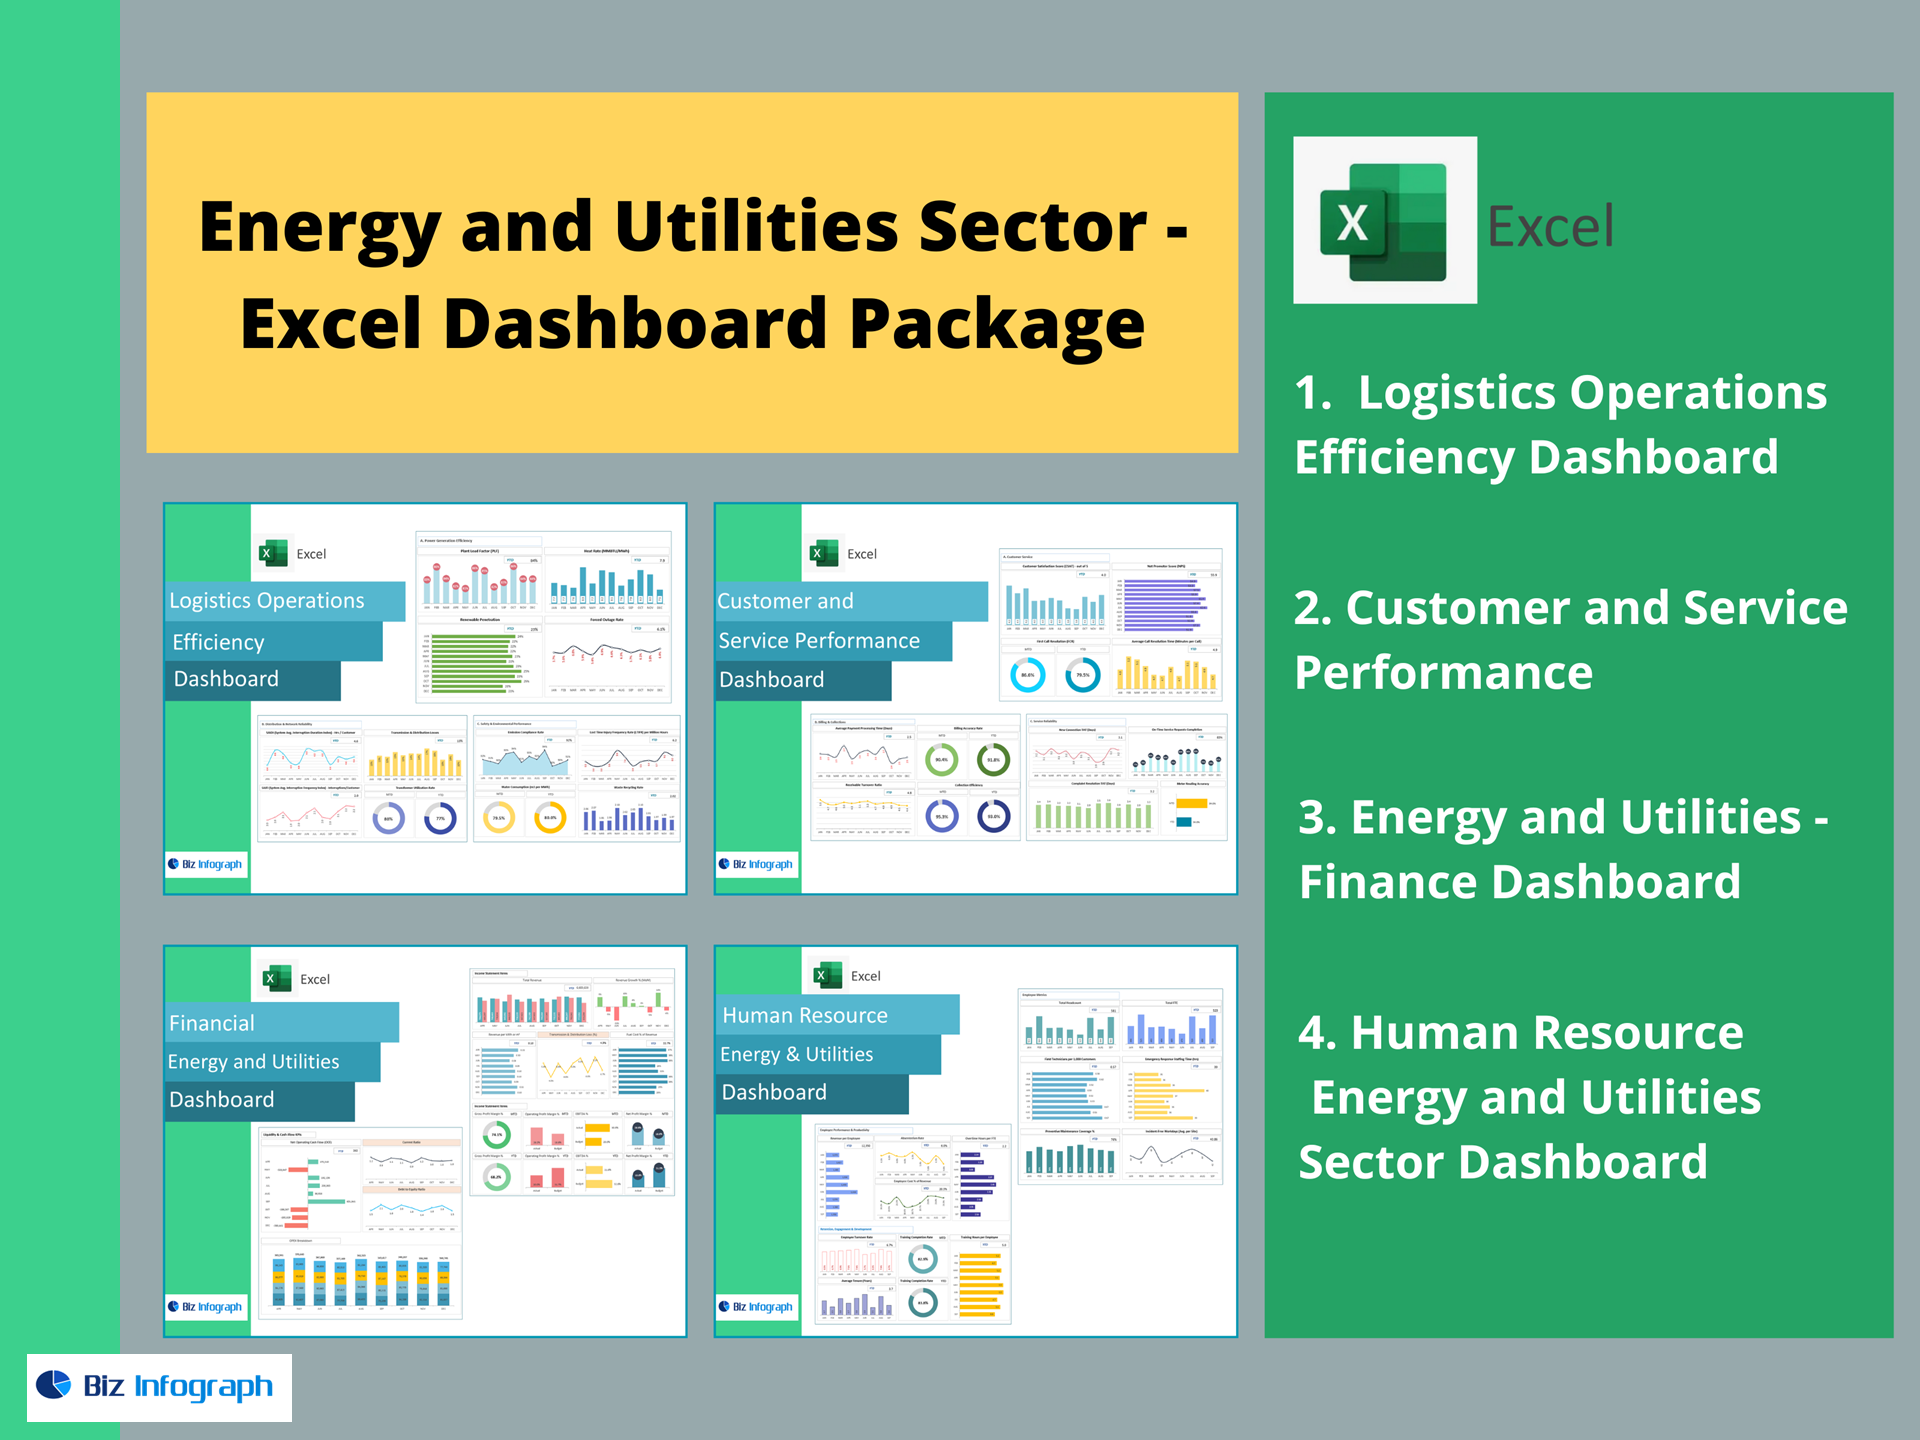
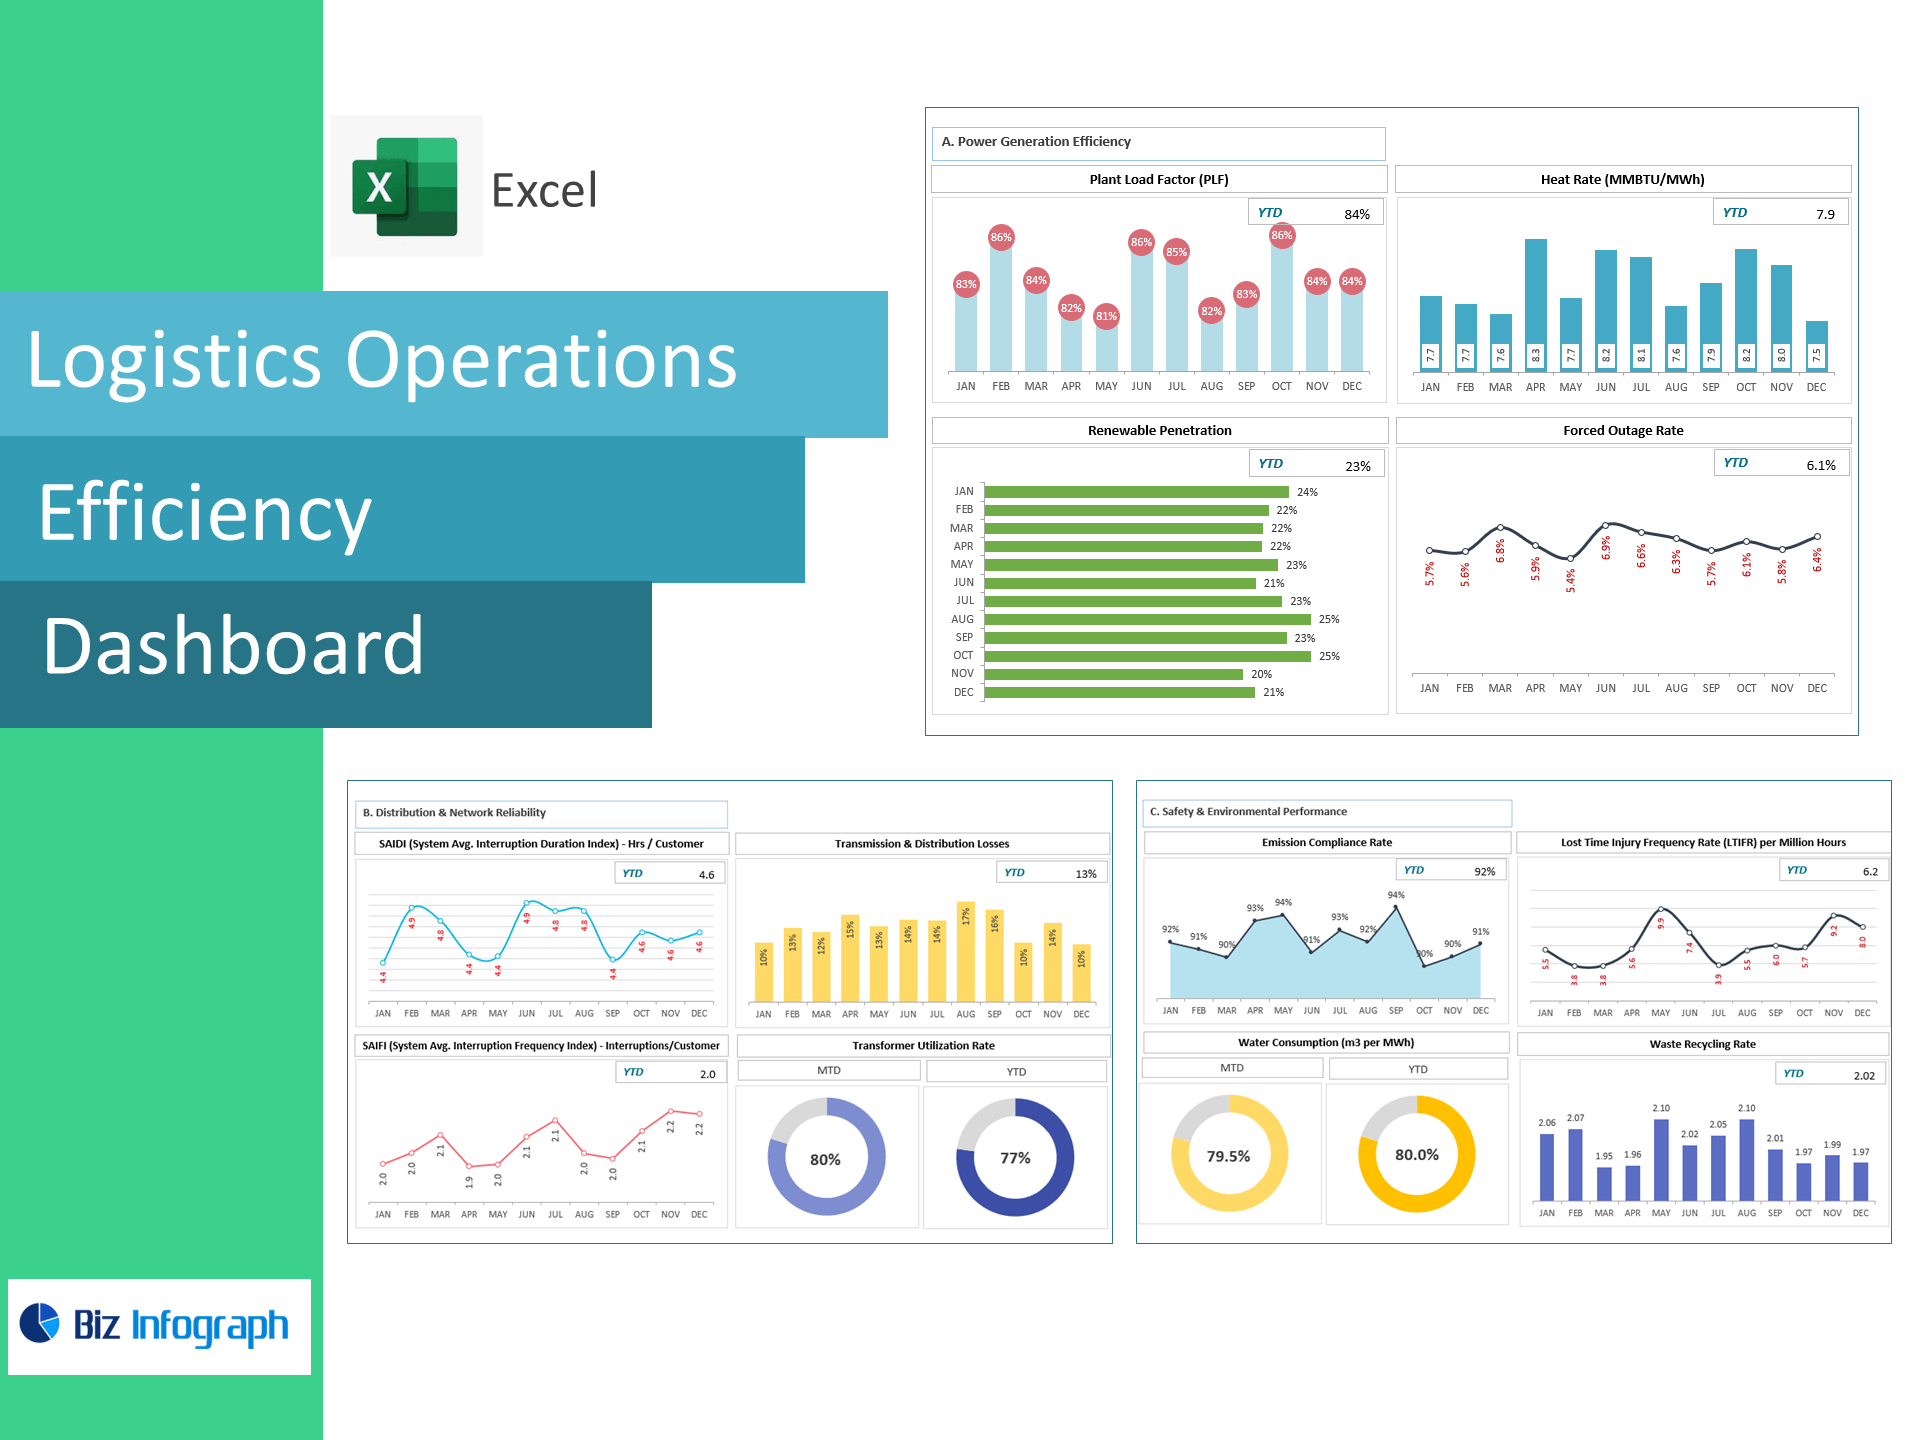
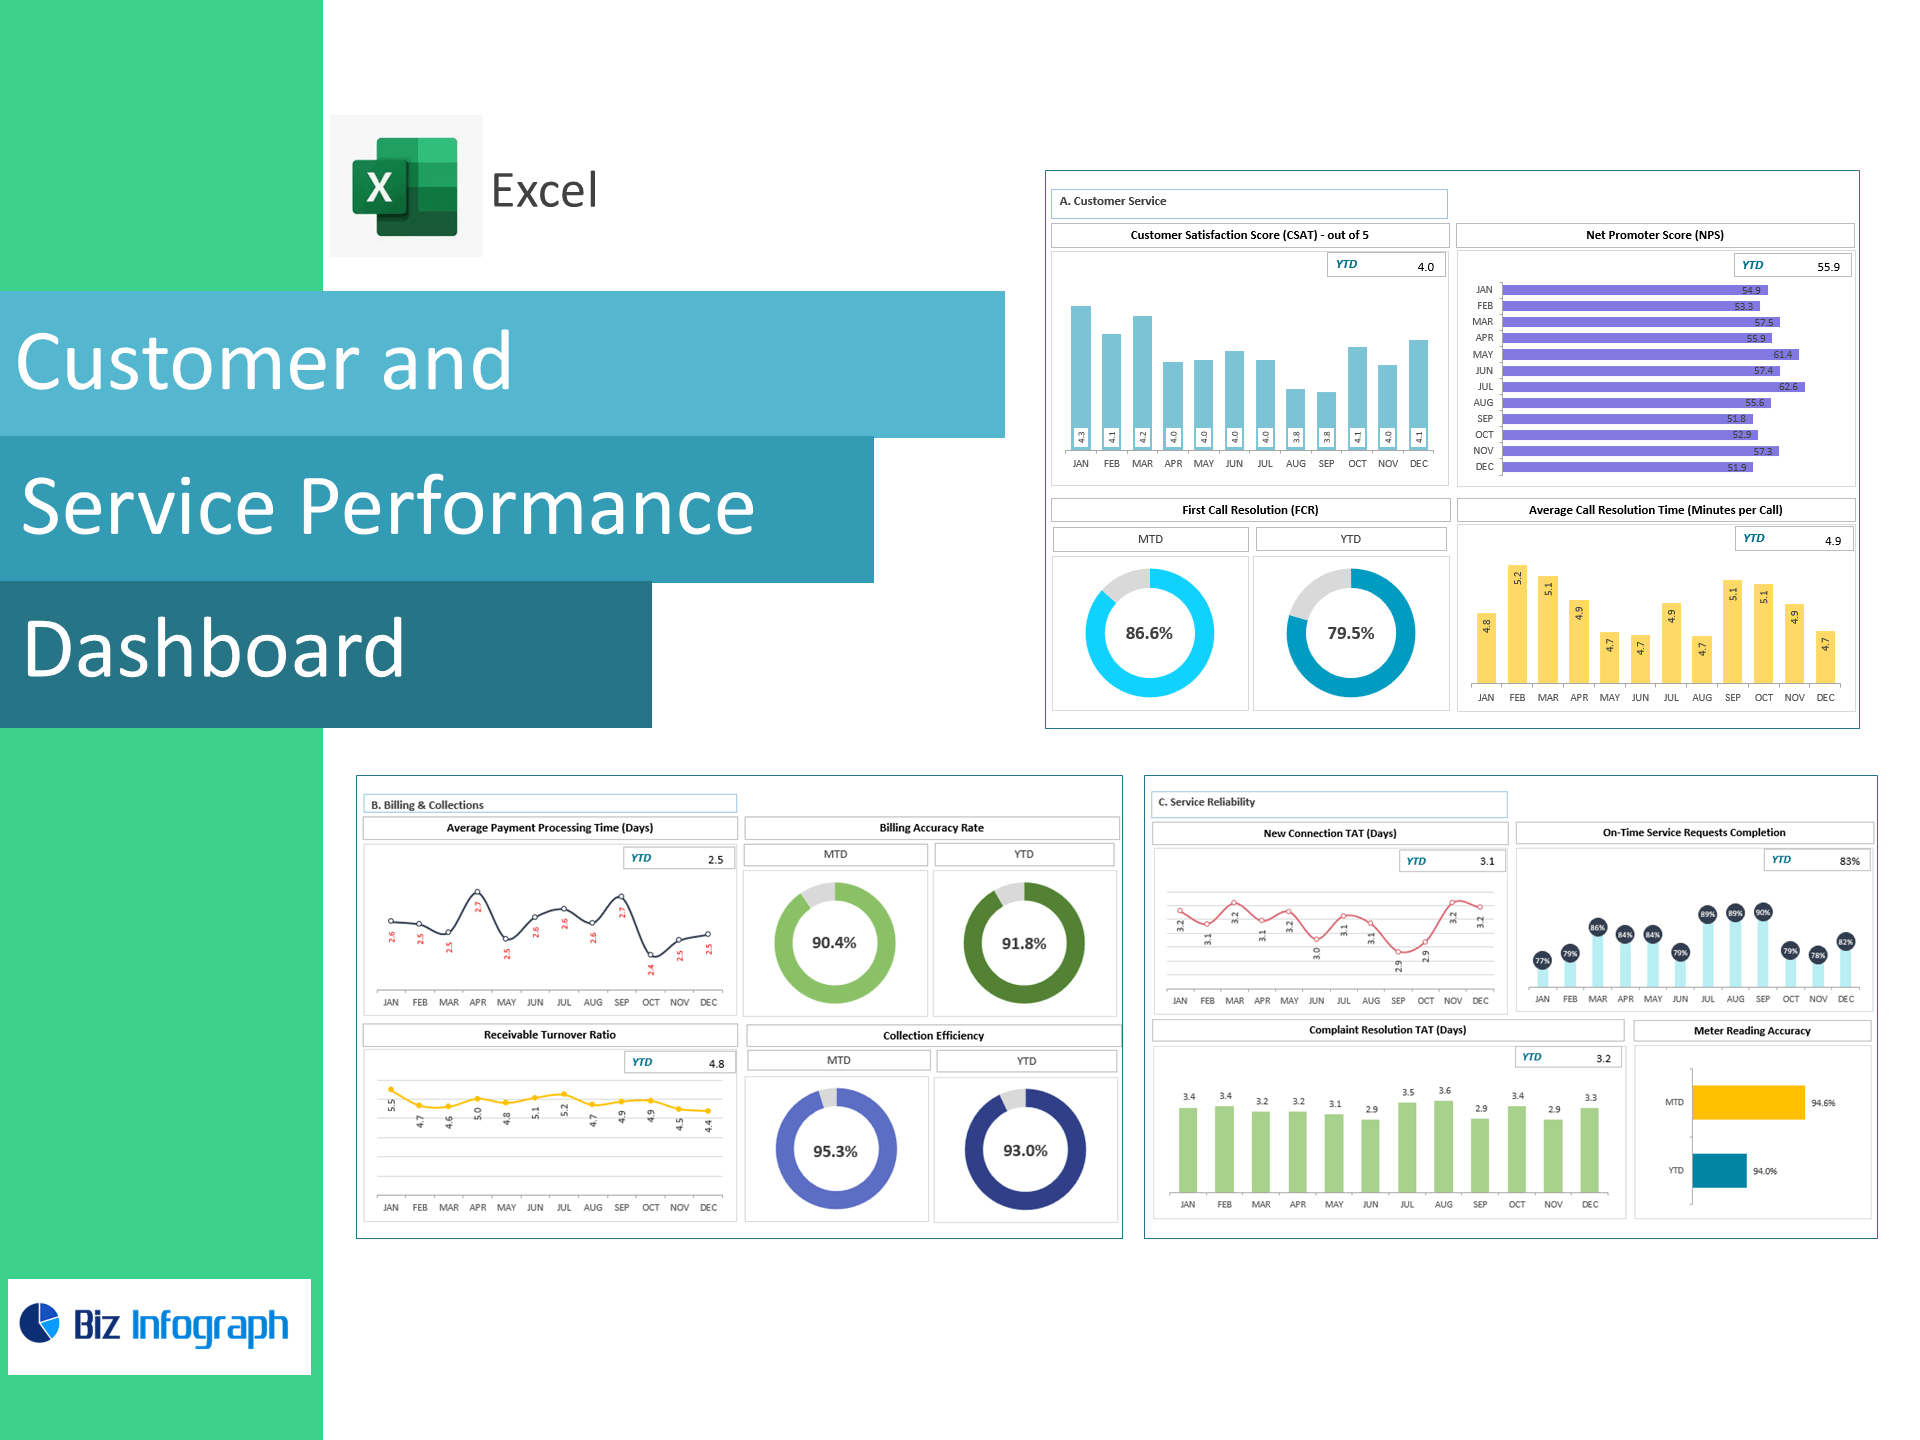
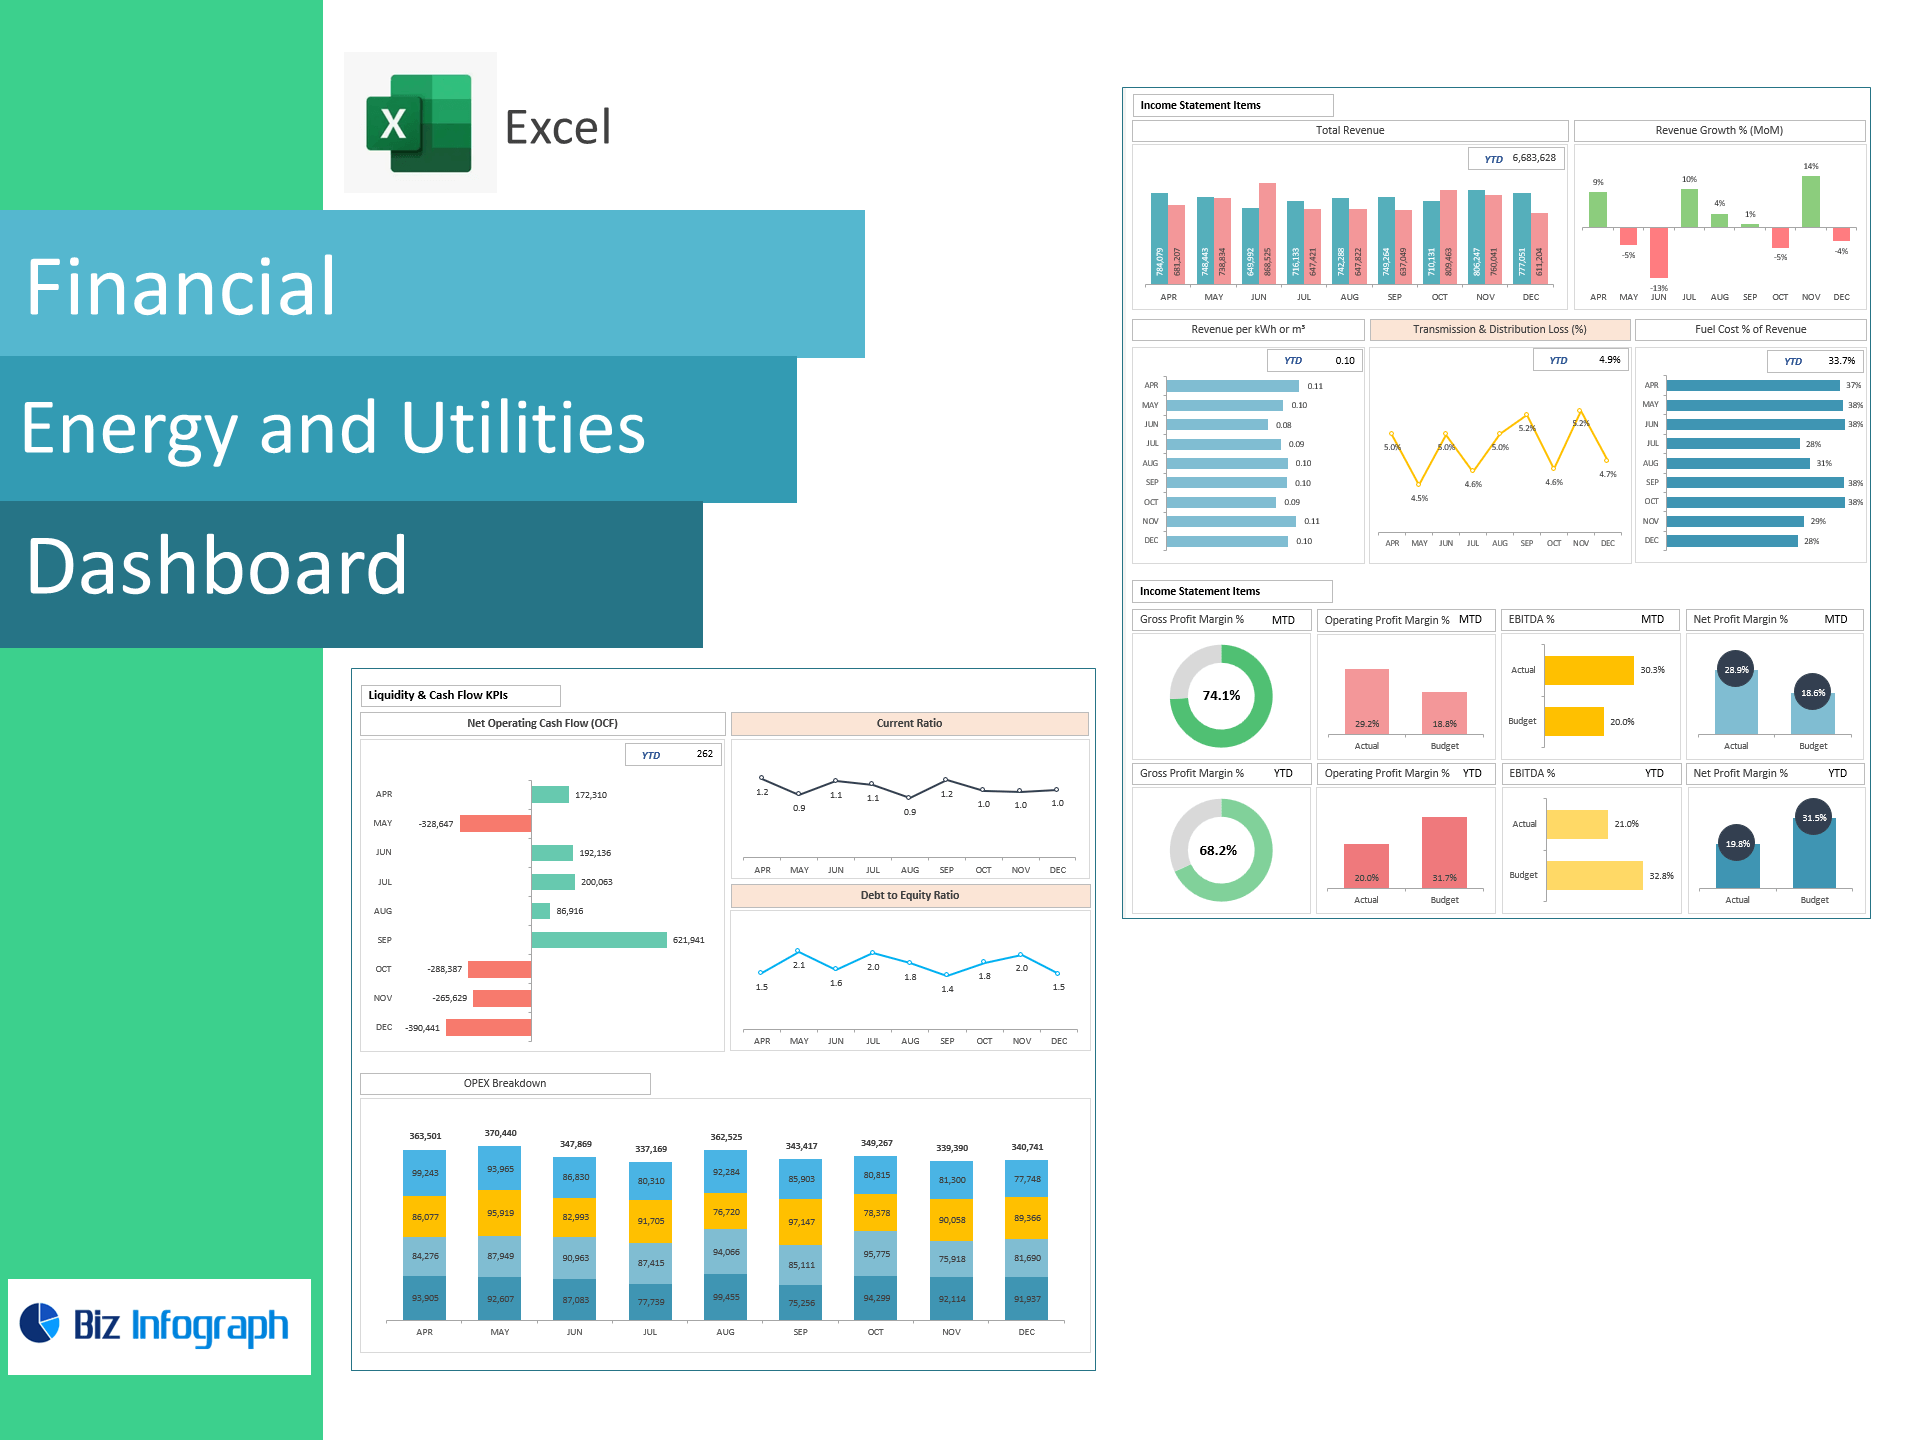
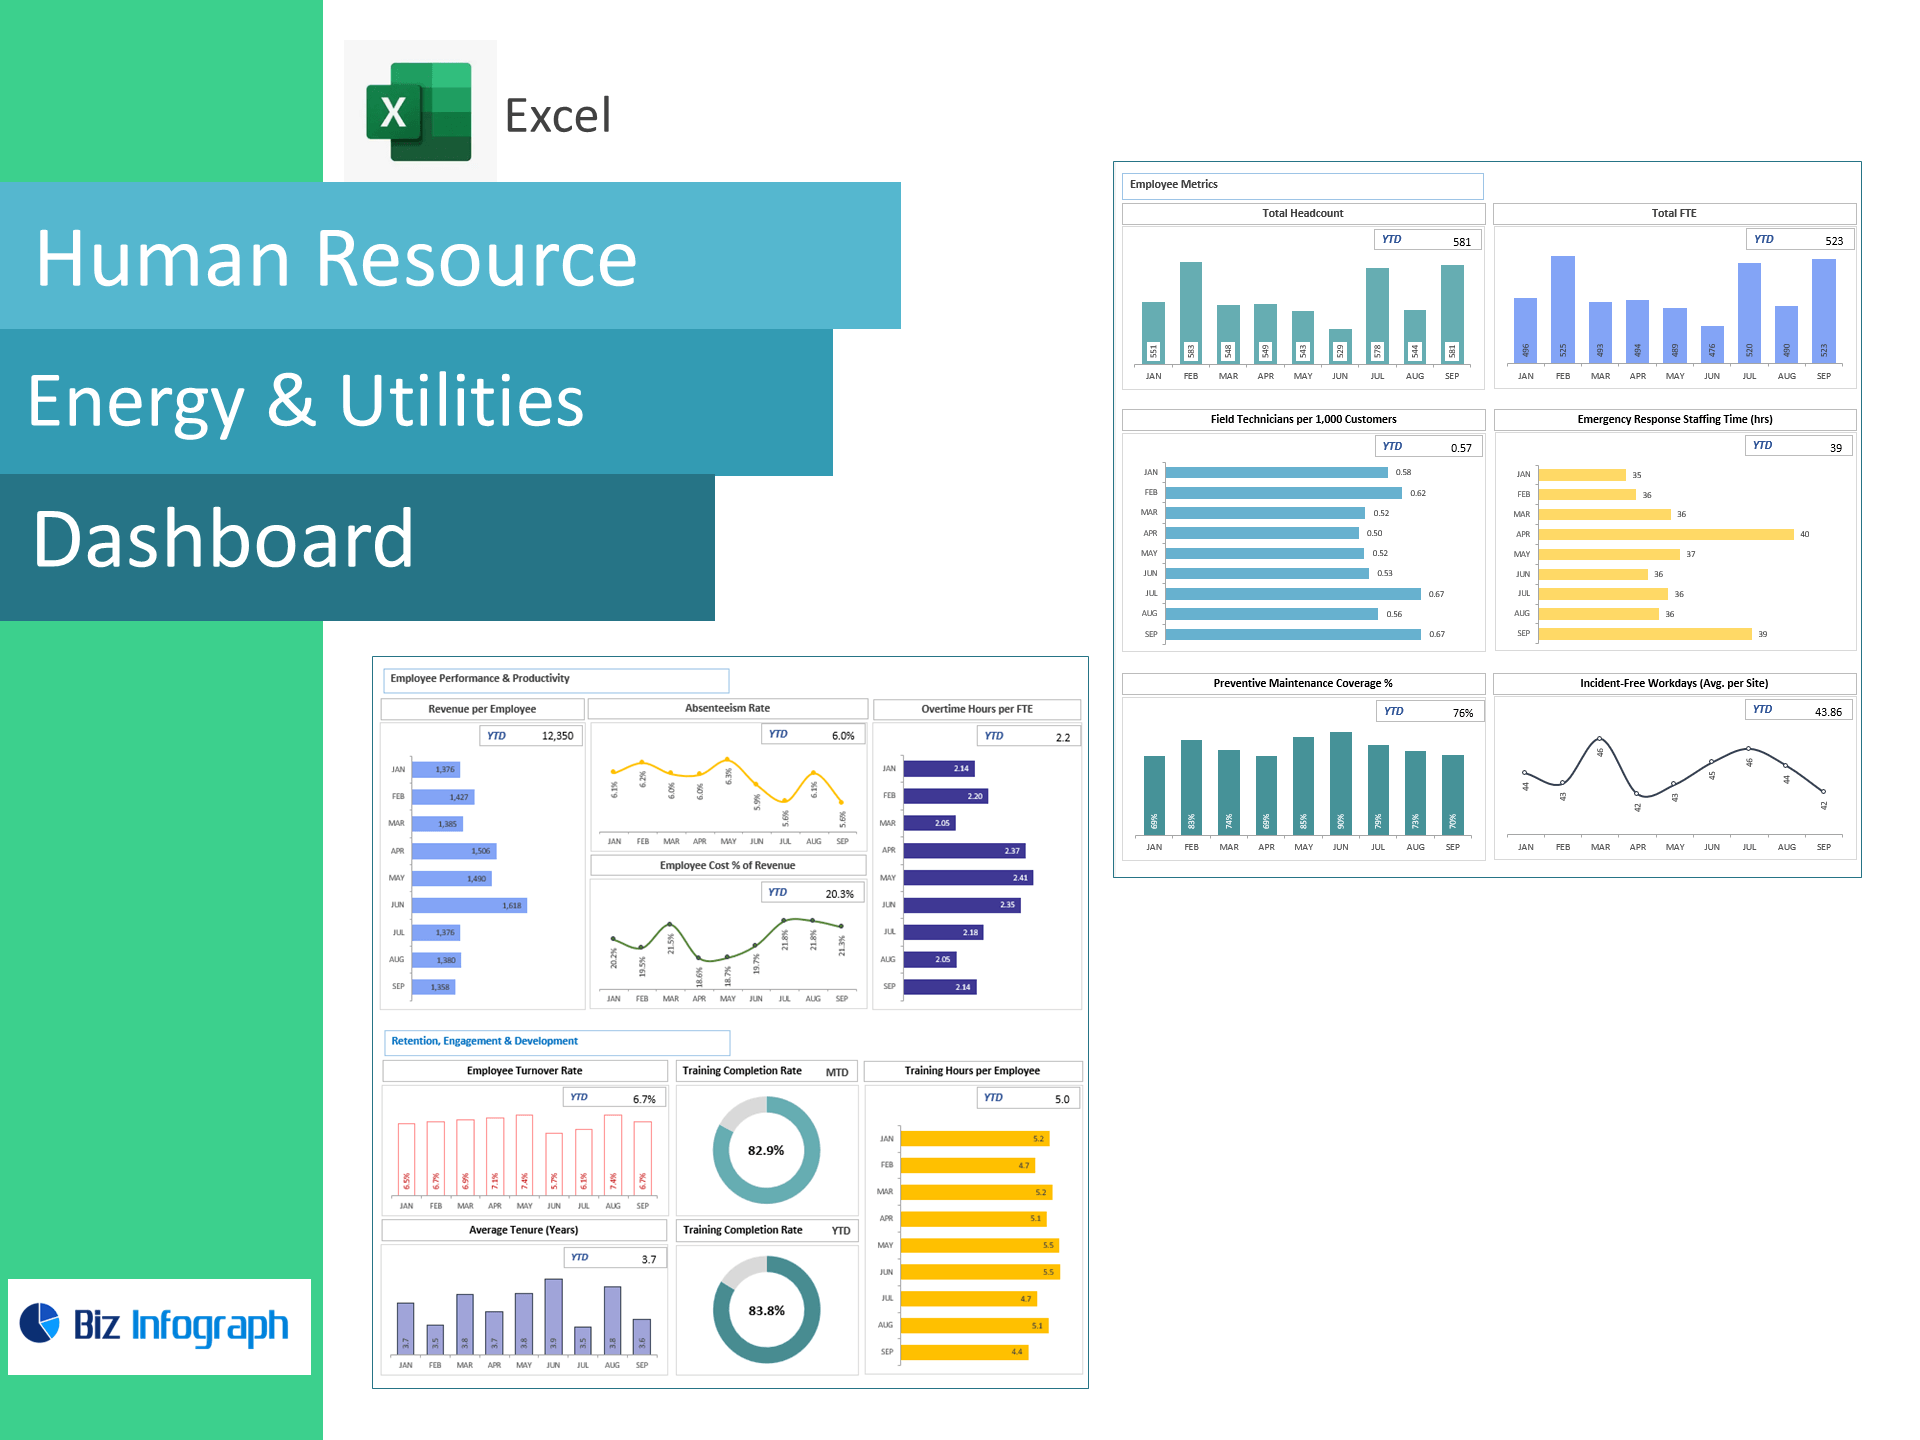
The Energy & Utilities Dashboard Package is an all-in-one Excel solution tailored for monitoring logistics operations, customer service, financial health, and workforce performance within the energy and utilities sector. This package includes four dynamic dashboards: Logistics Operations Efficiency, Customer and Service Performance, Energy & Utilities Finance, and Human Resource Management. With intuitive visuals and real-time metrics, this dashboard helps industry professionals track consumption trends, service quality, cost control, and employee productivity. Whether you're managing energy distribution, utility services, or internal operations, this tool empowers teams to optimize efficiency, reduce operational risks, and make informed, data-driven decisions to meet evolving industry demands.
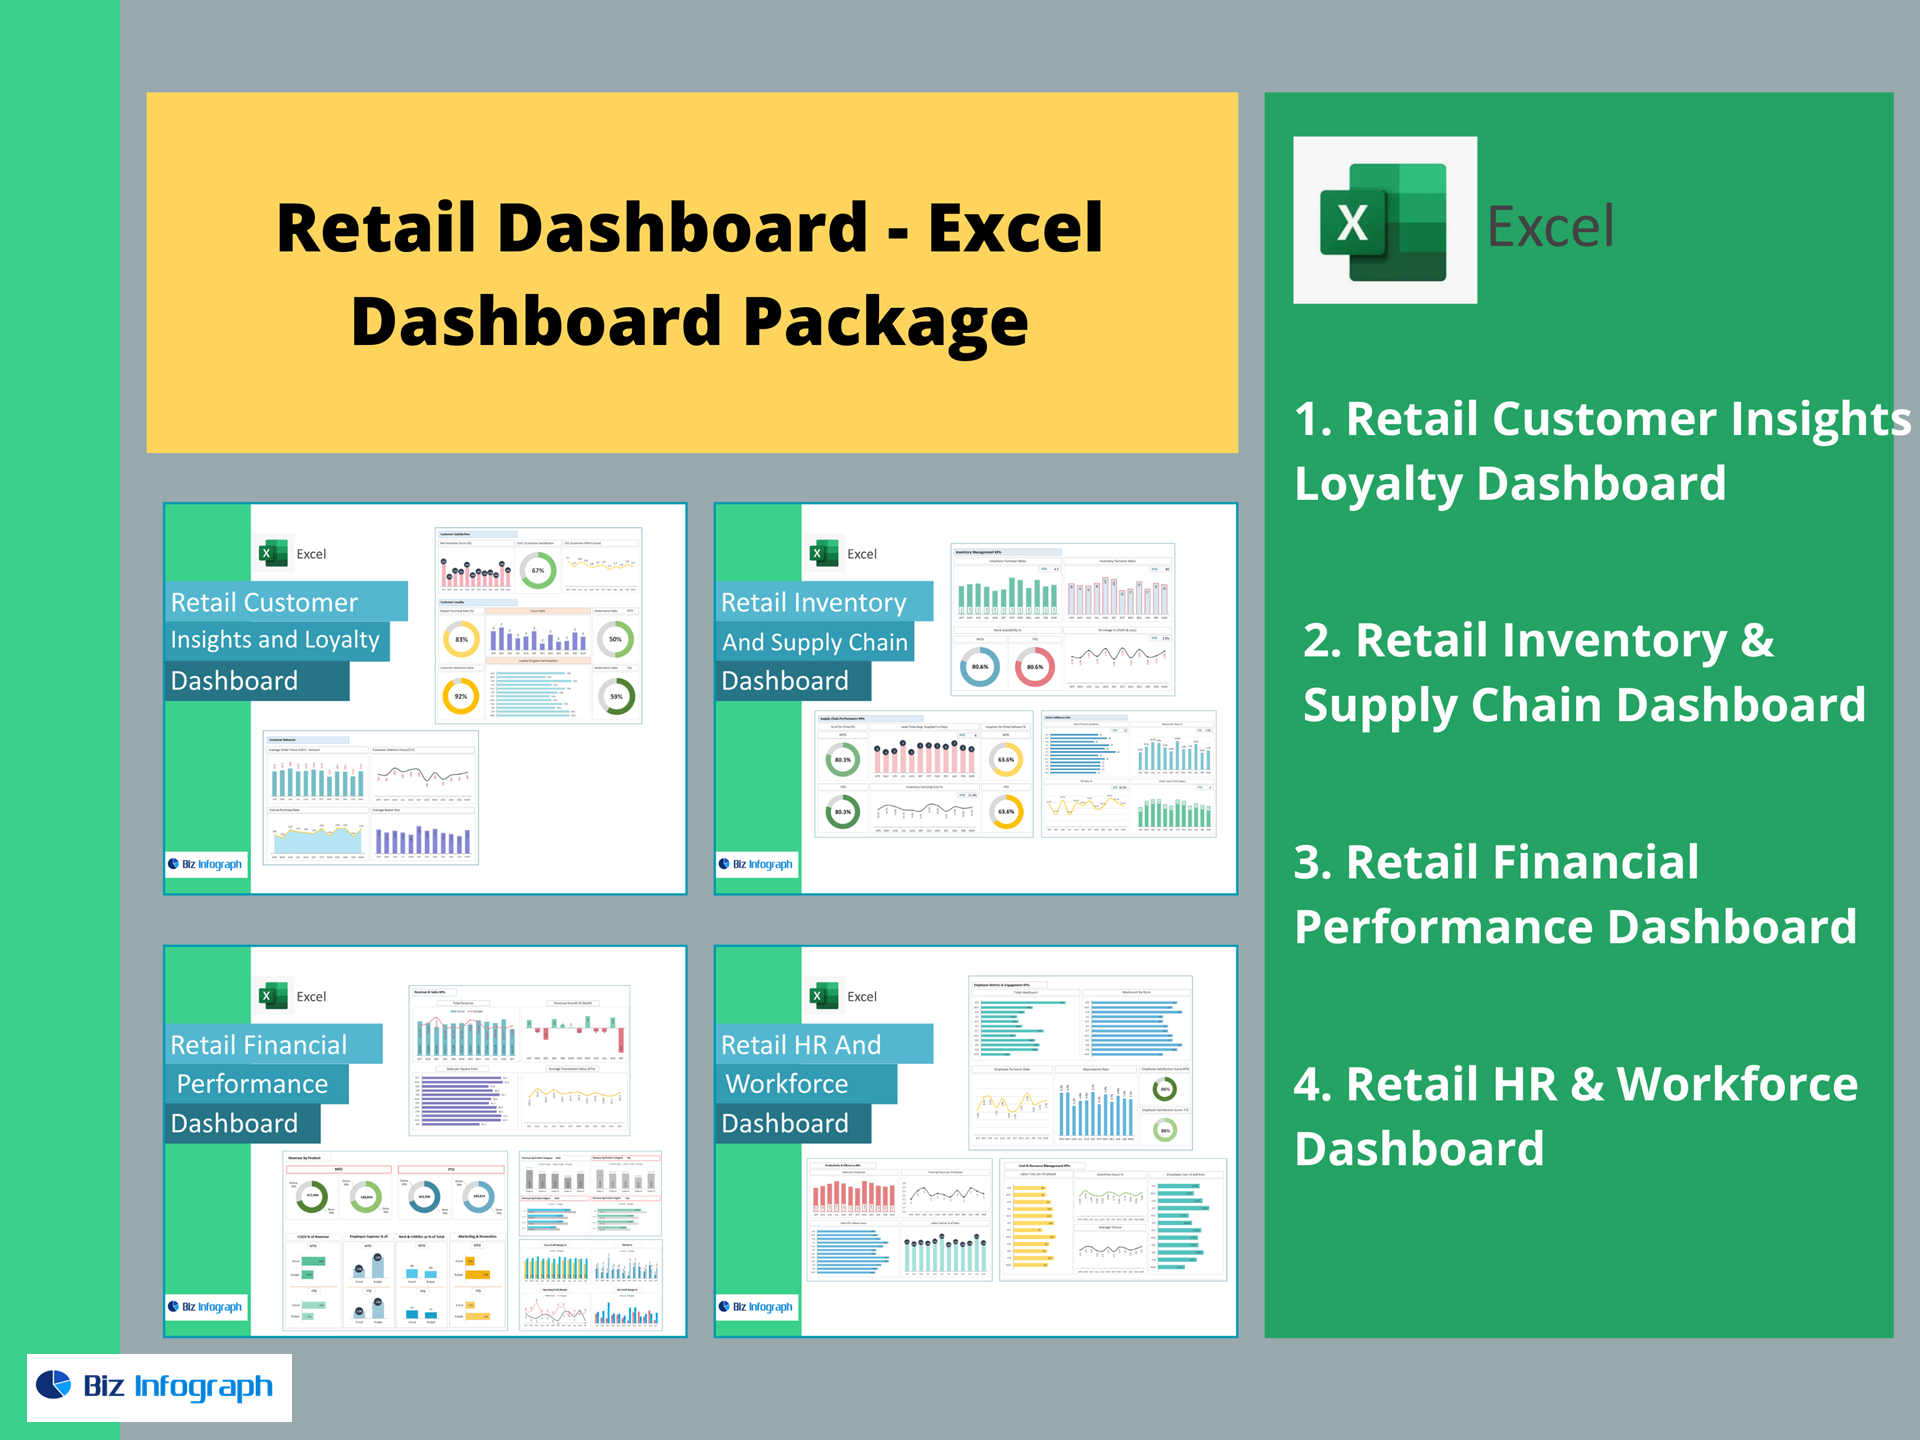
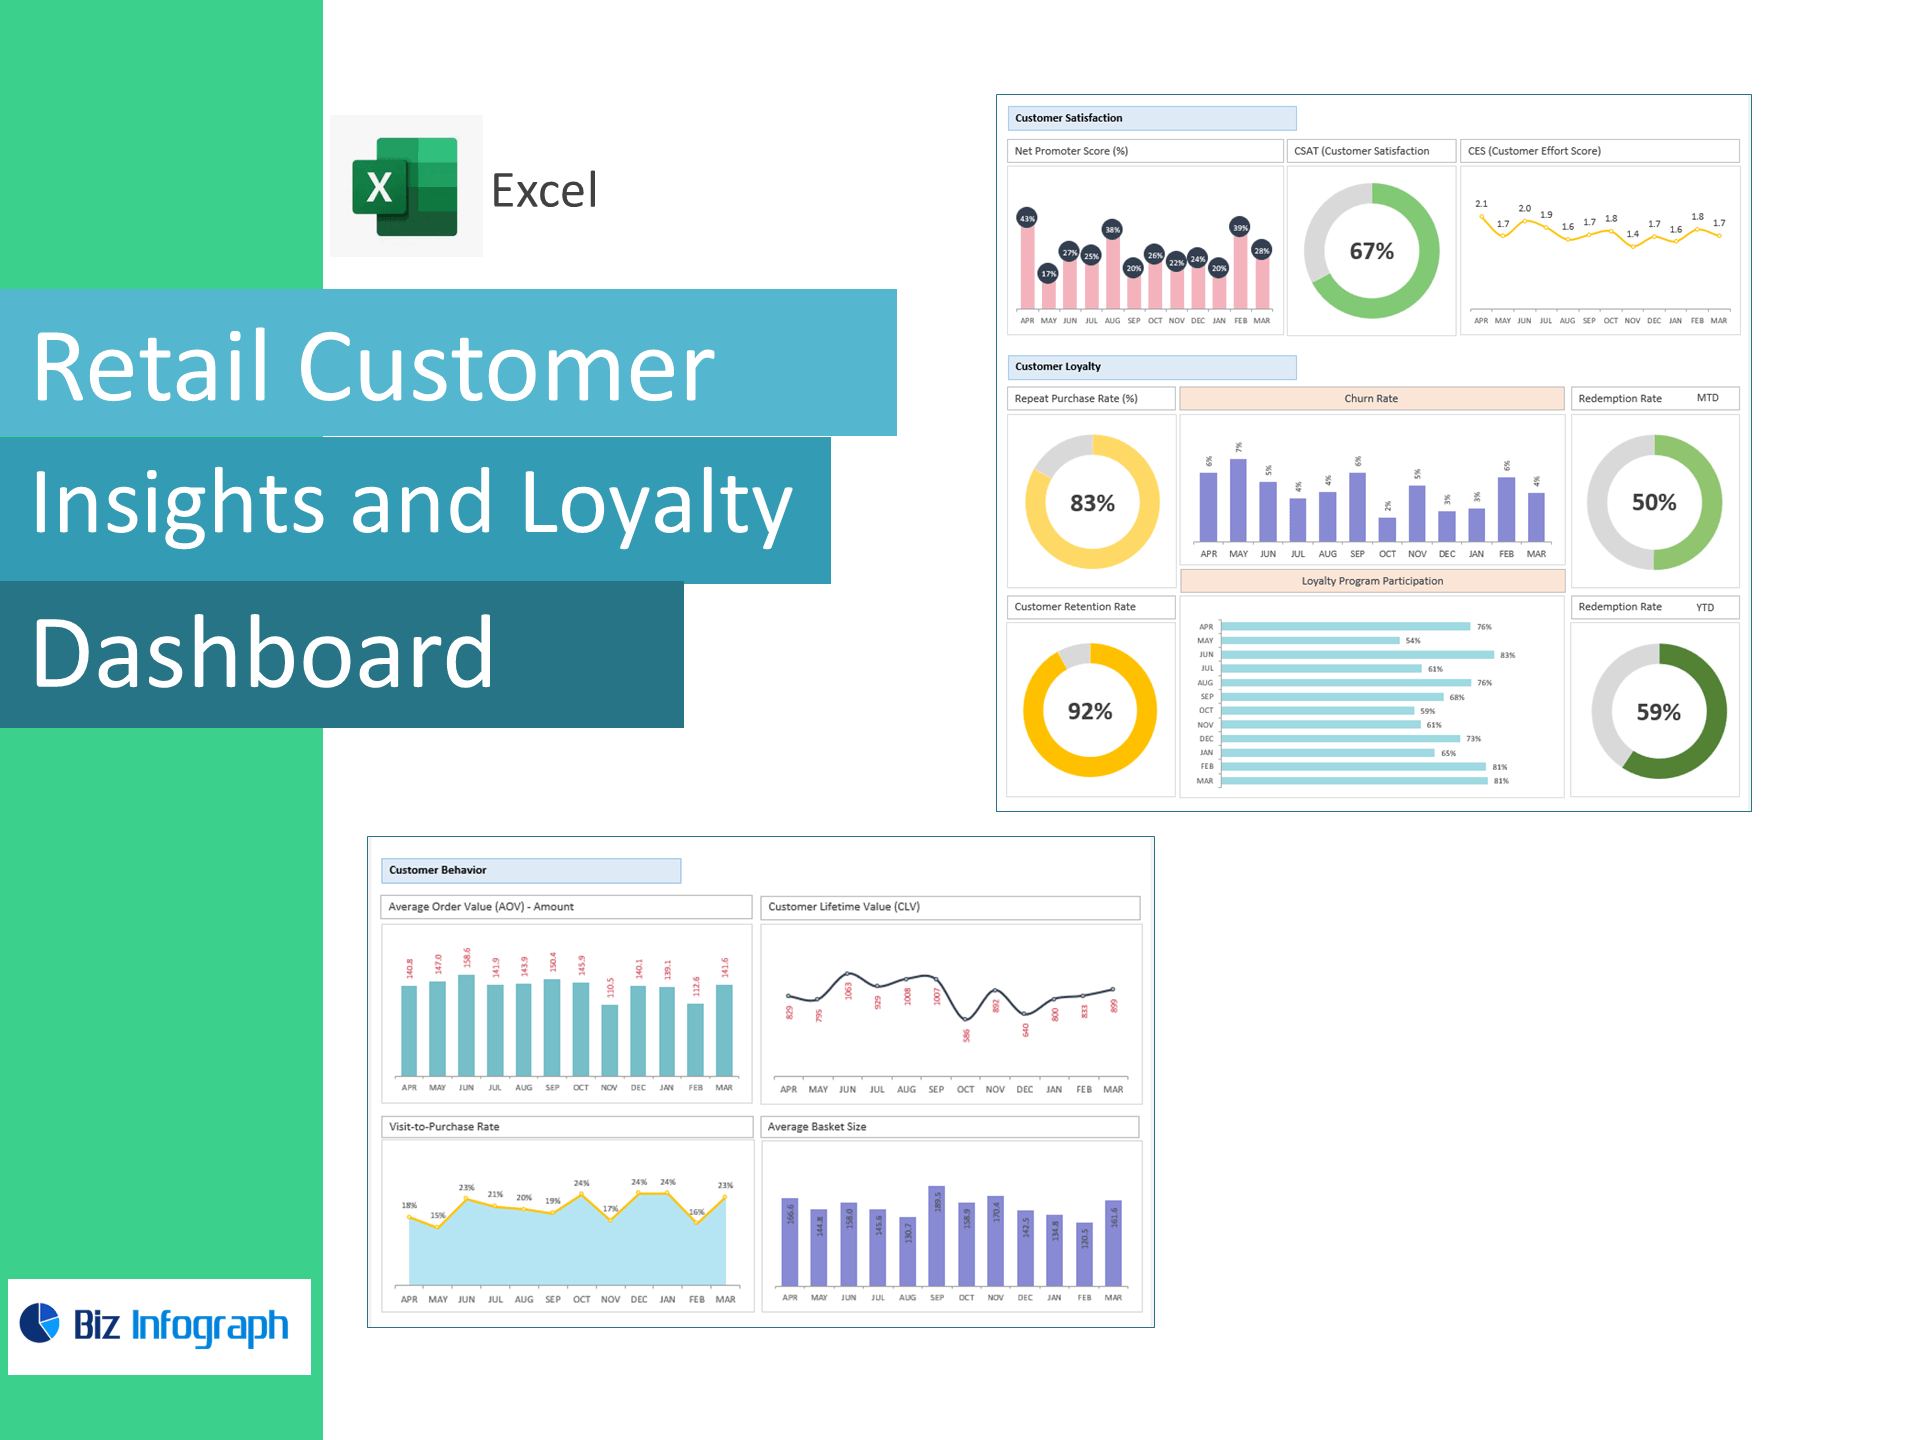
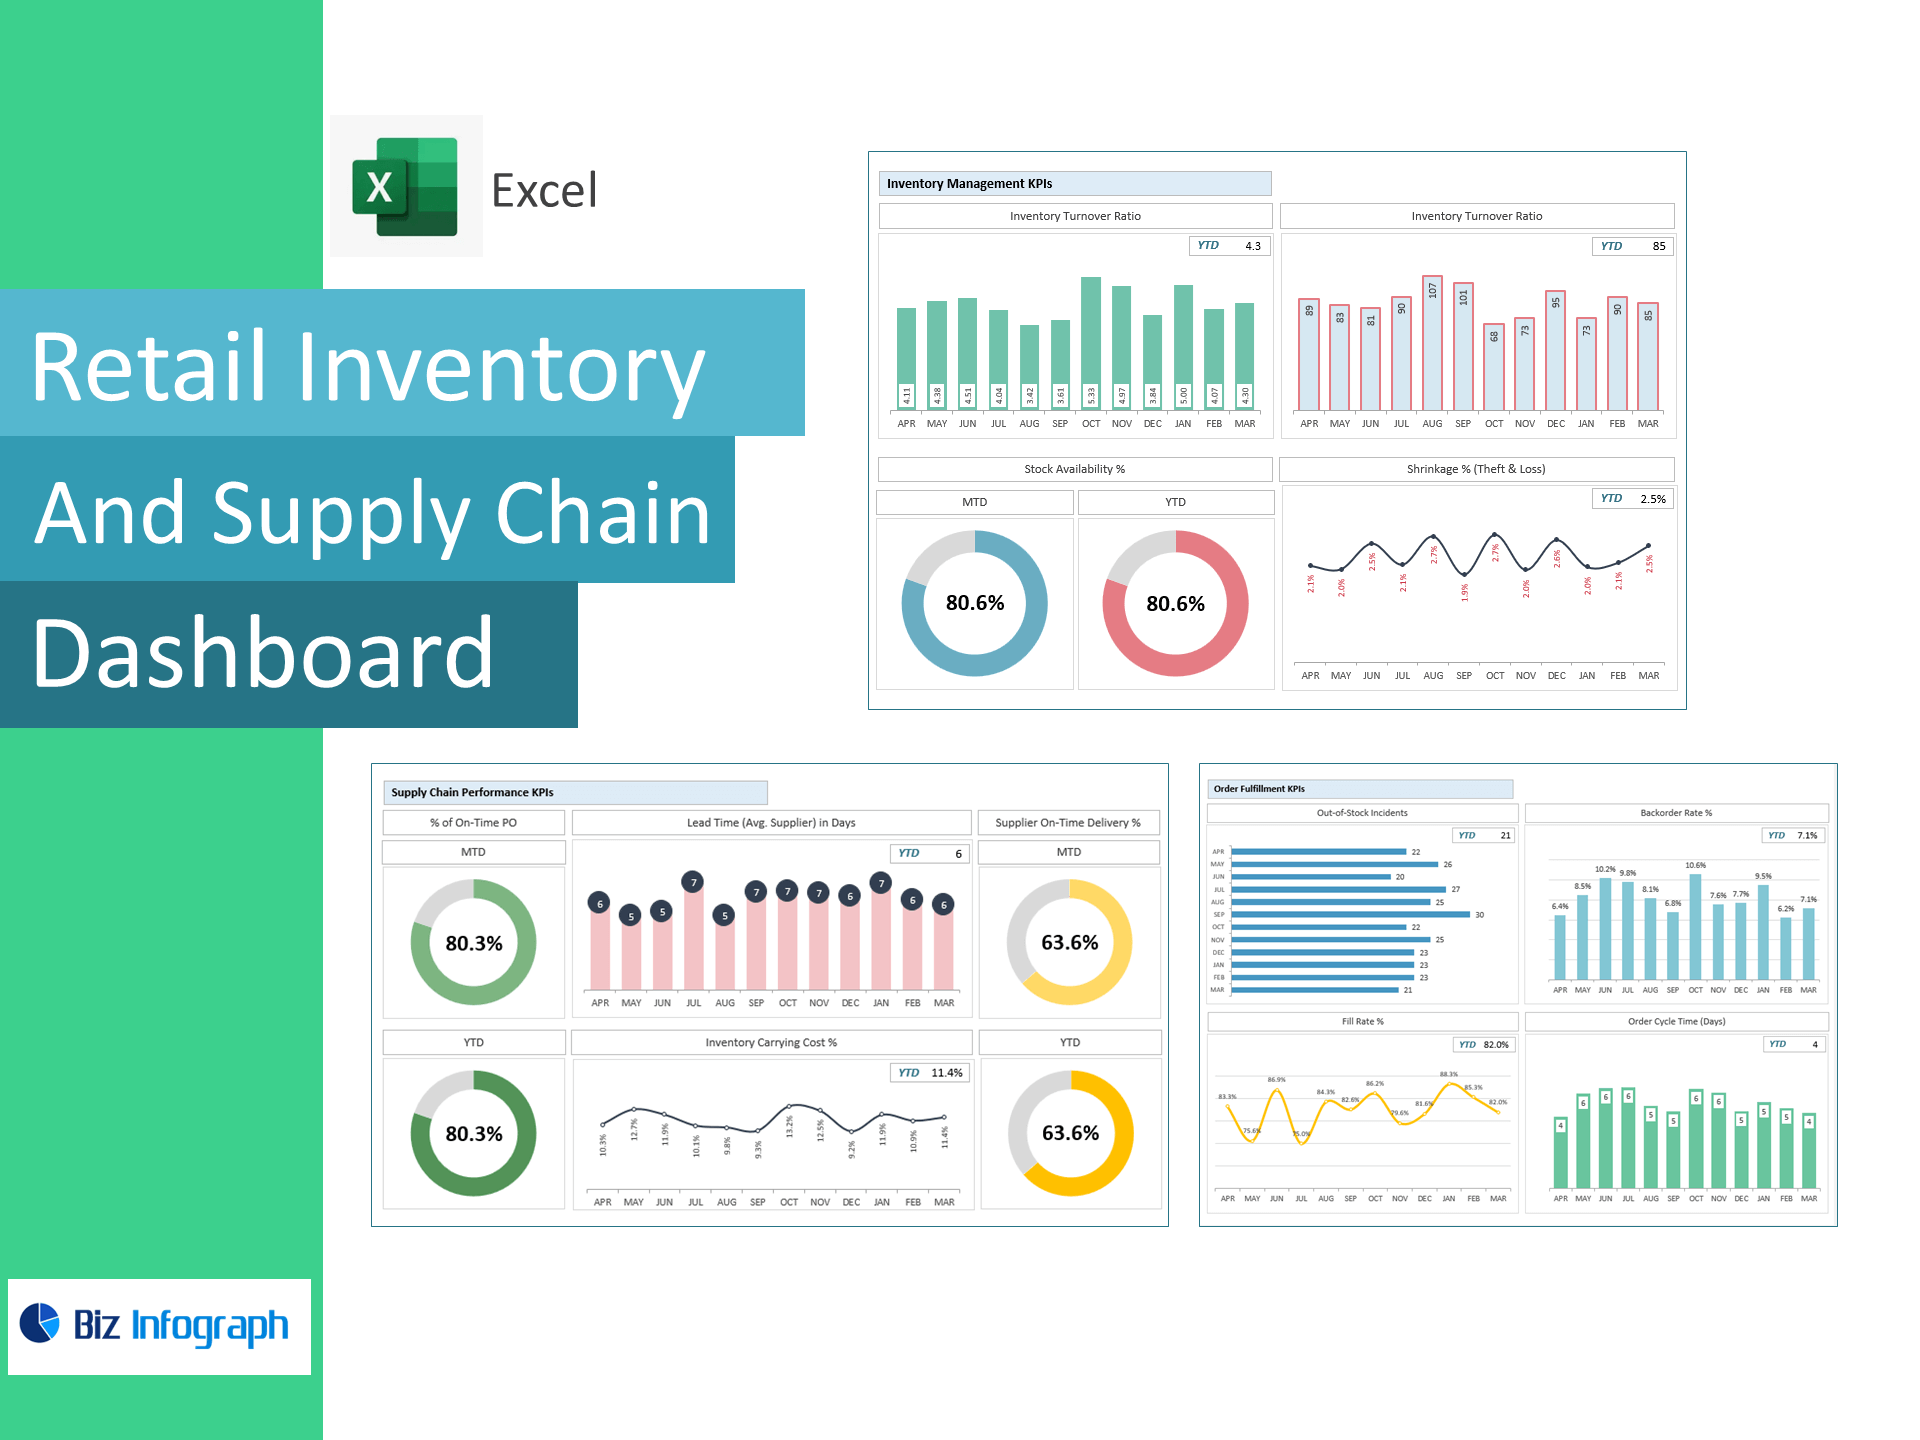
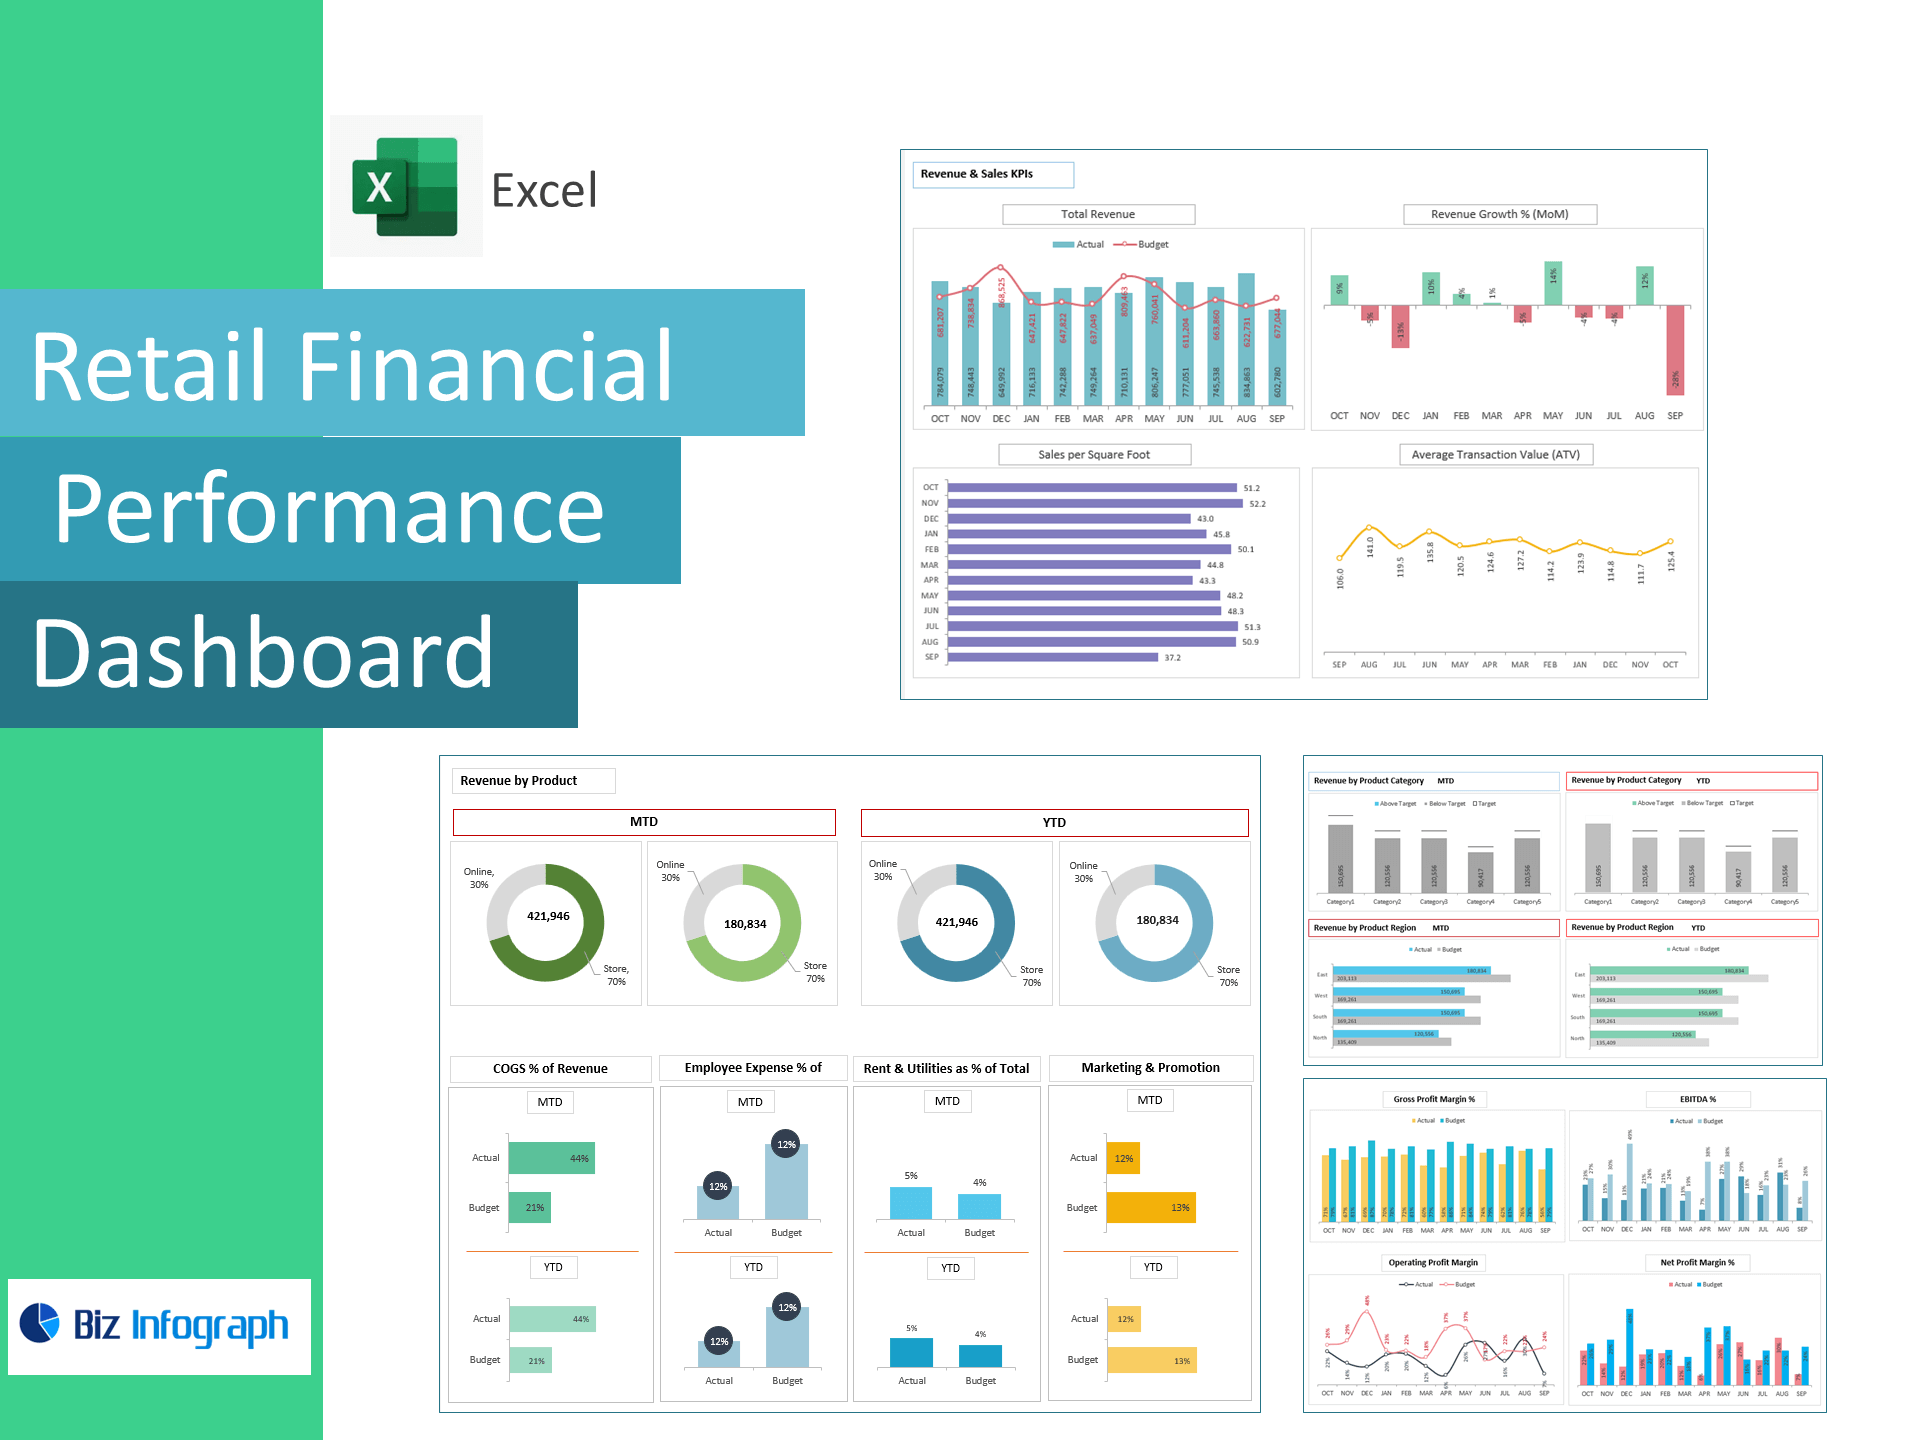
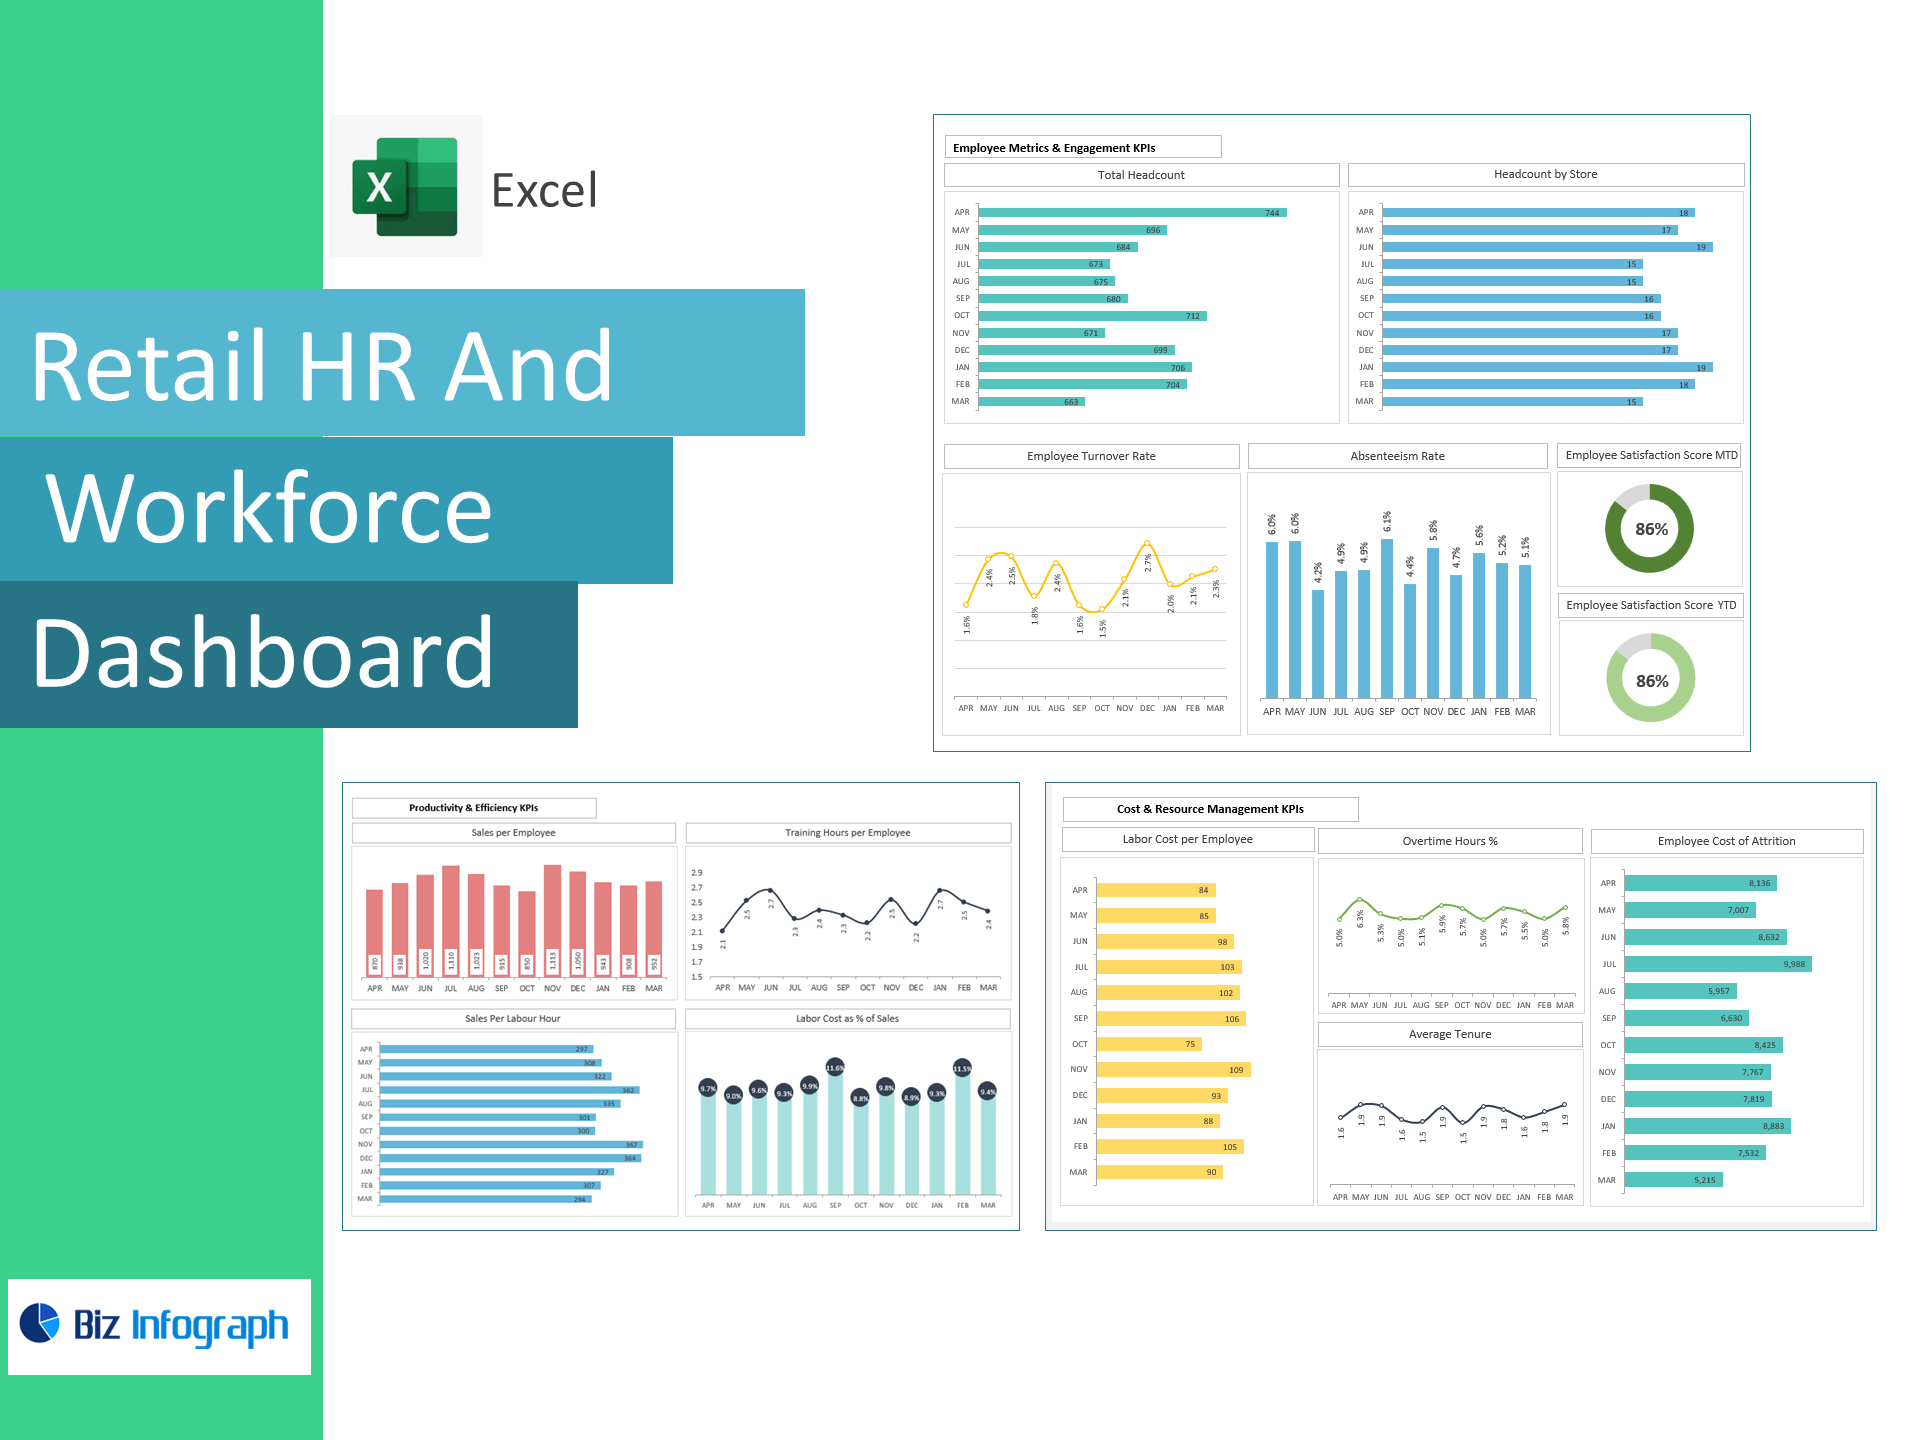
The Retail Dashboard Package is a powerful Excel-based toolkit designed to help retailers gain complete visibility across customer engagement, inventory, finance, and workforce performance. This package includes four essential dashboards: Retail Customer Insights & Loyalty, Retail Inventory & Supply Chain, Retail Financial Performance, and Retail HR & Workforce. Each dashboard delivers real-time, data-driven insights through interactive charts and KPIs, enabling retail managers and decision-makers to track customer behavior, streamline inventory processes, monitor sales and profit margins, and optimize workforce productivity. Ideal for store owners, chain operators, and retail analysts, this package empowers businesses to make faster, smarter, and more strategic decisions.
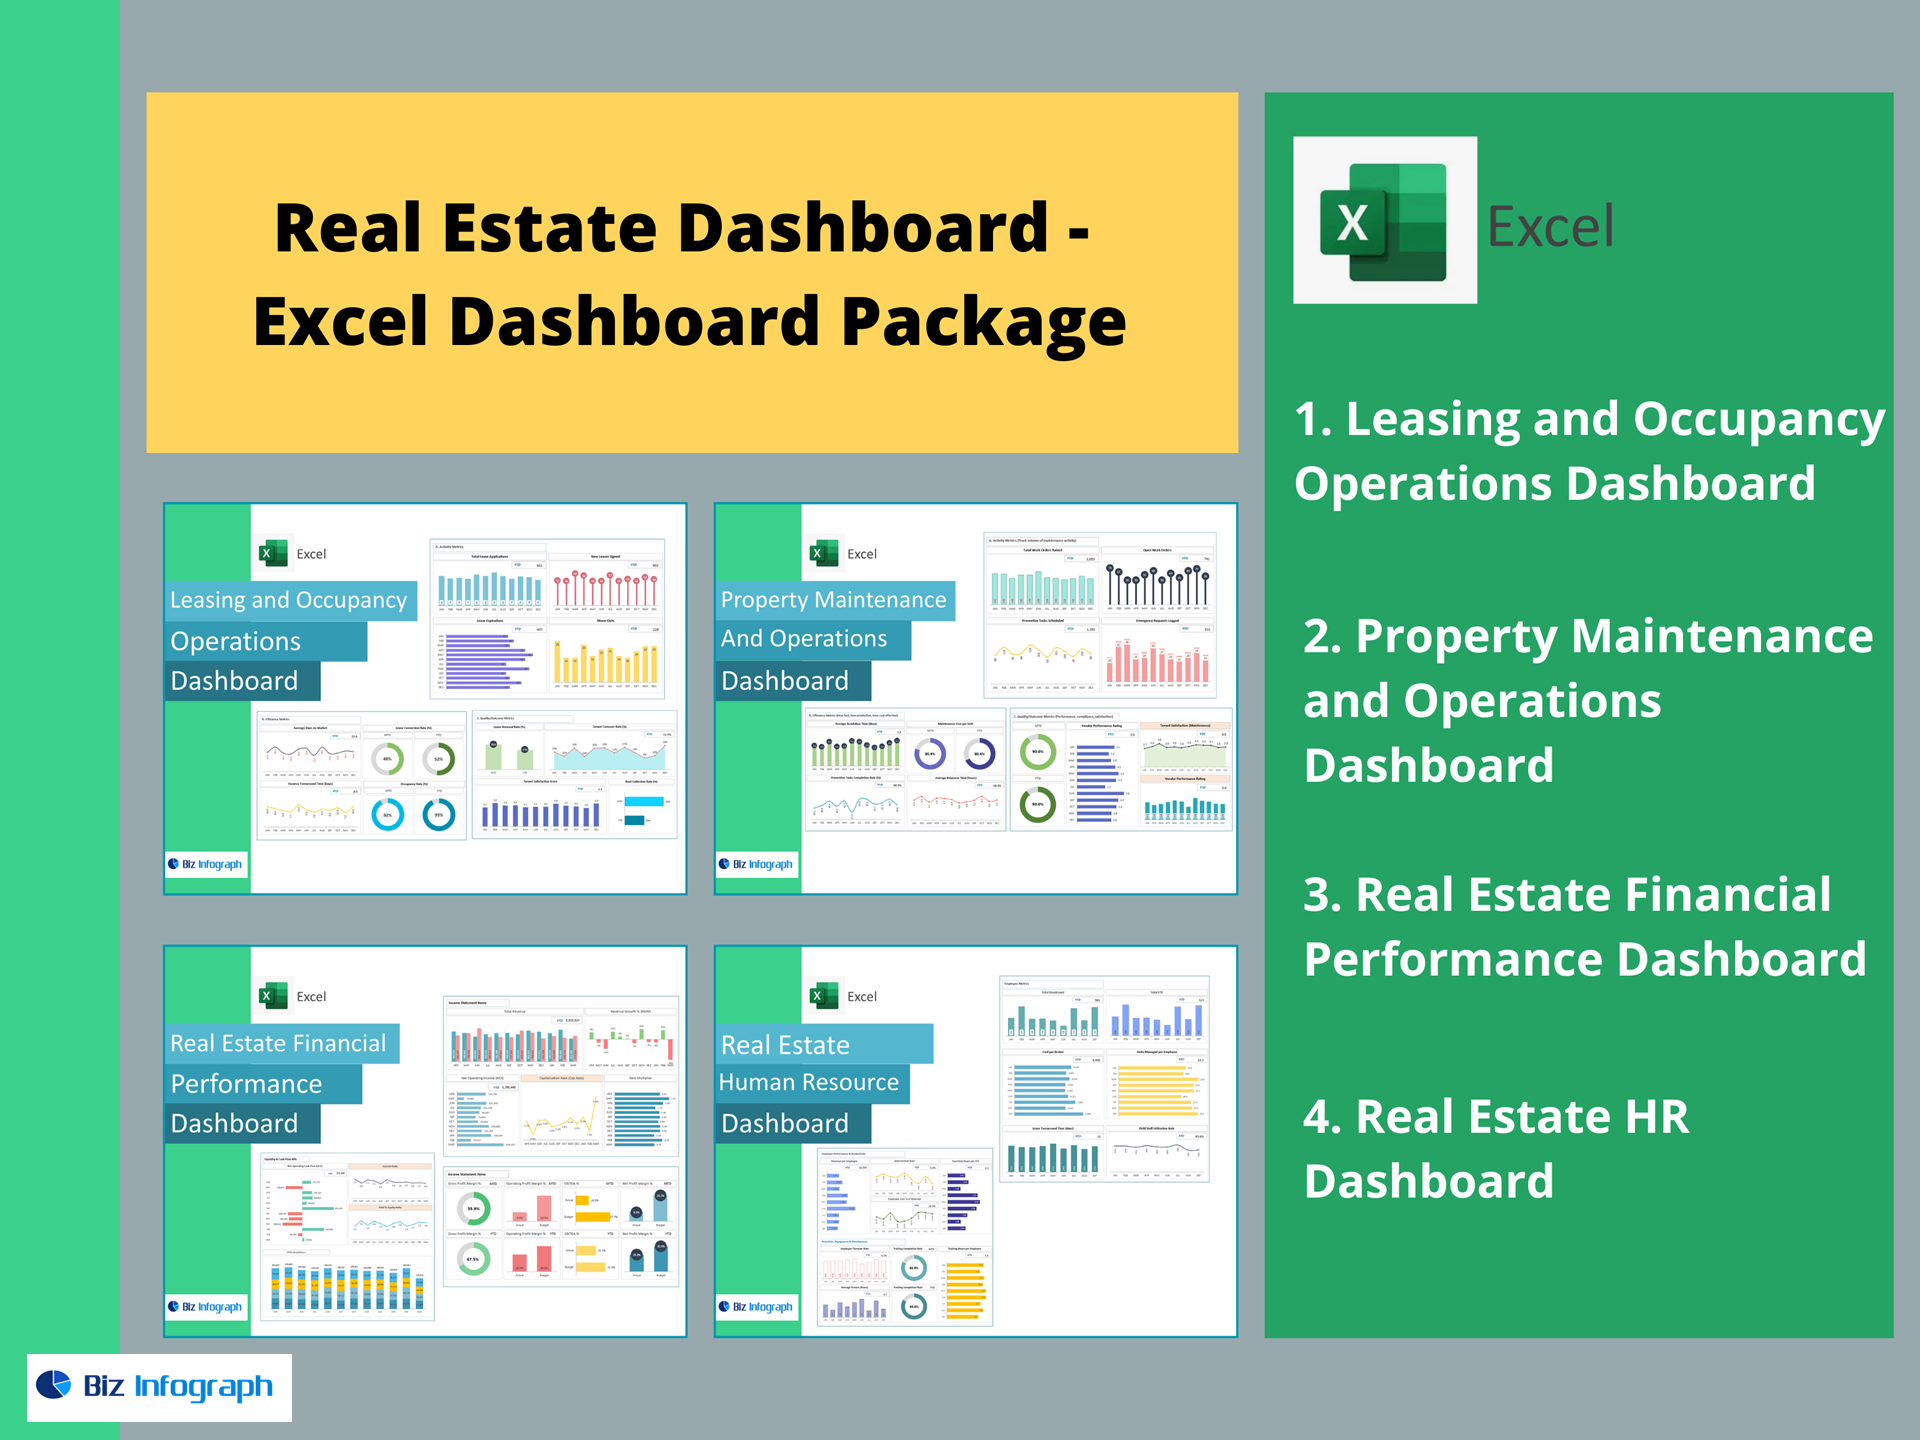
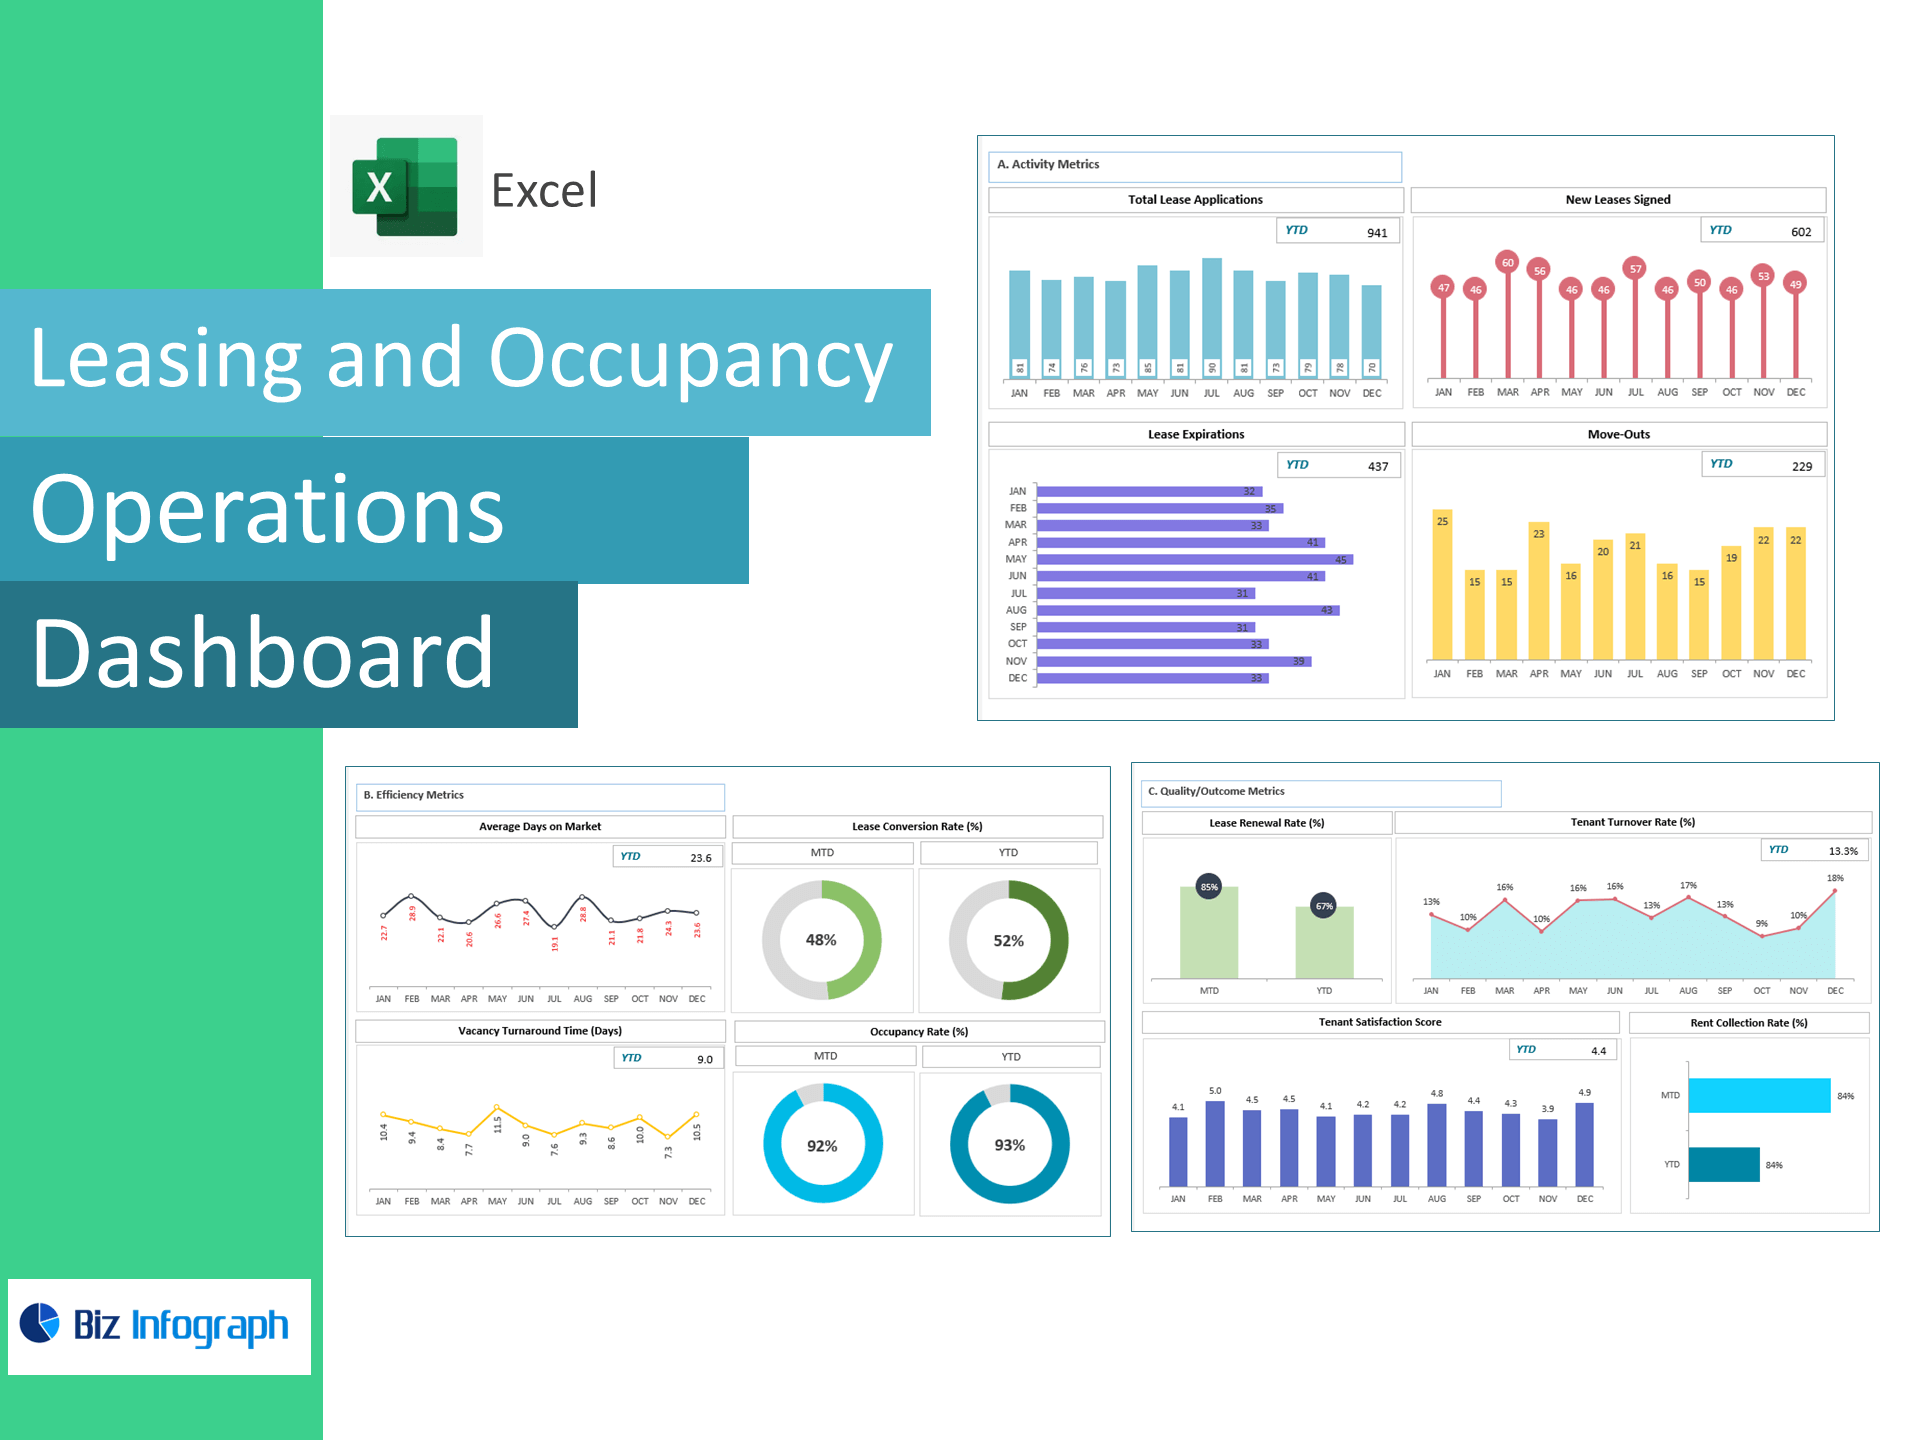
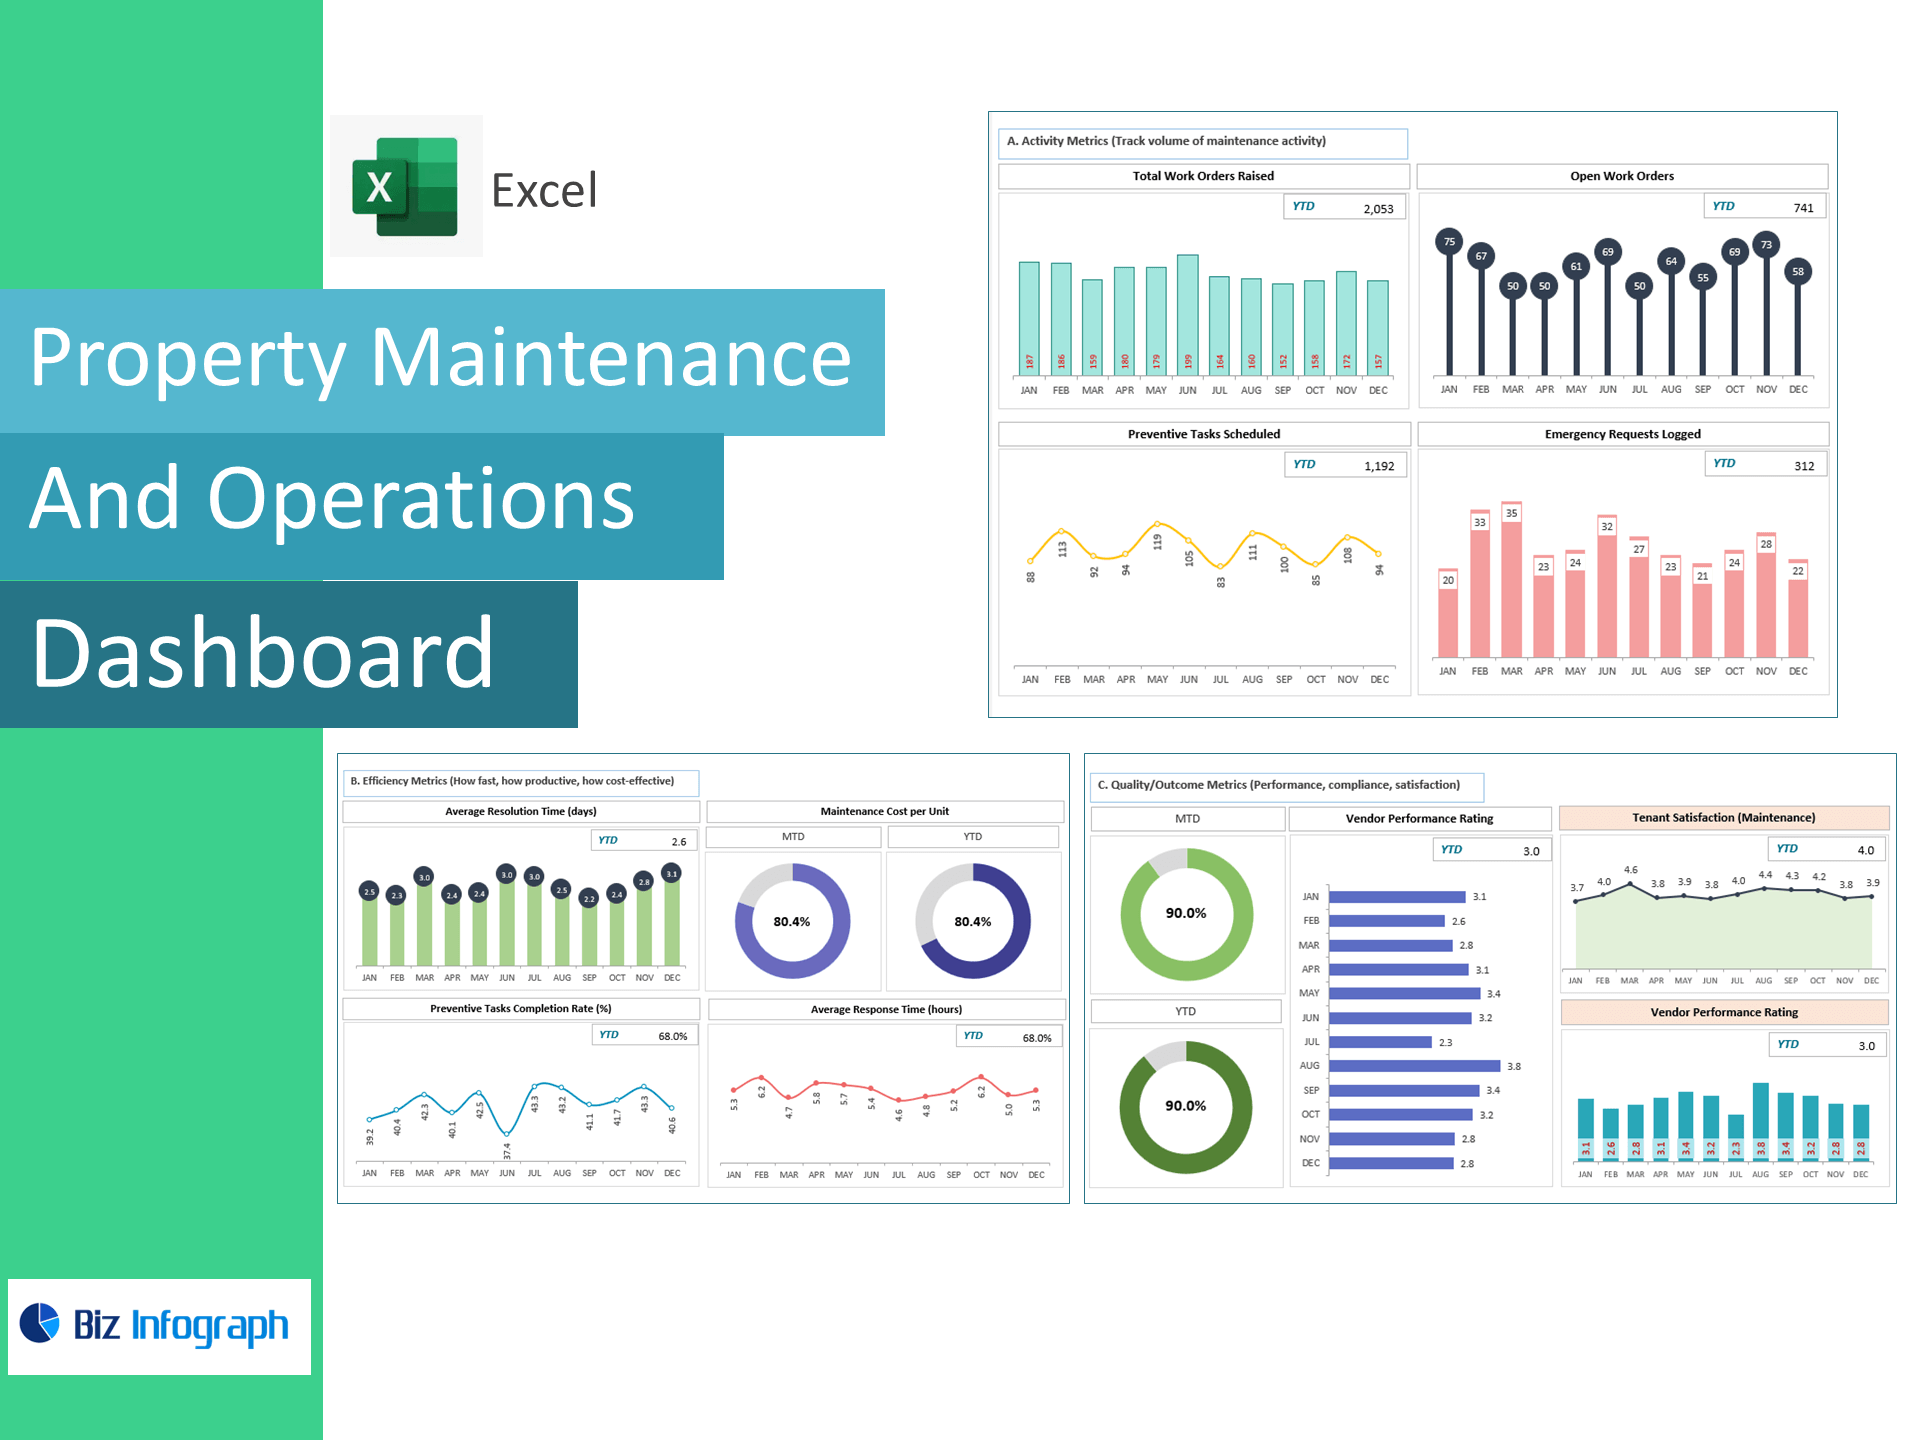
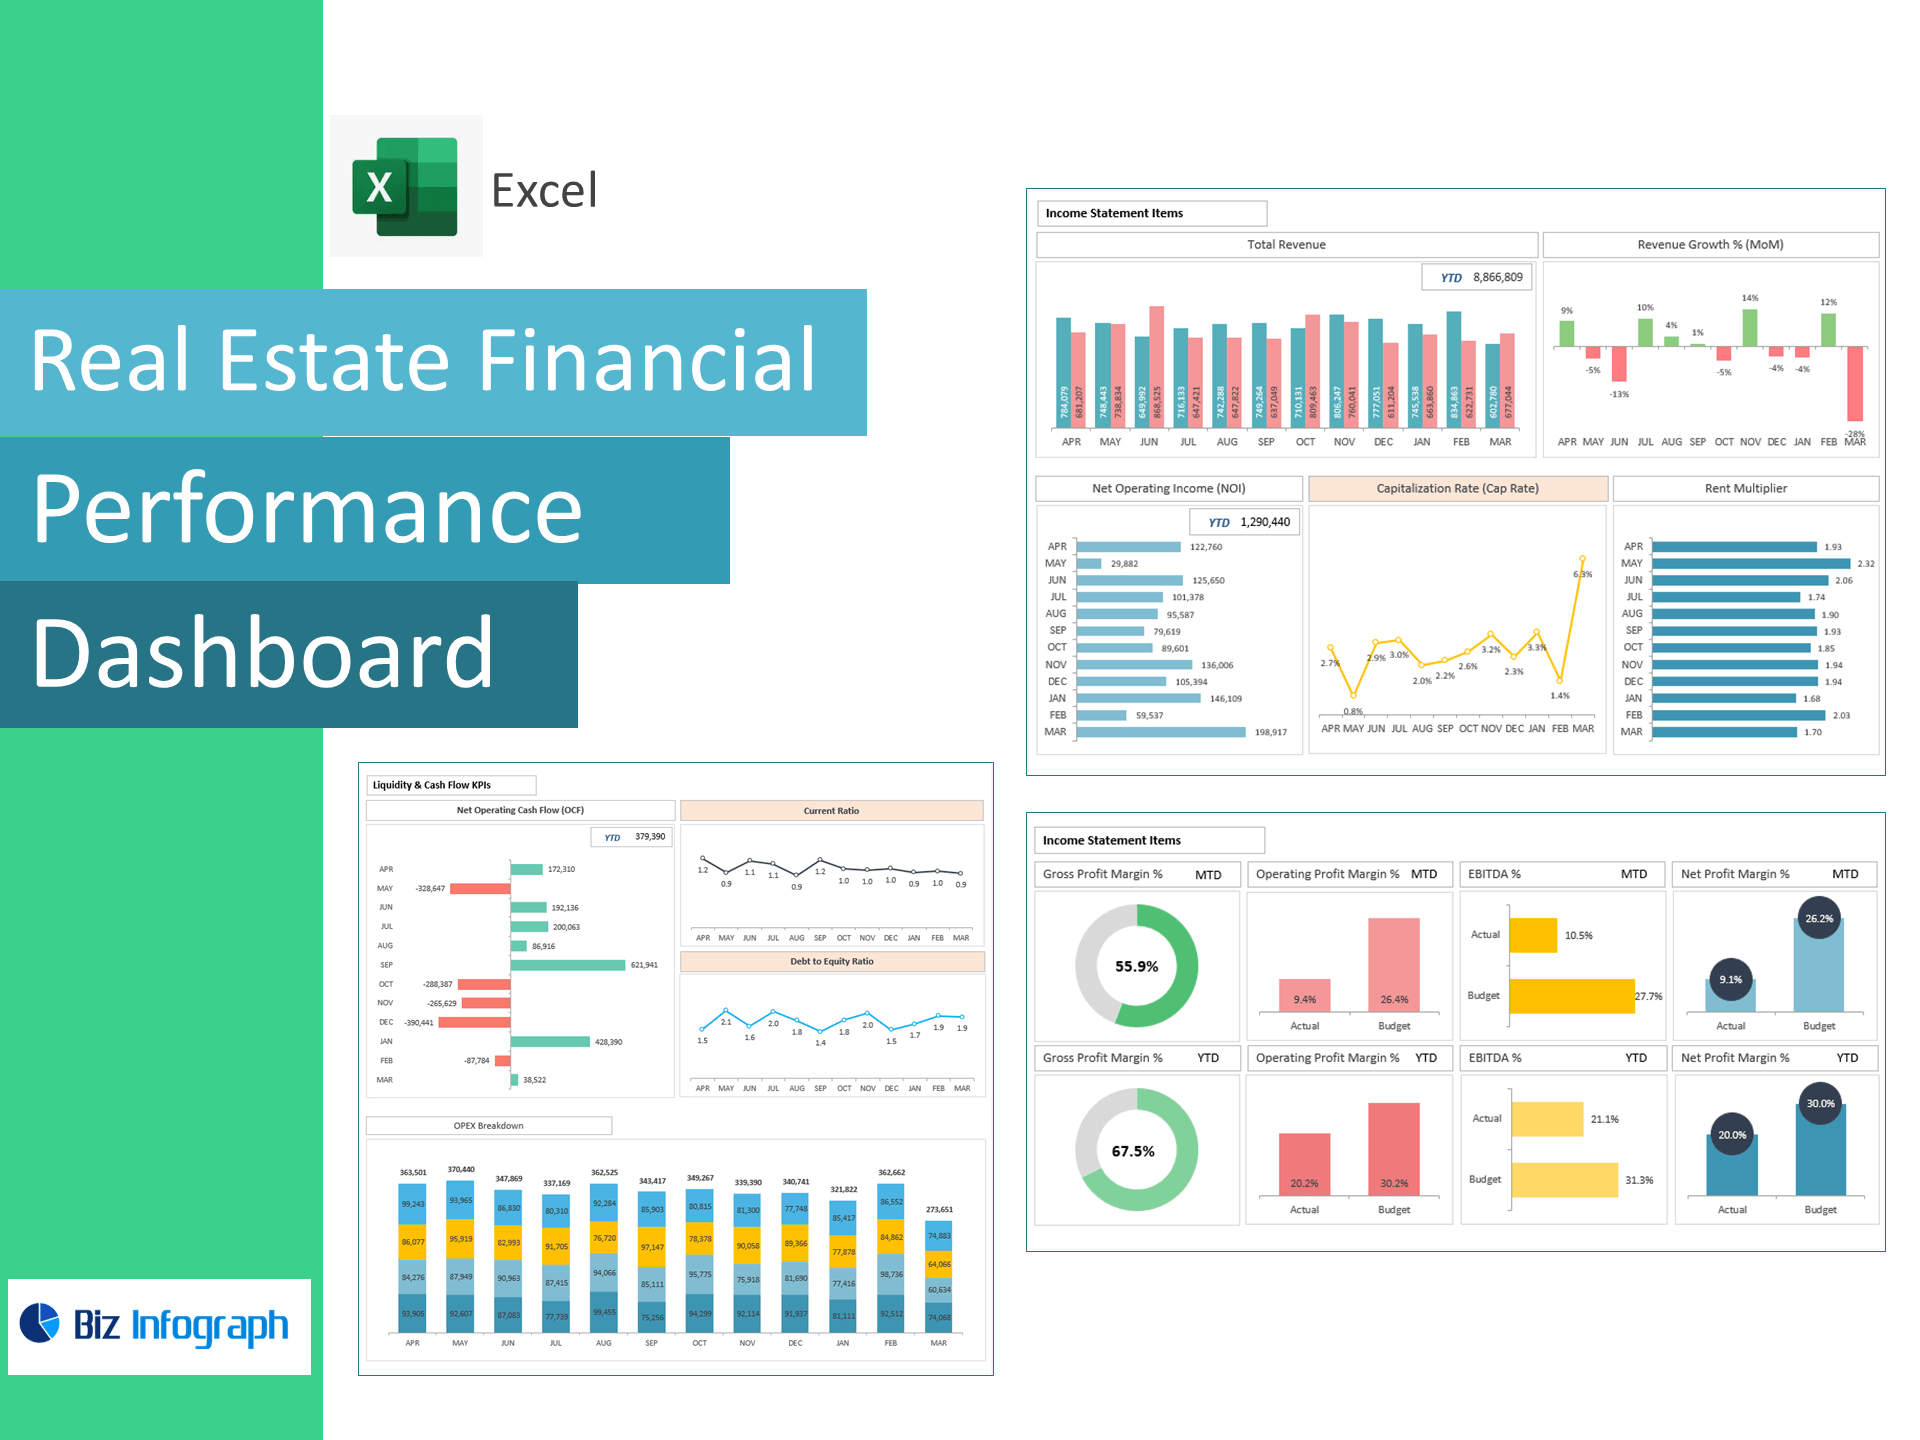
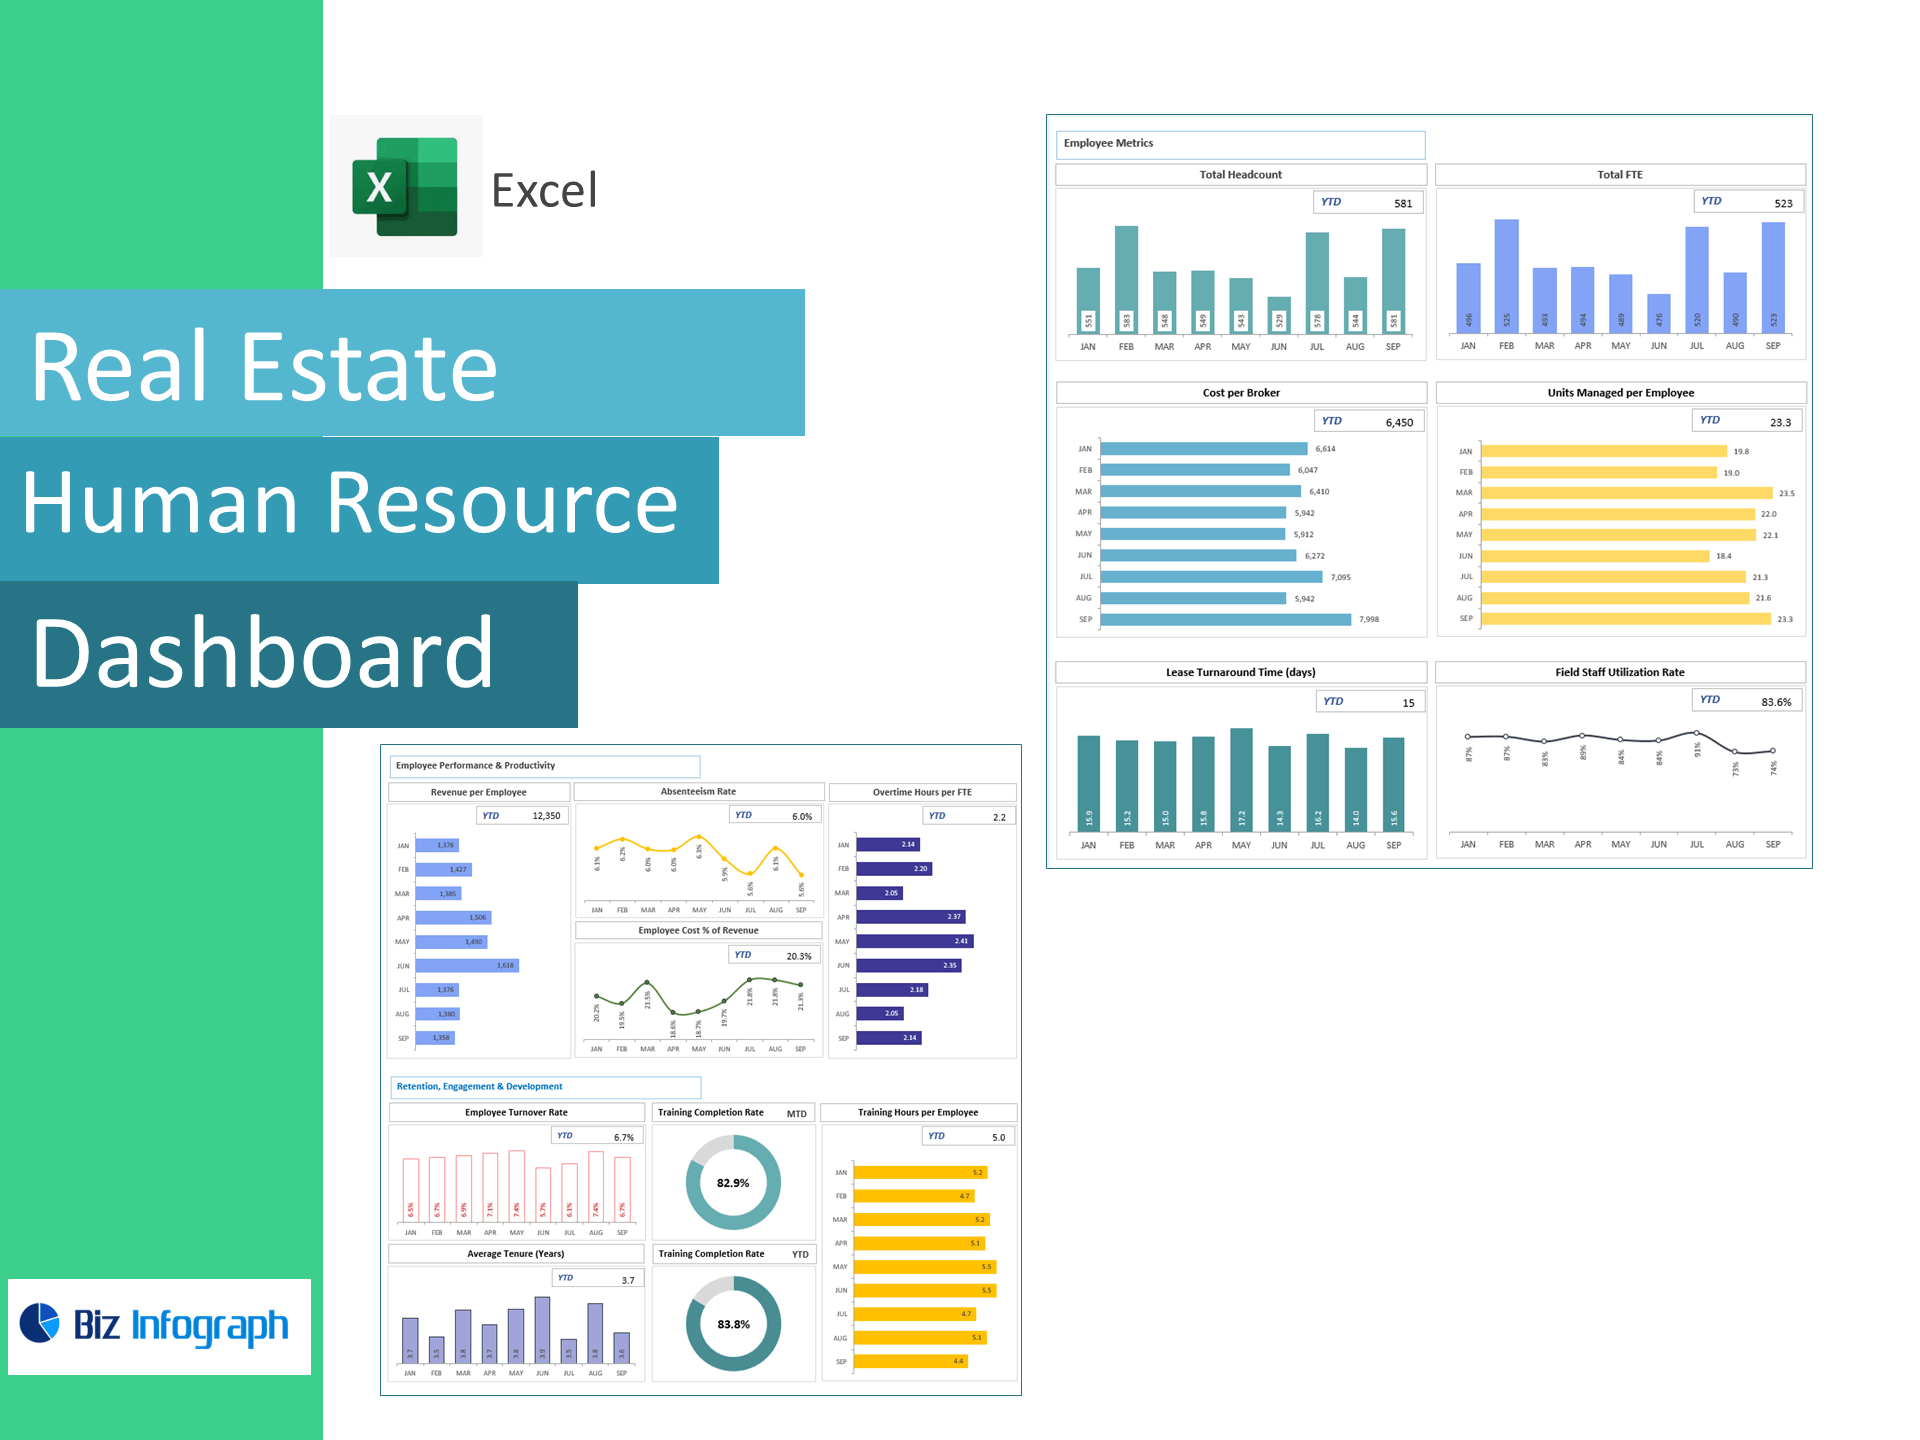
The Real Estate Dashboard Package is a comprehensive Excel-based solution tailored for real estate professionals to efficiently manage and visualize operational, financial, and workforce data. This all-in-one package includes four specialized dashboards: Leasing and Occupancy Operations, Property Maintenance and Operations, Financial Performance, and HR Dashboard. With user-friendly templates and real-time KPI tracking, the dashboards provide deep insights into occupancy rates, lease renewals, property upkeep, financial health, and workforce efficiency. Whether you're managing residential, commercial, or mixed-use properties, this dashboard suite empowers asset managers, leasing agents, and HR teams to make informed, strategic decisions that drive performance and maximize property value.