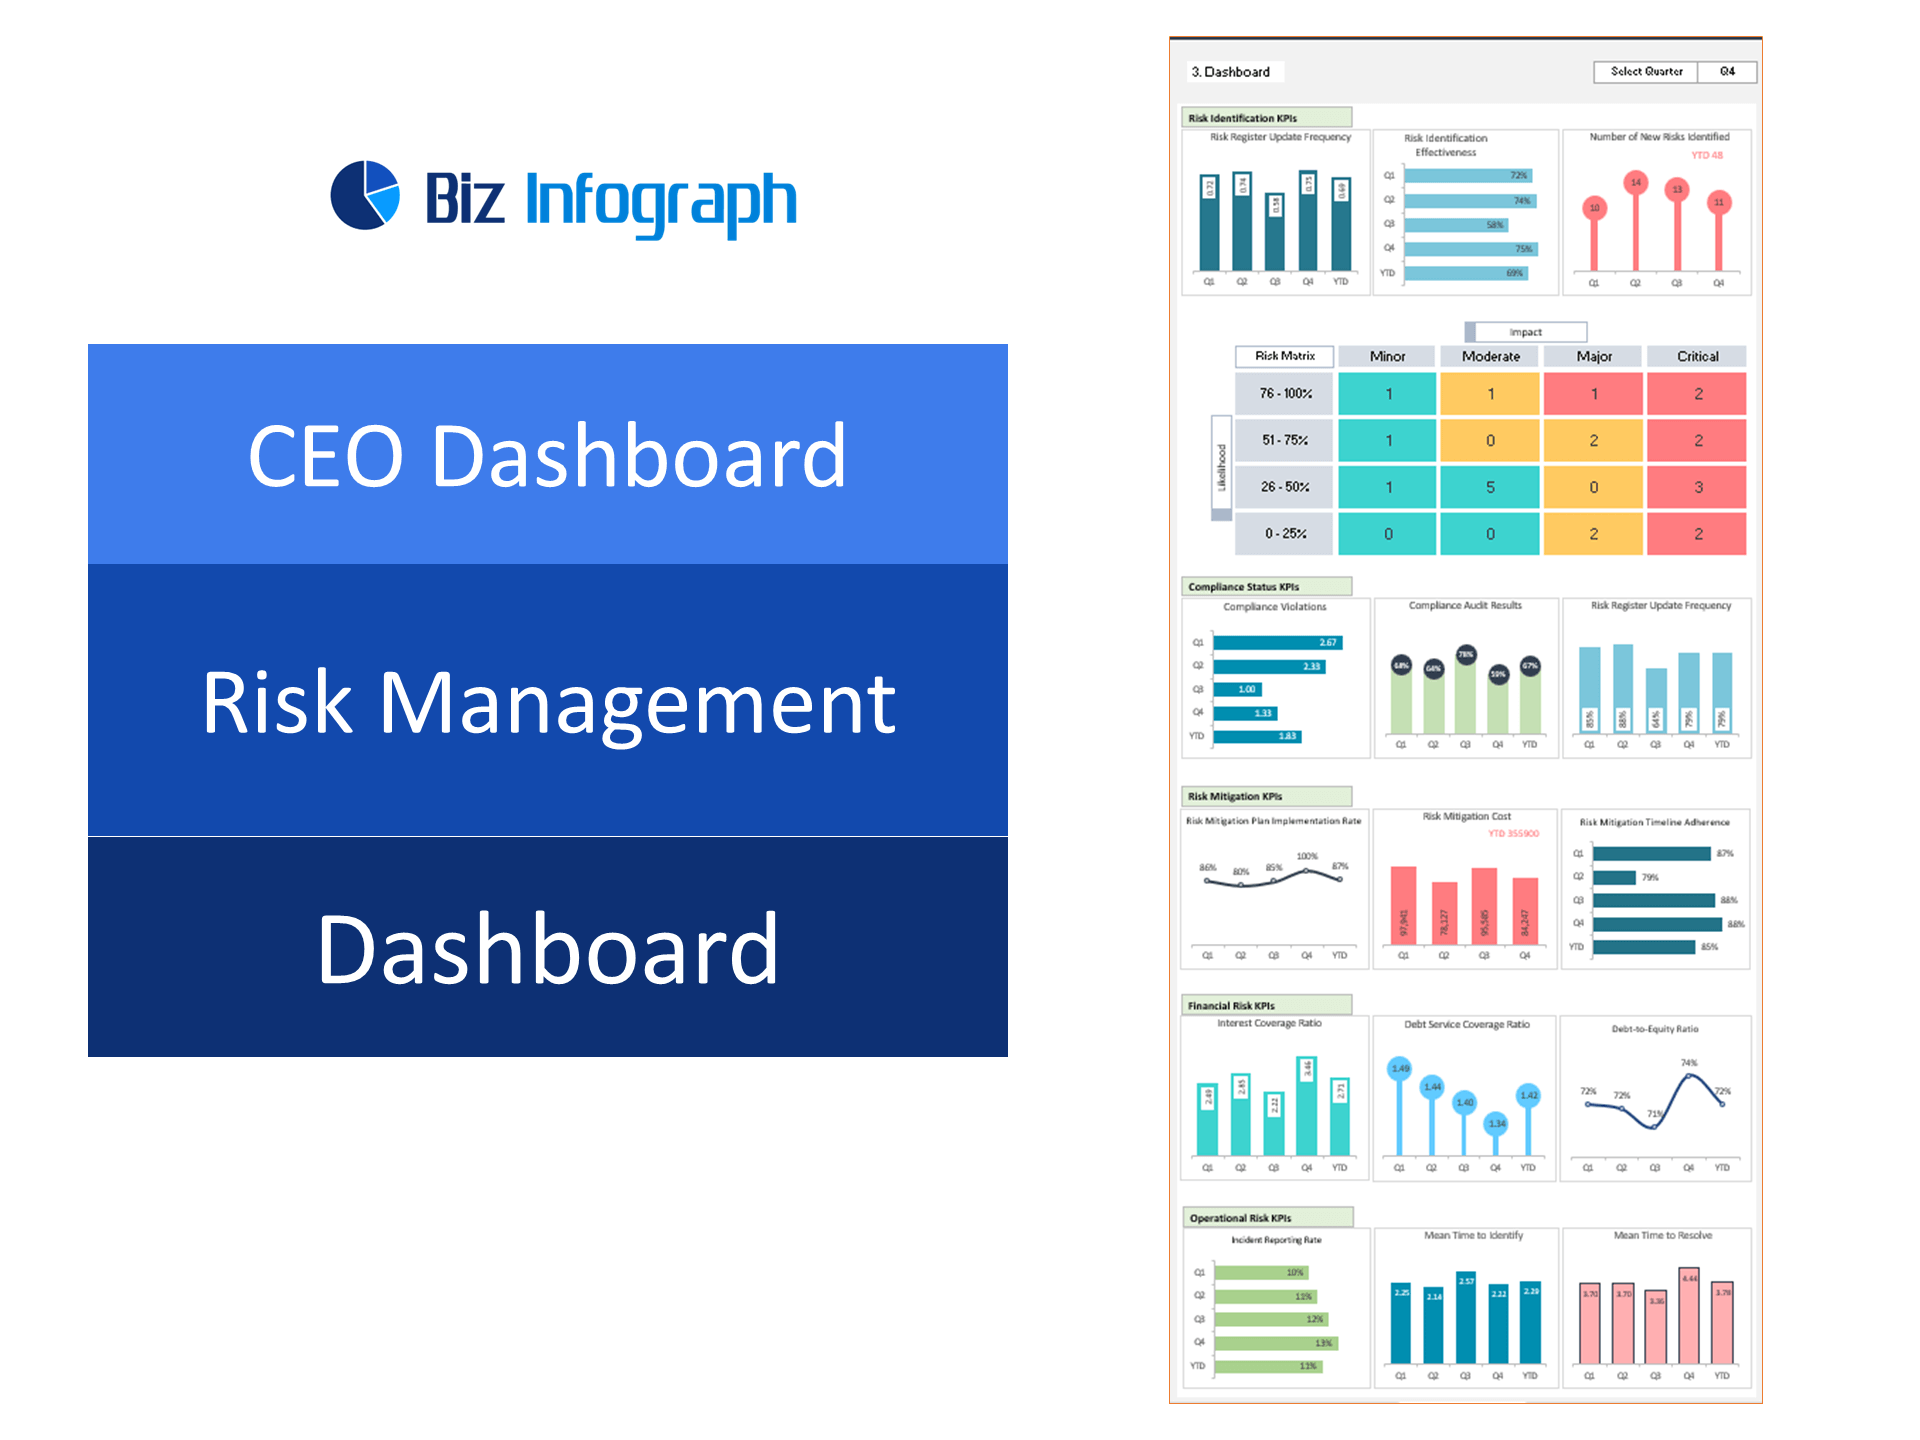
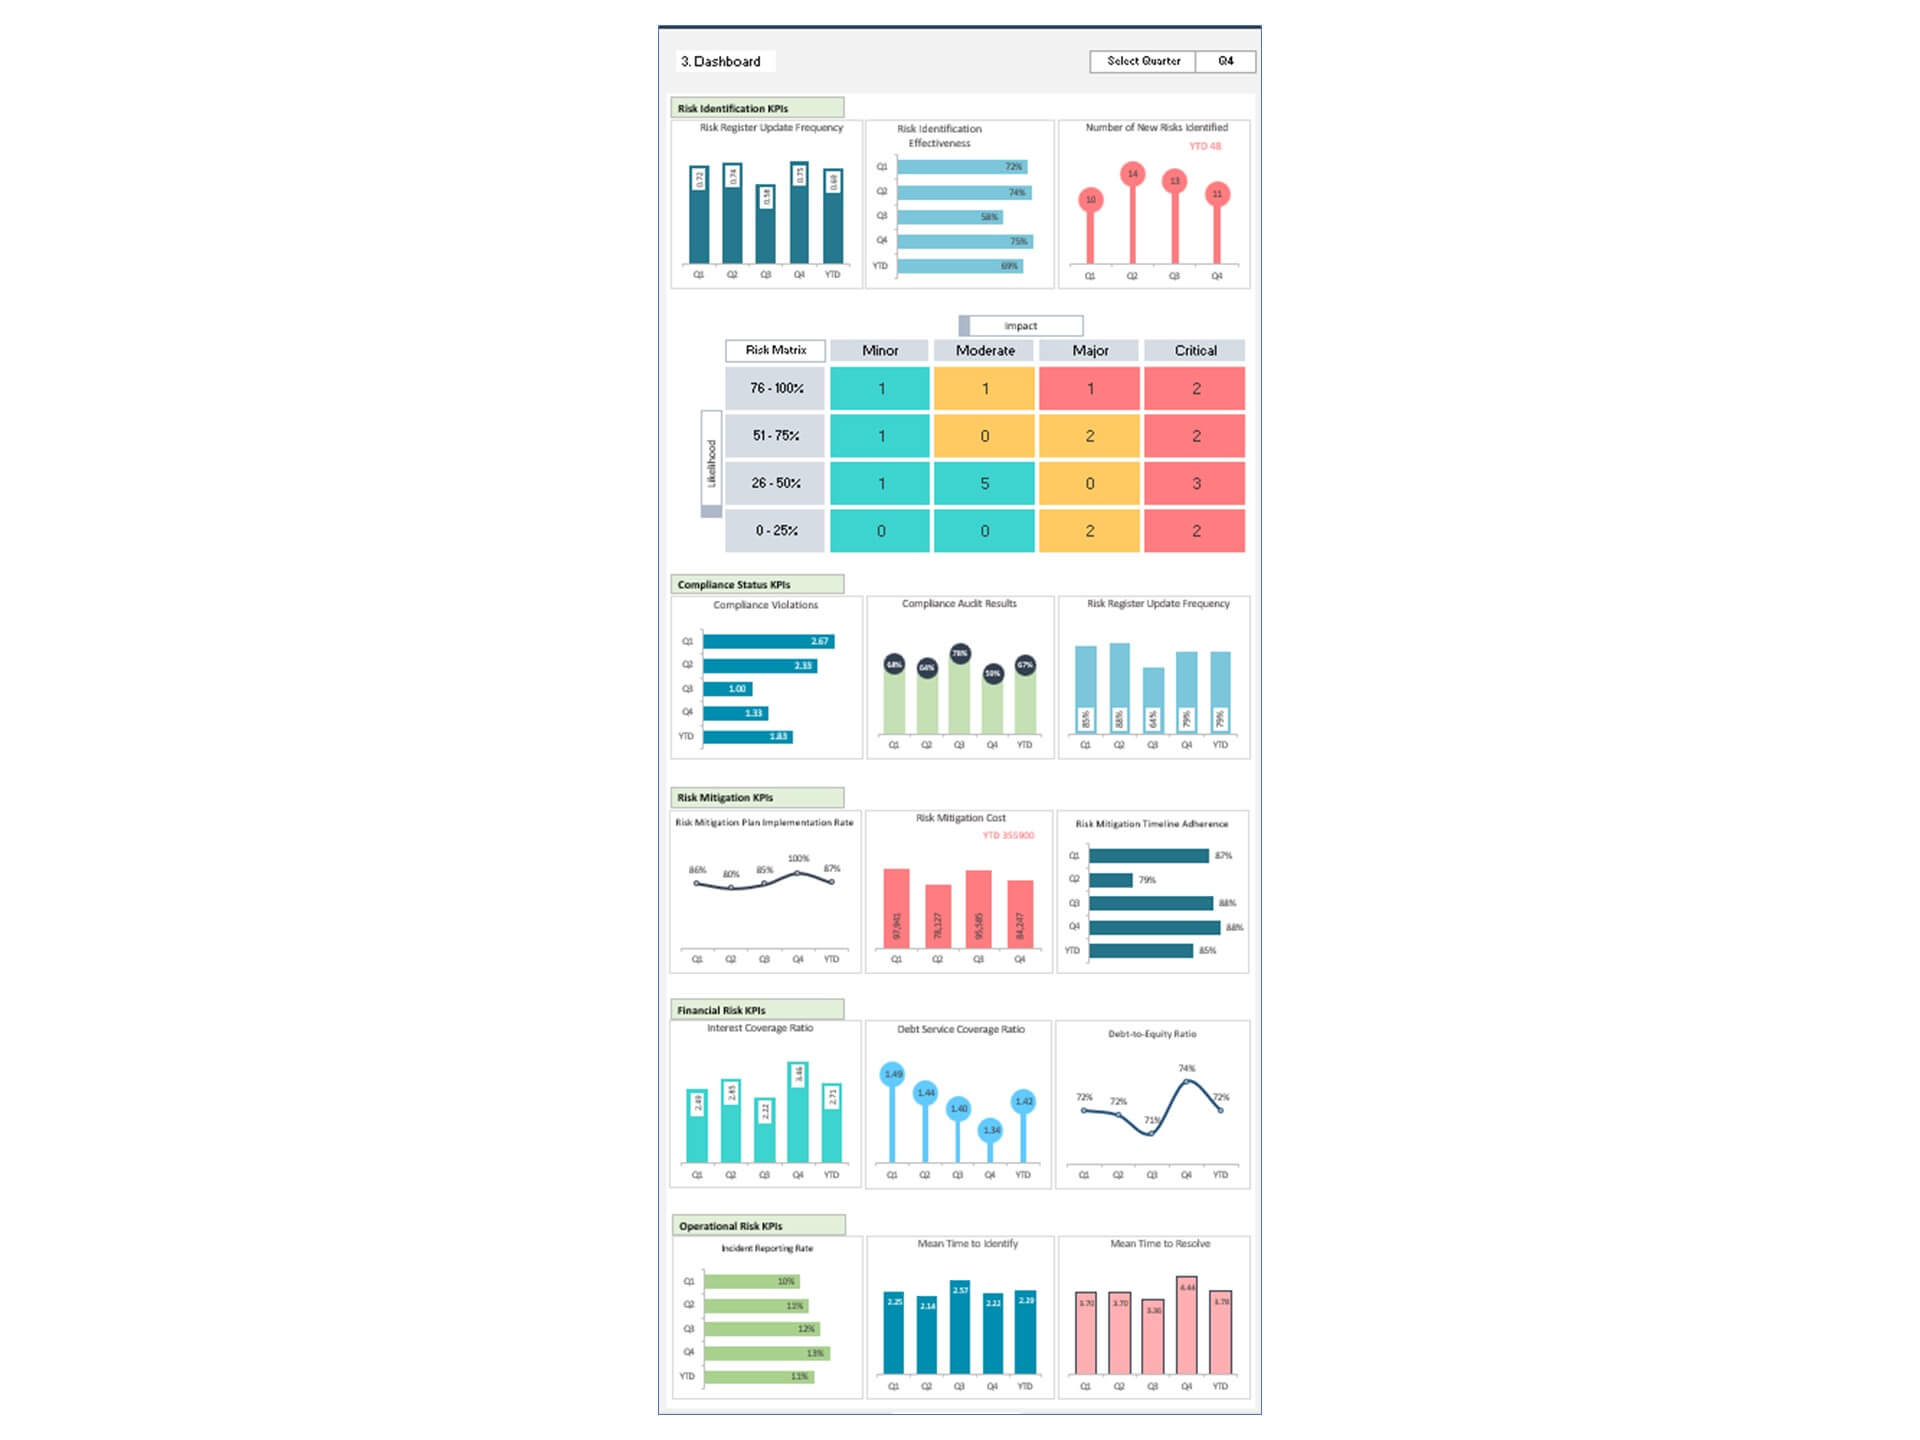
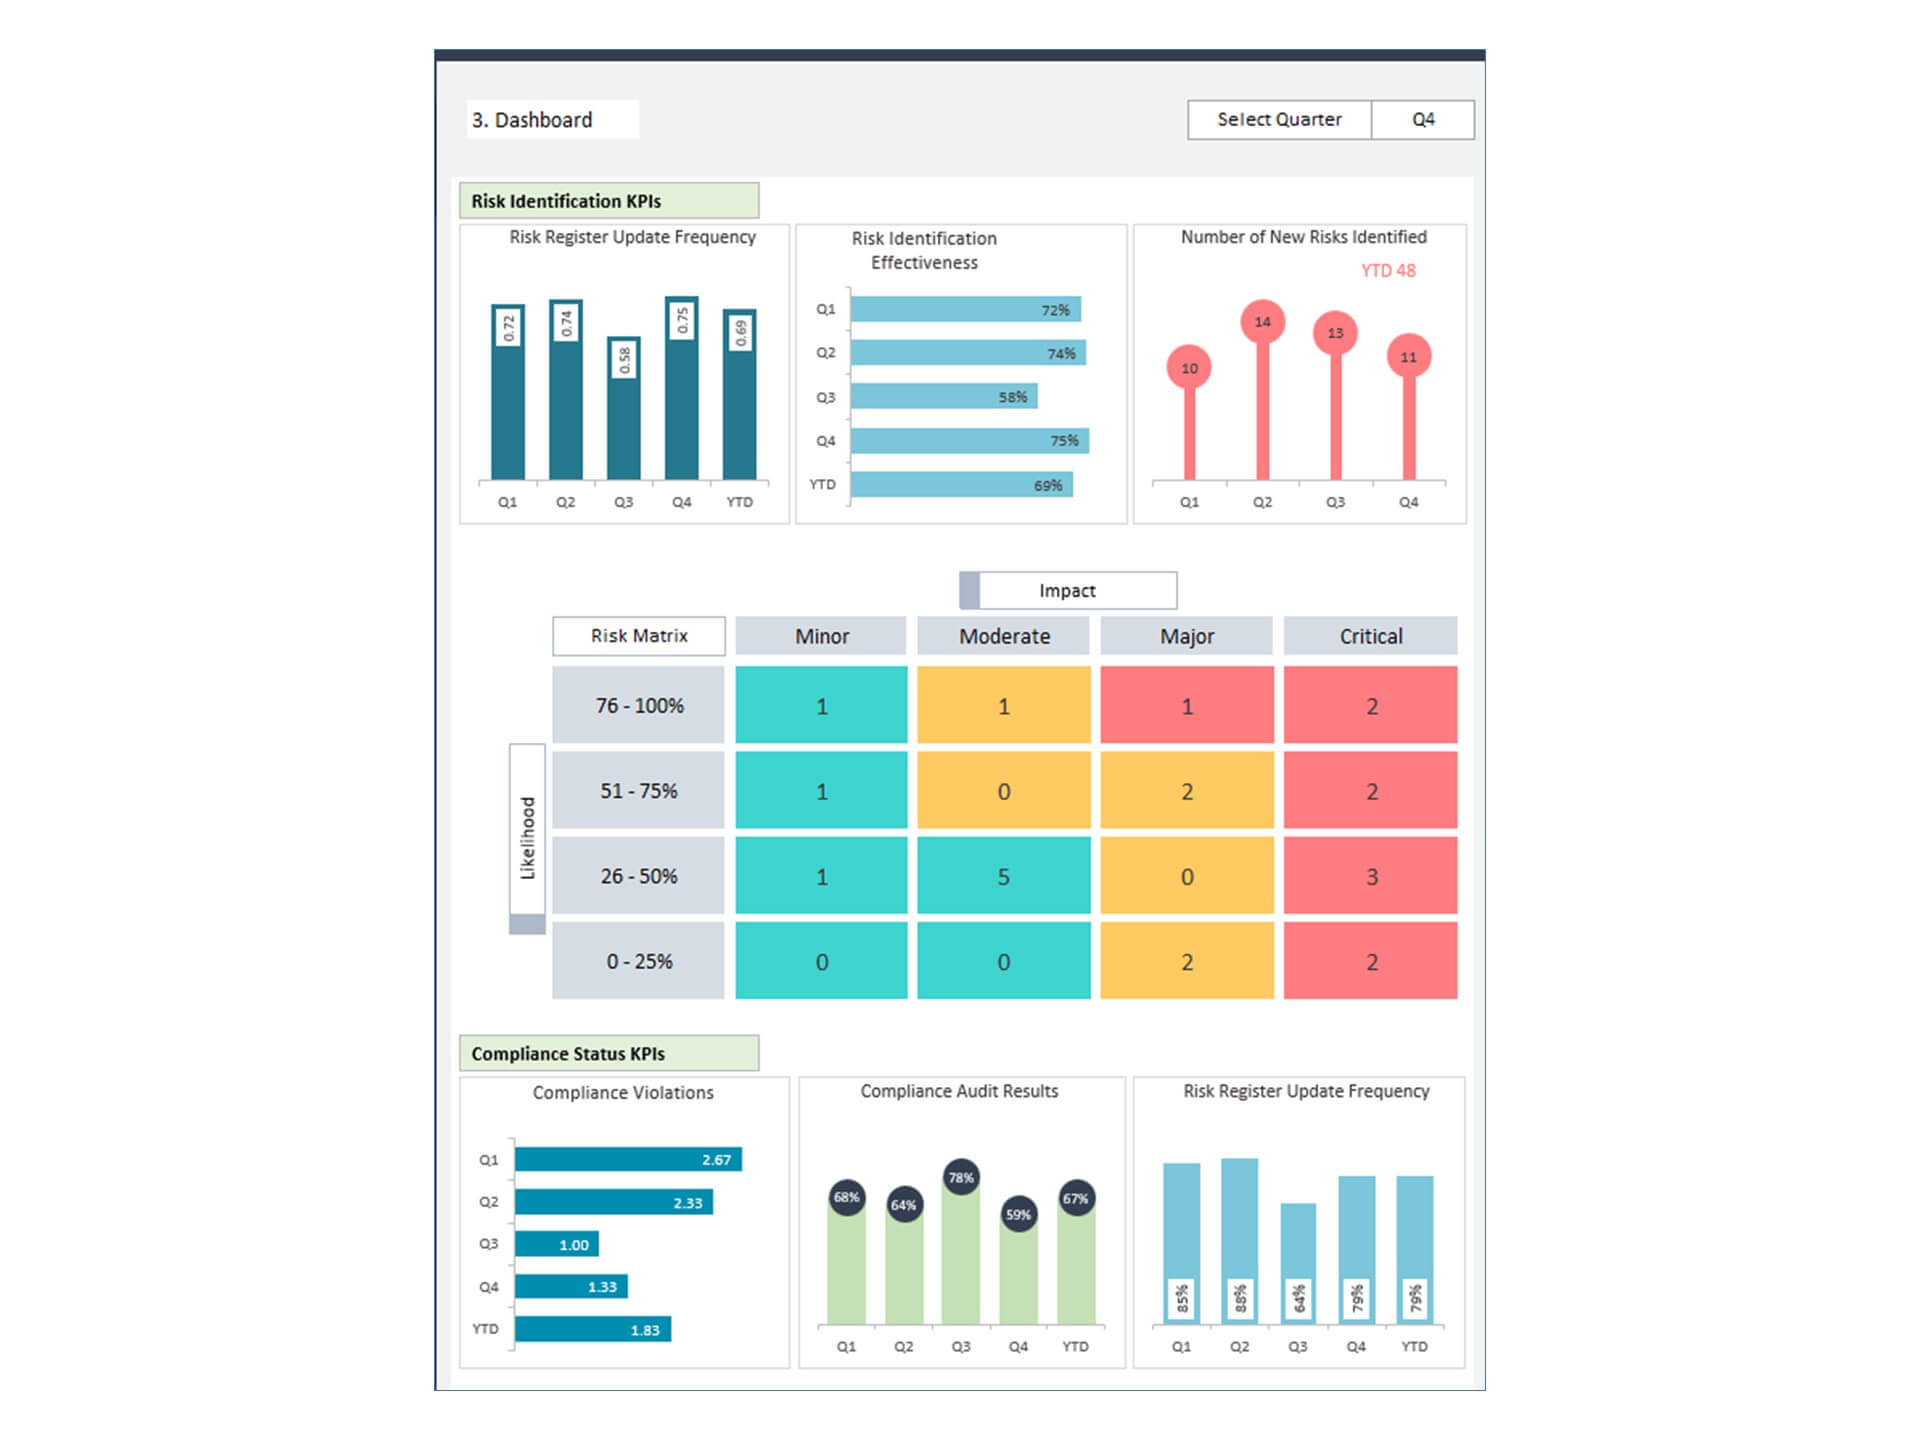
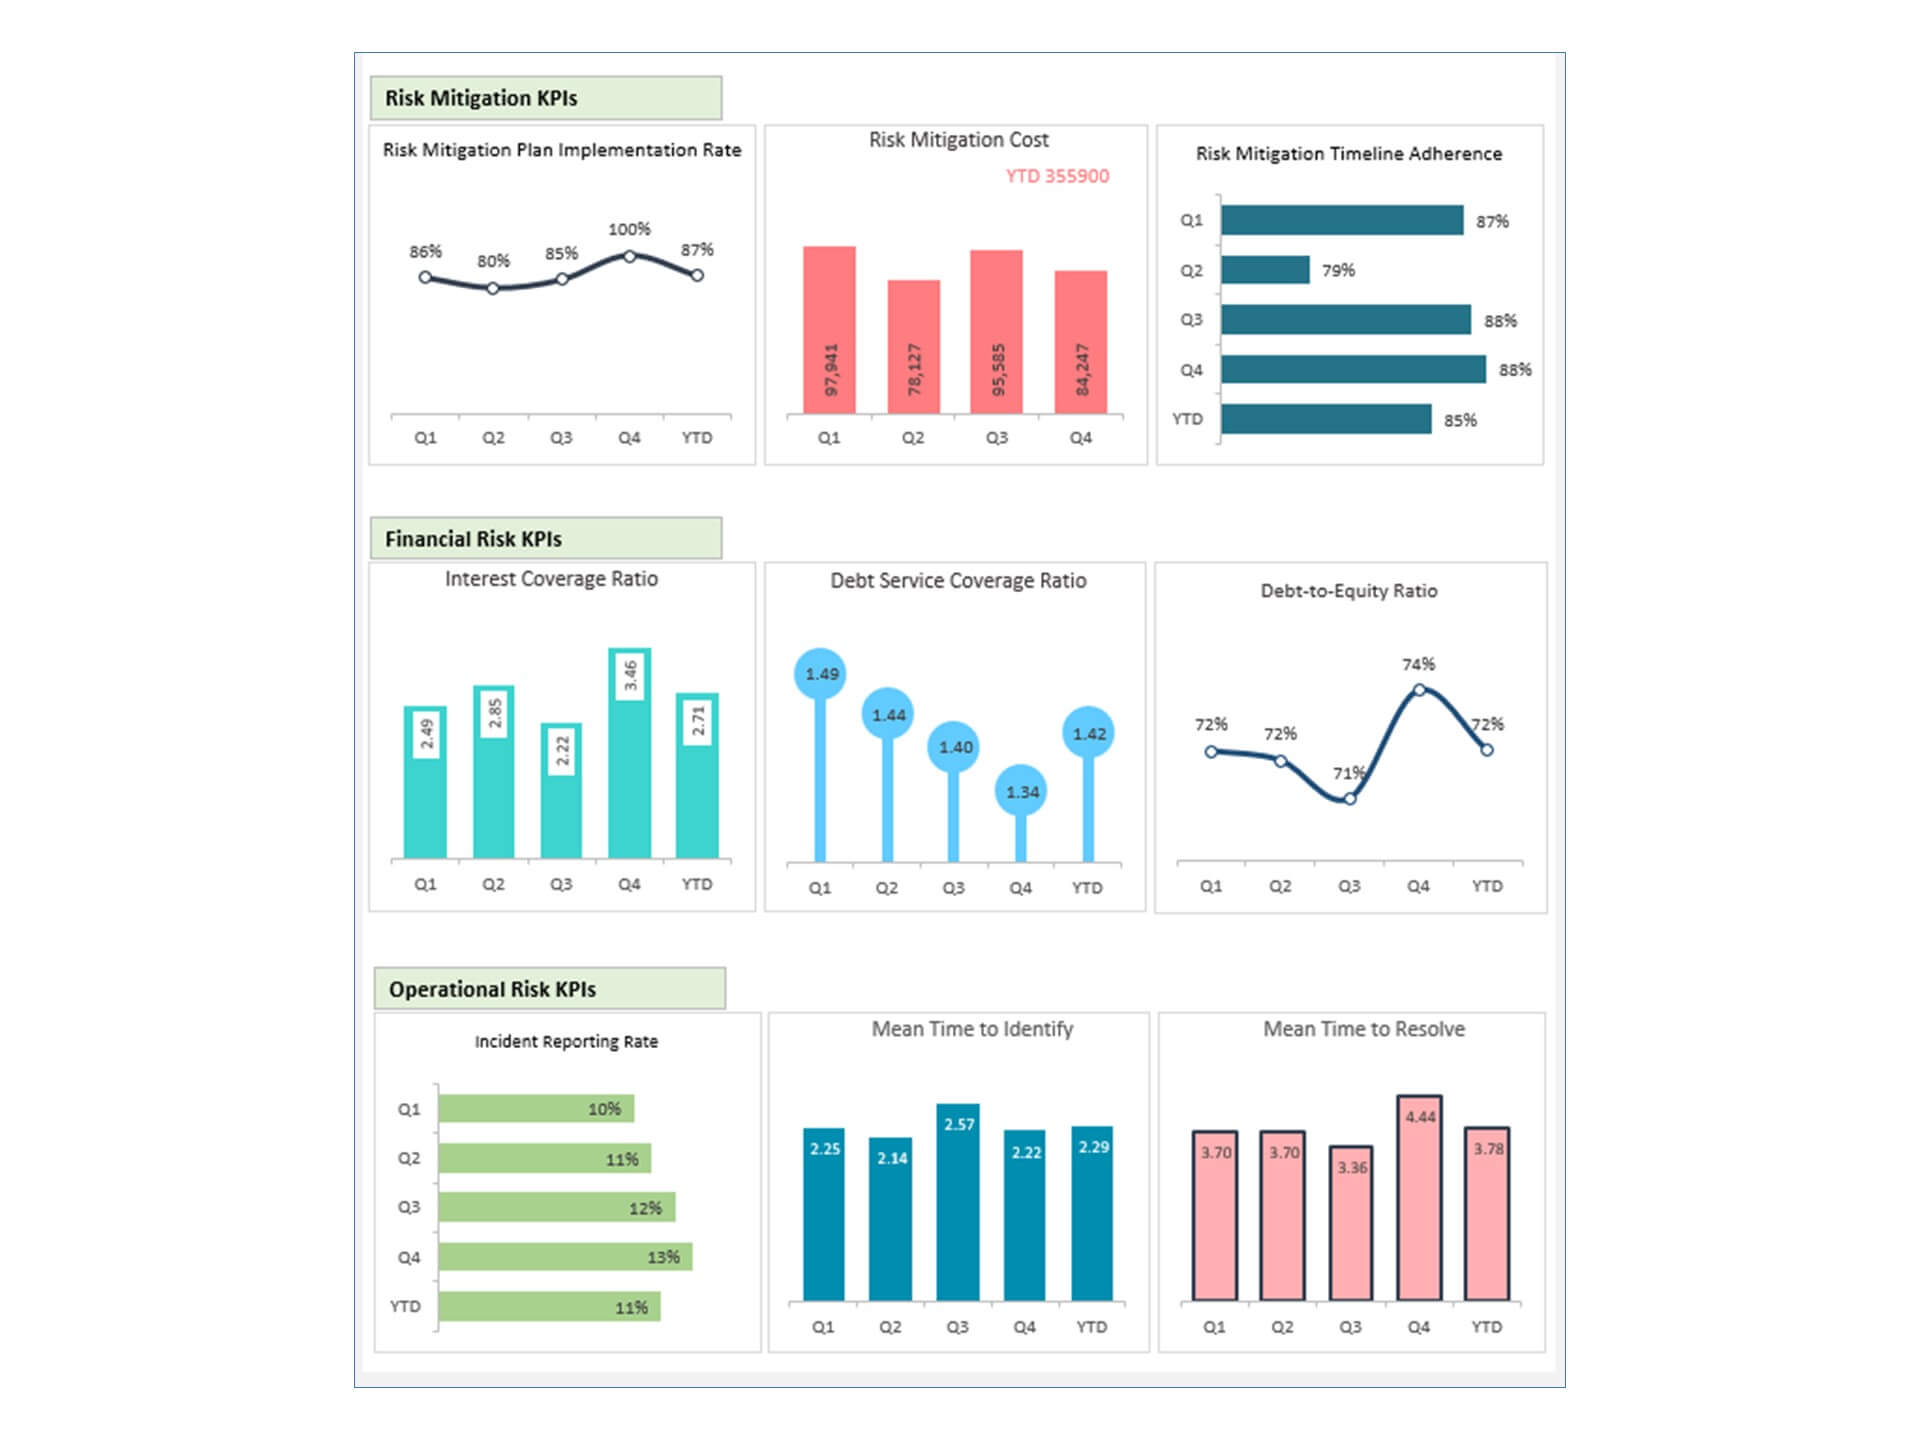
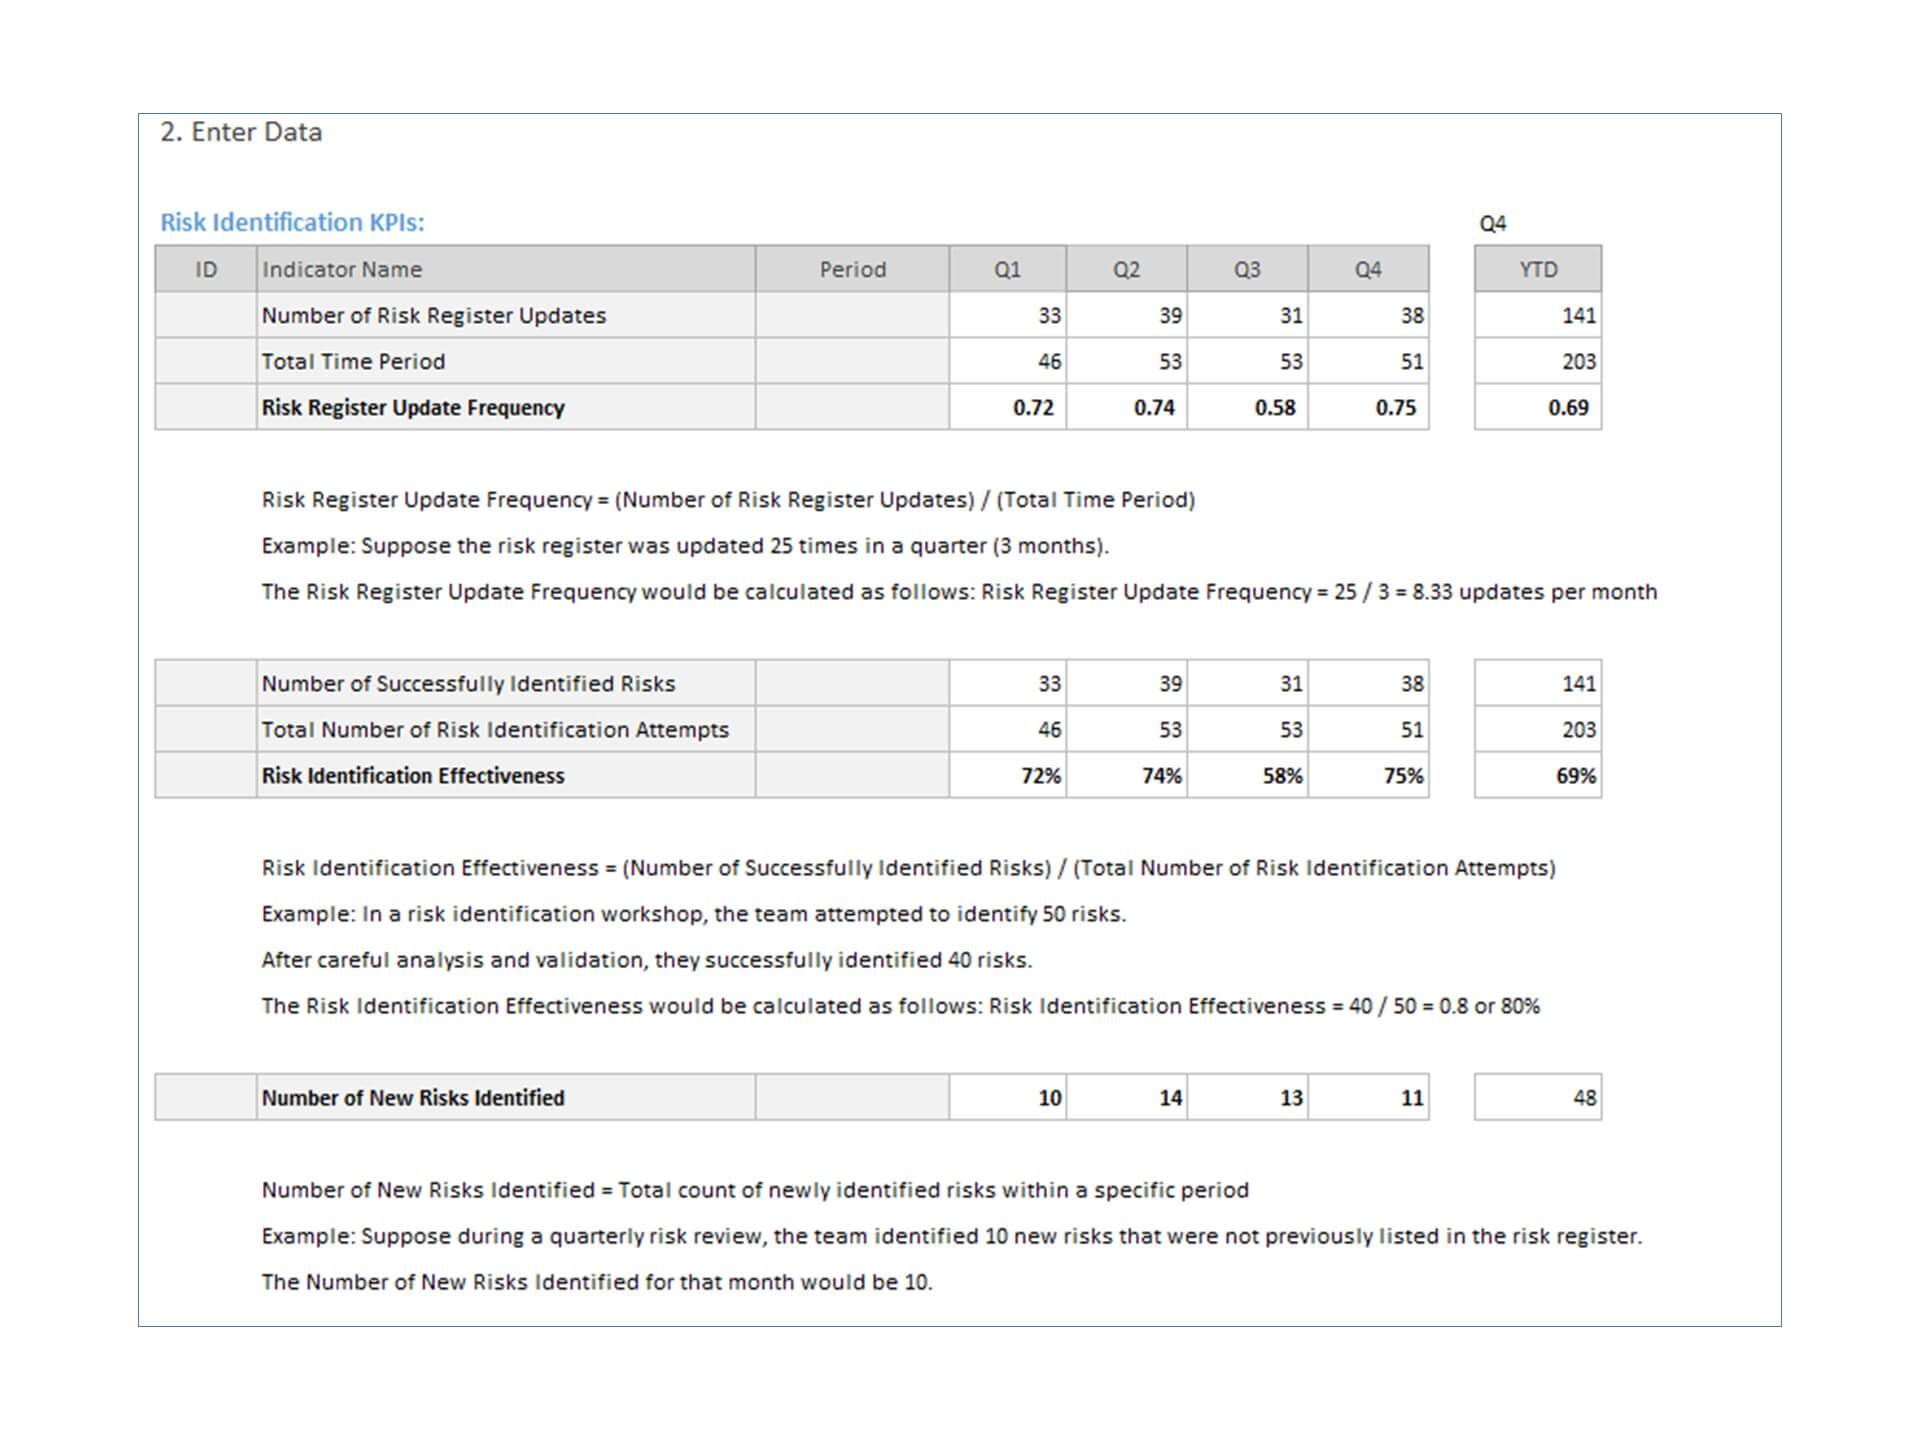
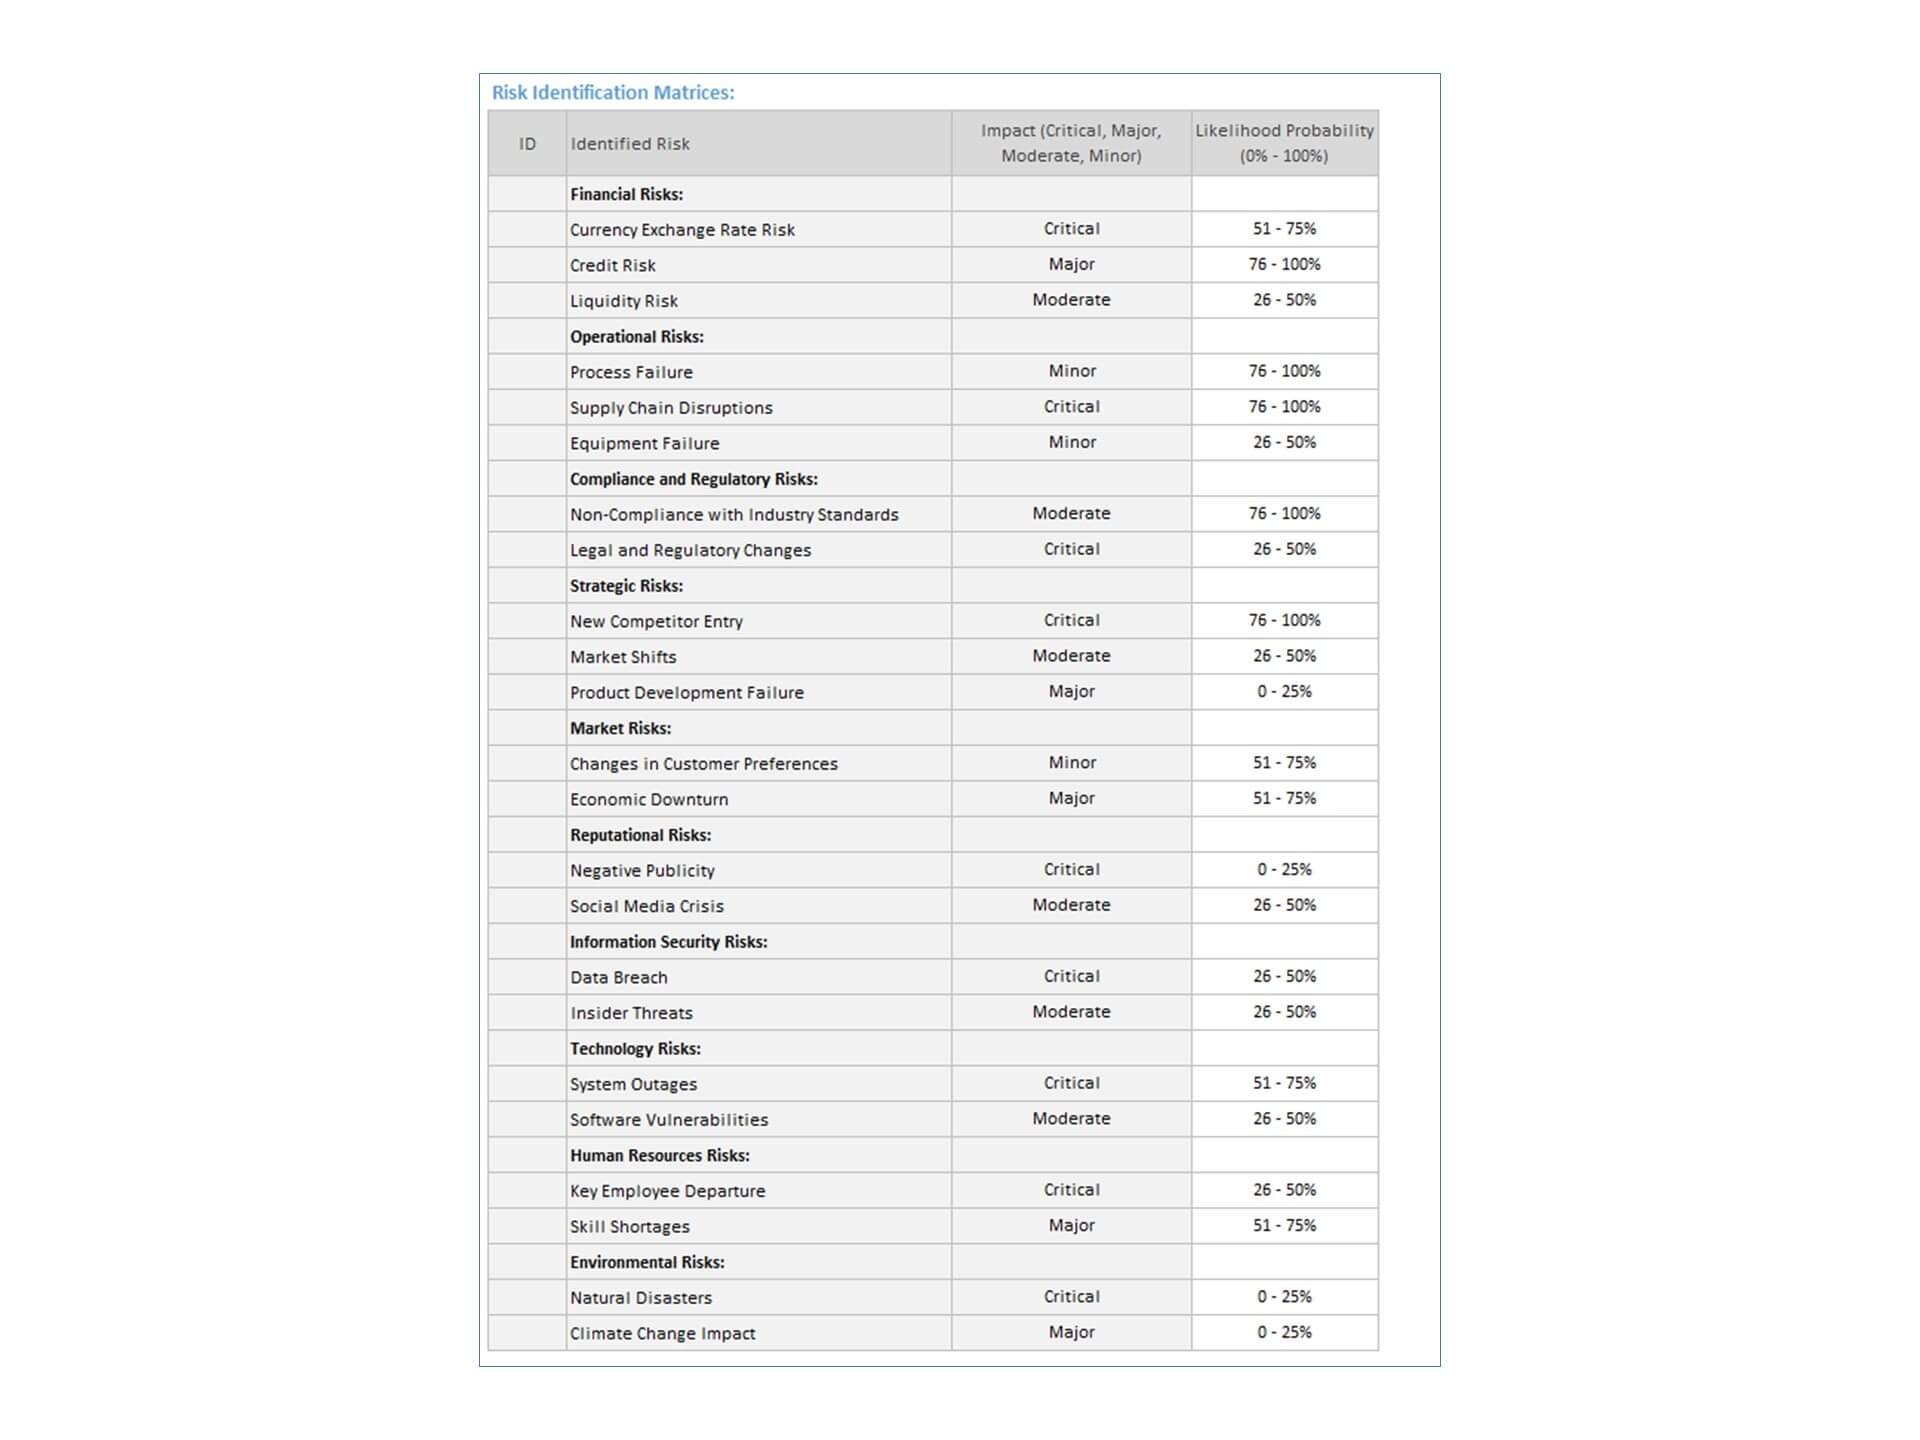
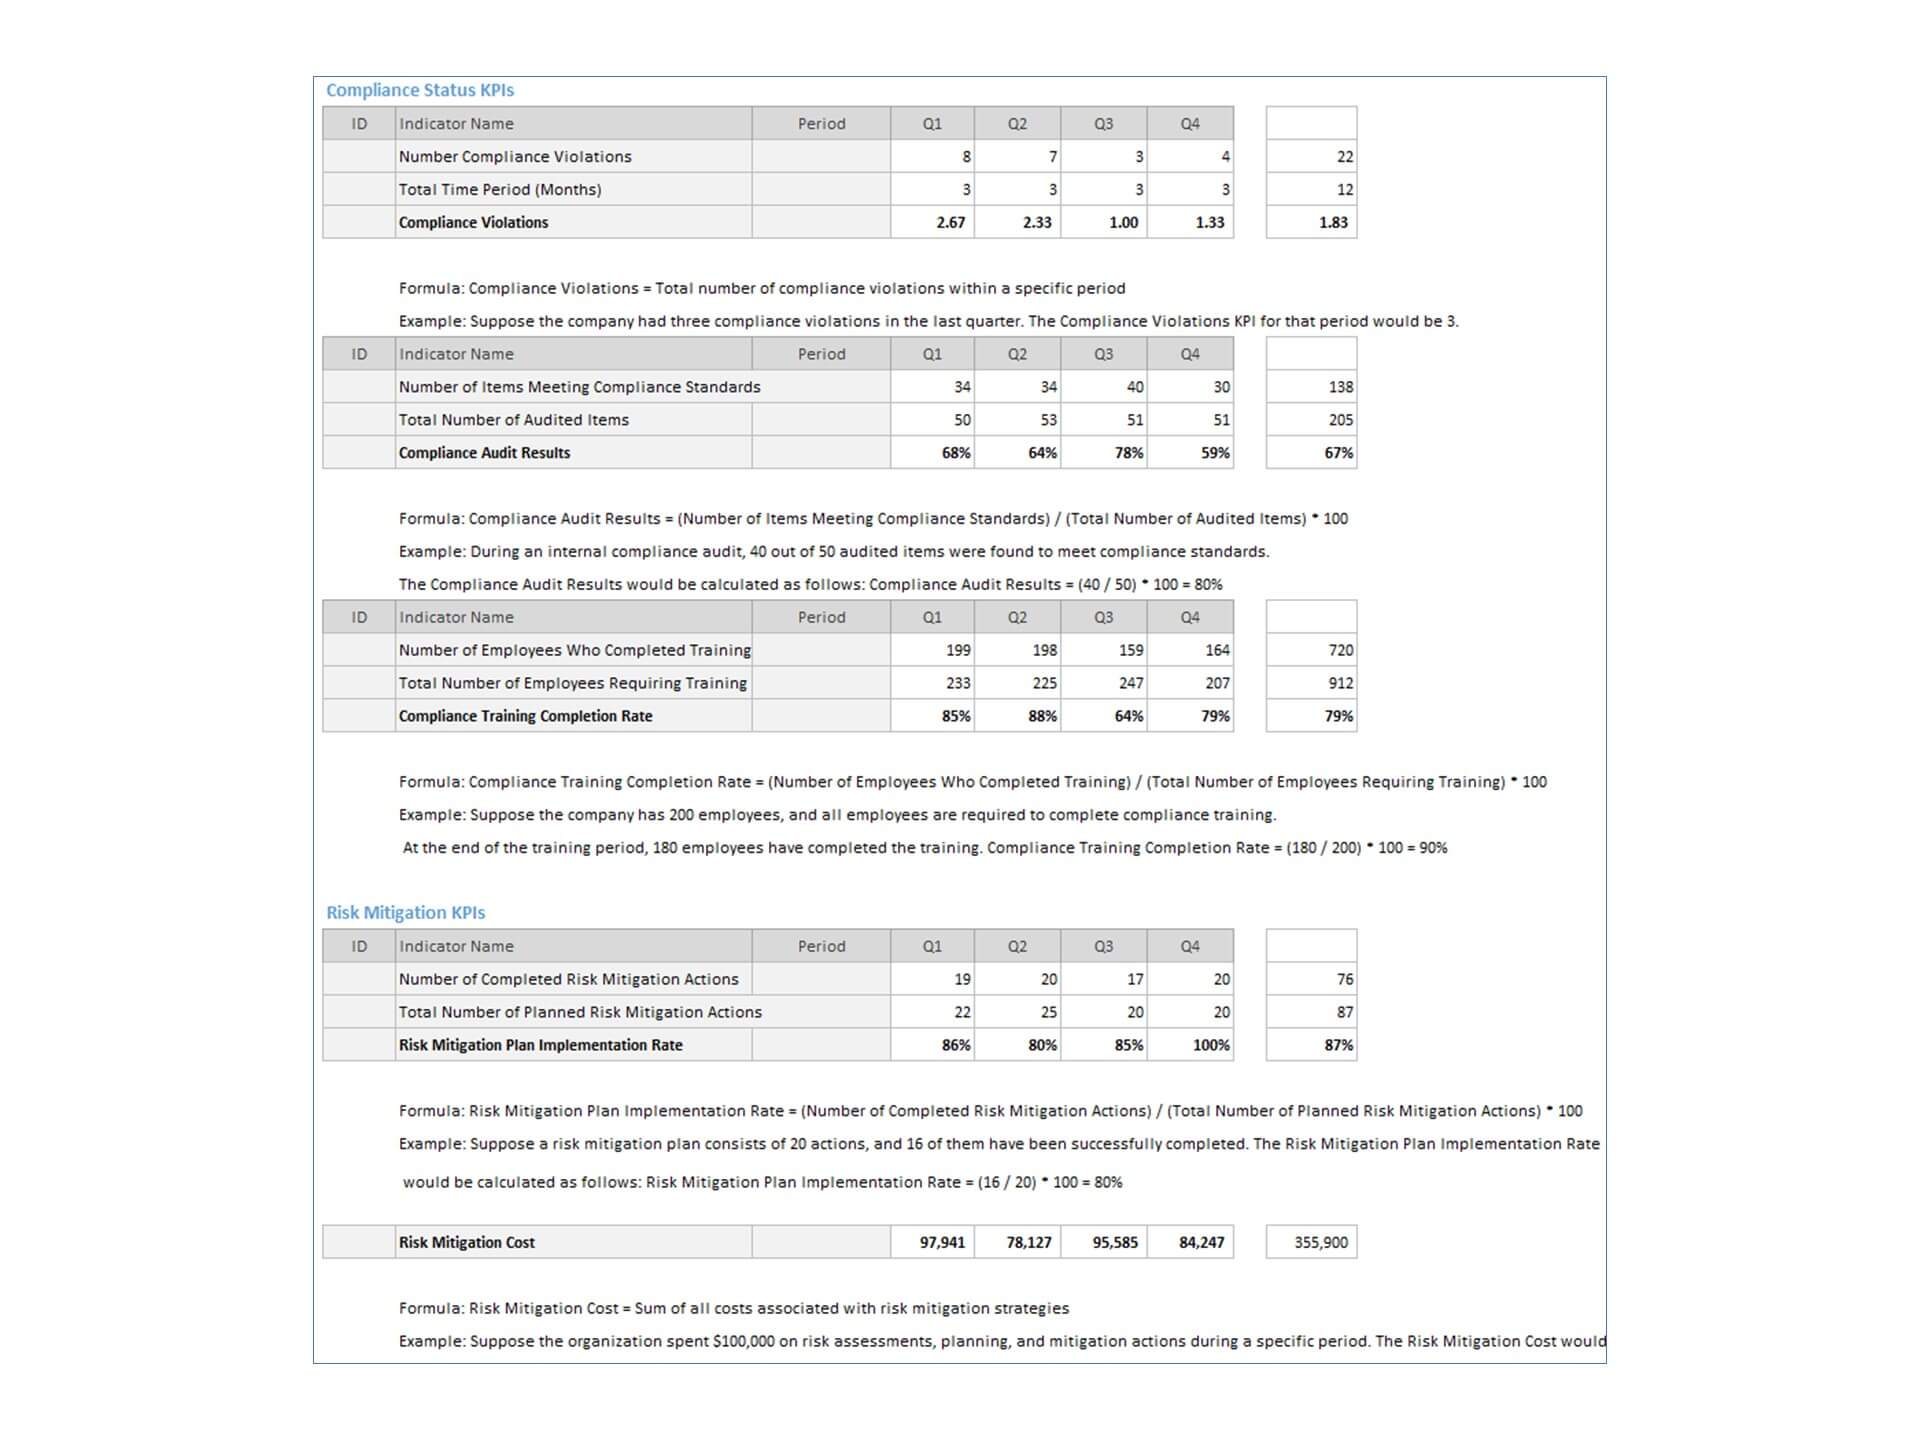
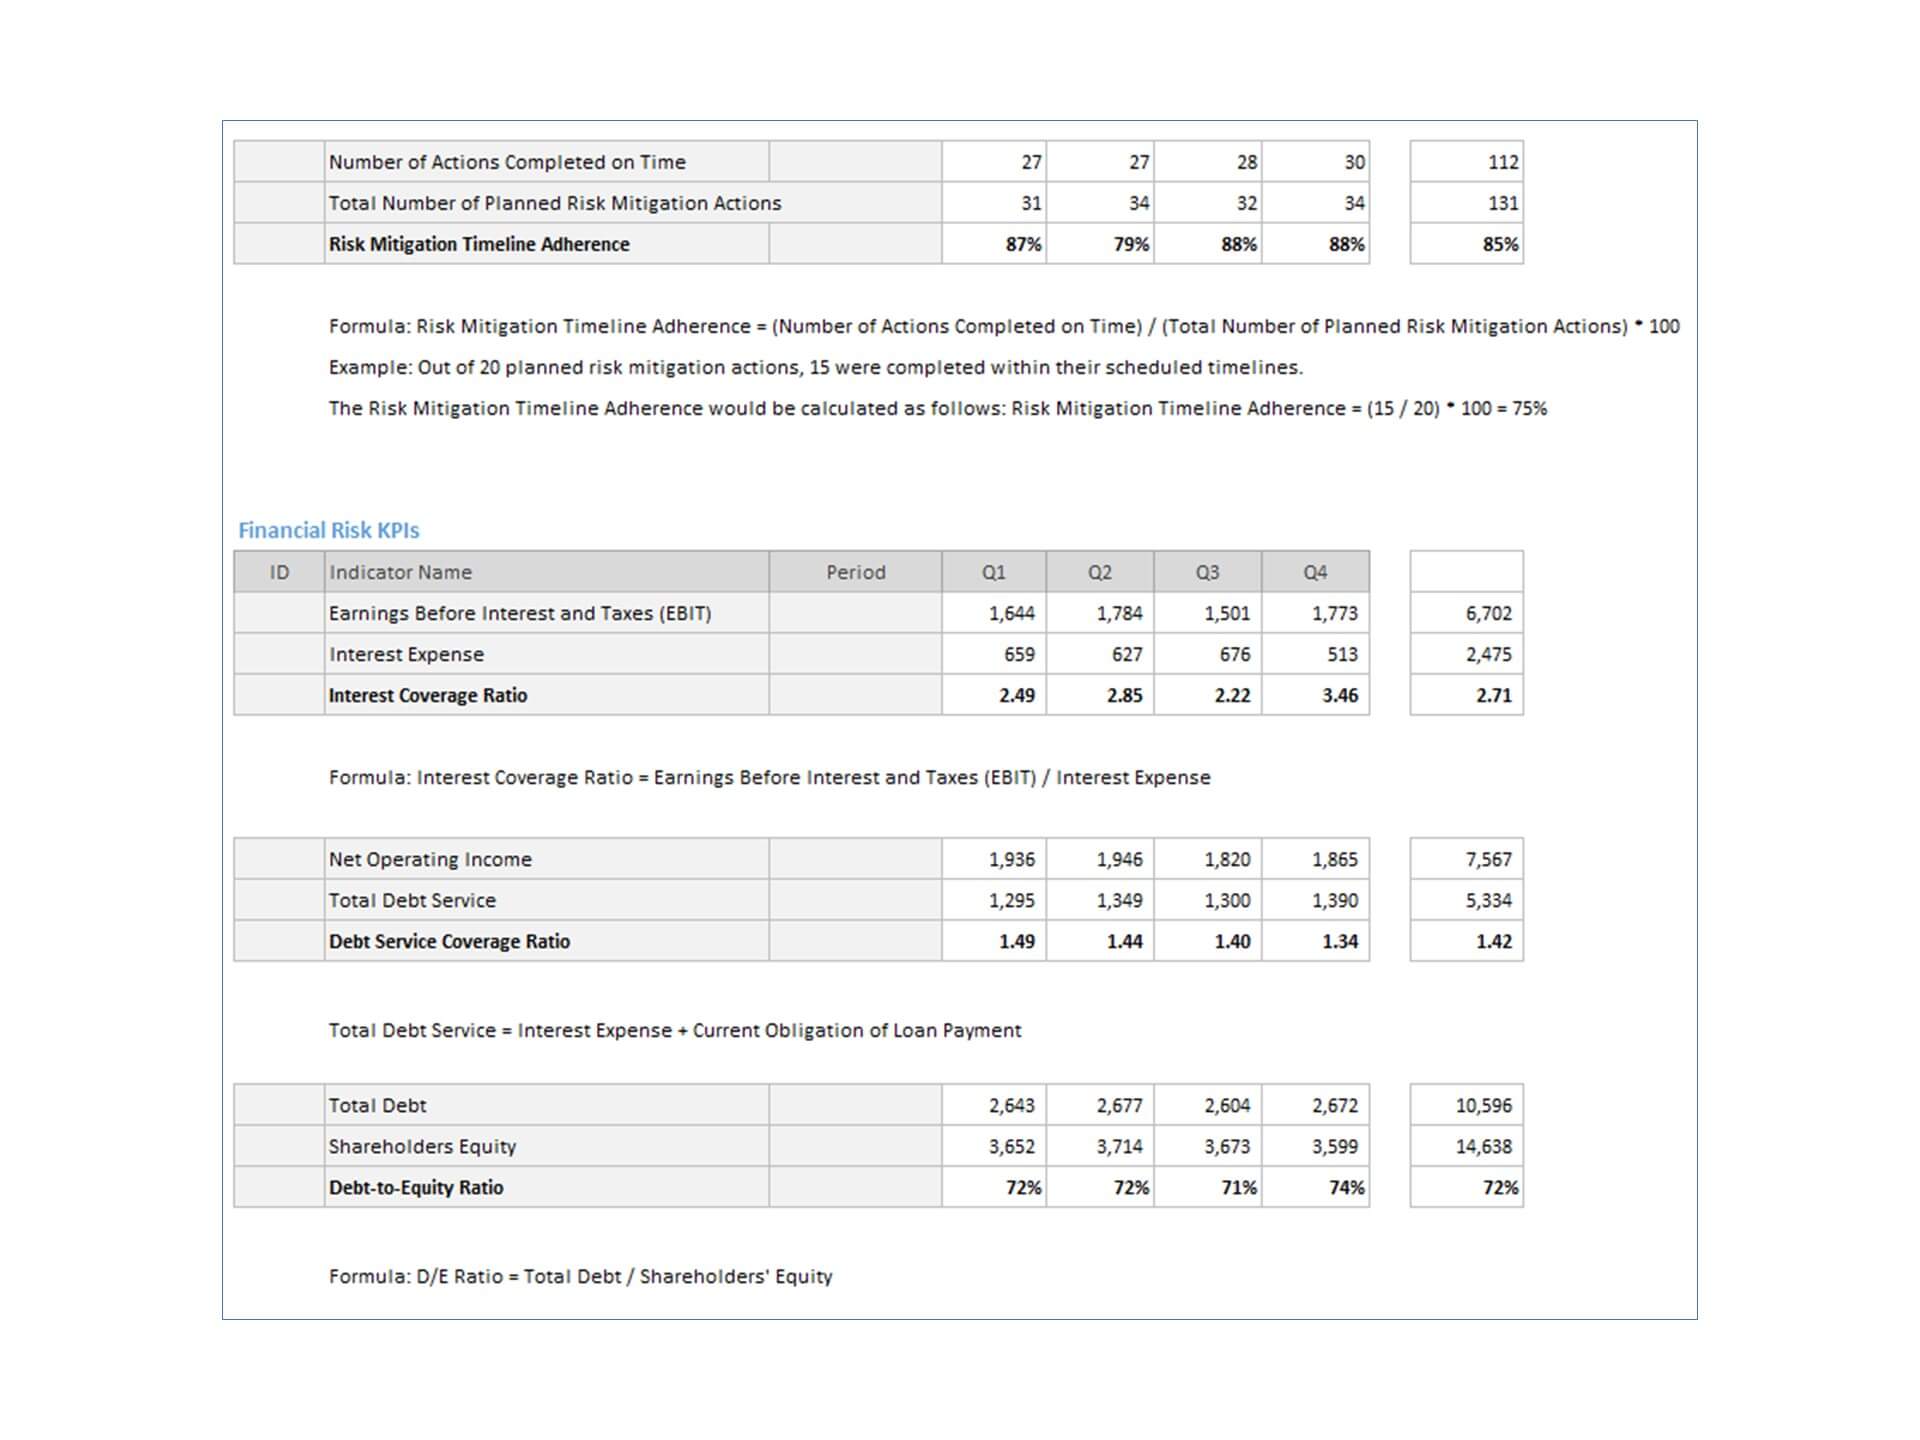
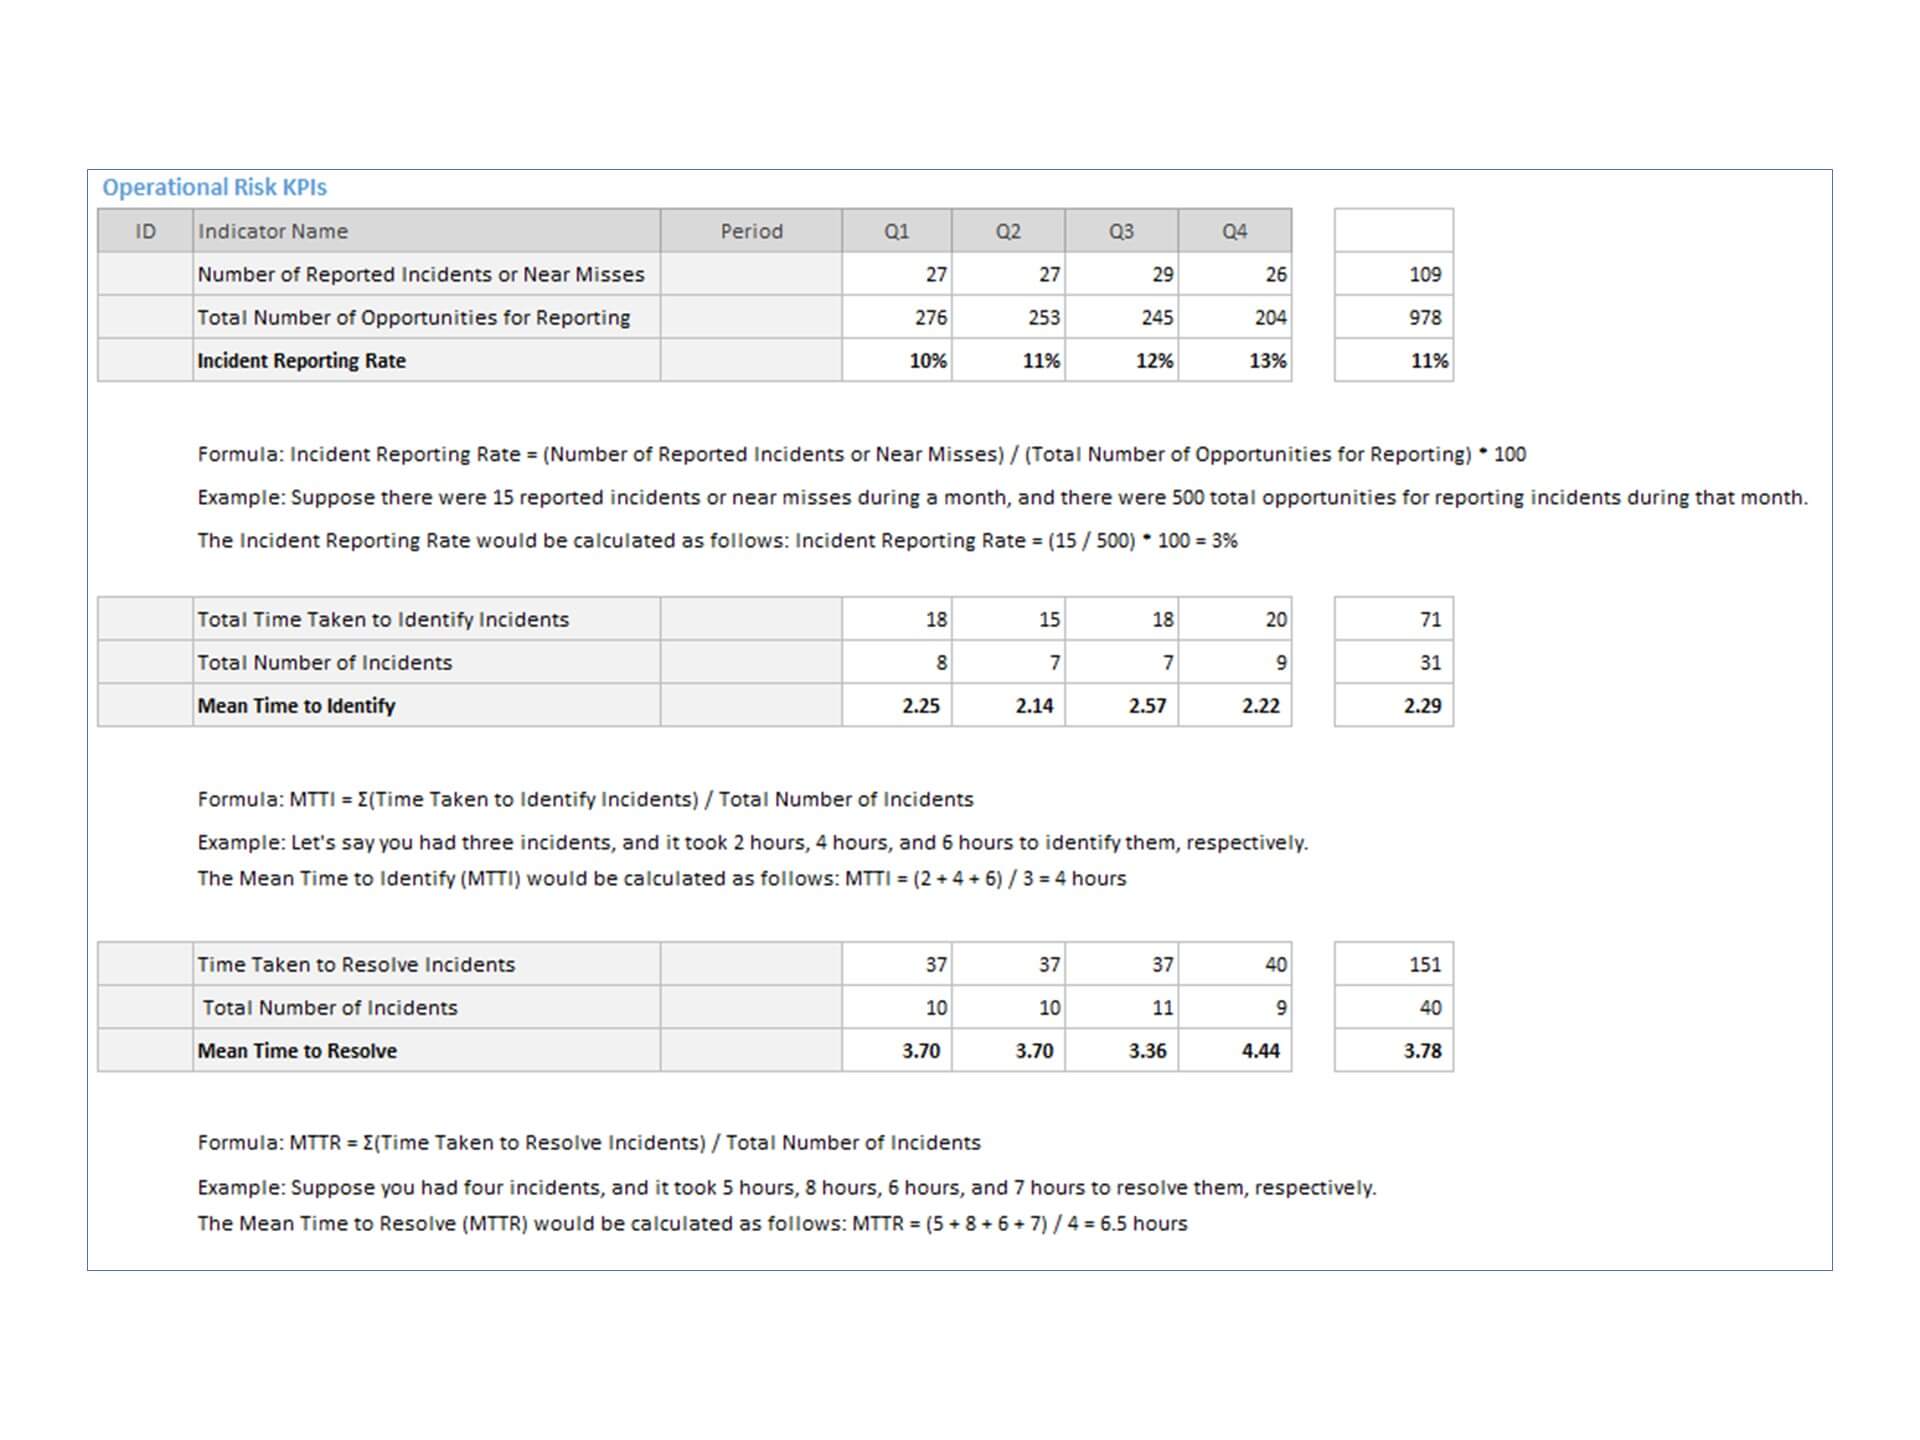
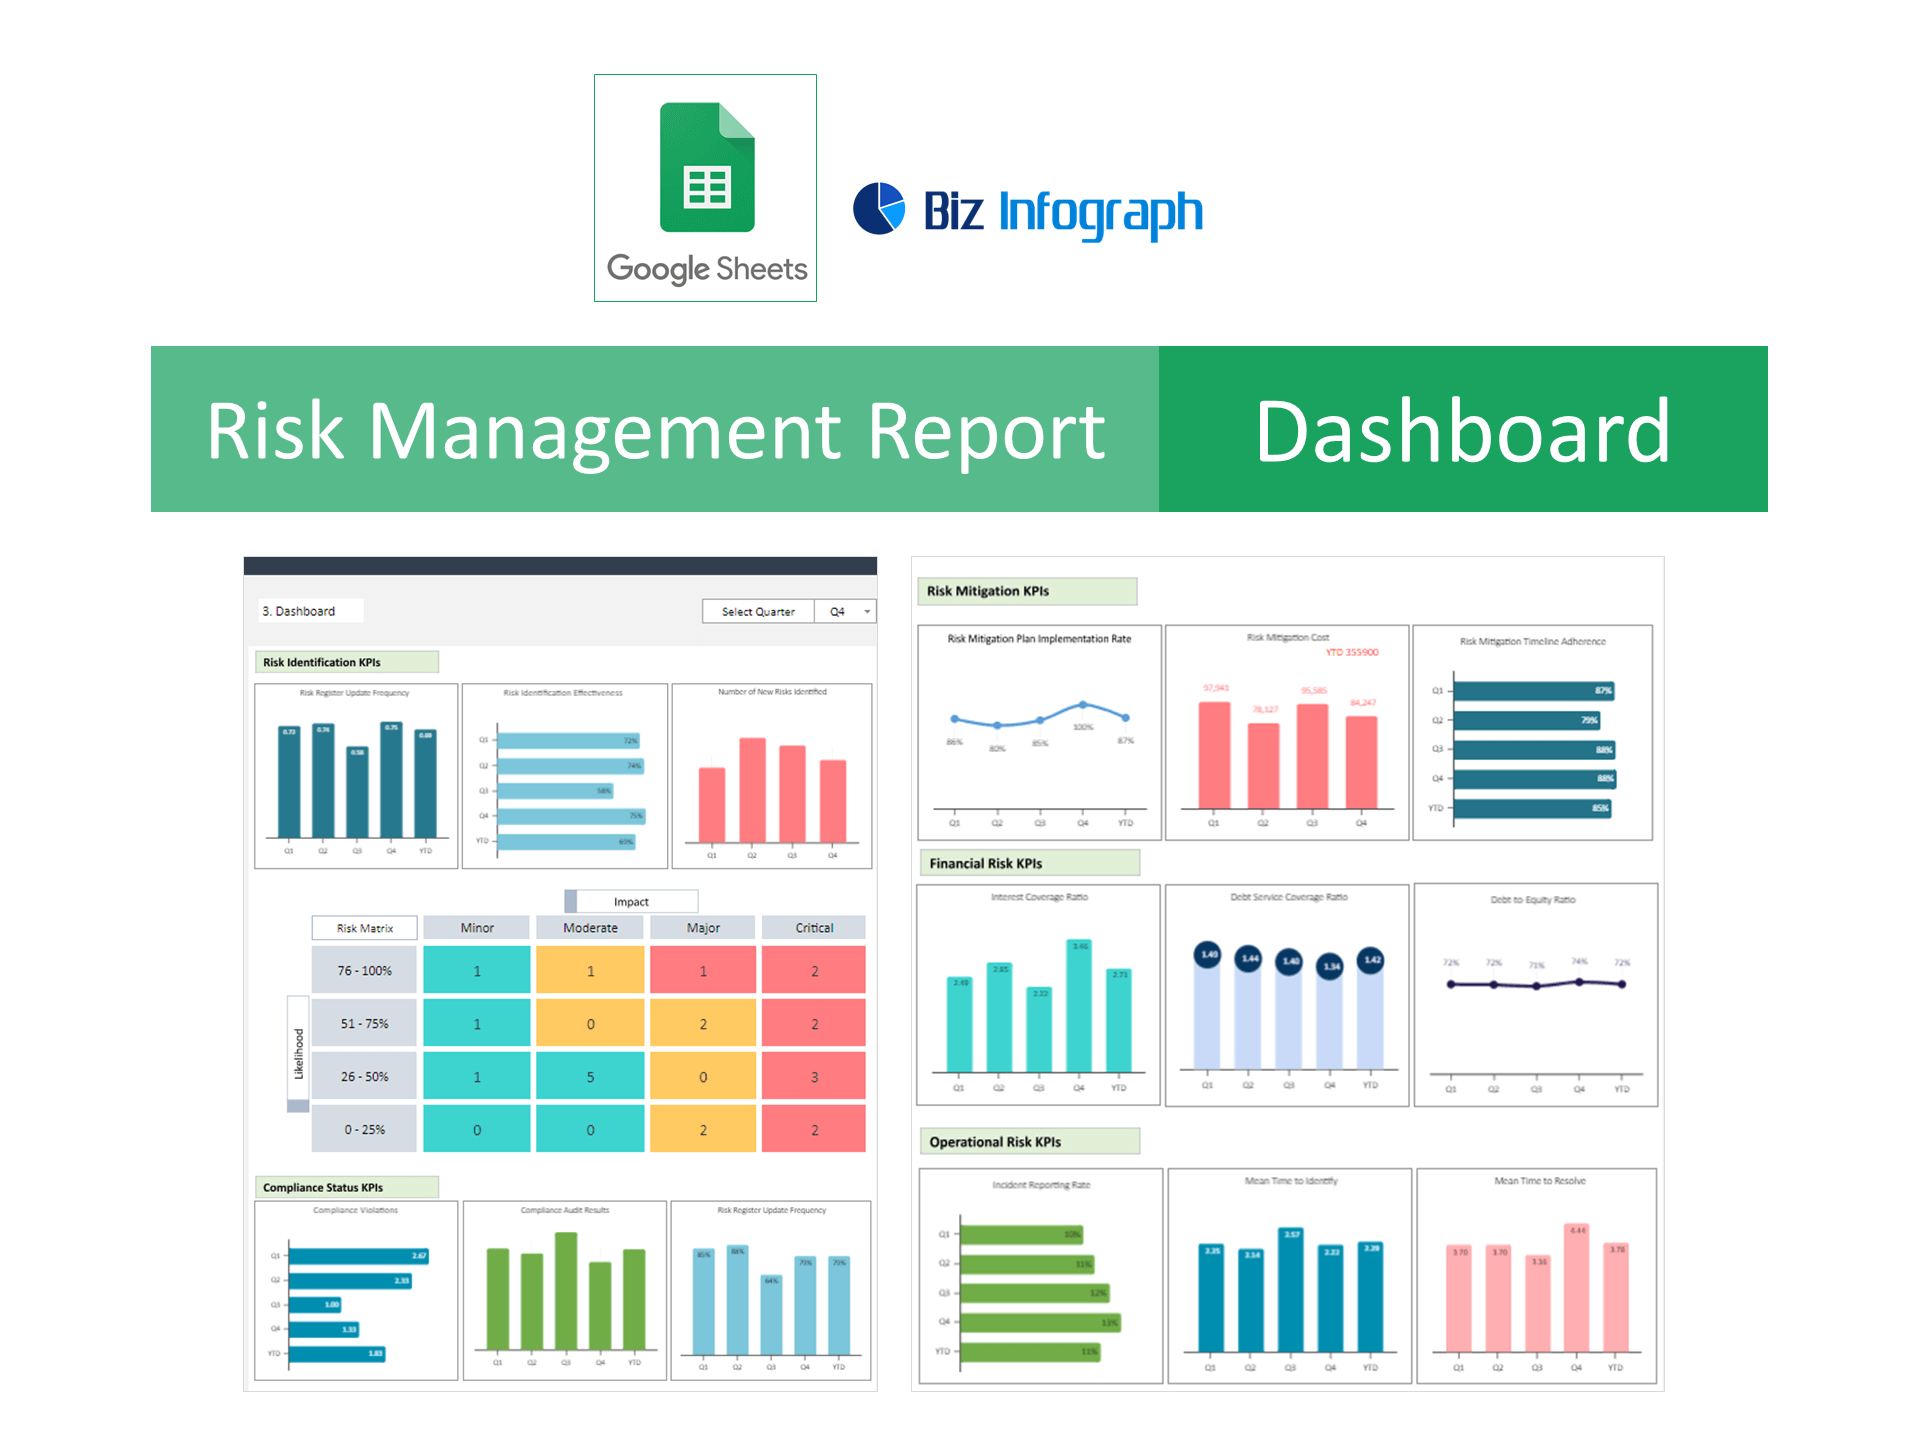
CEO Dashboard - Risk Management Report is an Excel Template that will help you to appropriately organize major business indicators in a single view and present the most important business information to your CEO and team in an eye-catching way. This CEO dashboard visualizes risk management KPIs, metrics, and data.
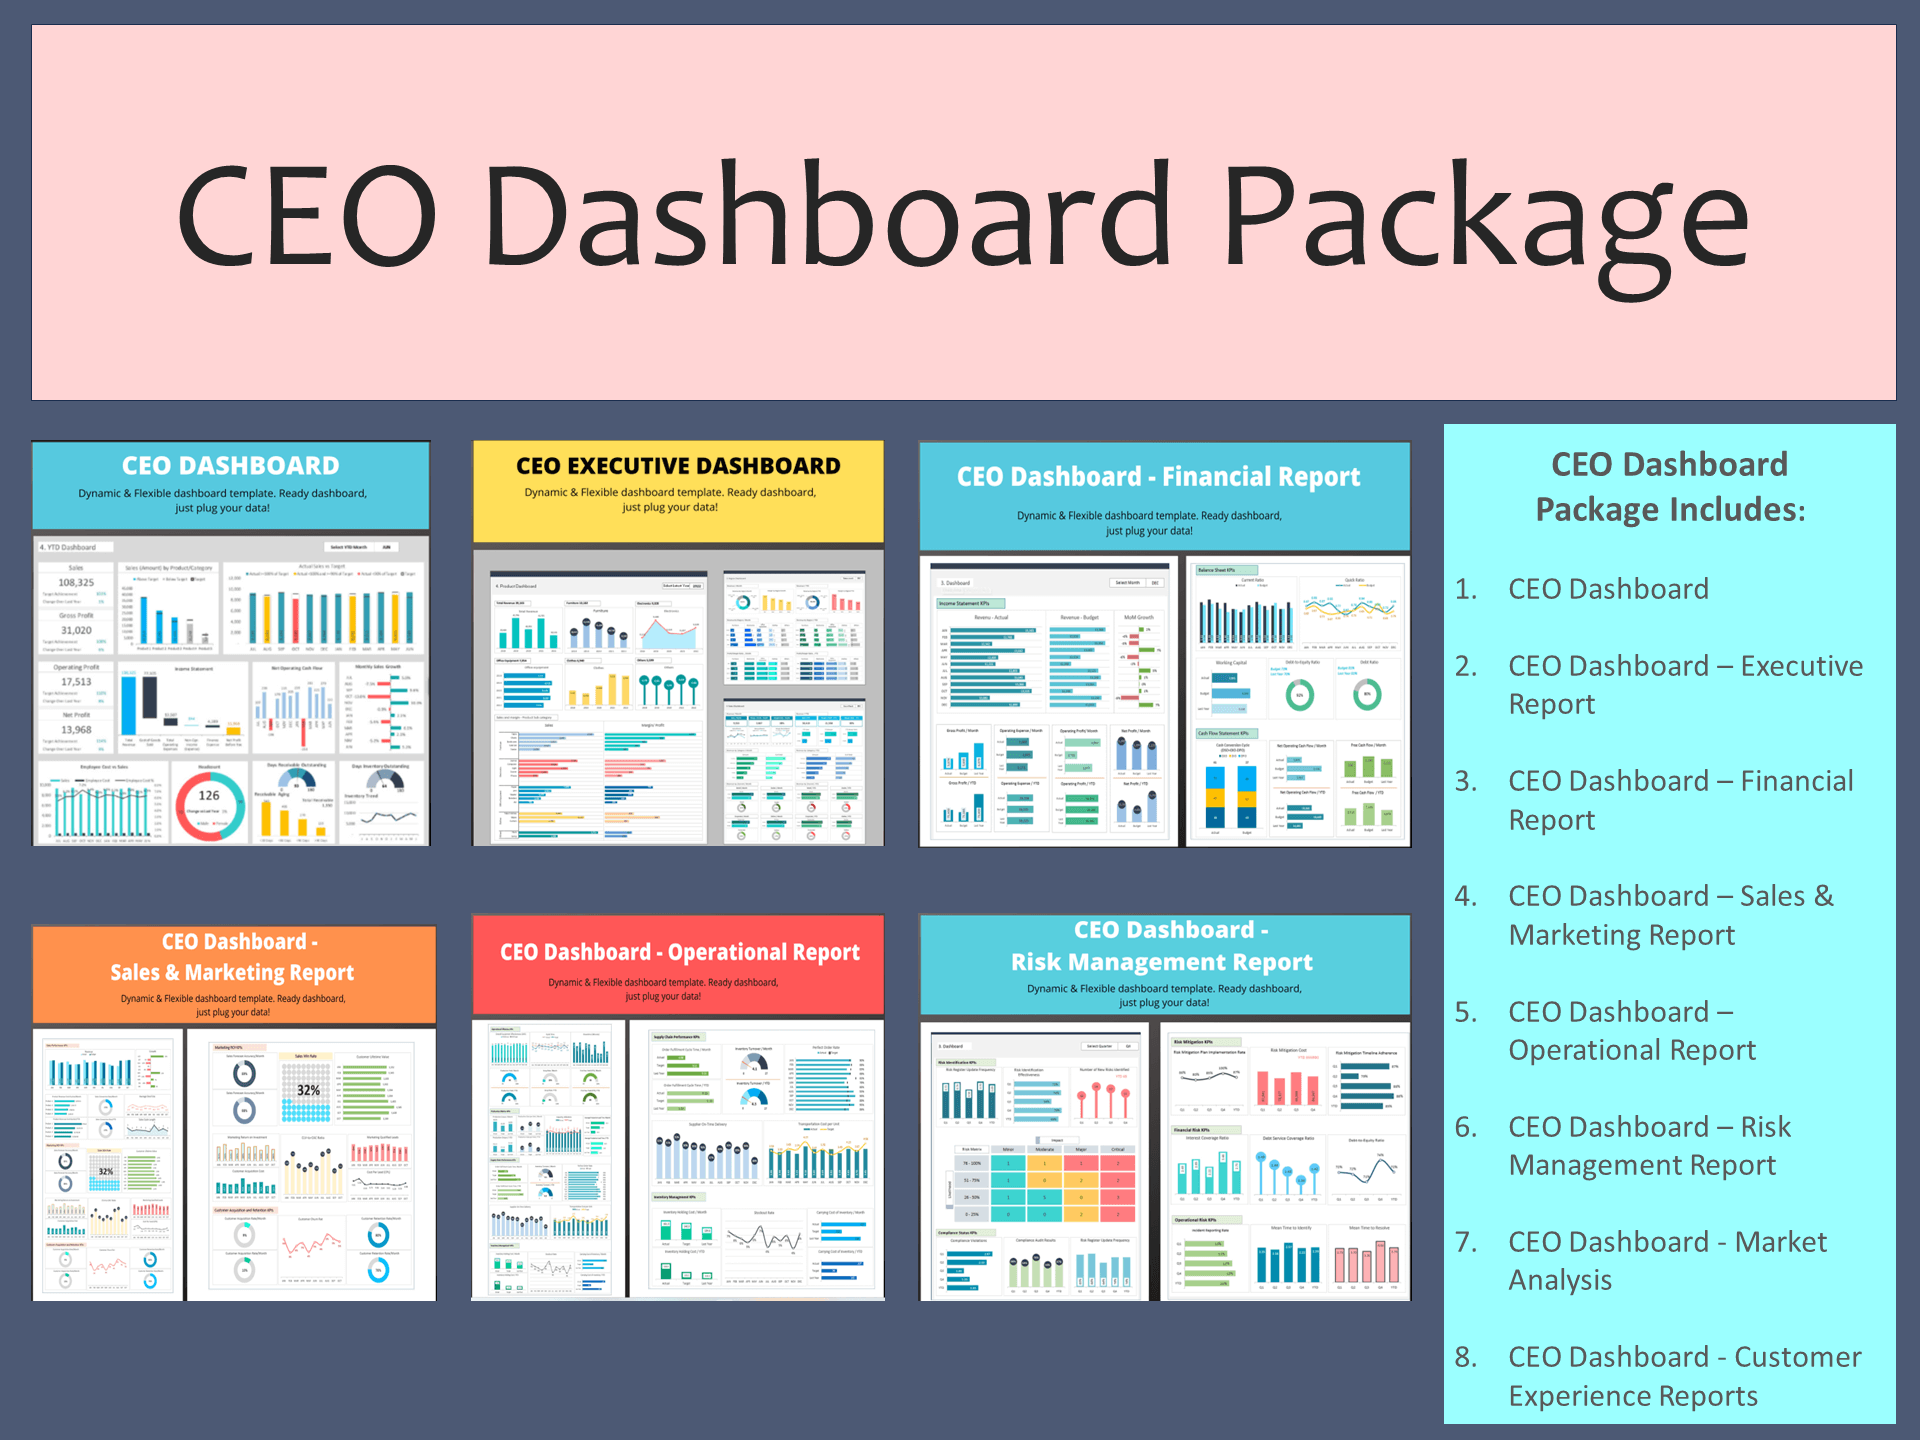
CEO Dashboard aims to give CEOs an at-a-glance clear picture into business and operational performance across the organization. The CEO is responsible for every aspect of the organization from sales, marketing, and financial strategy to human resource management. To gain a wider vision, the CEO needs to embrace the power of digital data with the right tools like a professionally designed CEO Dashboard.
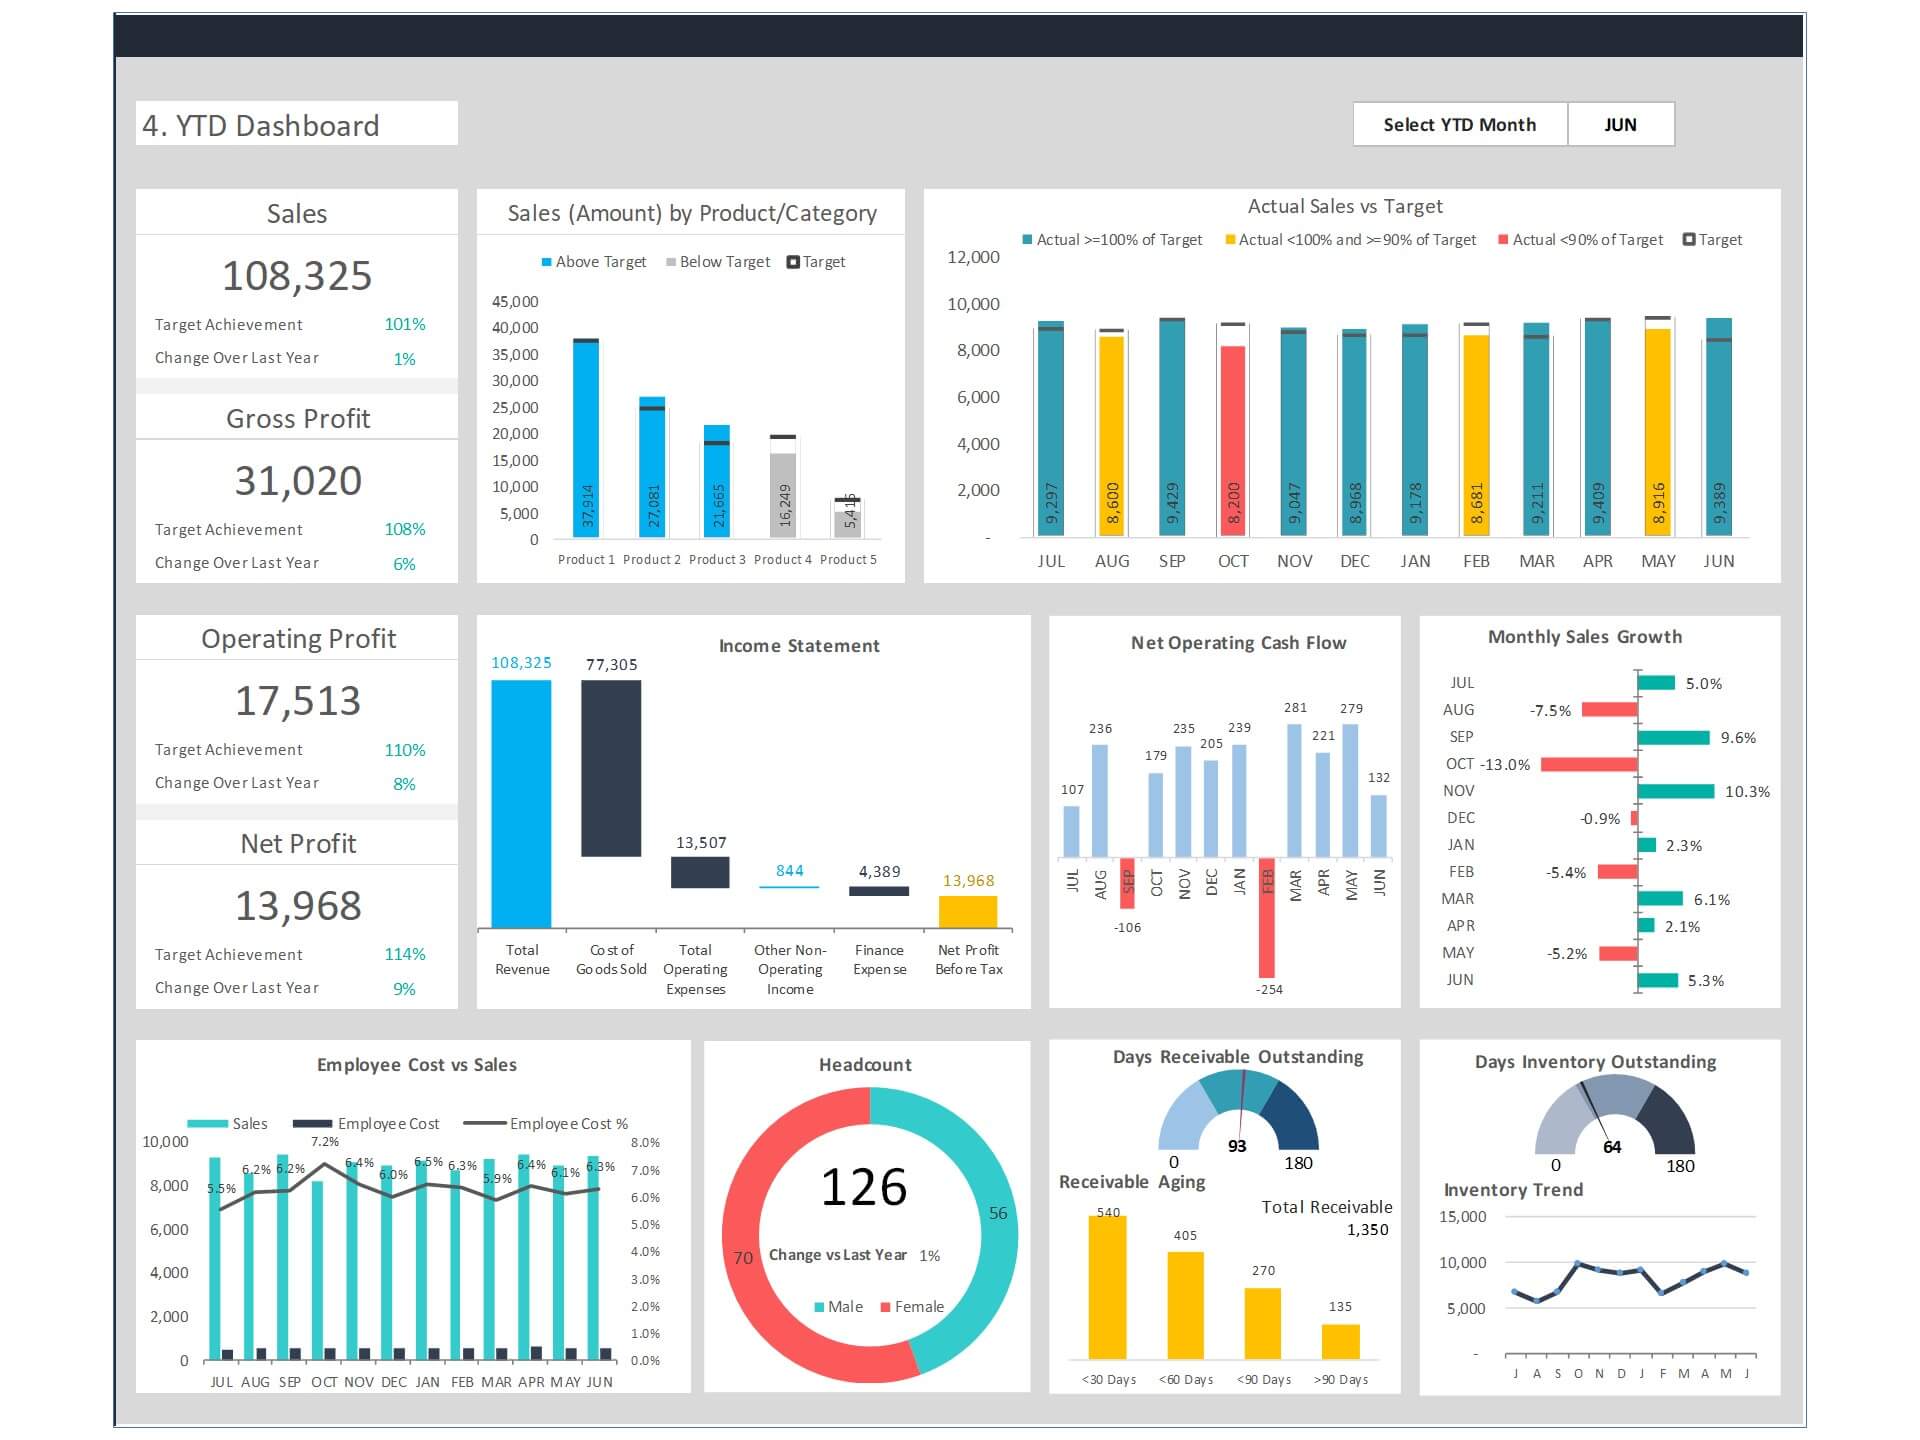
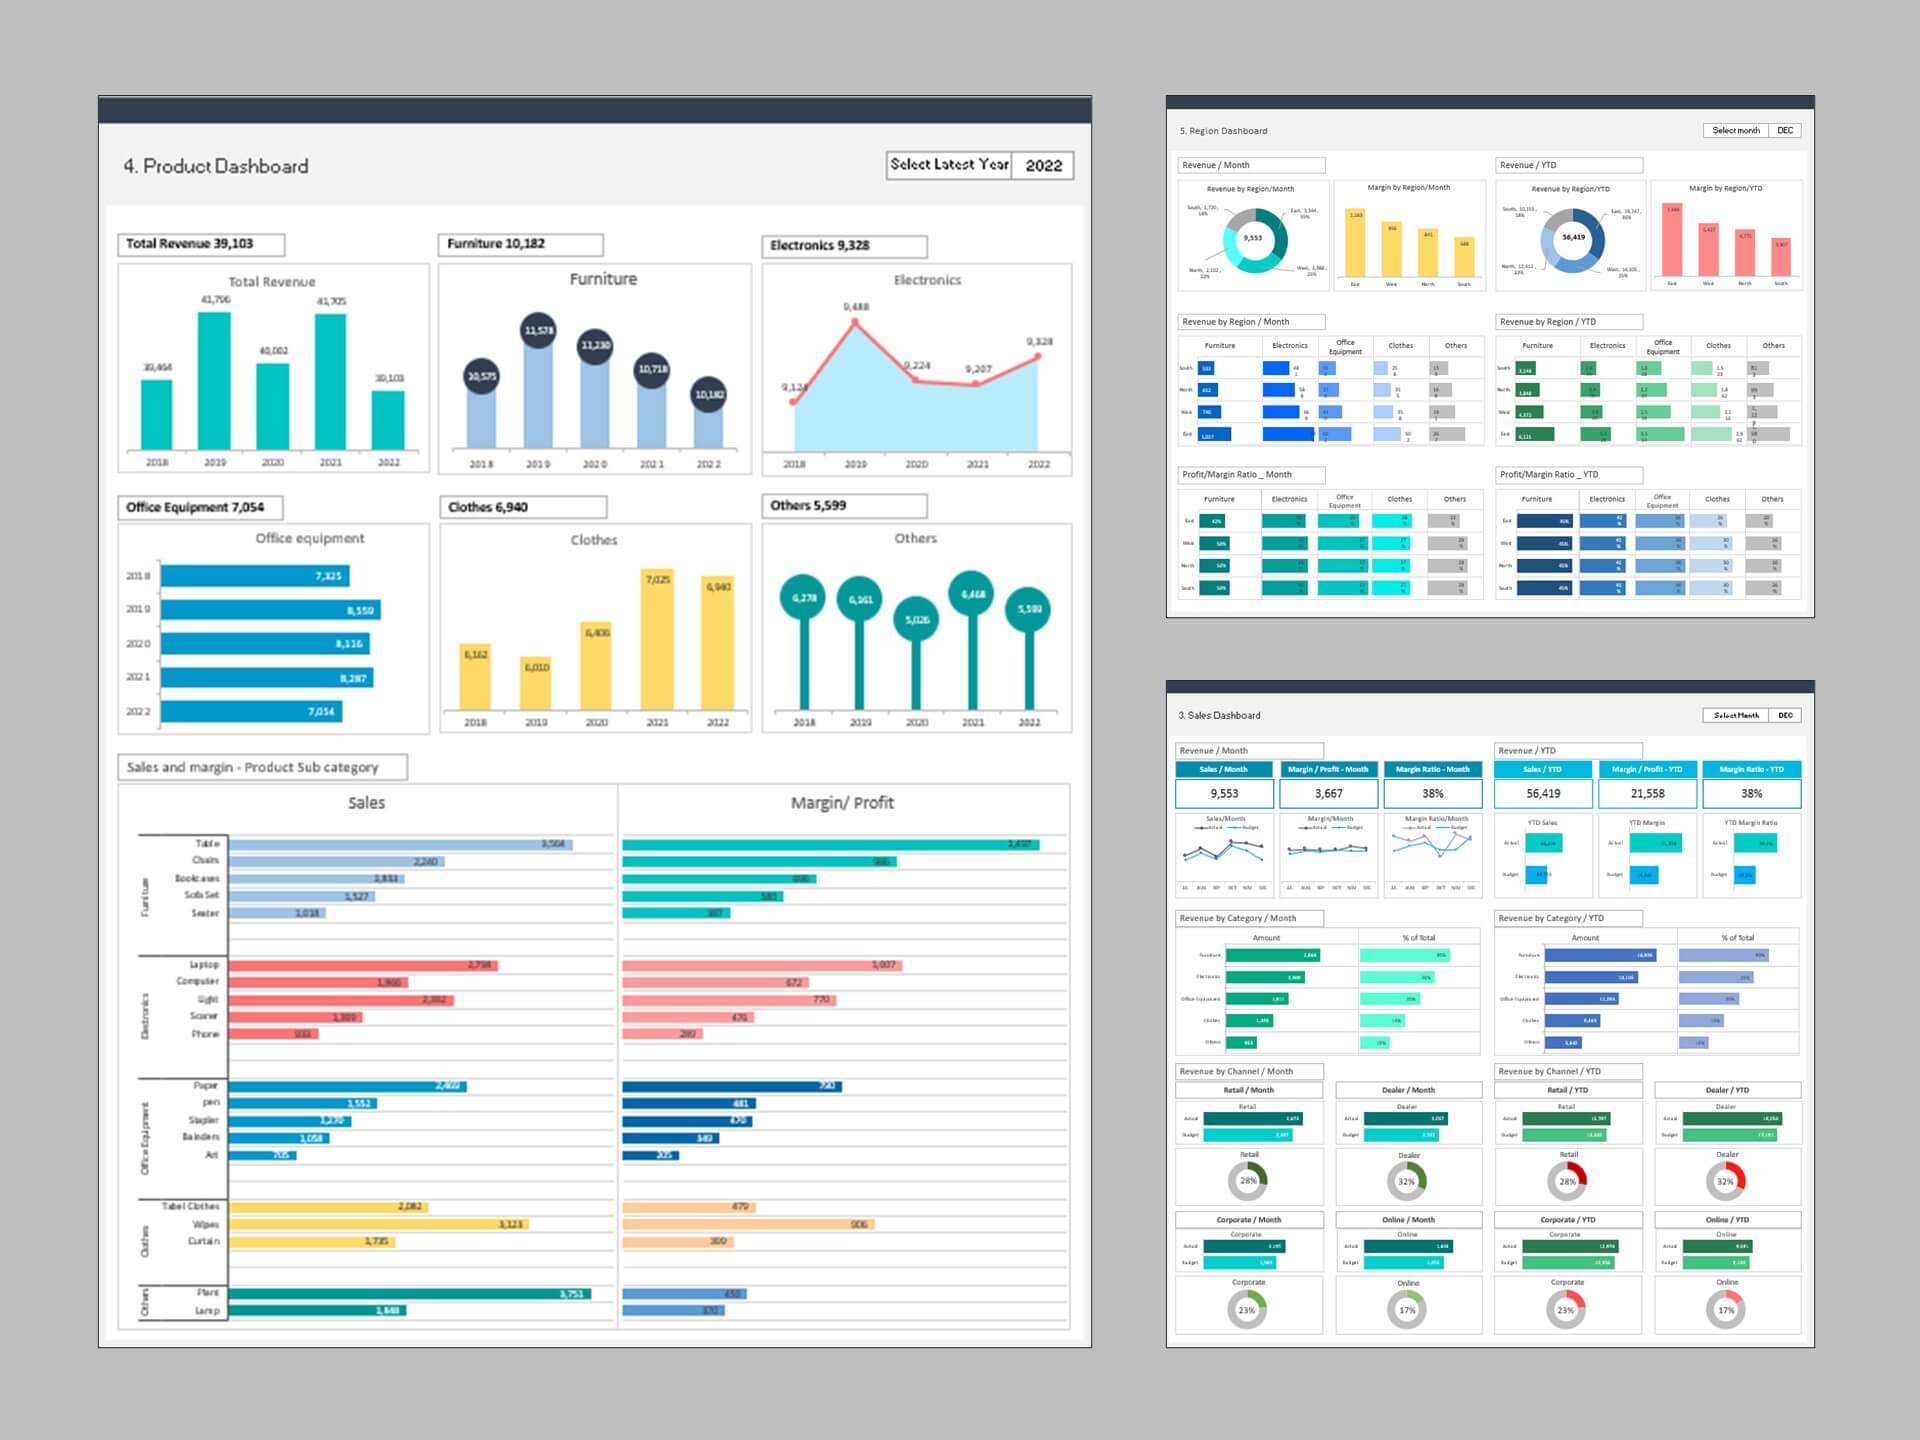
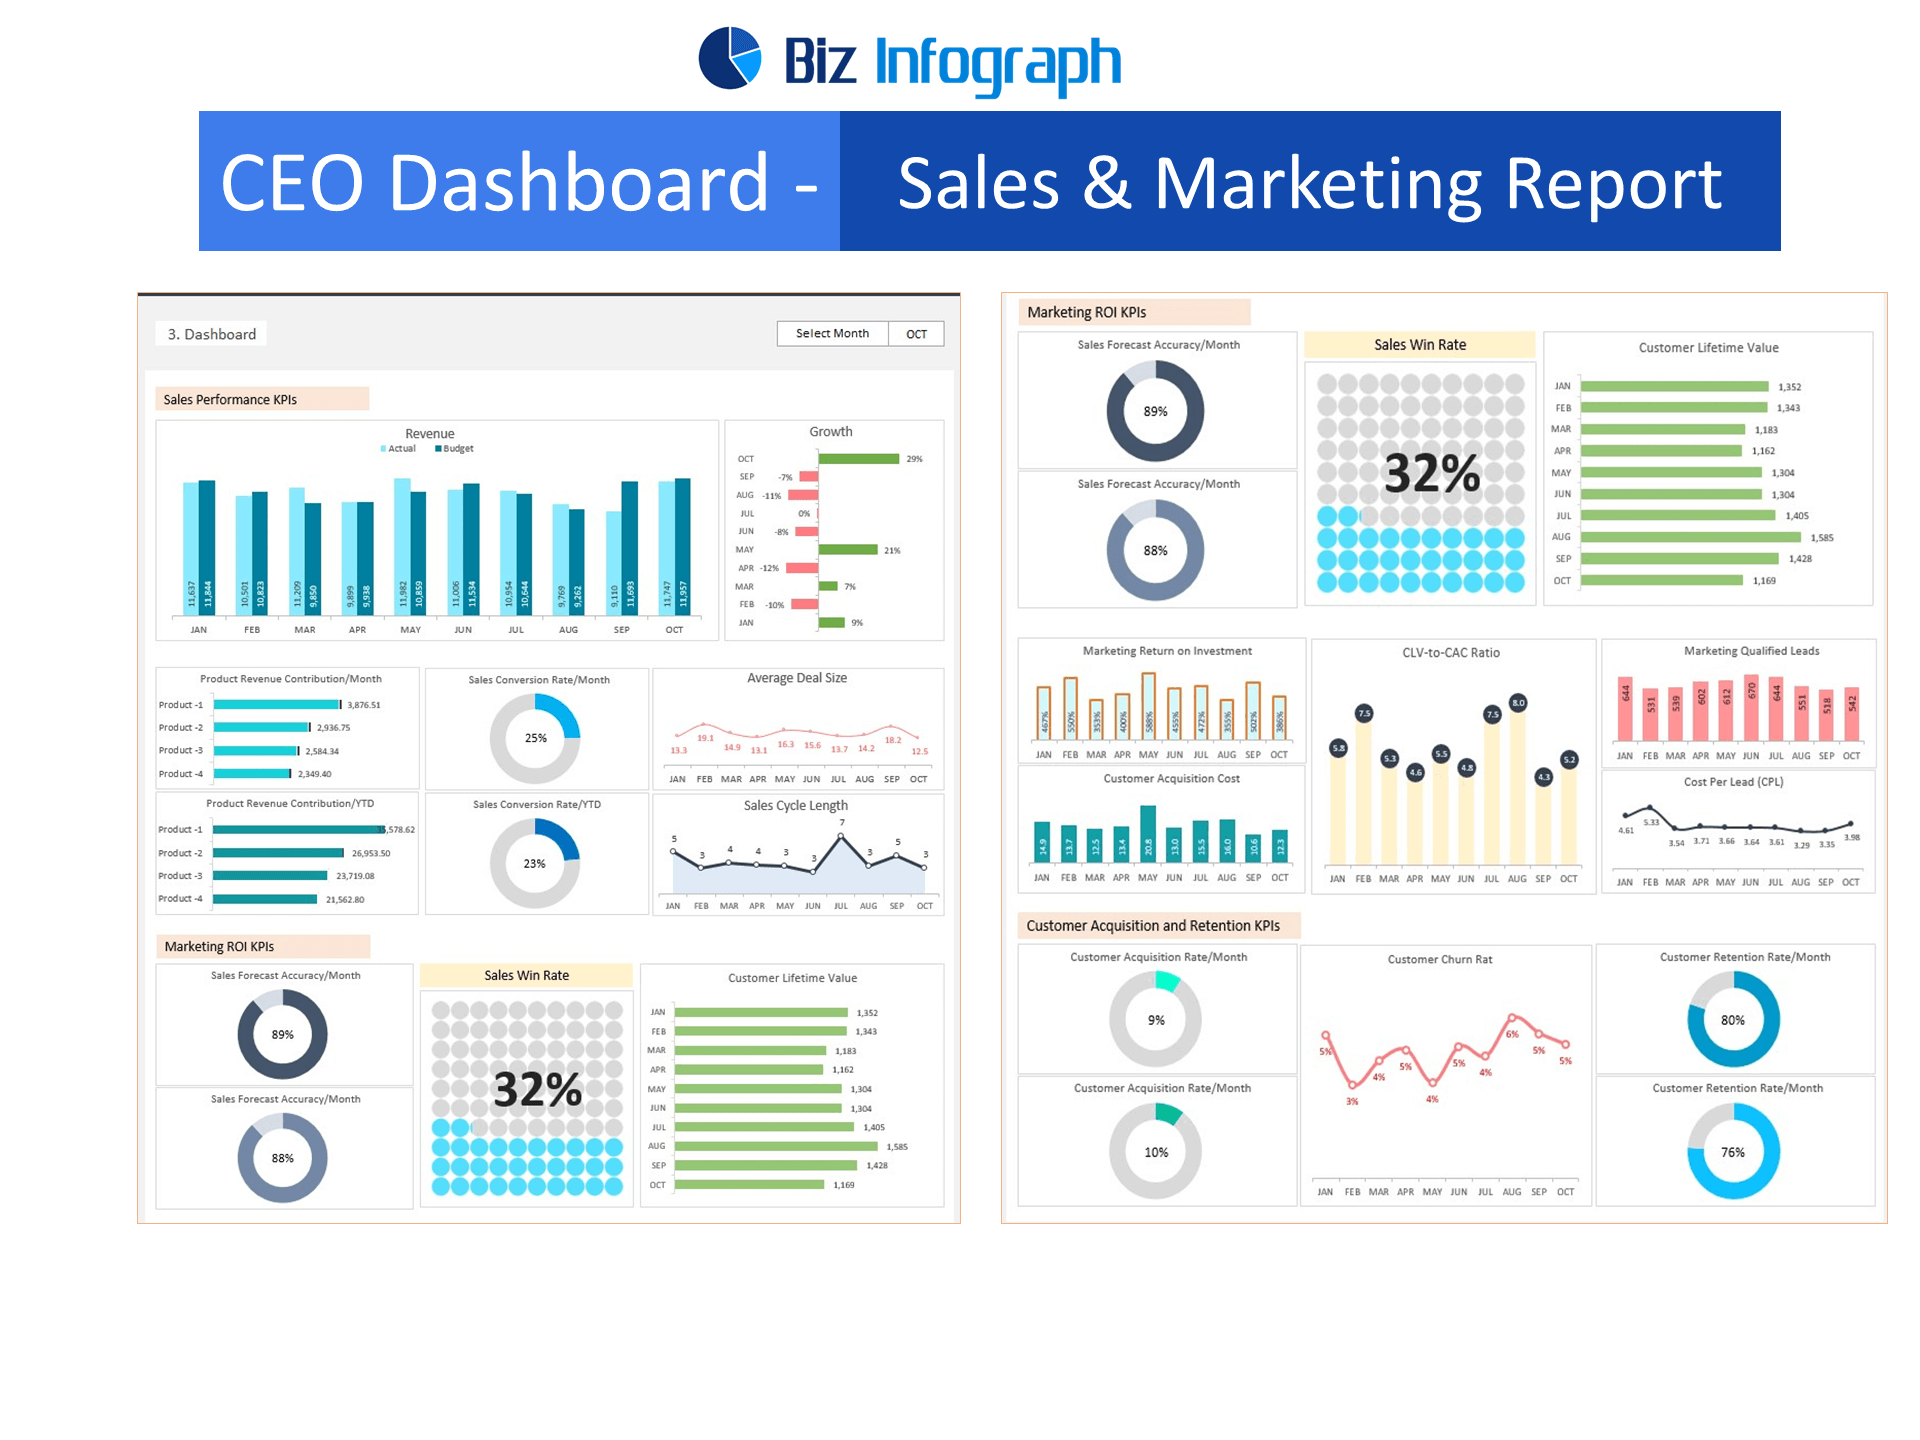
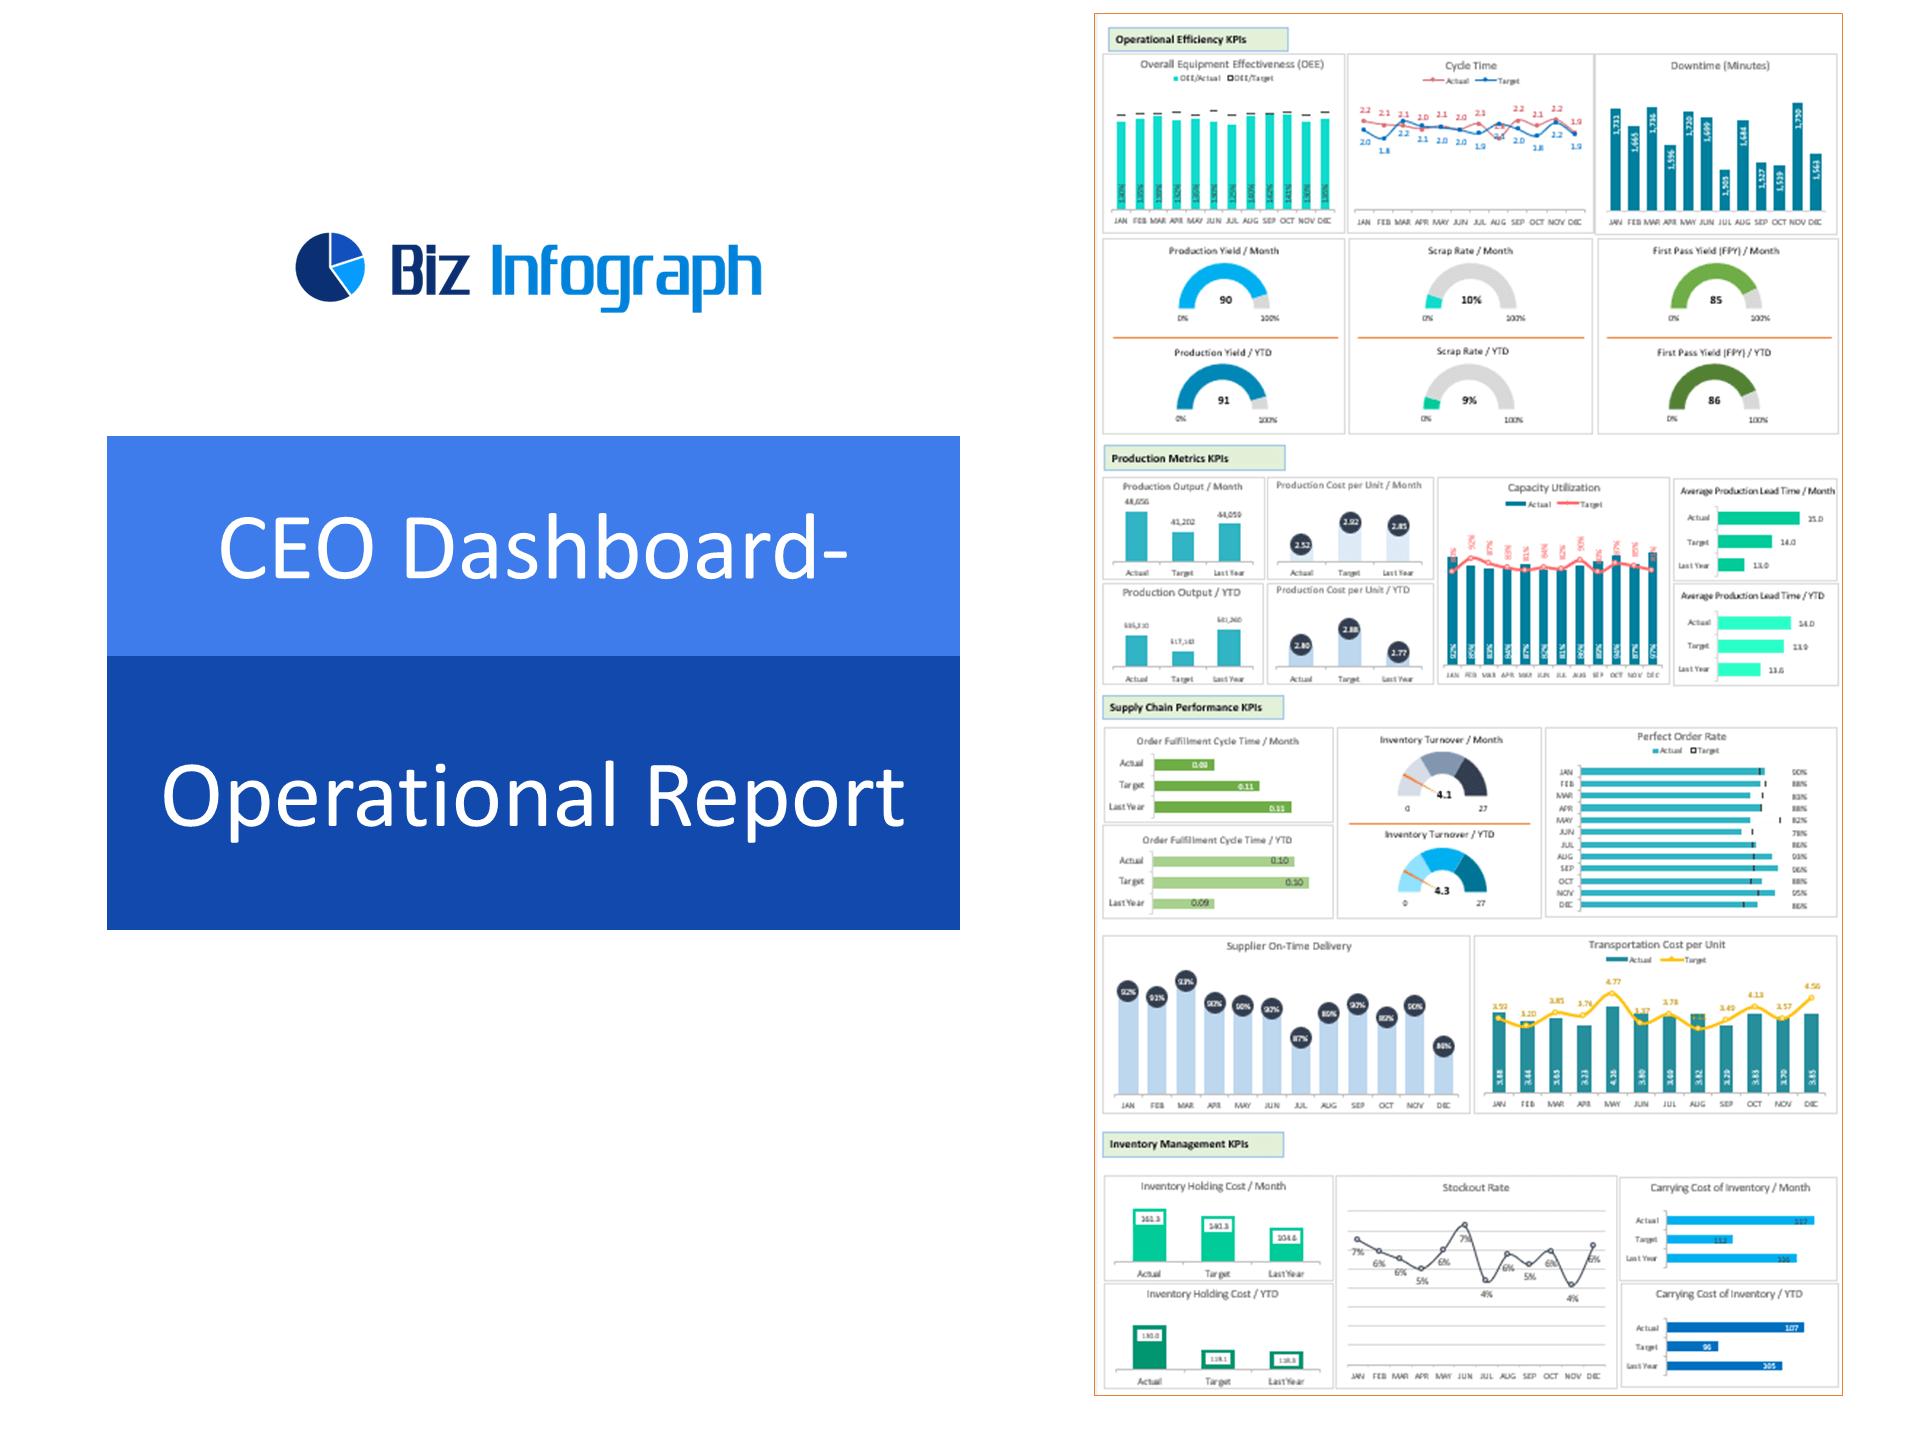
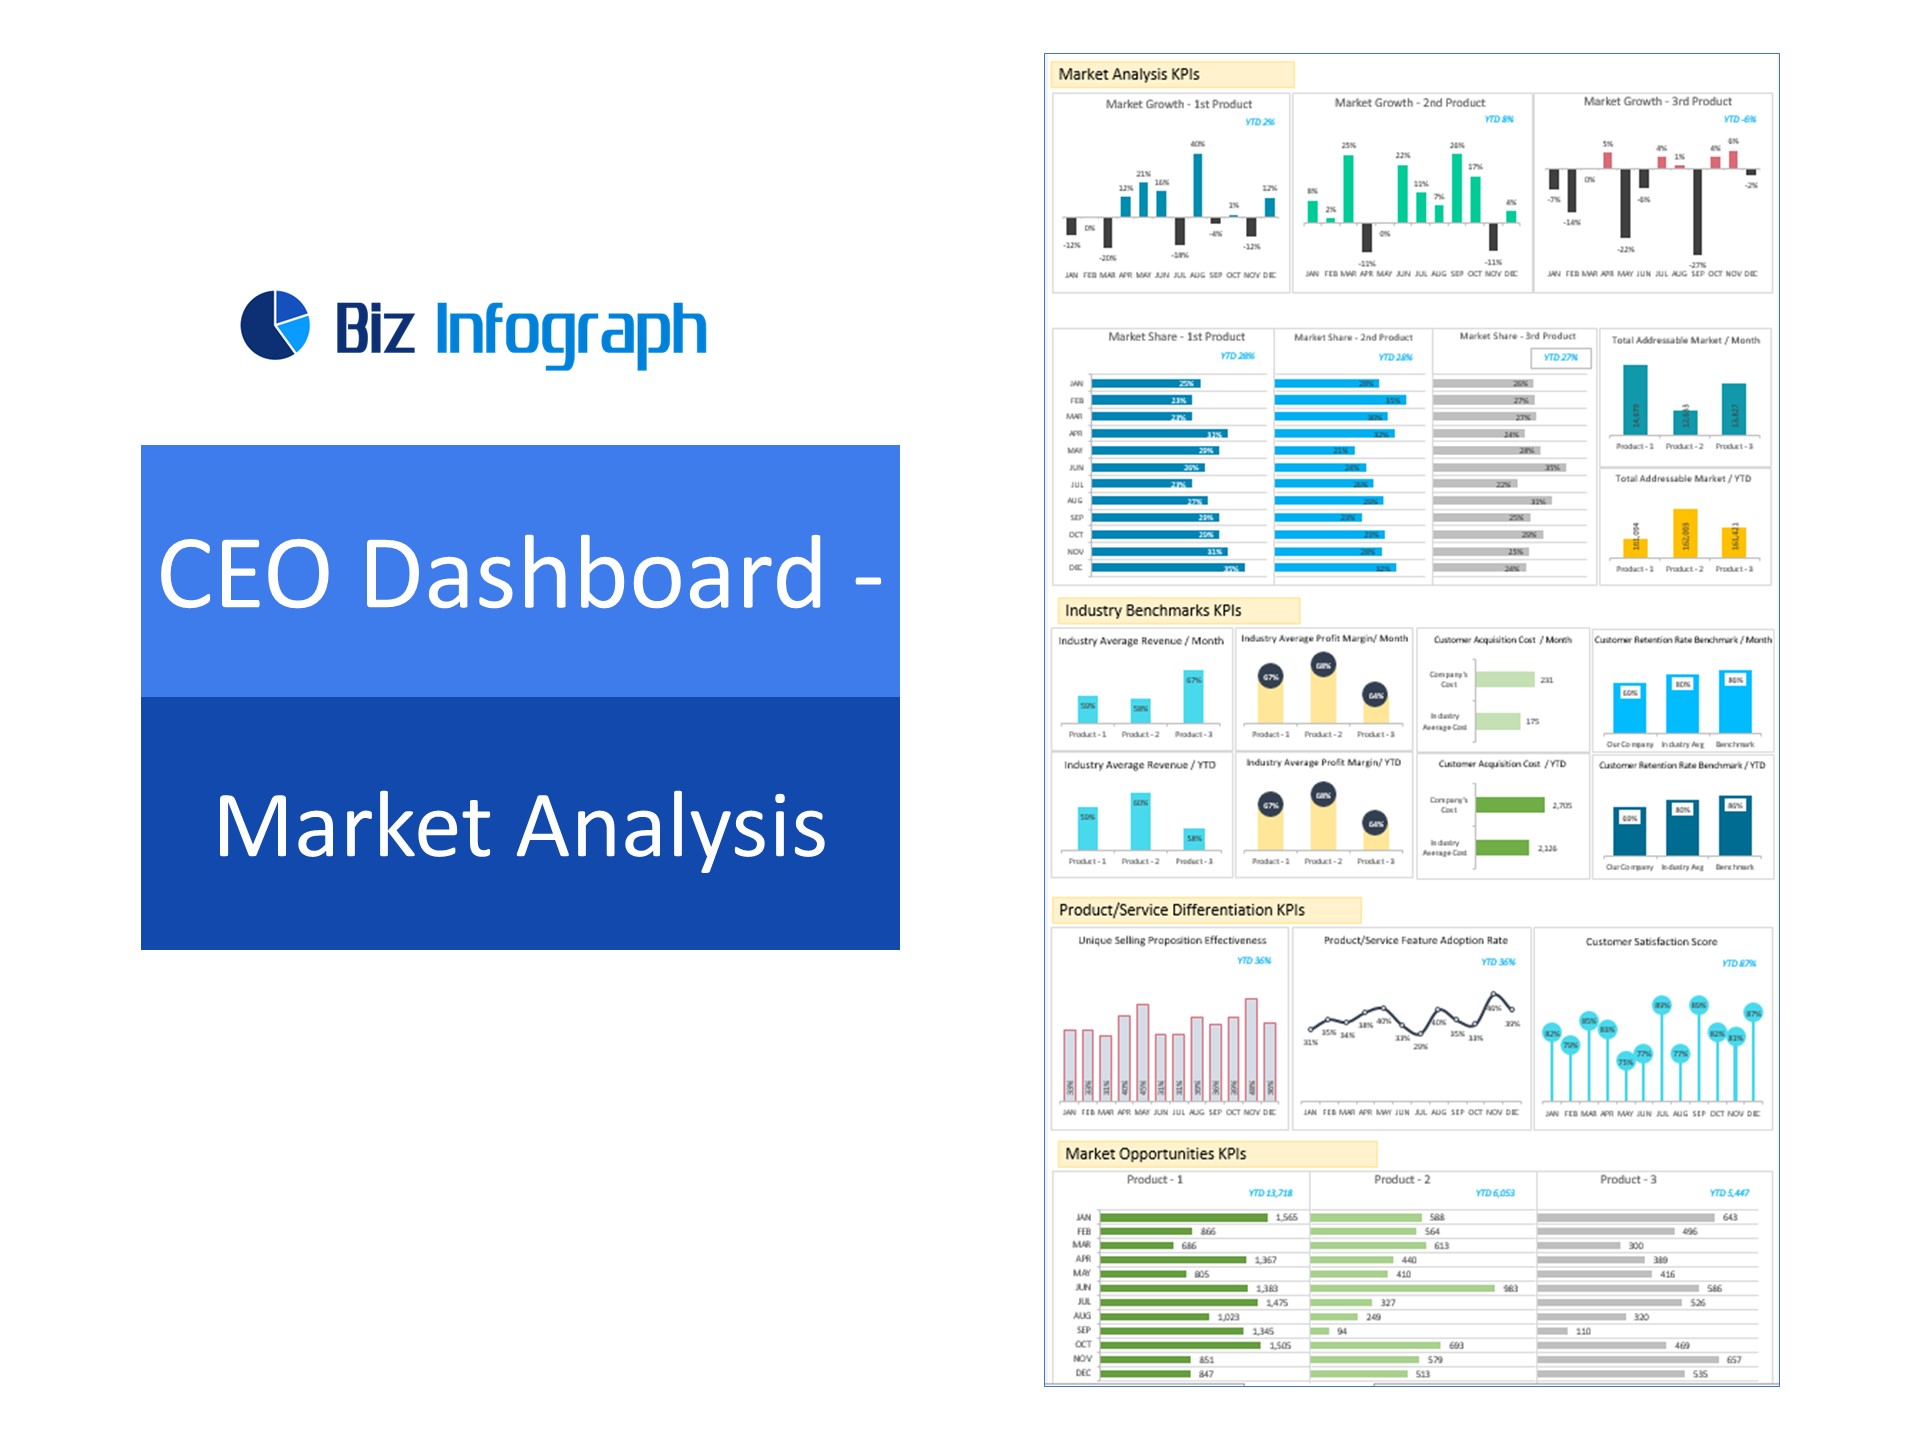
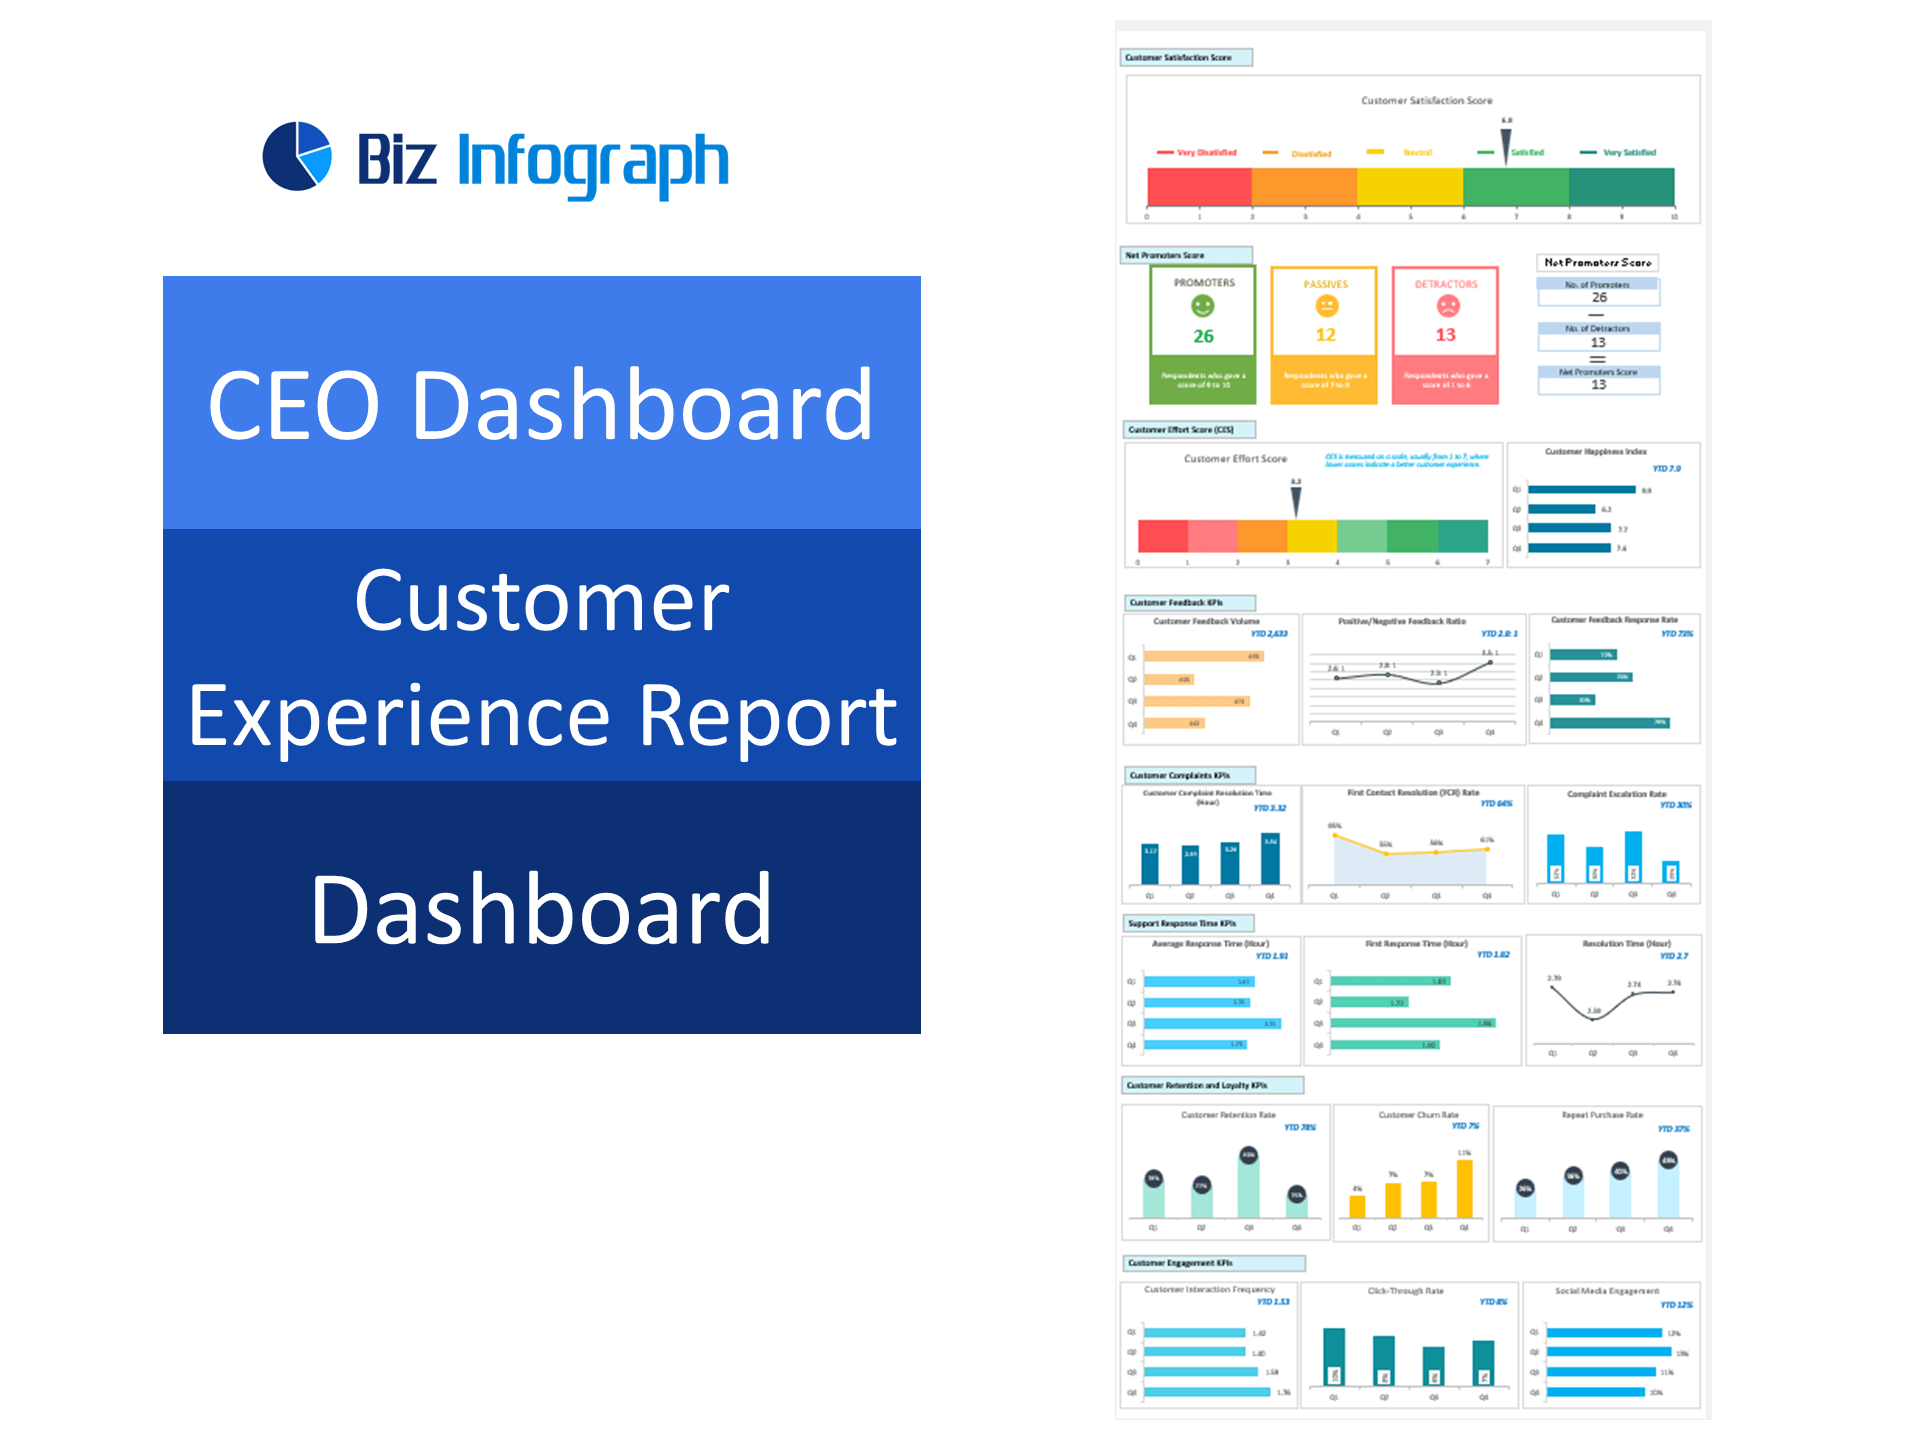
The CEO Dashboard helps equip the modern CEO with a high-level overview of the most important CEO metrics for better and improved decision-making. This CEO dashboard template in Excel covers key business metrics like Sales details, Product performance details, and Region performance details.
Key Features:
- Provides key business insights for CEO regarding risk management results
- Fully editable, easy to use, template with sample data
- Eye-catching design and customizable
- Change the sample data with your data
- Spreadsheets ready for printing without Biz Infograph logo
- Consolidate key business performance indicators in one dashboard
- No monthly fees
- Immediate download
- No VBA, no Macro
- No installation necessary
- Professionally designed
What is included in this dashboard template?
- Just plug your data, the rest dashboard will be ready instantly and start using.
- A guide to unlocking all the elements in the dashboard
Professional Support:
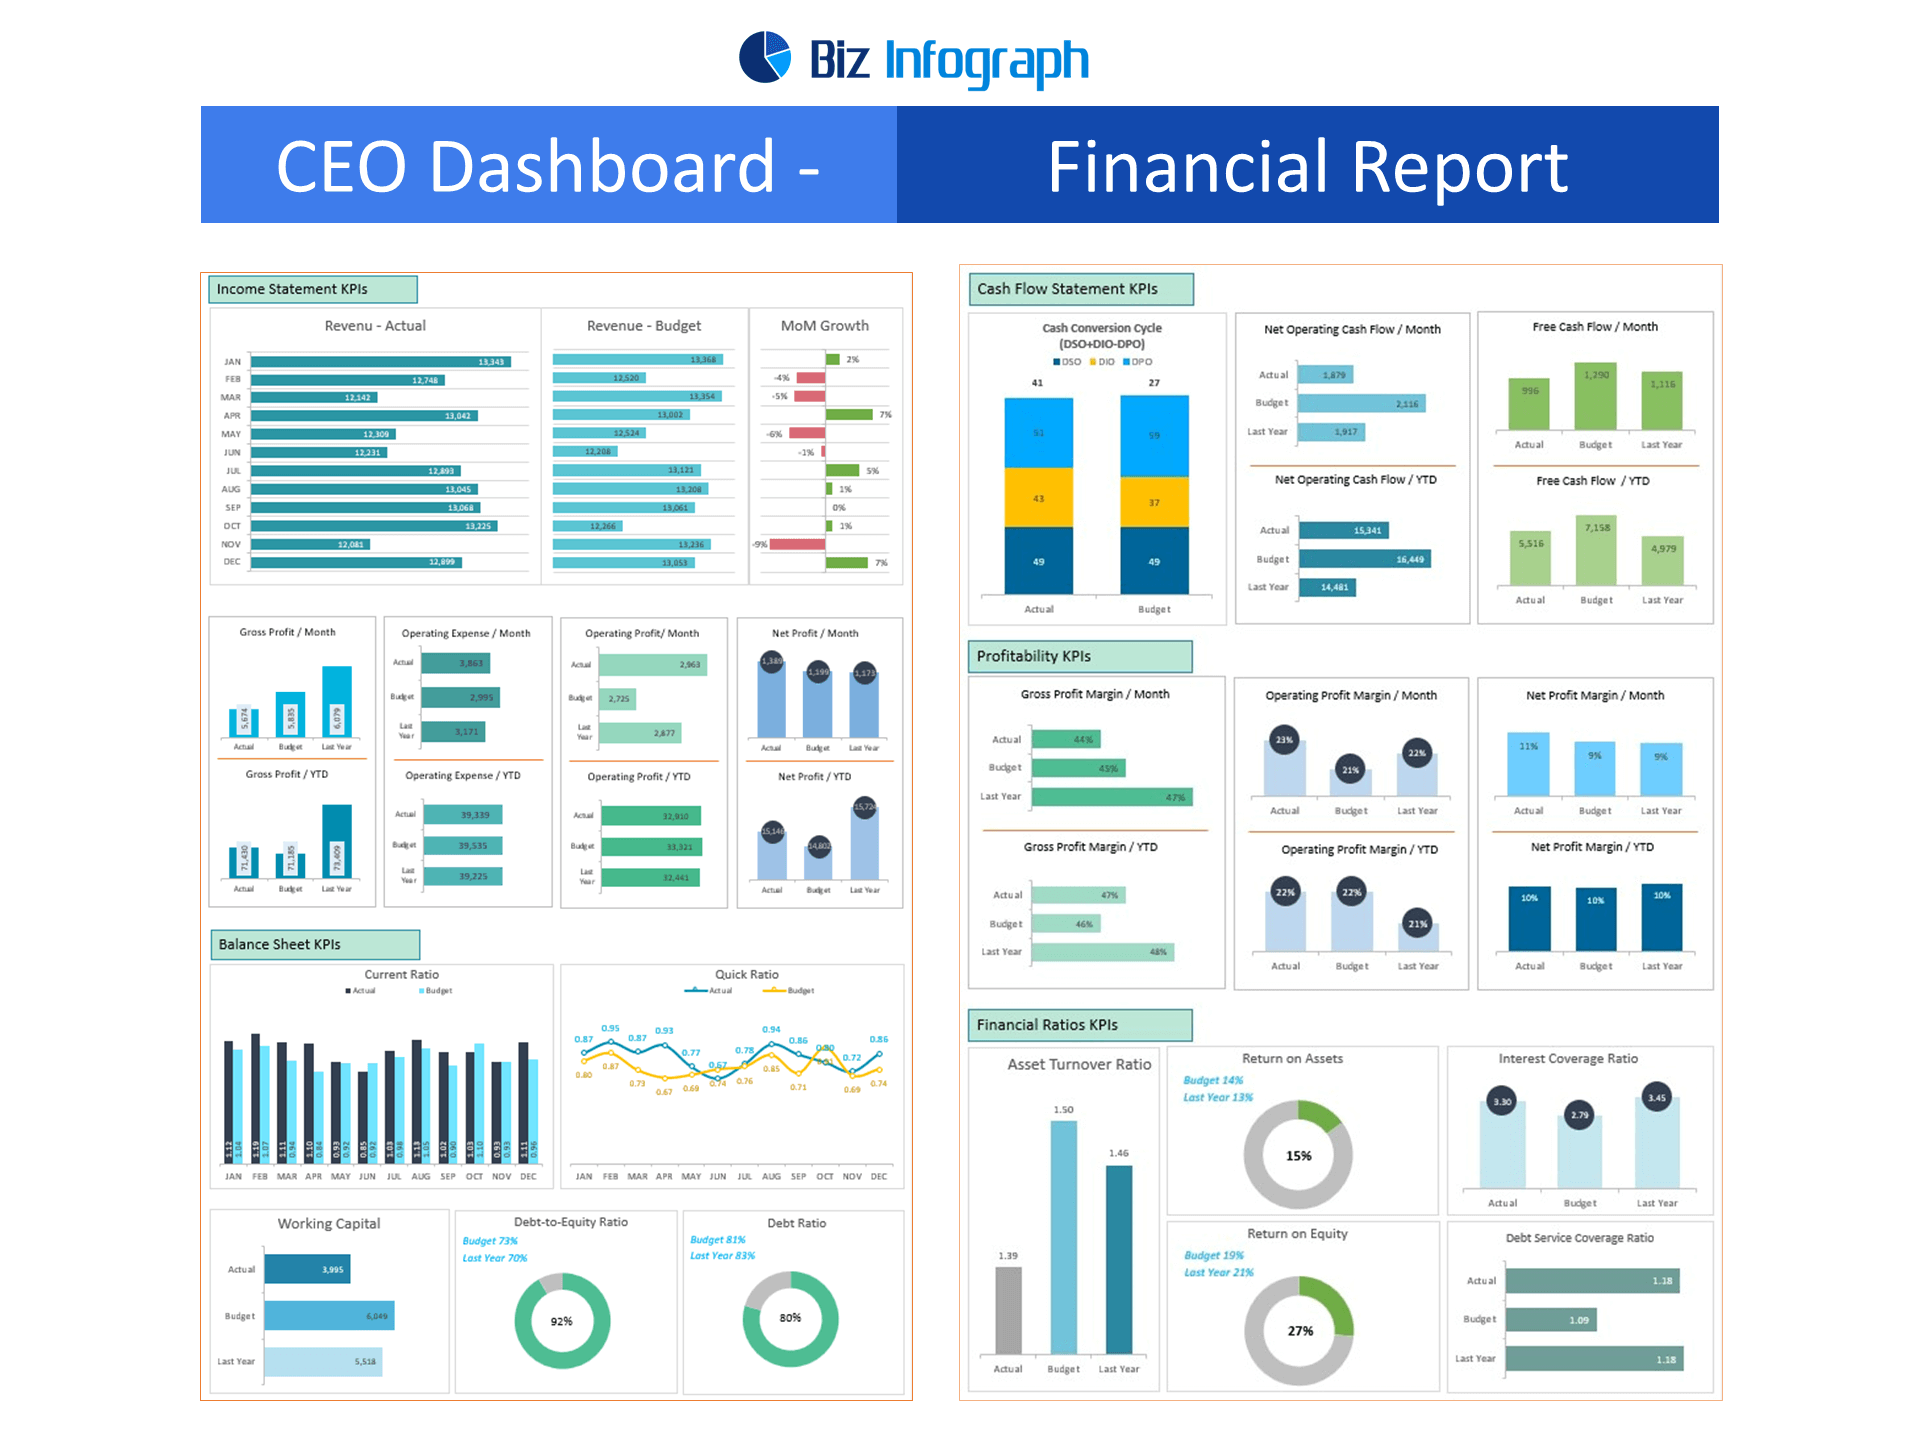
- Video tutorial guide on how to navigate and use CEO Dashboard - Financial Report
- Professional service to customize dashboard template in Excel as per business need
- Help and support in post-purchase
- Payment secured by Stripe and PayPal (no PayPal account needed)
A brief guide to using the dashboard template:
- Open the dashboard template
- Go to the ‘Indicators’ menu – choose the start month of the fiscal year (i.e. Jan, Feb, Jul, etc.).
- Go to the respective Dashboard page and select the relevant Month to see the performance.
- Each page is ready for printing – just press CTRL+P
This Excel dashboard template is password-protected to avoid mistakes, such as accidentally deleting formulas. When you complete the purchase, the password will be available.