Sales Reports Excel Template: Empowering Business Insights for Success
In the ever-evolving world of business, staying ahead of the competition requires a keen understanding of your sales performance. Sales reports are the backbone of data-driven decision-making, and they play a pivotal role in shaping your strategies, identifying opportunities, and achieving your sales goals.
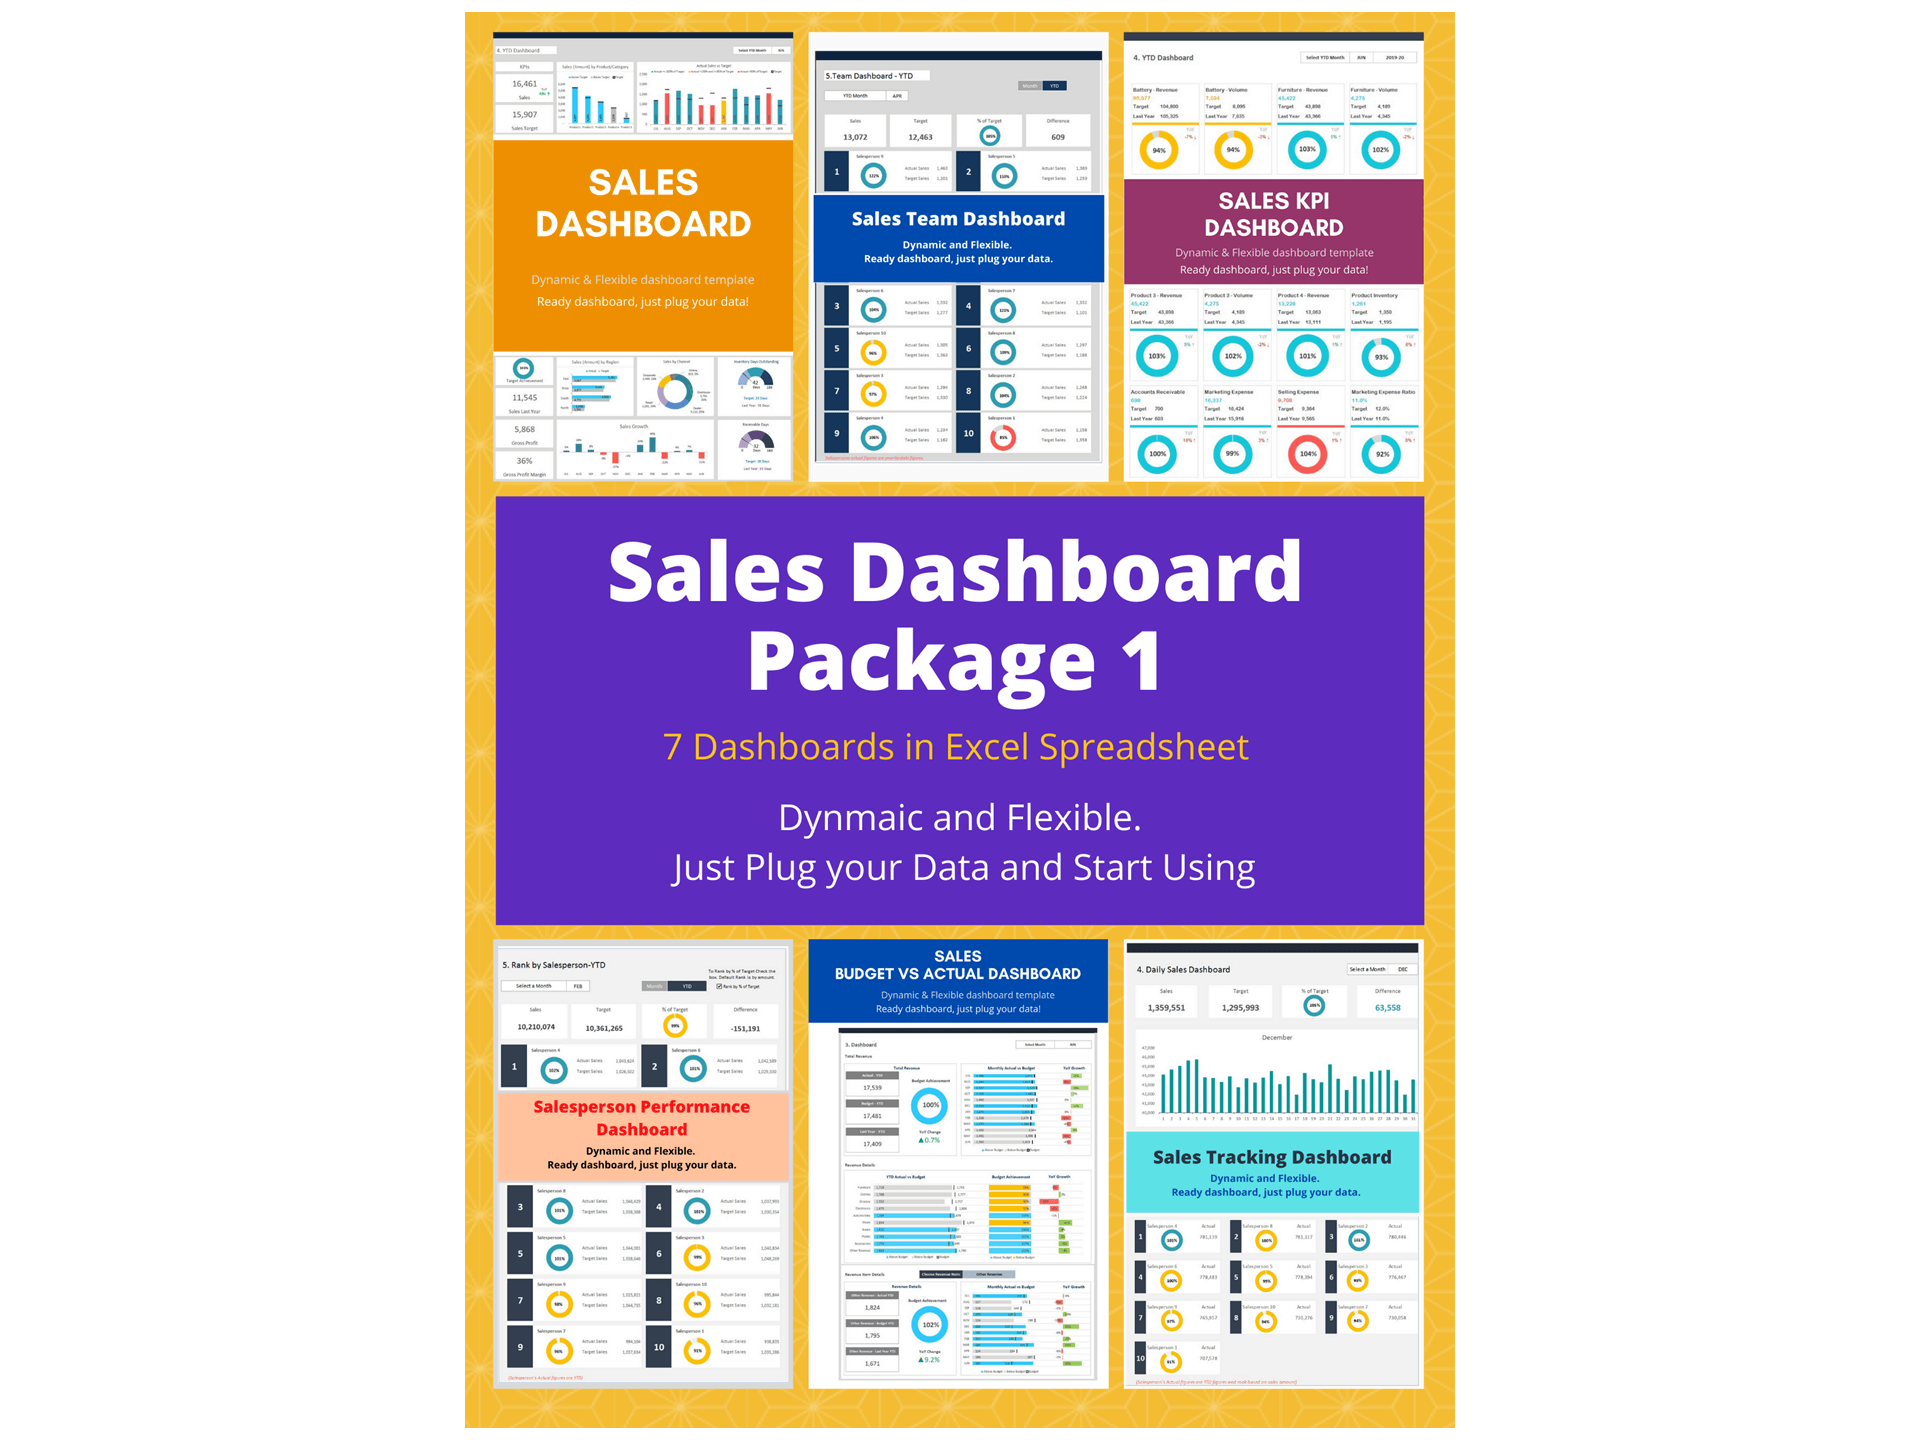
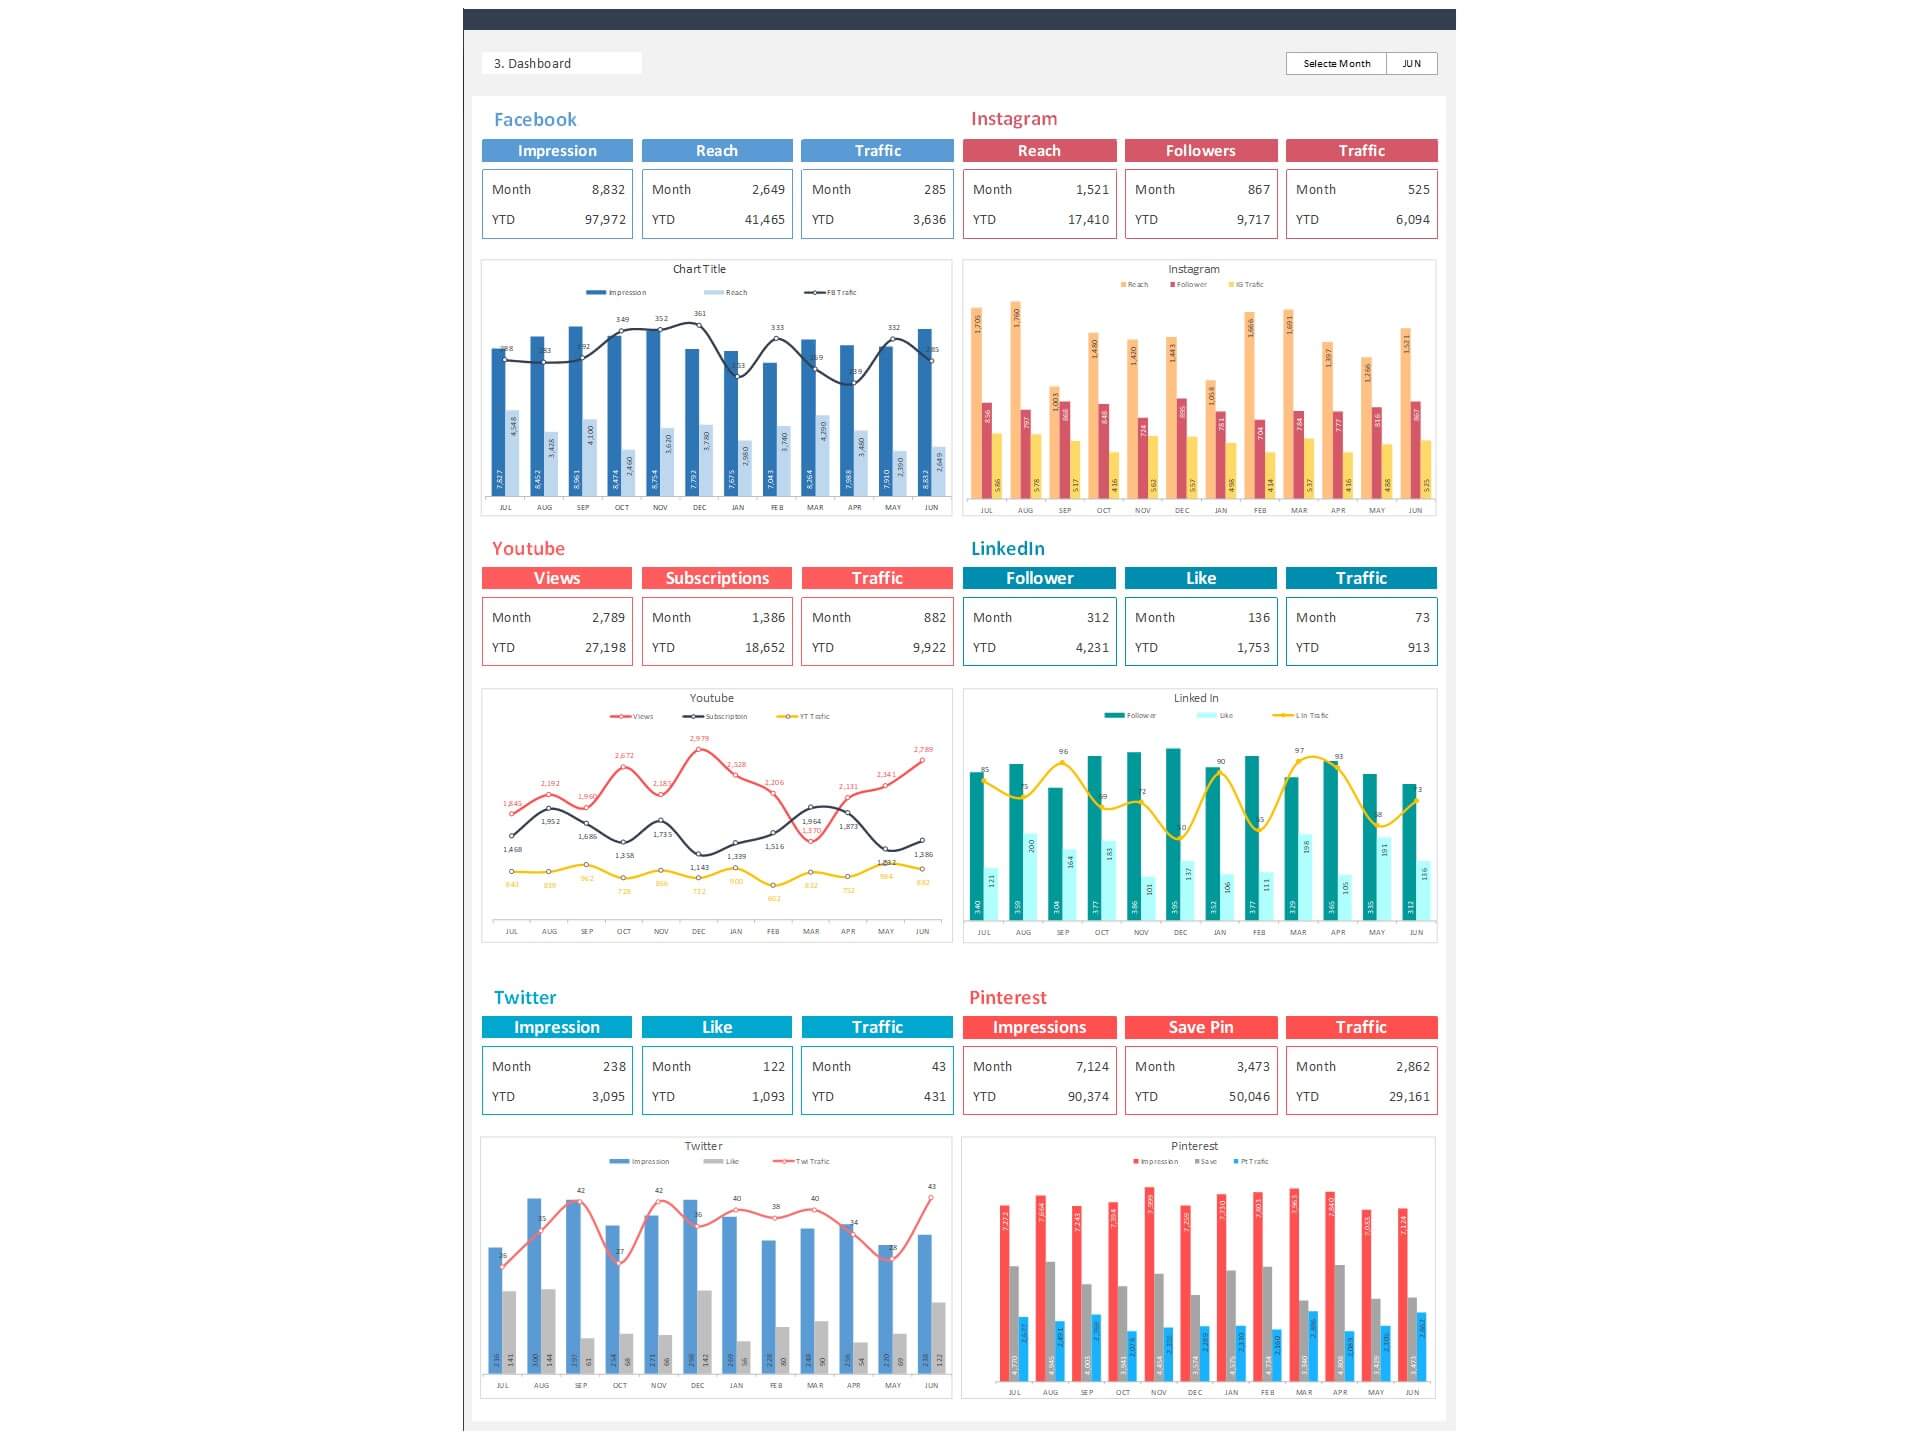
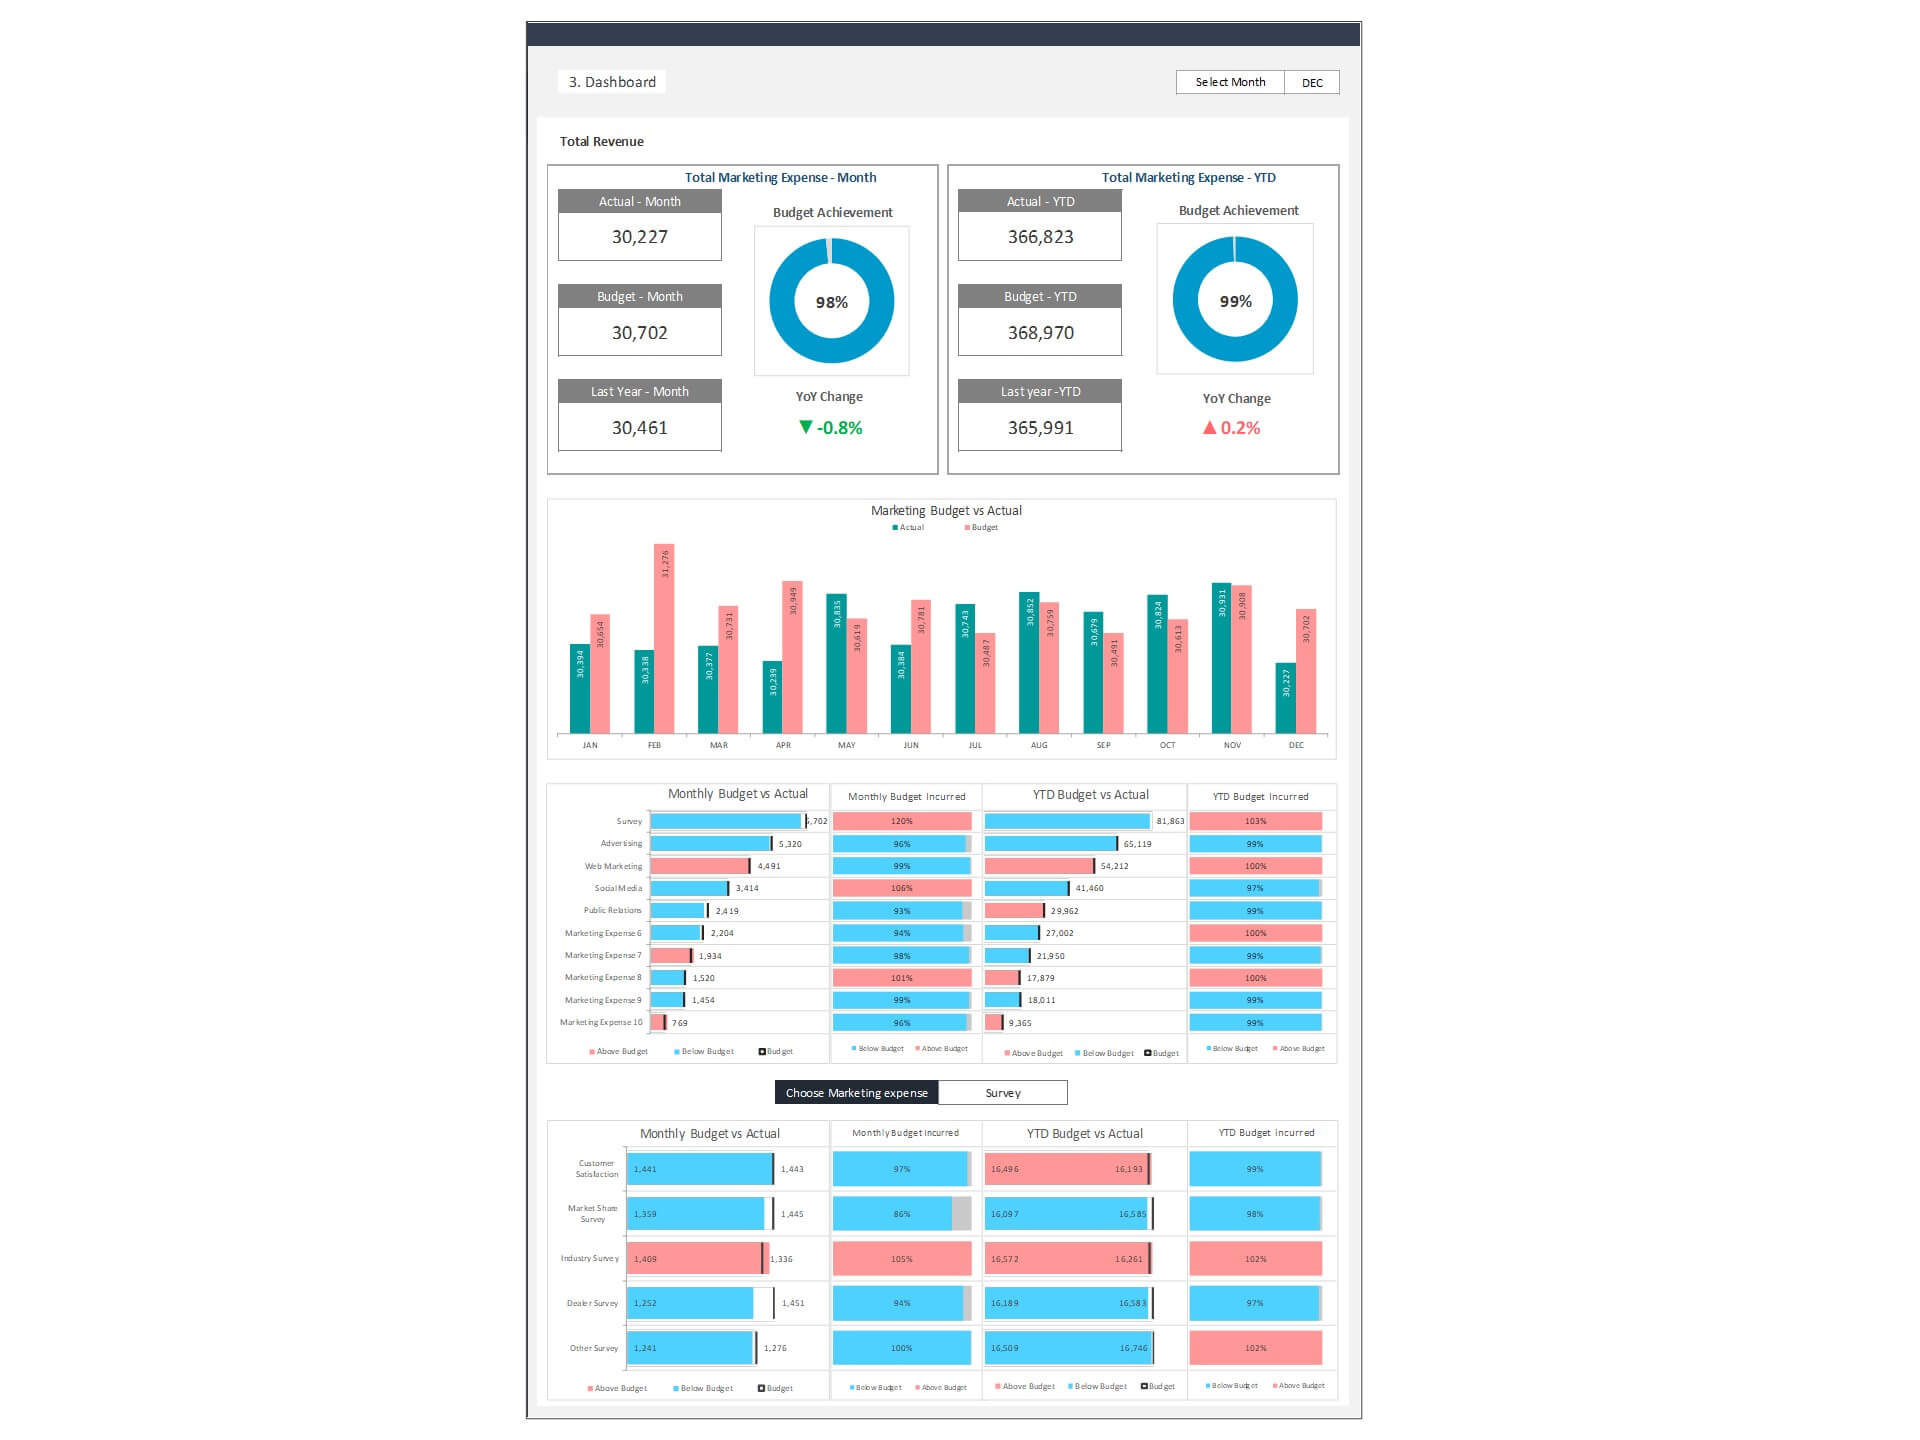
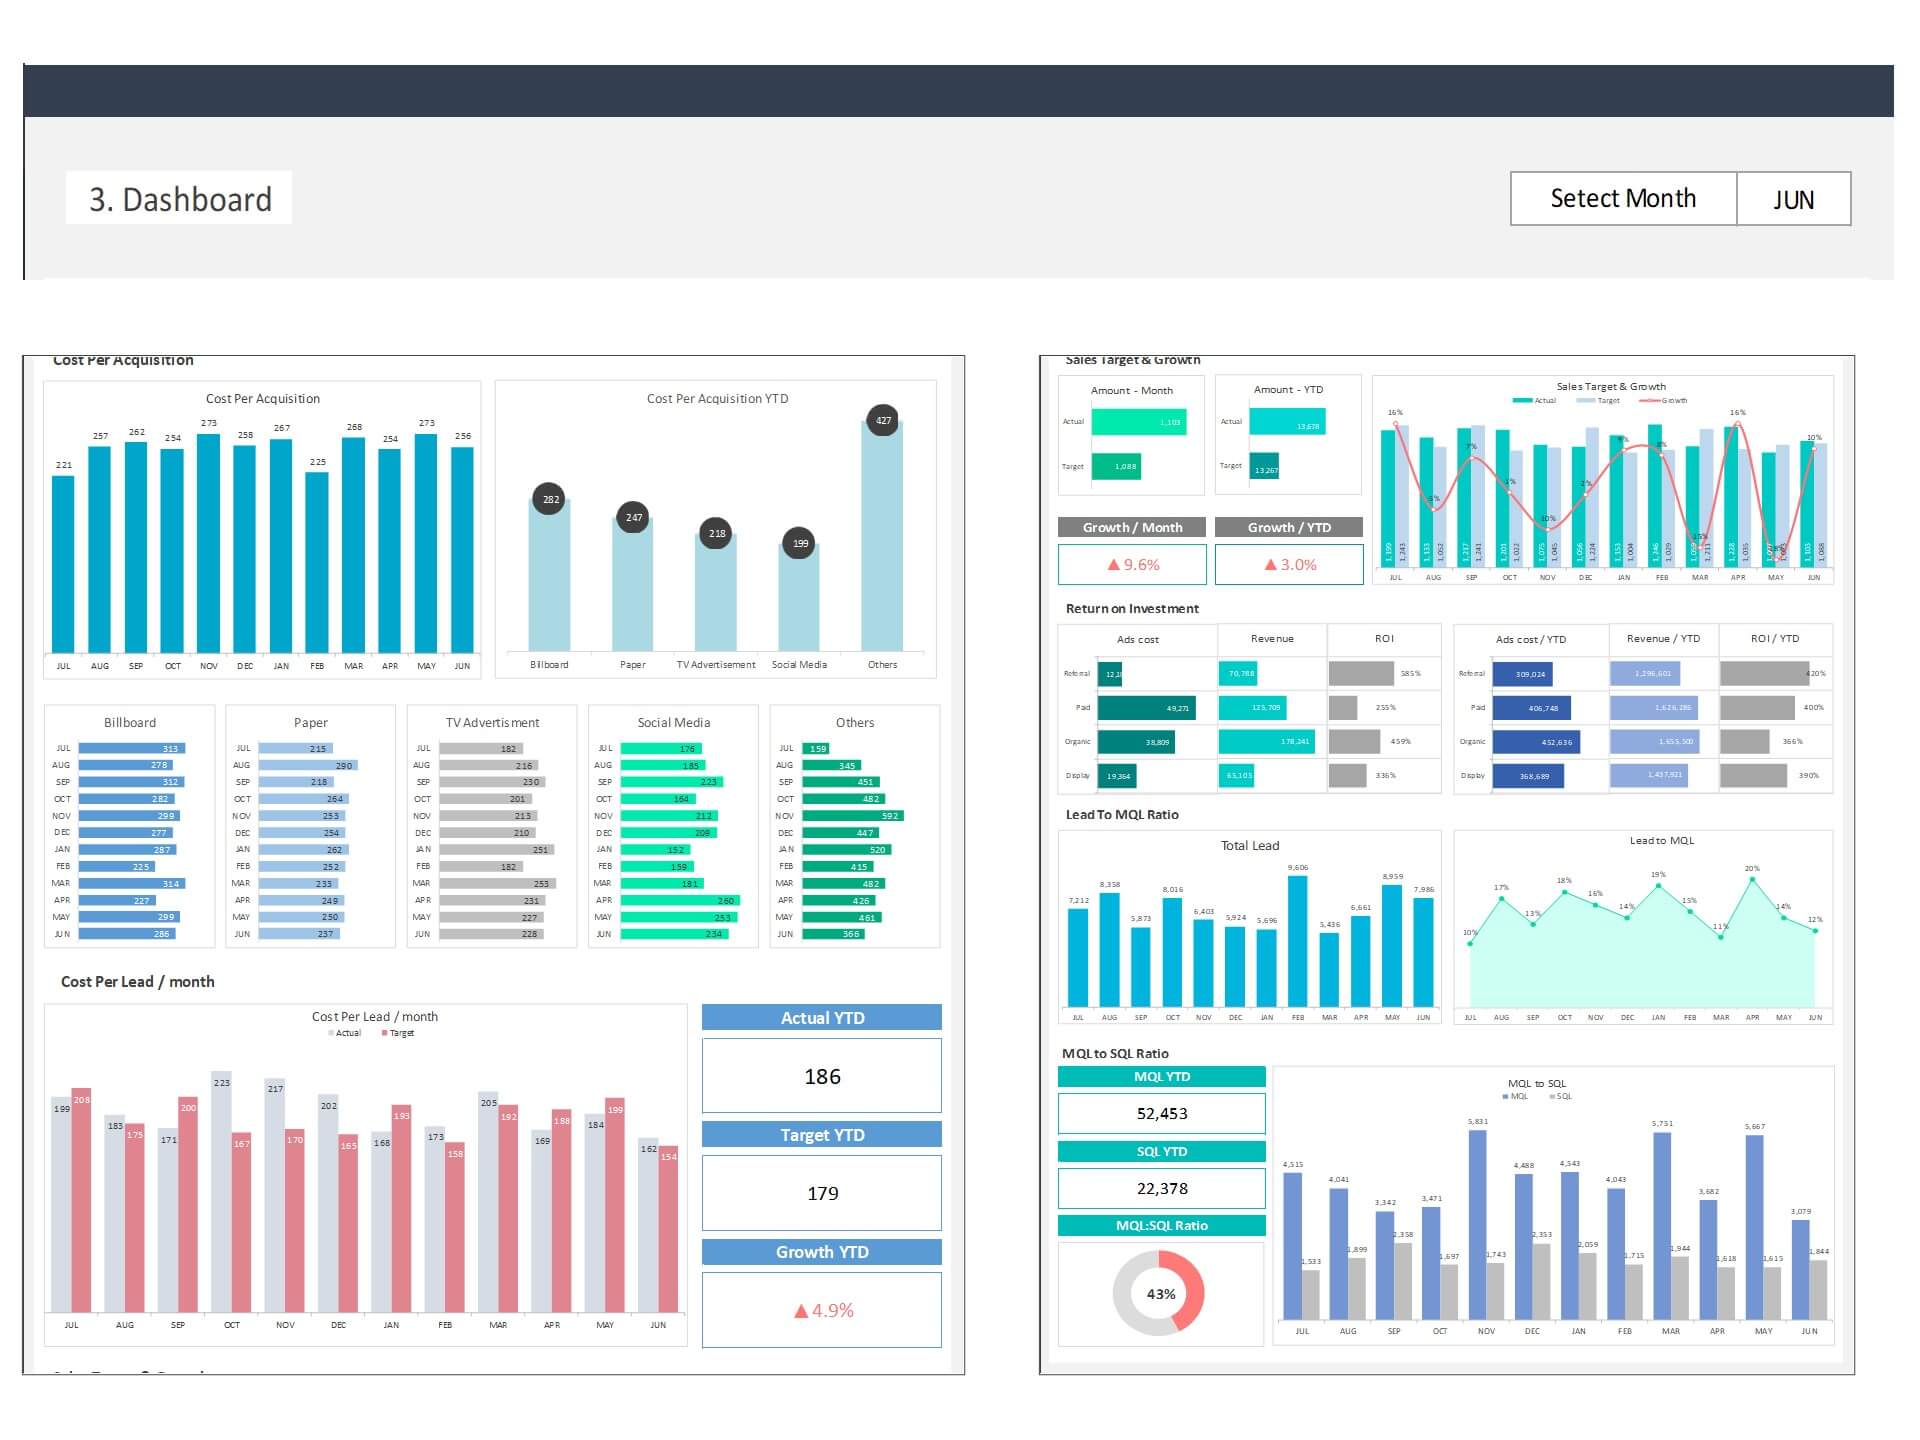
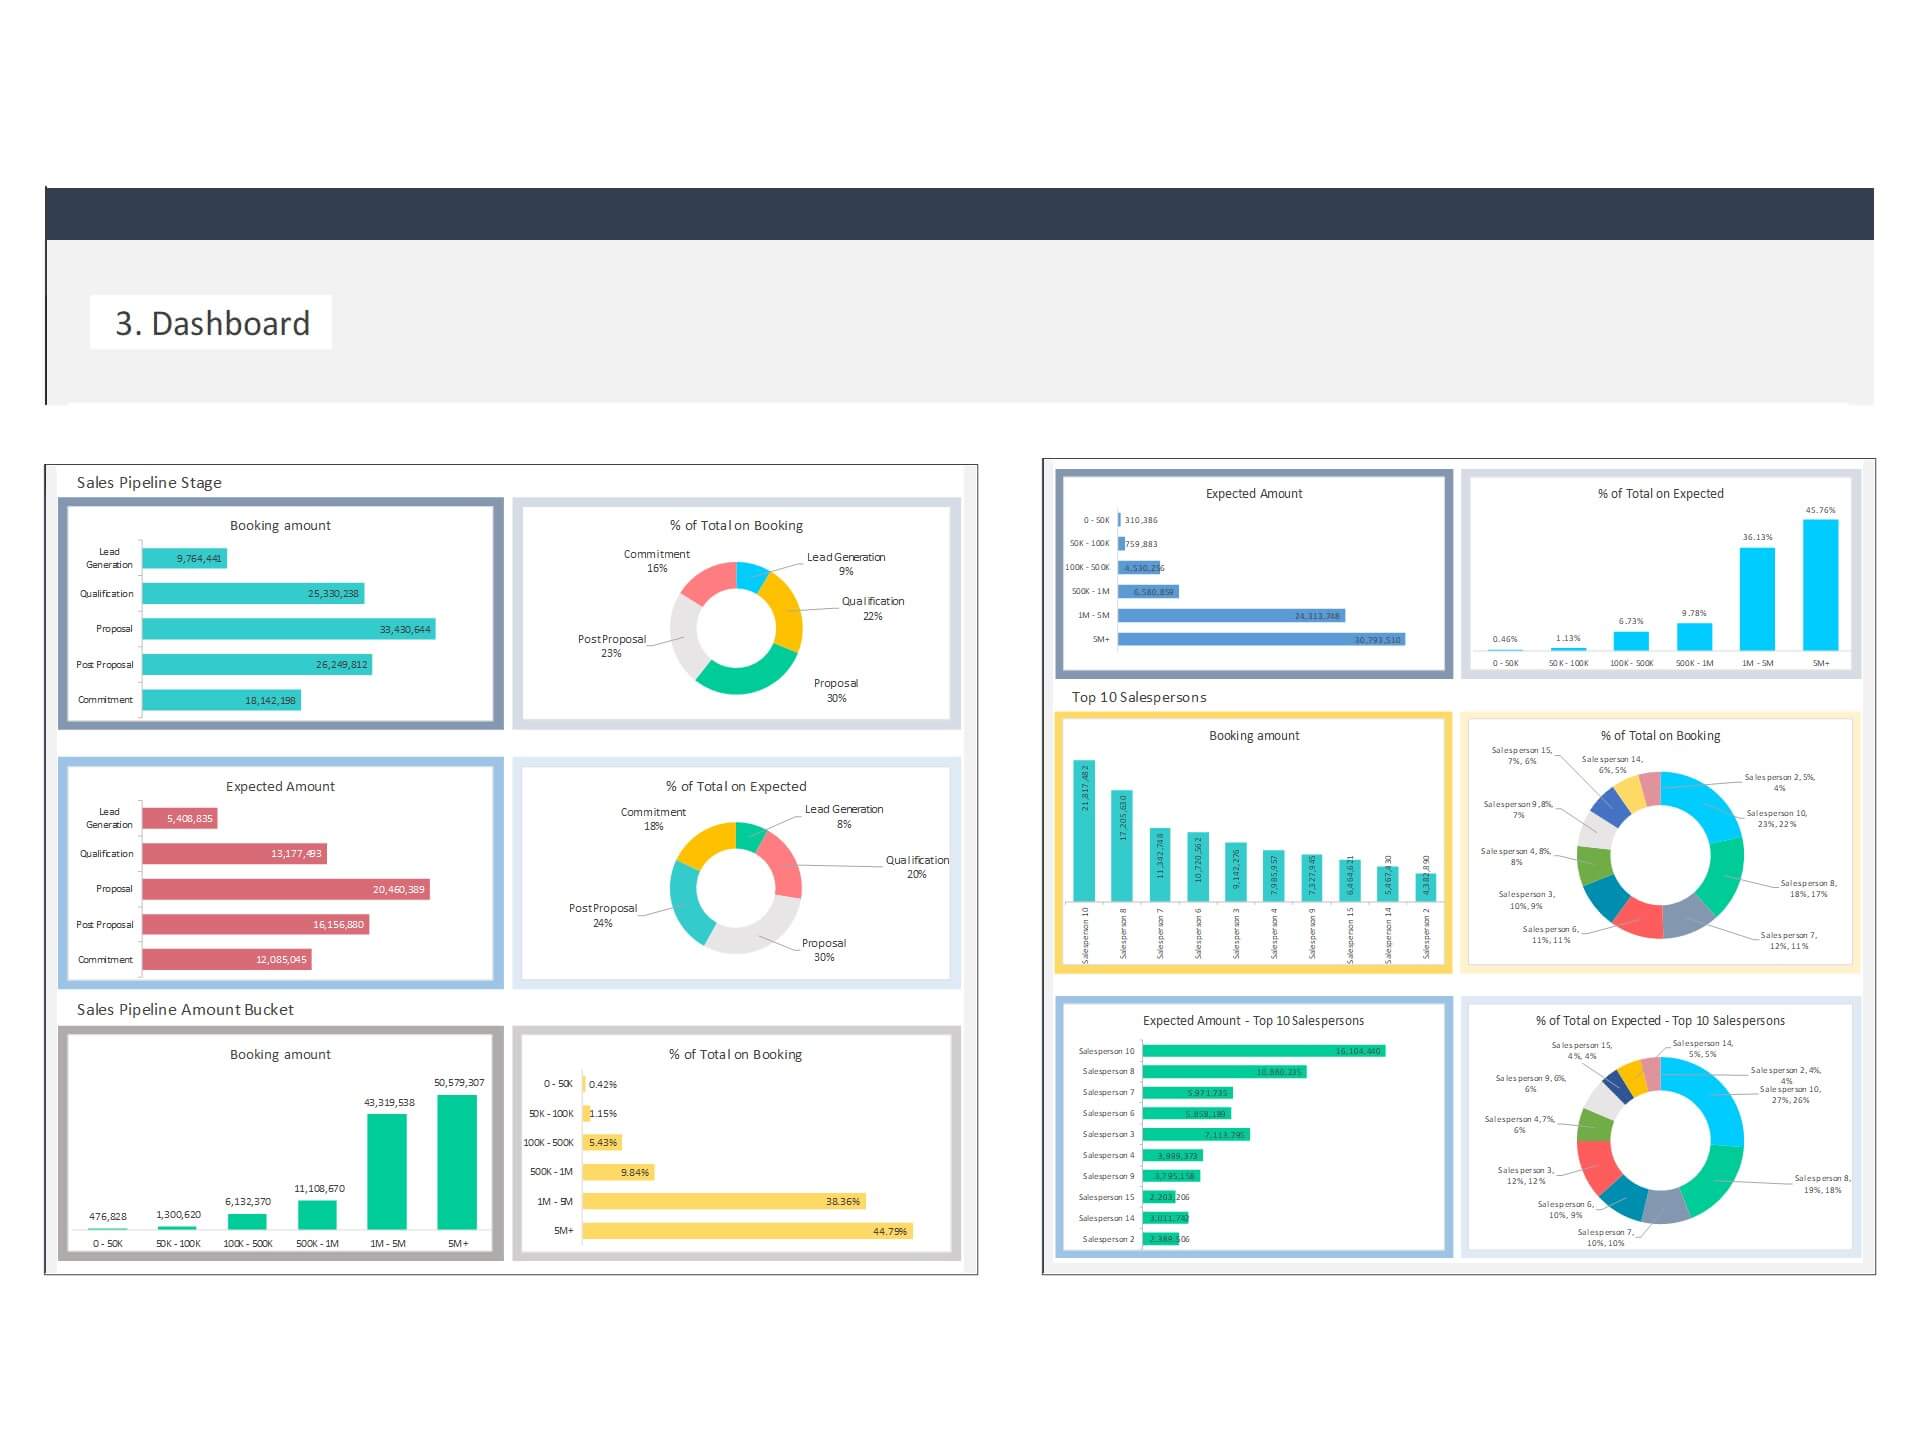
To empower businesses of all sizes with the insights they need, we proudly present our Sales Reports Excel template. This comprehensive tool is designed to help you harness the power of data through key performance indicators (KPIs) such as Overall Sales by month, Sales By product, Monthly Sales Growth, and Sales KPI Achievement.
The Power of Sales Reports
Sales reports are more than just numbers on a spreadsheet; they are your compass in the vast sea of business operations. They provide you with essential insights into your sales activities, customer behaviors, and market trends. By utilizing these reports effectively, you can:
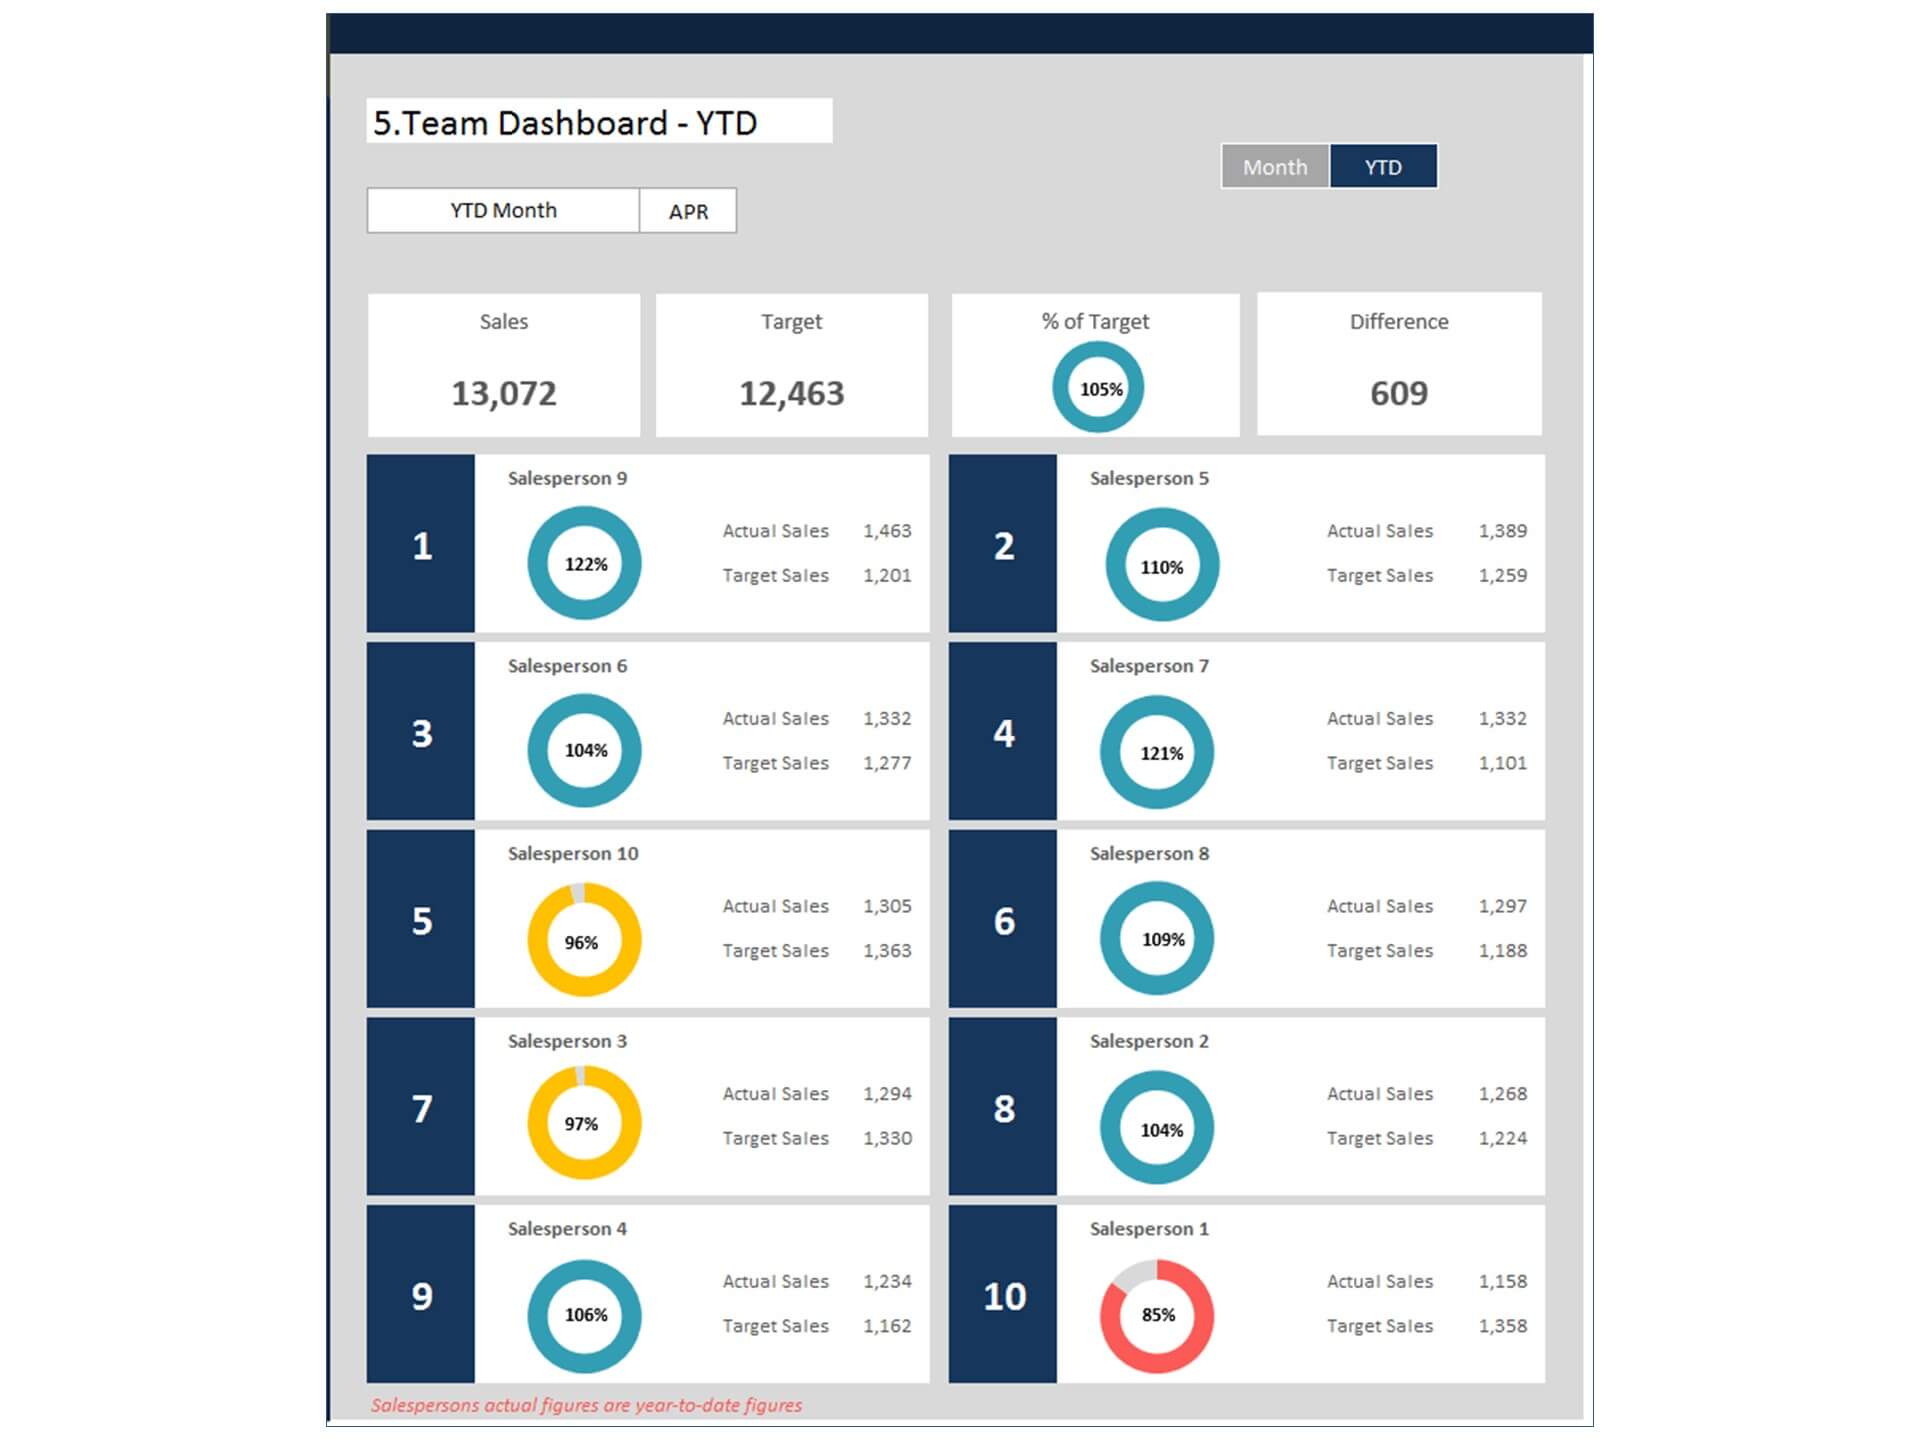
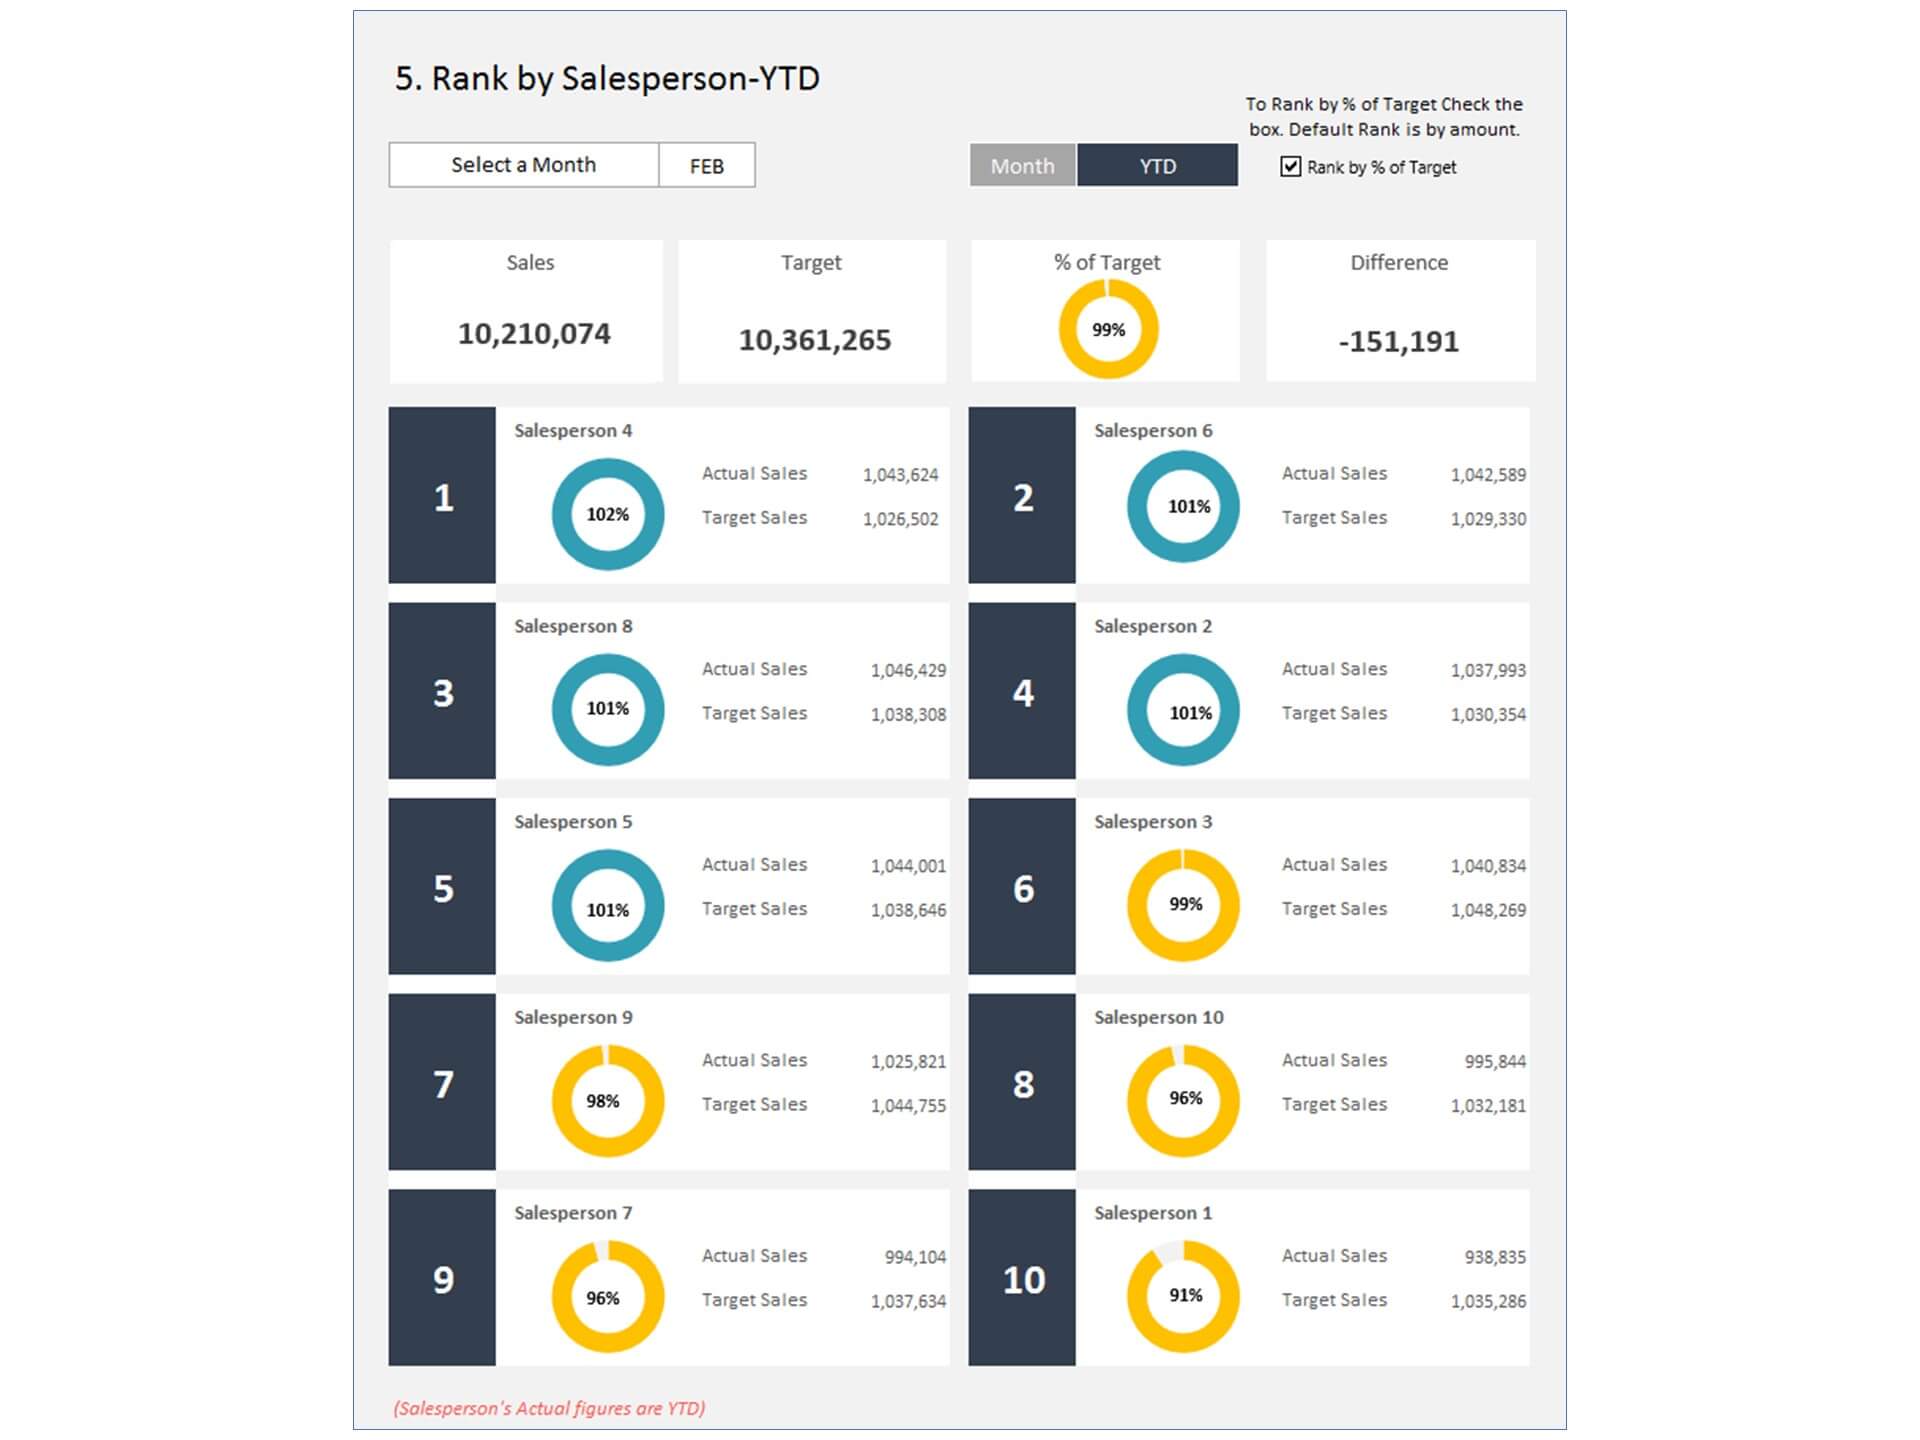
- Measure Performance: Track how well your sales team is performing and whether they are meeting their targets.
- Identify Trends: Recognize patterns and trends in your sales data, helping you forecast future sales and allocate resources strategically.
- Optimize Strategies: Identify areas that need improvement and make data-driven decisions to optimize your sales strategies.
- Set Goals: Establish clear, achievable targets for your sales team to keep them motivated and focused on success.
- Evaluate Marketing Efforts: Measure the impact of marketing campaigns and promotions on your sales performance.
Now, let's dive deeper into the key KPIs included in our Sales Reports Excel template:
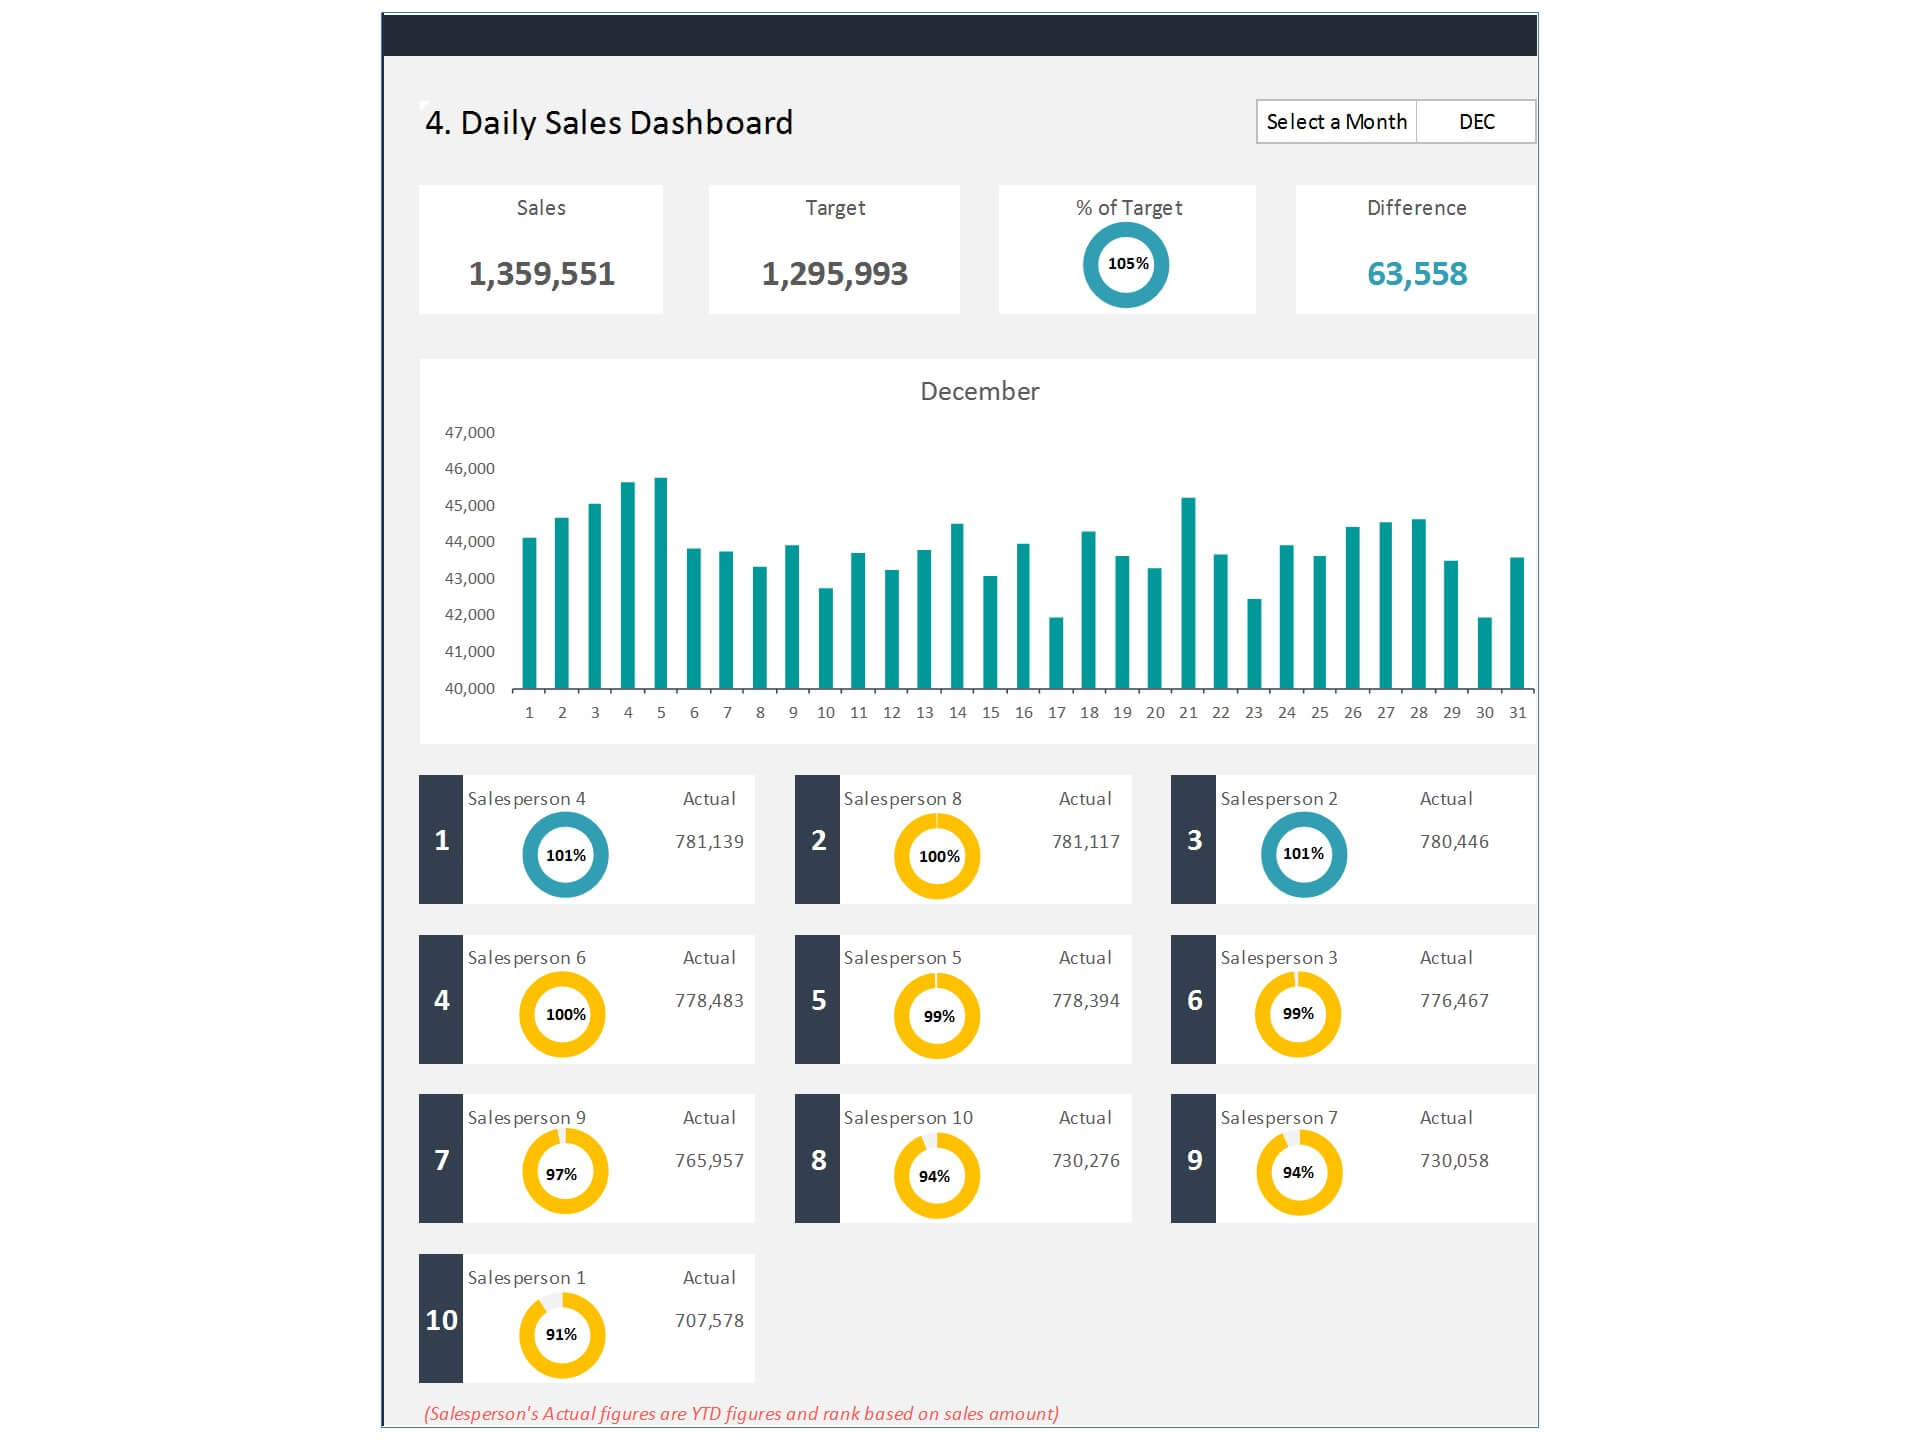
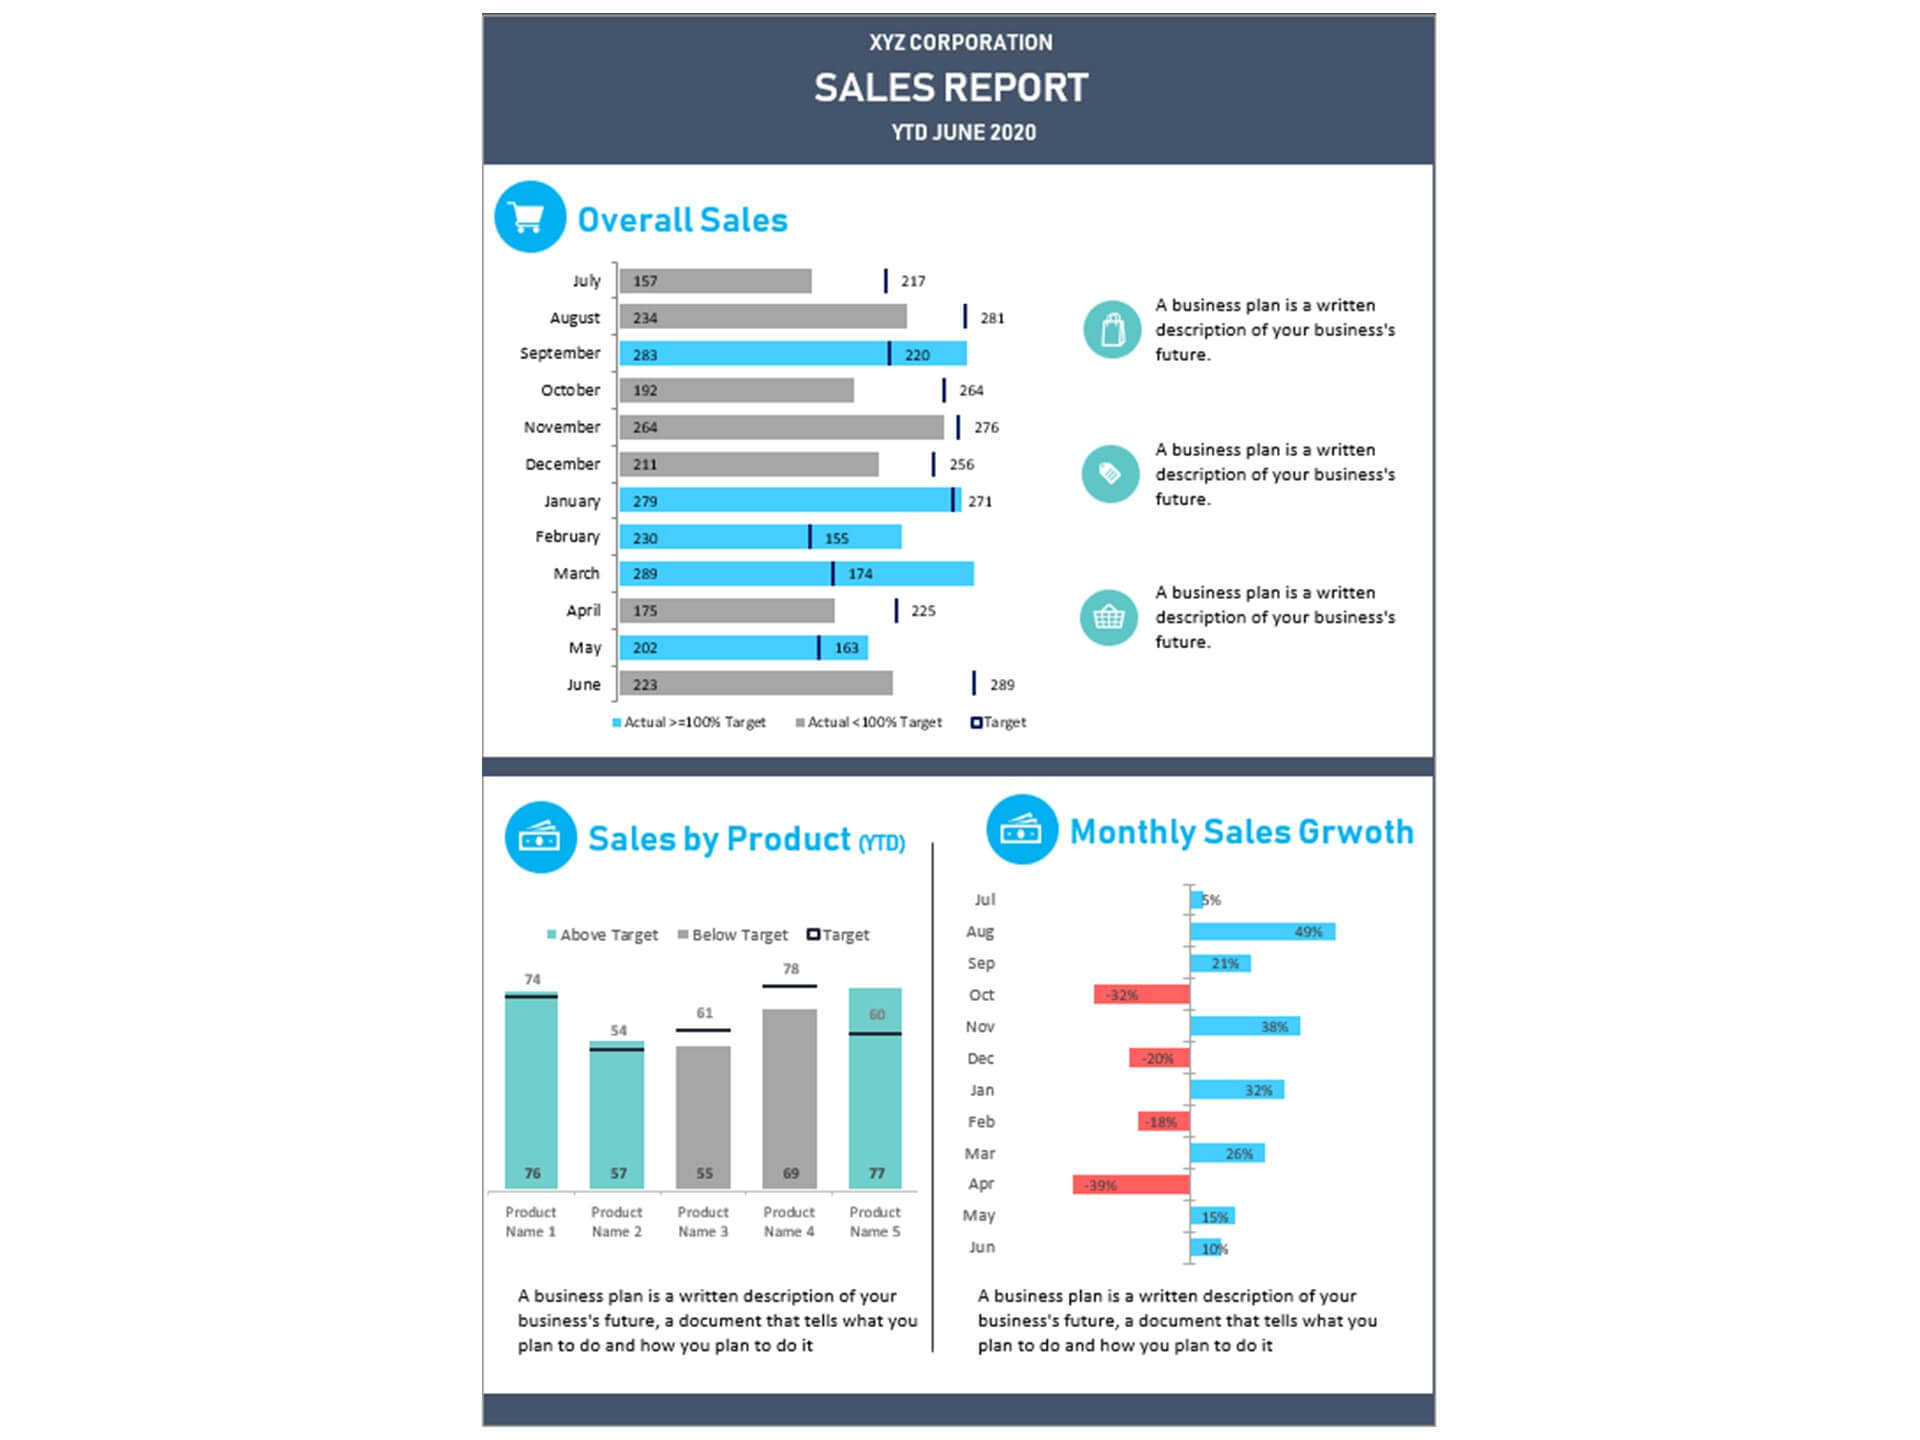
Overall Sales by Month
Understanding your monthly sales performance is the cornerstone of effective sales management. Our template allows you to:
- Visualize Trends: Use intuitive charts and graphs to visualize your sales data, making it easier to spot trends and seasonal fluctuations.
- Monitor Growth: Keep a close eye on your monthly sales growth, helping you make timely decisions to steer your business in the right direction.
- Identify Peaks and Valleys: Identify which months are your best performers and which need improvement.
Sales By Product
Not all products are created equal, and some are bound to outshine others. With the "Sales By Product" KPI, you can:
- Prioritize Products: Identify your top-performing products and allocate resources accordingly.
- Inventory Management: Make informed decisions about inventory levels, promotions, and product retirements.
- Diversification: Spot opportunities for product diversification or enhancements.
Monthly Sales Growth
Keeping track of your sales growth on a month-to-month basis is crucial for sustainable success. Our template helps you:
- Spot Opportunities: Quickly identify growth opportunities and areas that need attention.
- Campaign Evaluation: Evaluate the impact of marketing campaigns, product launches, or pricing changes.
- Adjust Strategies: With timely insights, you can adjust your sales strategies to capitalize on growth or mitigate declines.
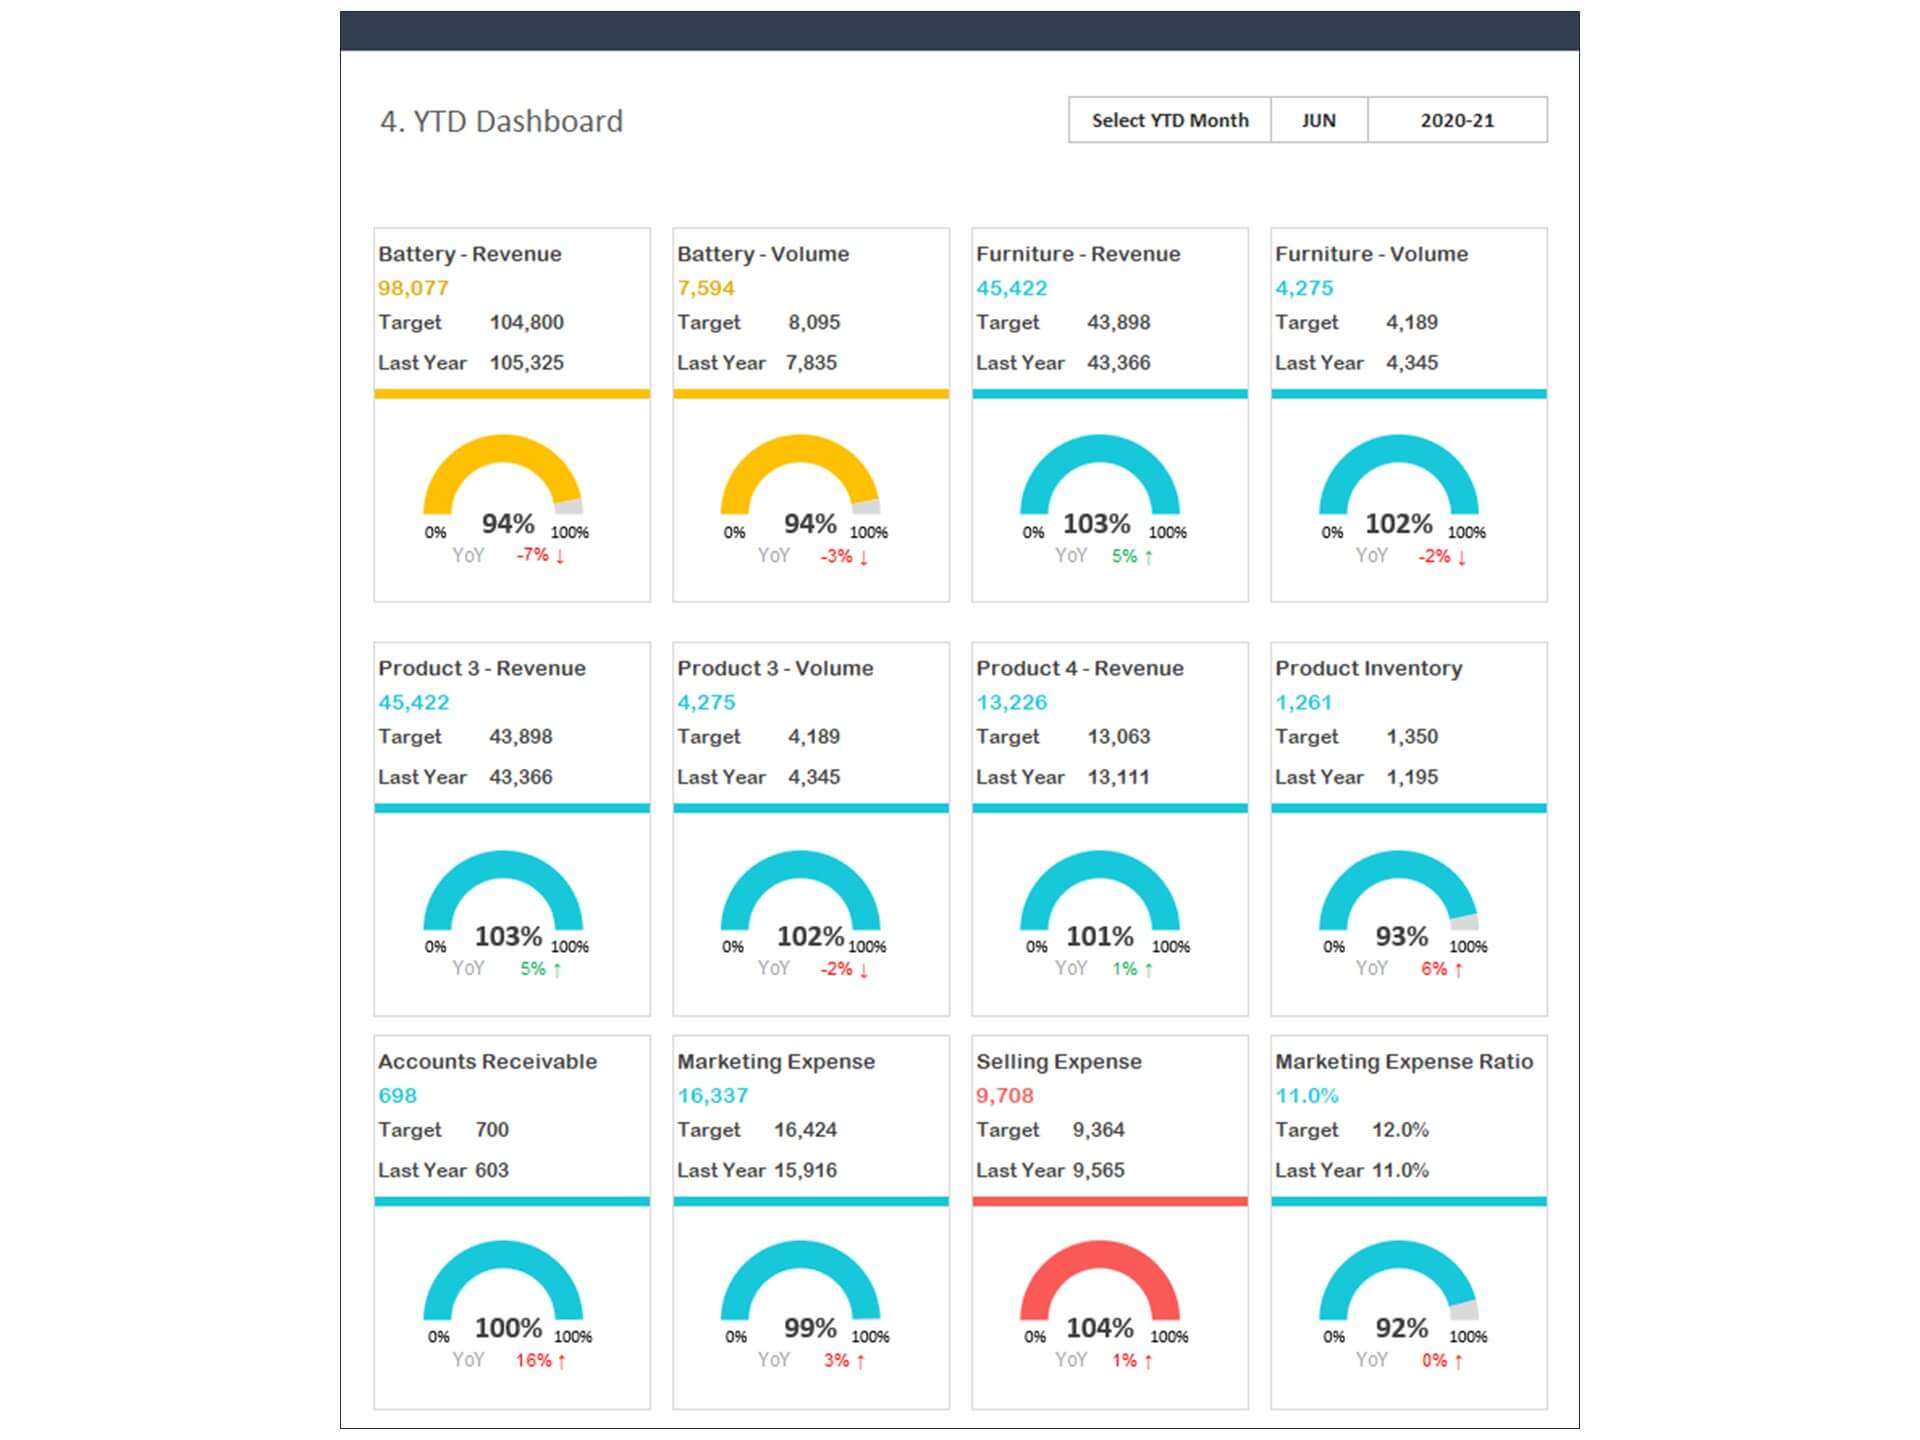
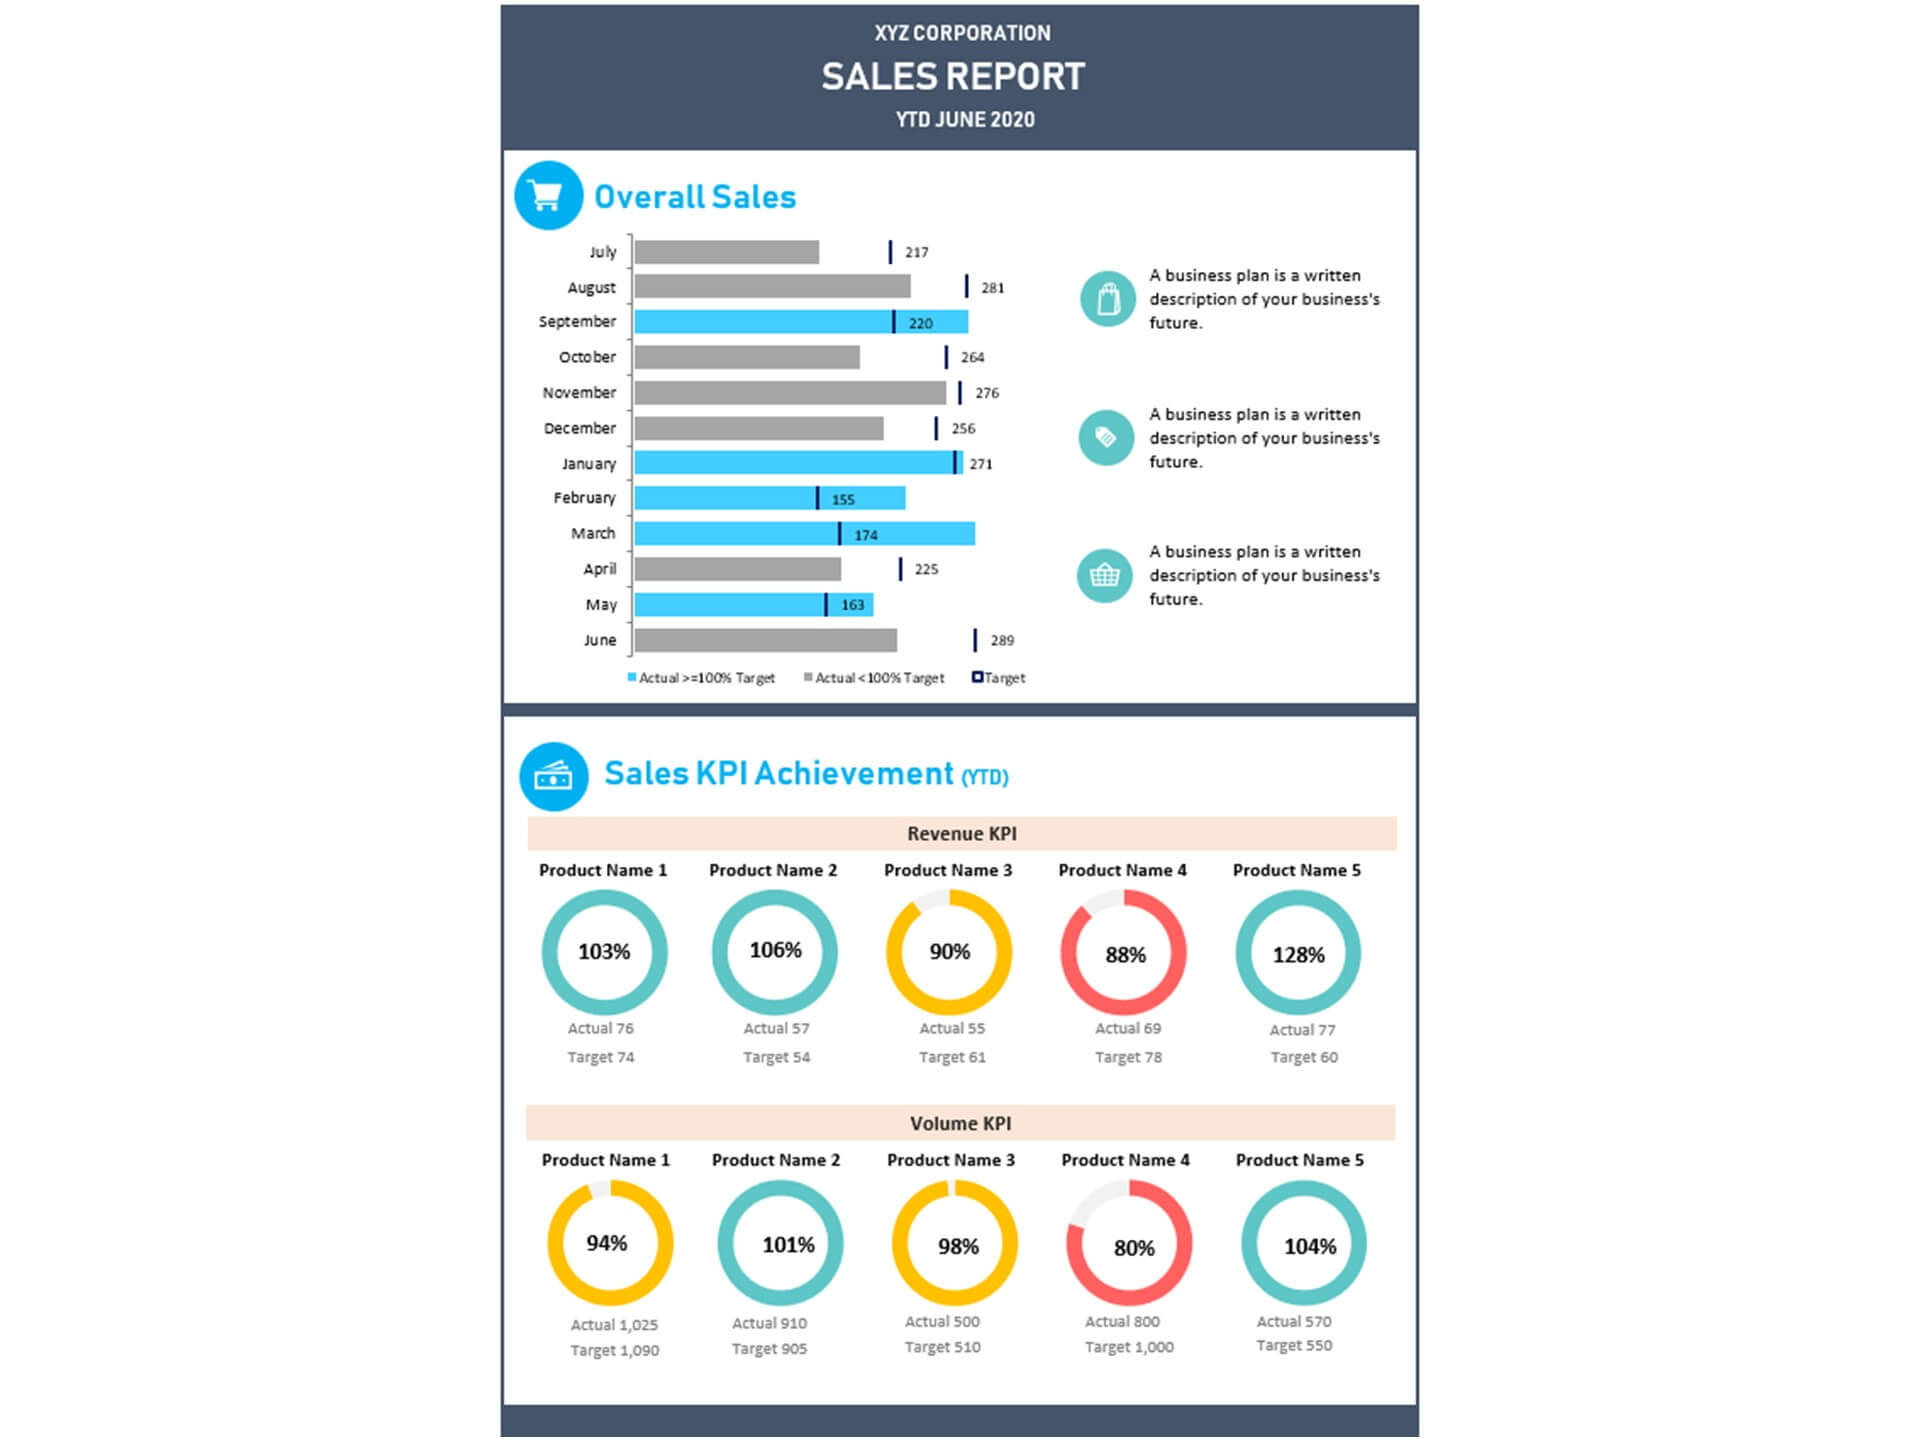
Sales KPI Achievement
Key Performance Indicators (KPIs) are the compass of sales teams, providing direction and motivation. Our template allows you to:
- Set Targets: Establish clear KPI targets for your sales team, creating a sense of purpose and direction.
- Monitor Progress: Continuously track KPI achievement to ensure your team is on the right path.
- Celebrate Success: Acknowledge and celebrate achievements, boosting team morale and cohesion.
How Our Excel Template Transforms Sales Reporting
Our Sales Reports Excel template is a game-changer for businesses looking to streamline their sales analysis. Here's how it revolutionizes the reporting process:
User-Friendly Interface
Our template is designed with simplicity in mind. You don't need advanced Excel skills to use it effectively. Input your sales data, and the template will handle the rest, generating professional reports and charts effortlessly.
Customizable Reports
Tailor the template to your unique business needs. Add or remove metrics and KPIs to create a personalized dashboard that resonates with your team and stakeholders.
Visual Data Presentation
Transform raw data into visually appealing charts and graphs. Communicate your sales insights effectively with easy-to-understand visuals, impressing your audience with professional-looking reports.
Data Accuracy
Ensure data integrity with built-in error-checking mechanisms. Minimize the risk of manual data entry errors, allowing you to rely on accurate data for confident decision-making.
Time-Saving
Say goodbye to manual data analysis and report creation. Save time and focus on strategic planning and decision-making. Get instant access to actionable insights that can drive your business forward.
Who Can Benefit from Our Sales Reports Excel Template?
Our template is versatile and can benefit a wide range of professionals and businesses:
- Sales Managers: Track and manage your team's performance, set targets, and optimize strategies for better results.
- Business Owners: Gain a comprehensive overview of your company's sales performance and make informed decisions to drive growth.
- Marketing Teams: Measure the effectiveness of marketing campaigns and identify opportunities for market expansion.
- **Financial Analysts
For ready-to-use Dashboard Templates: