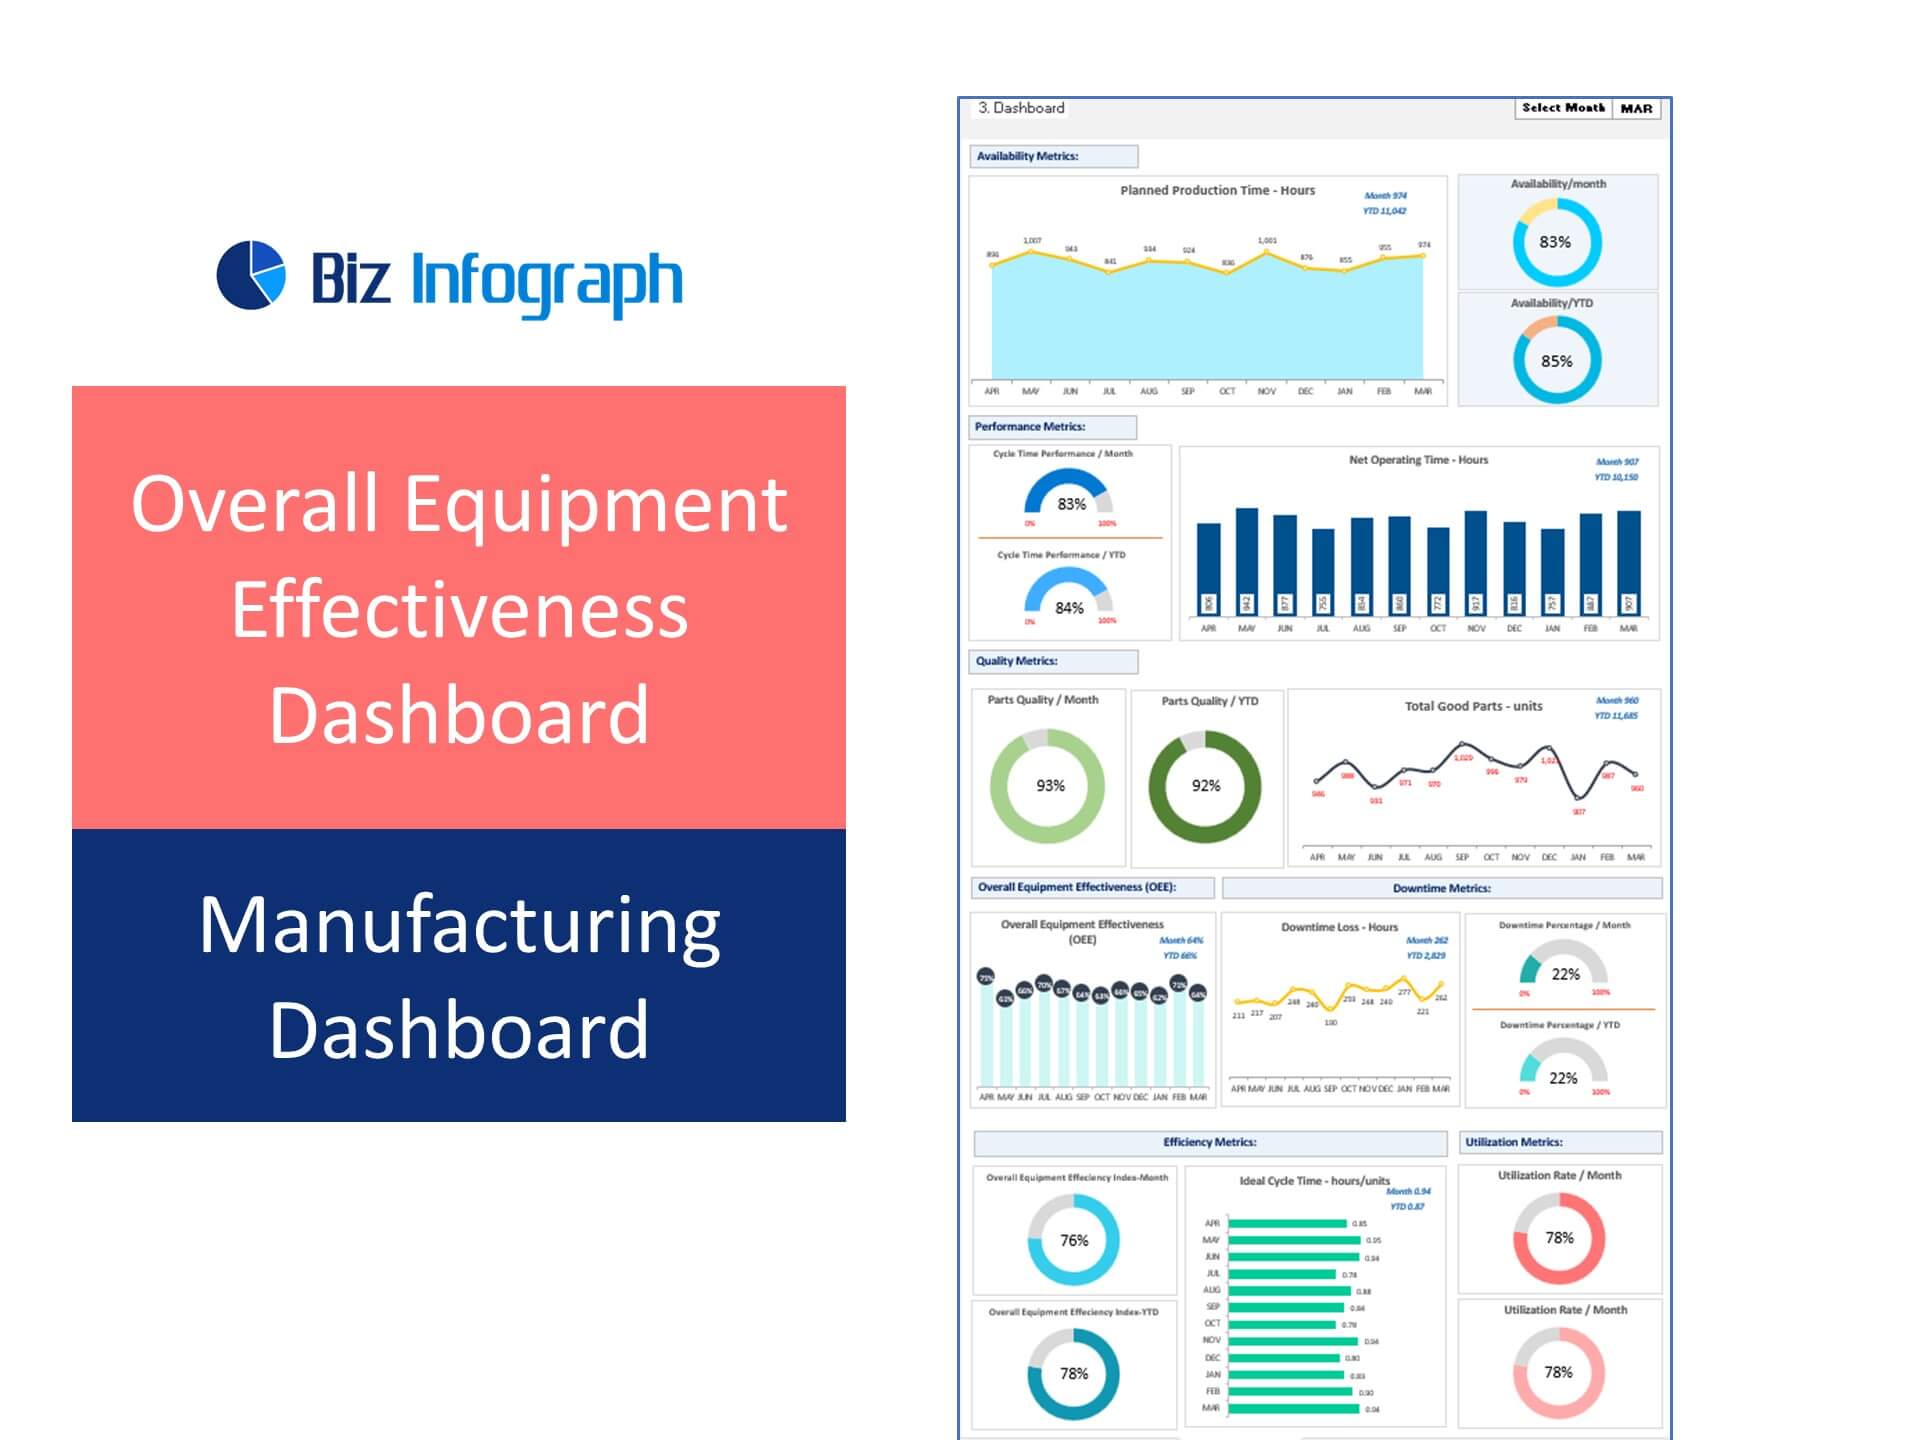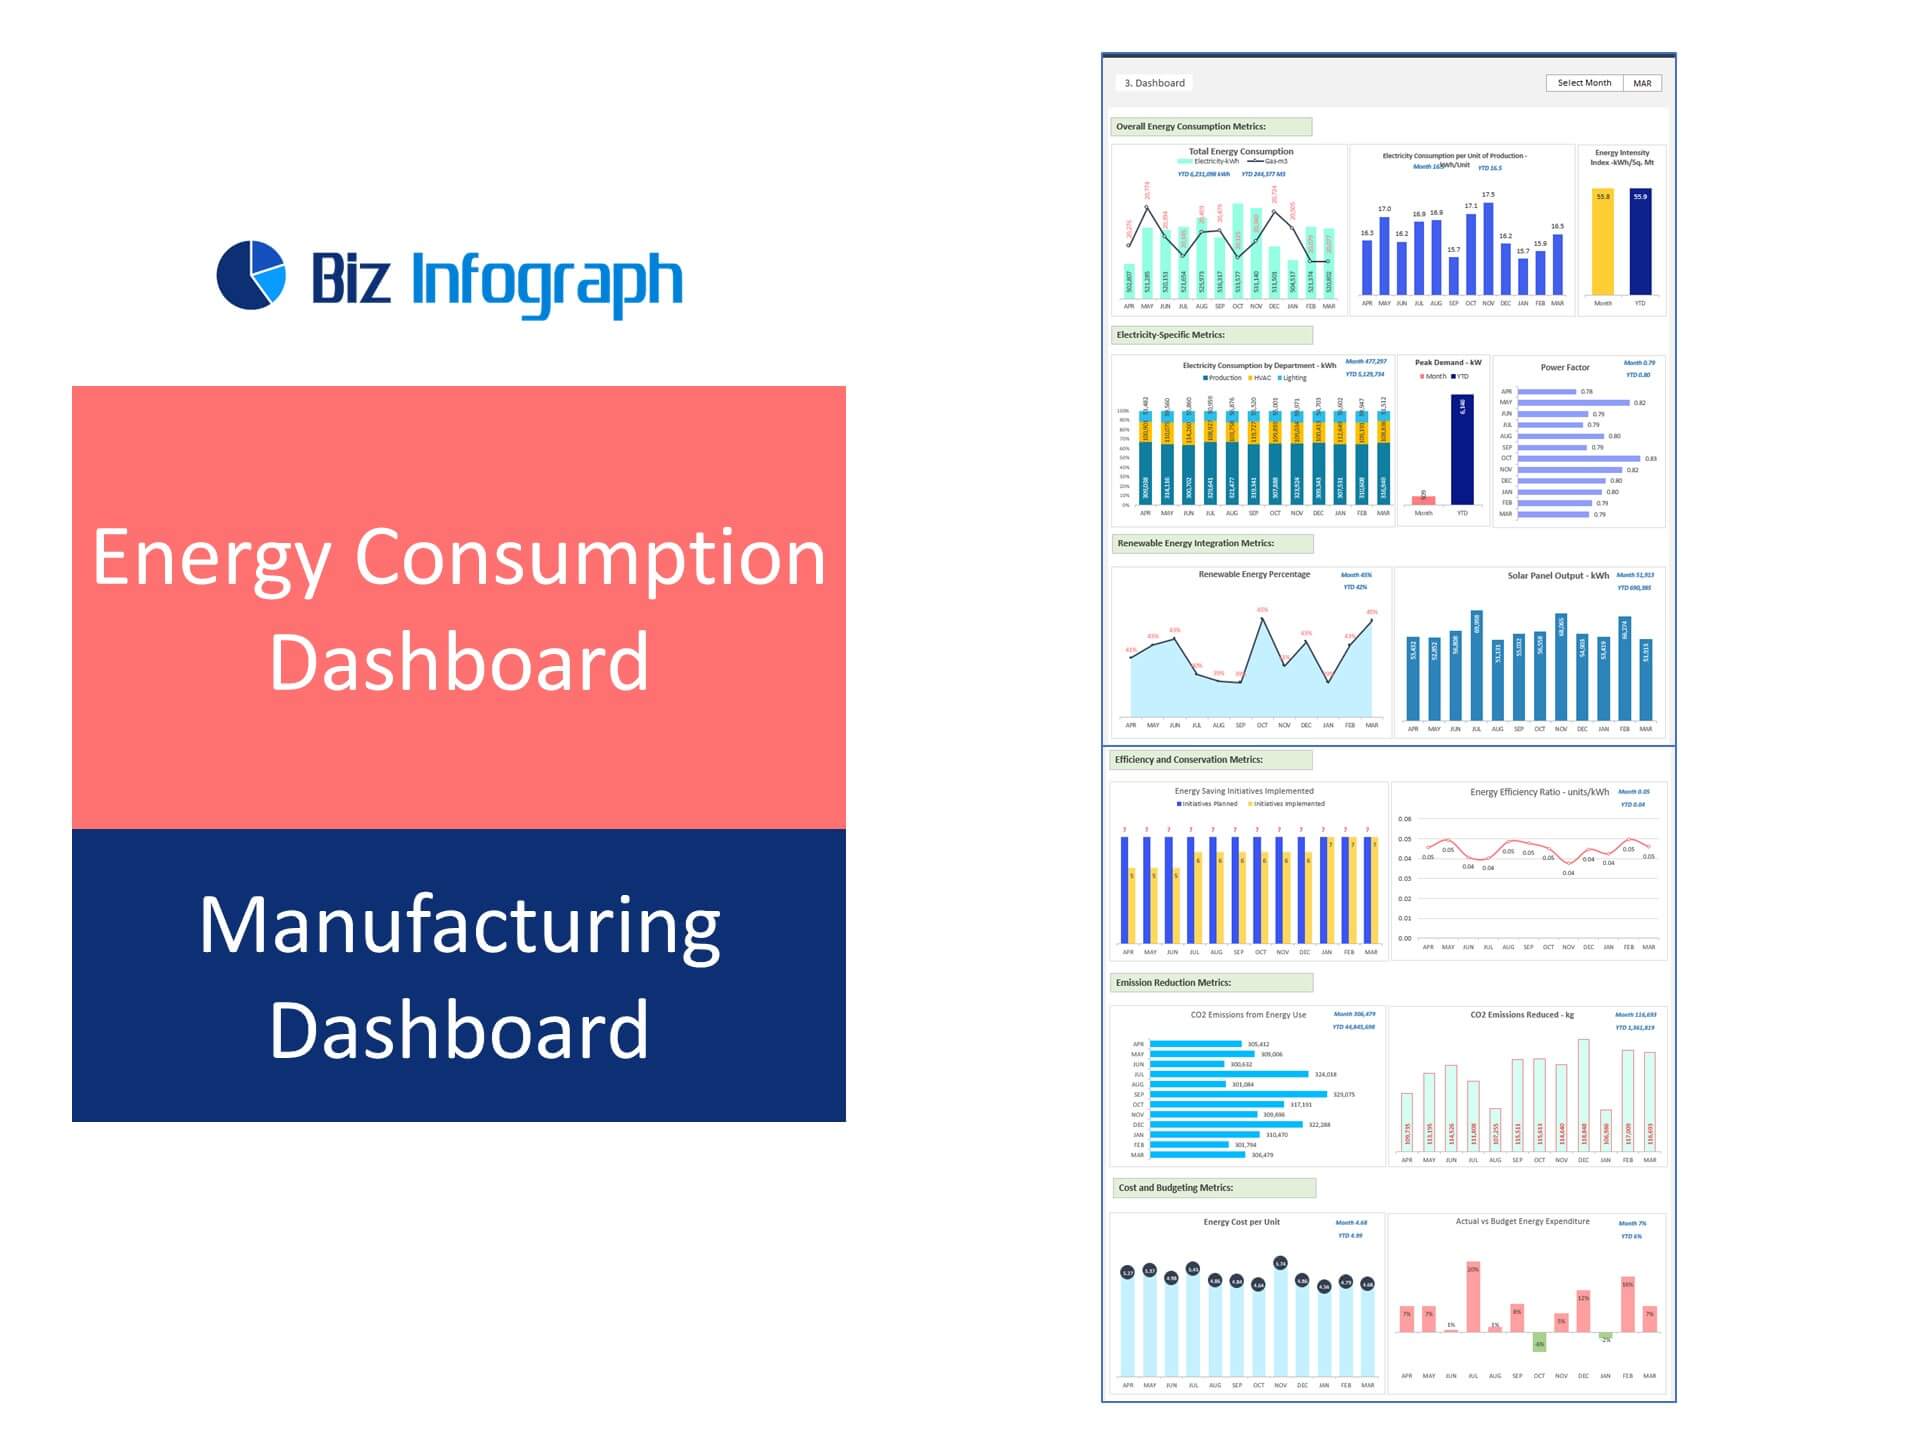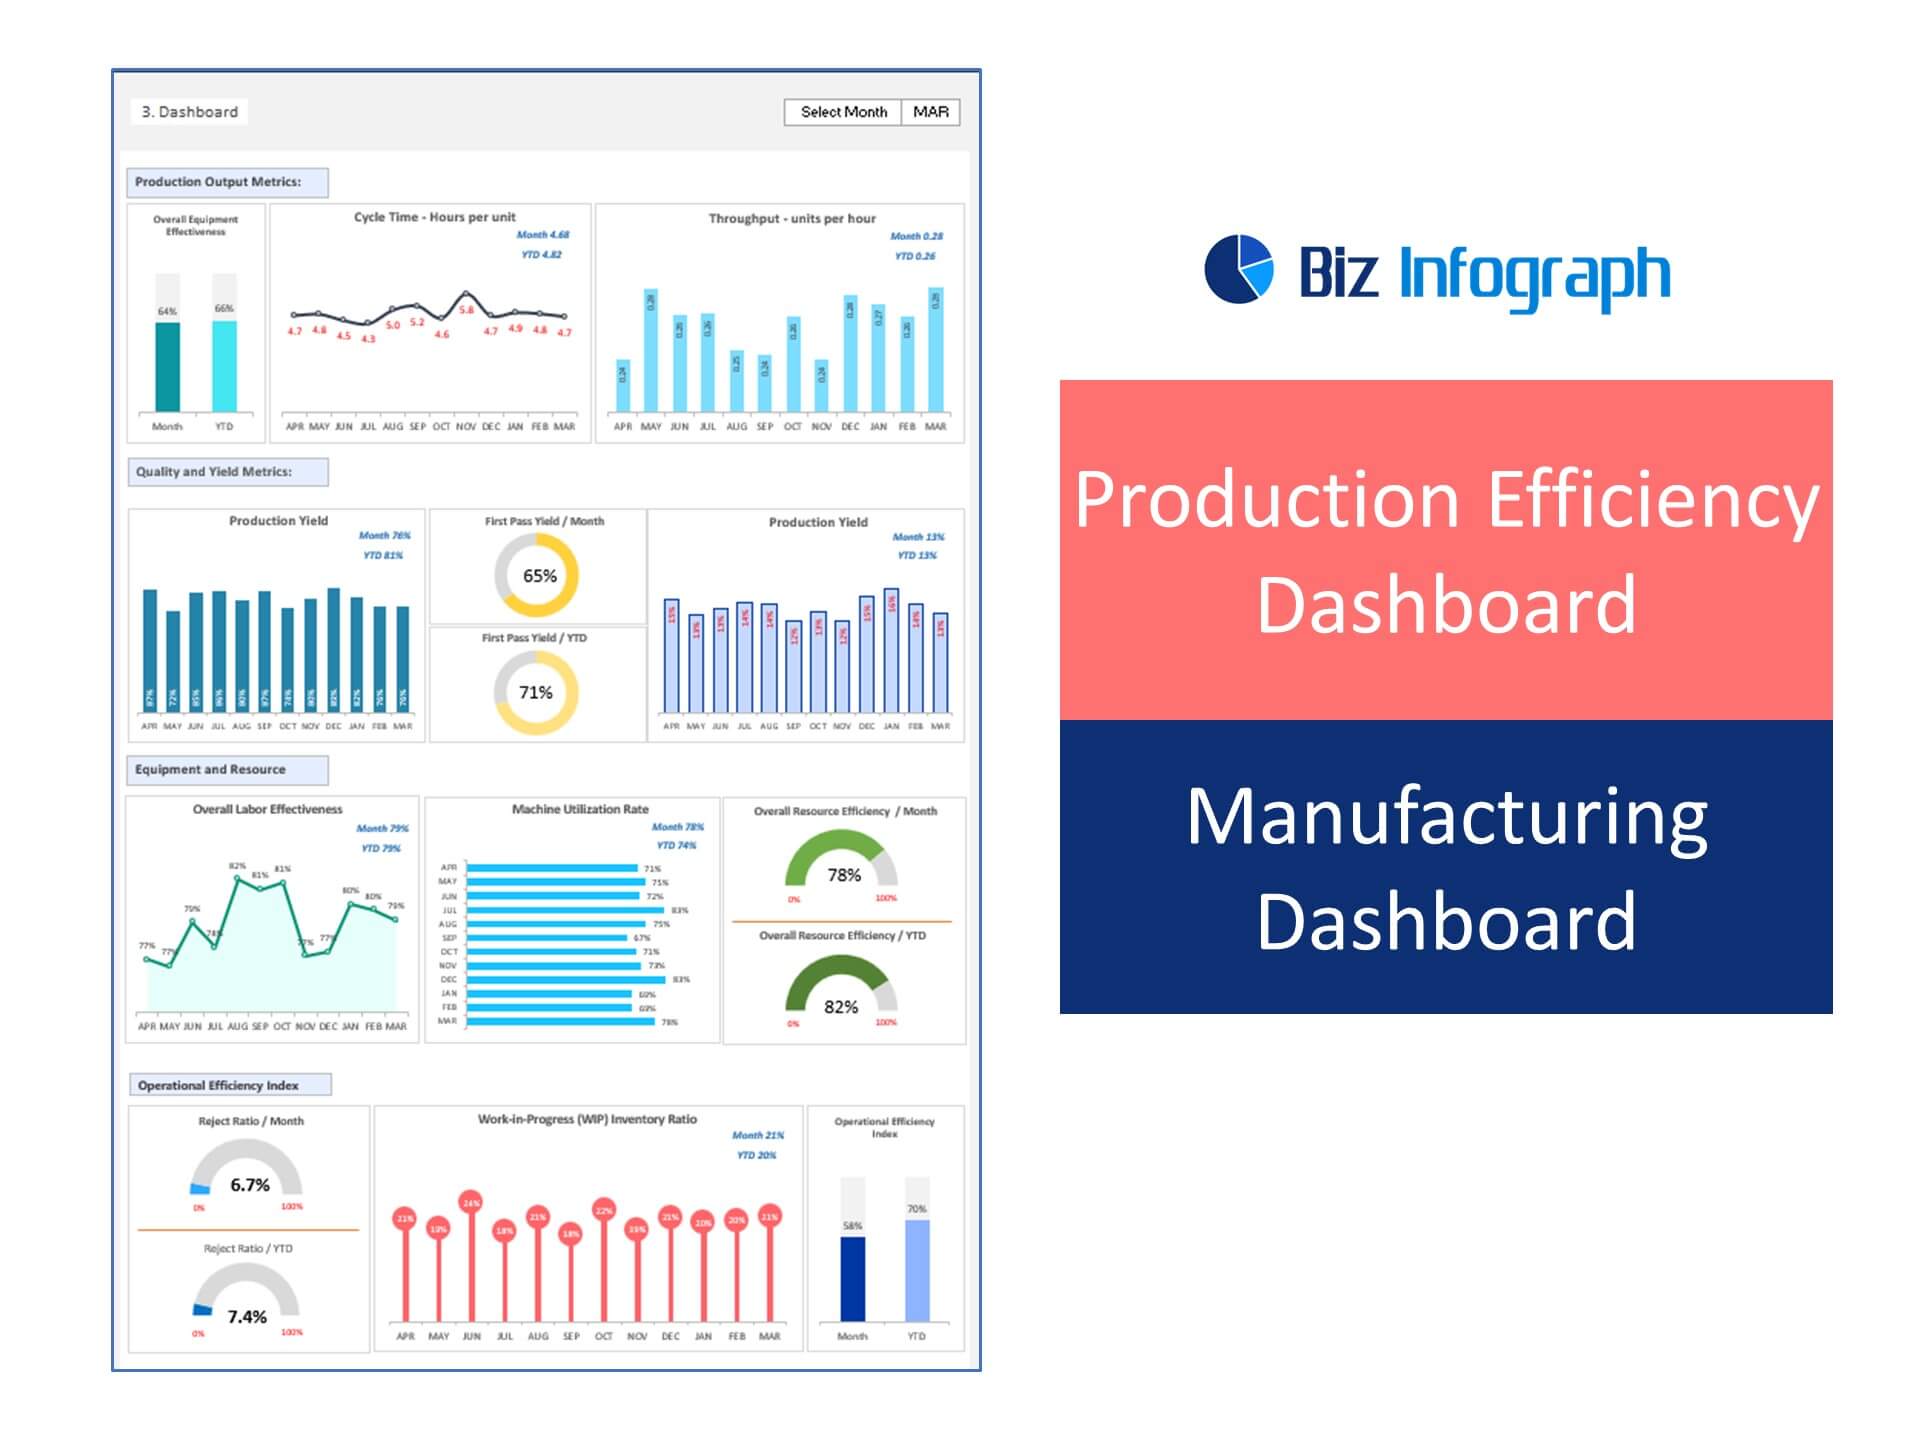
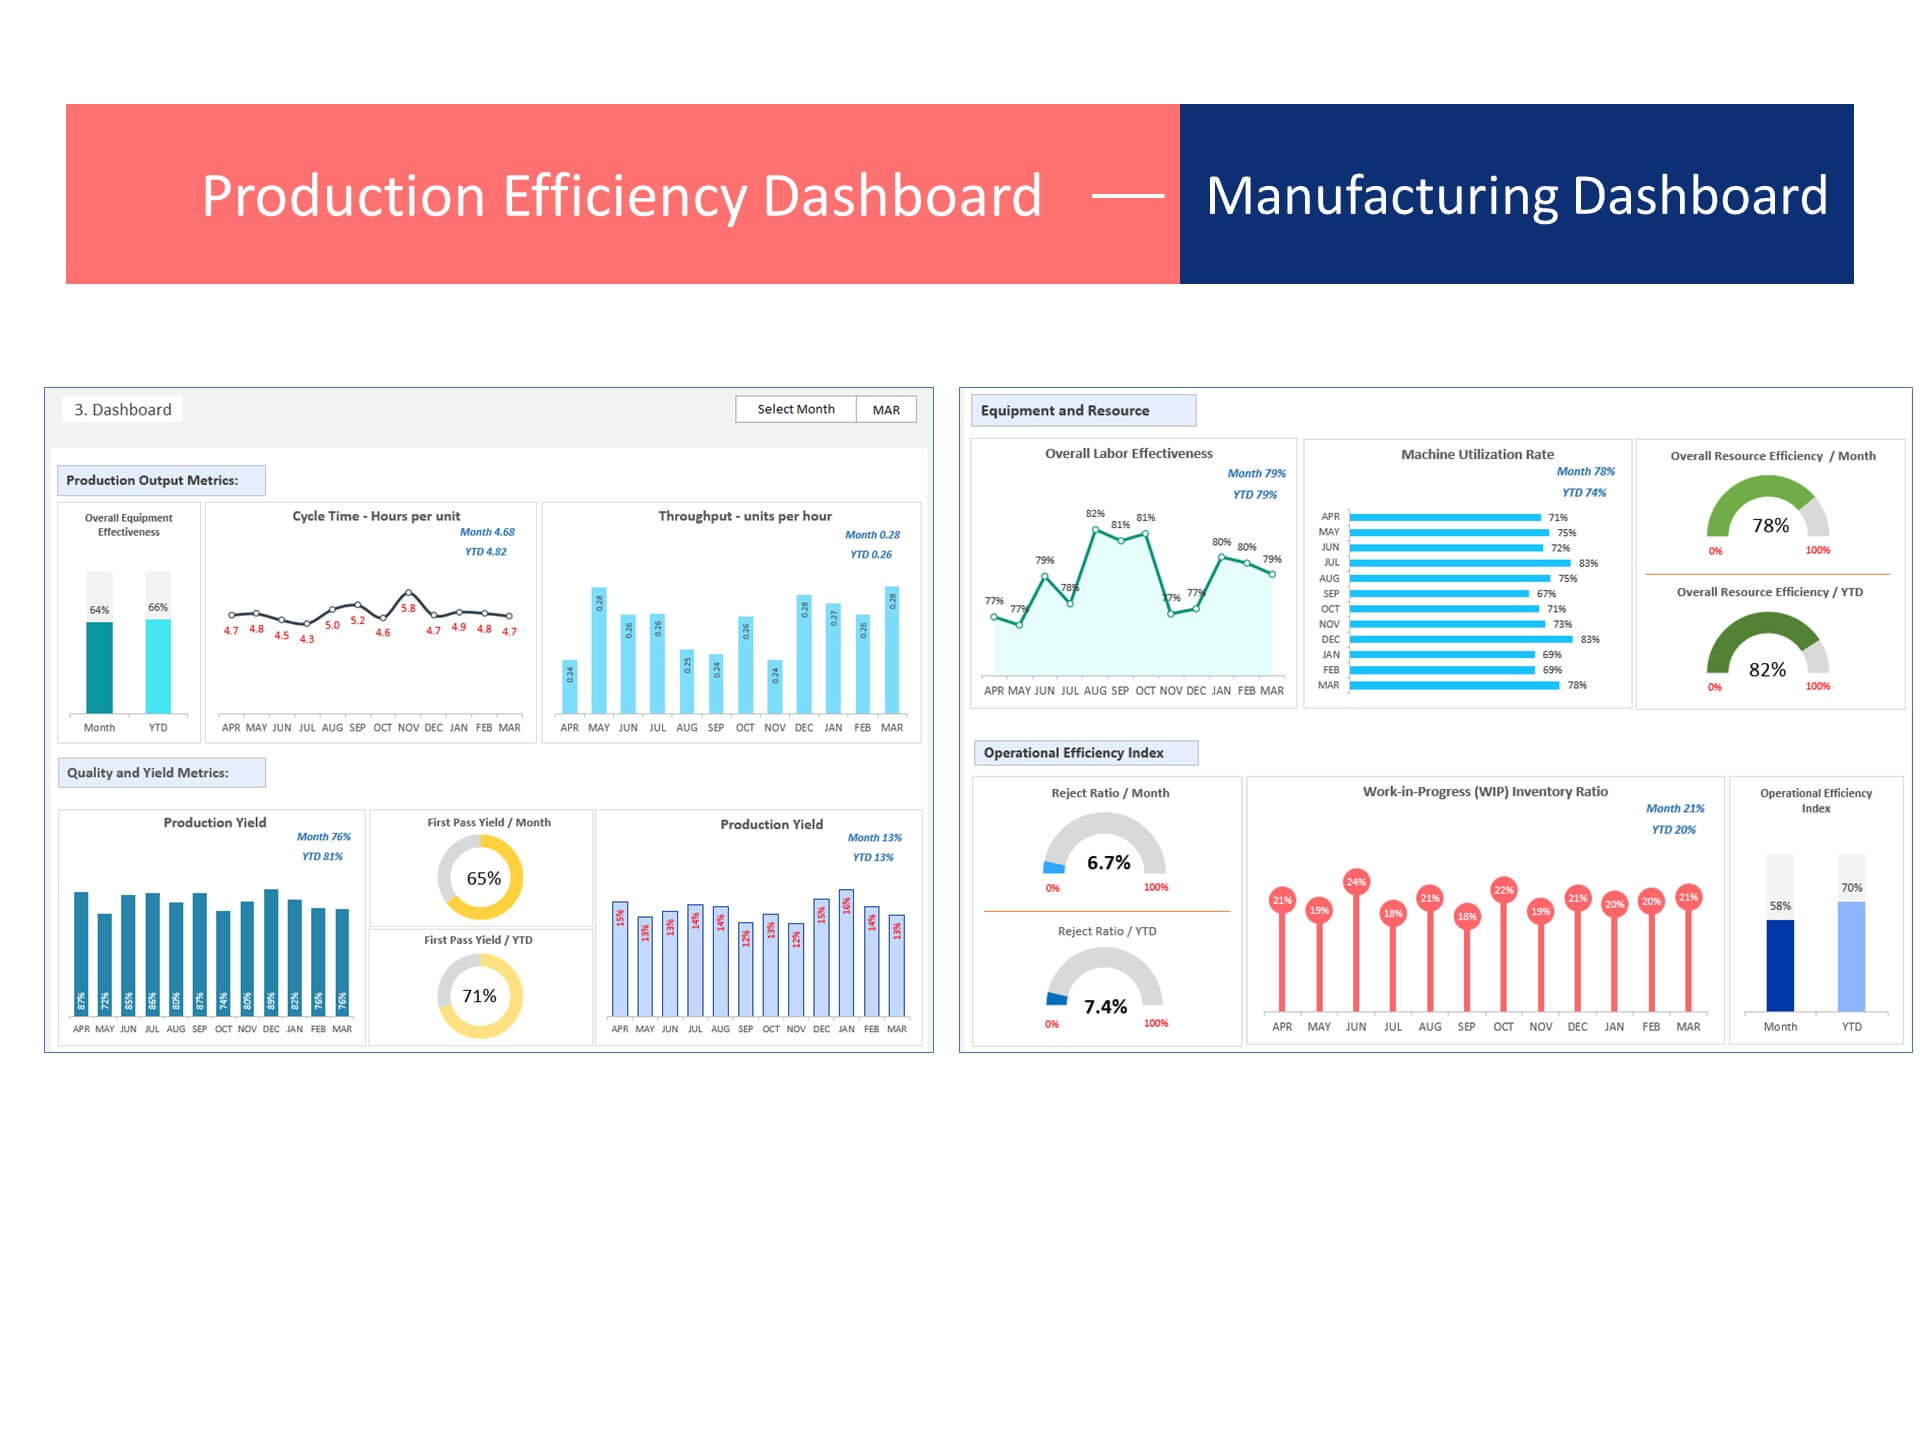
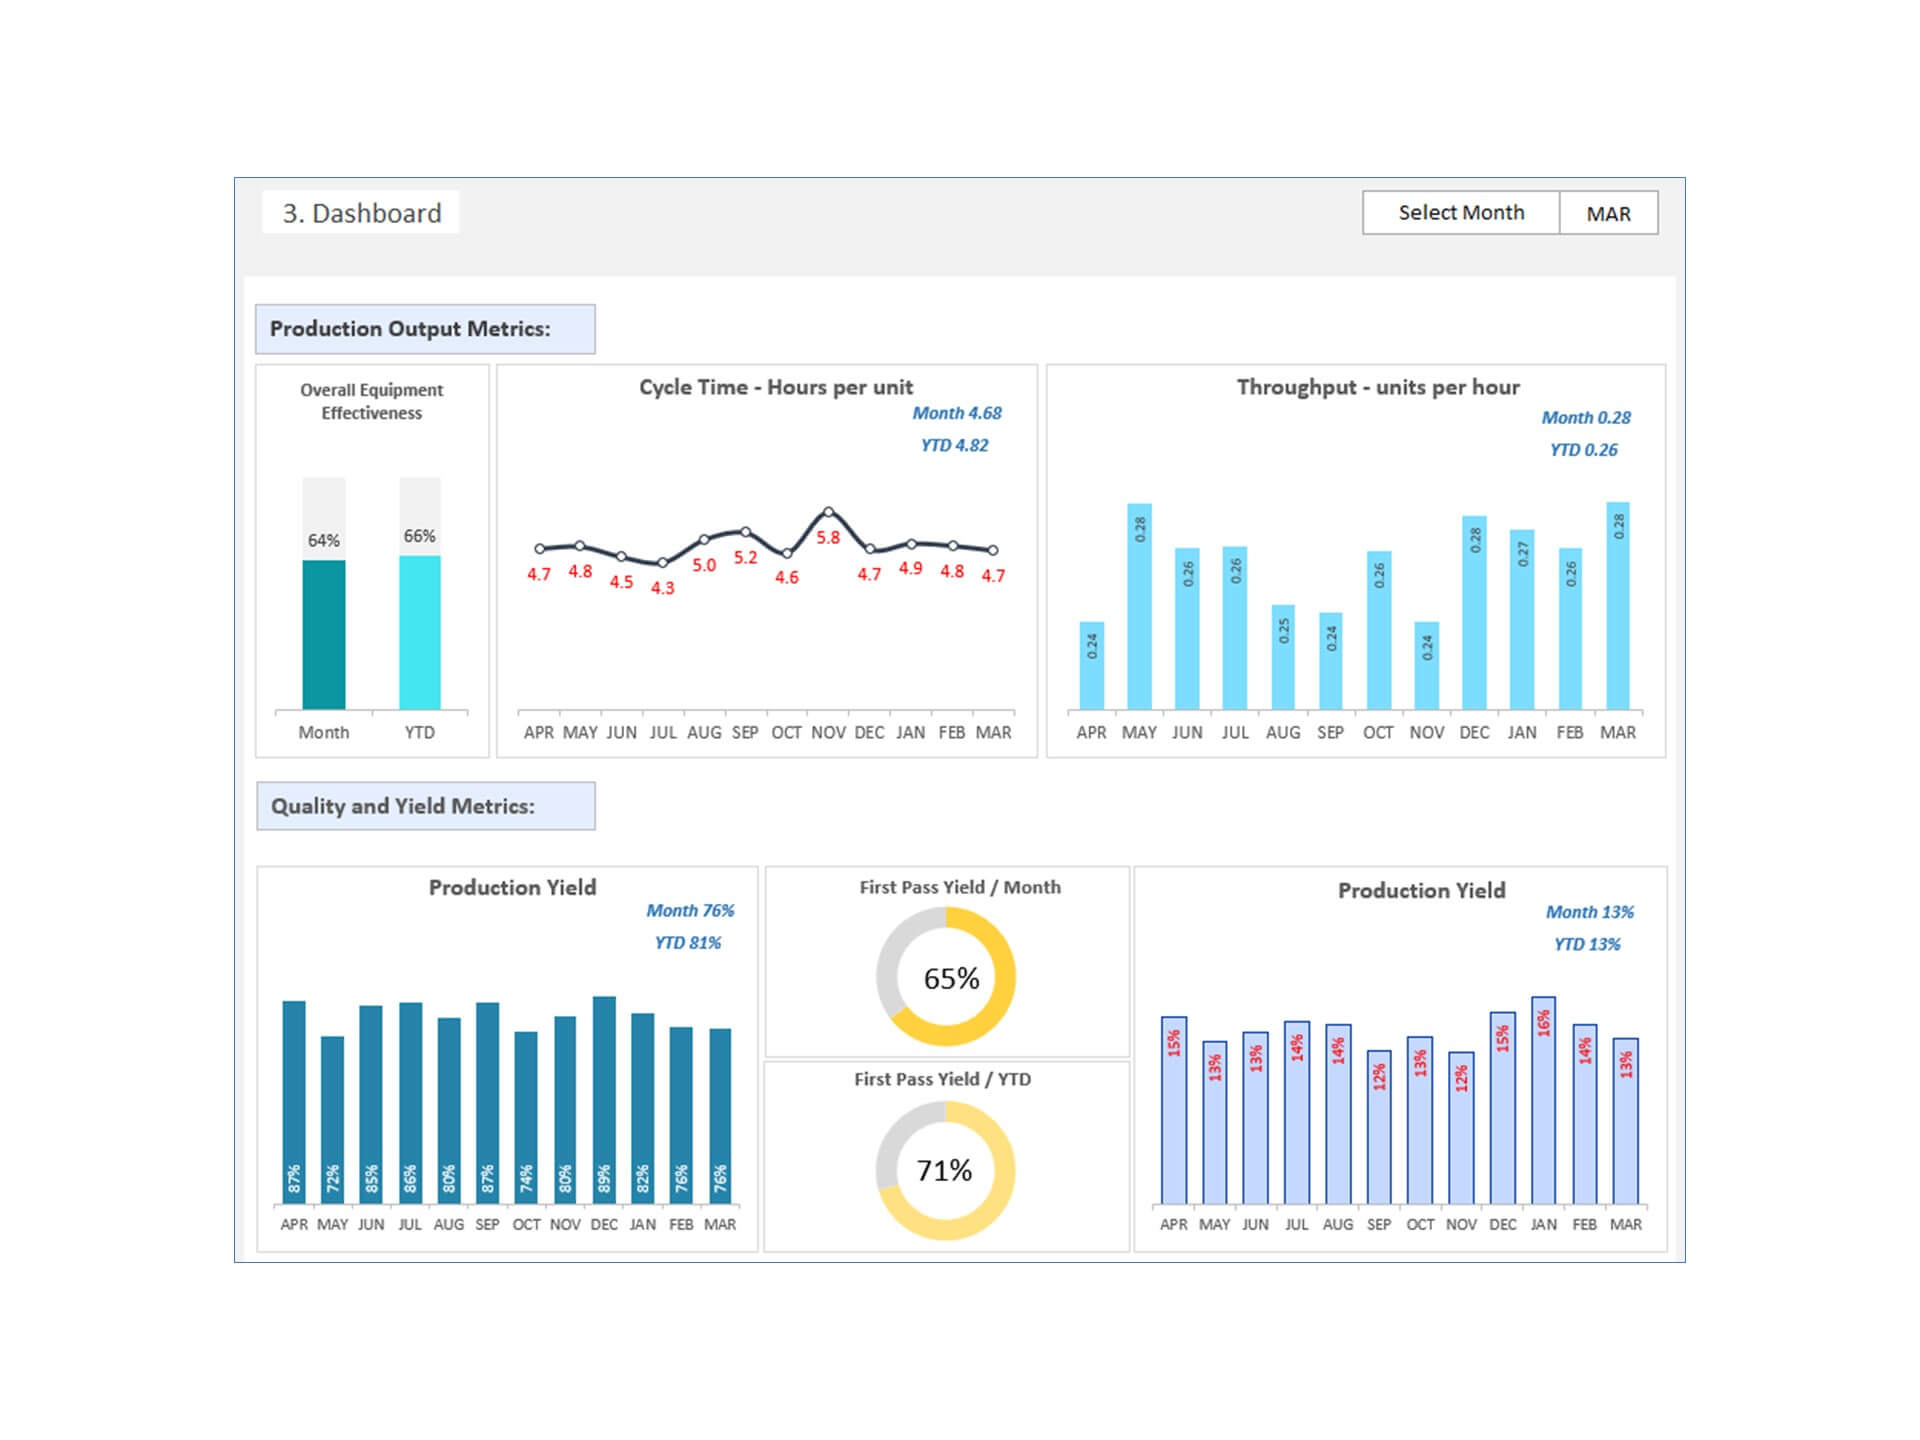
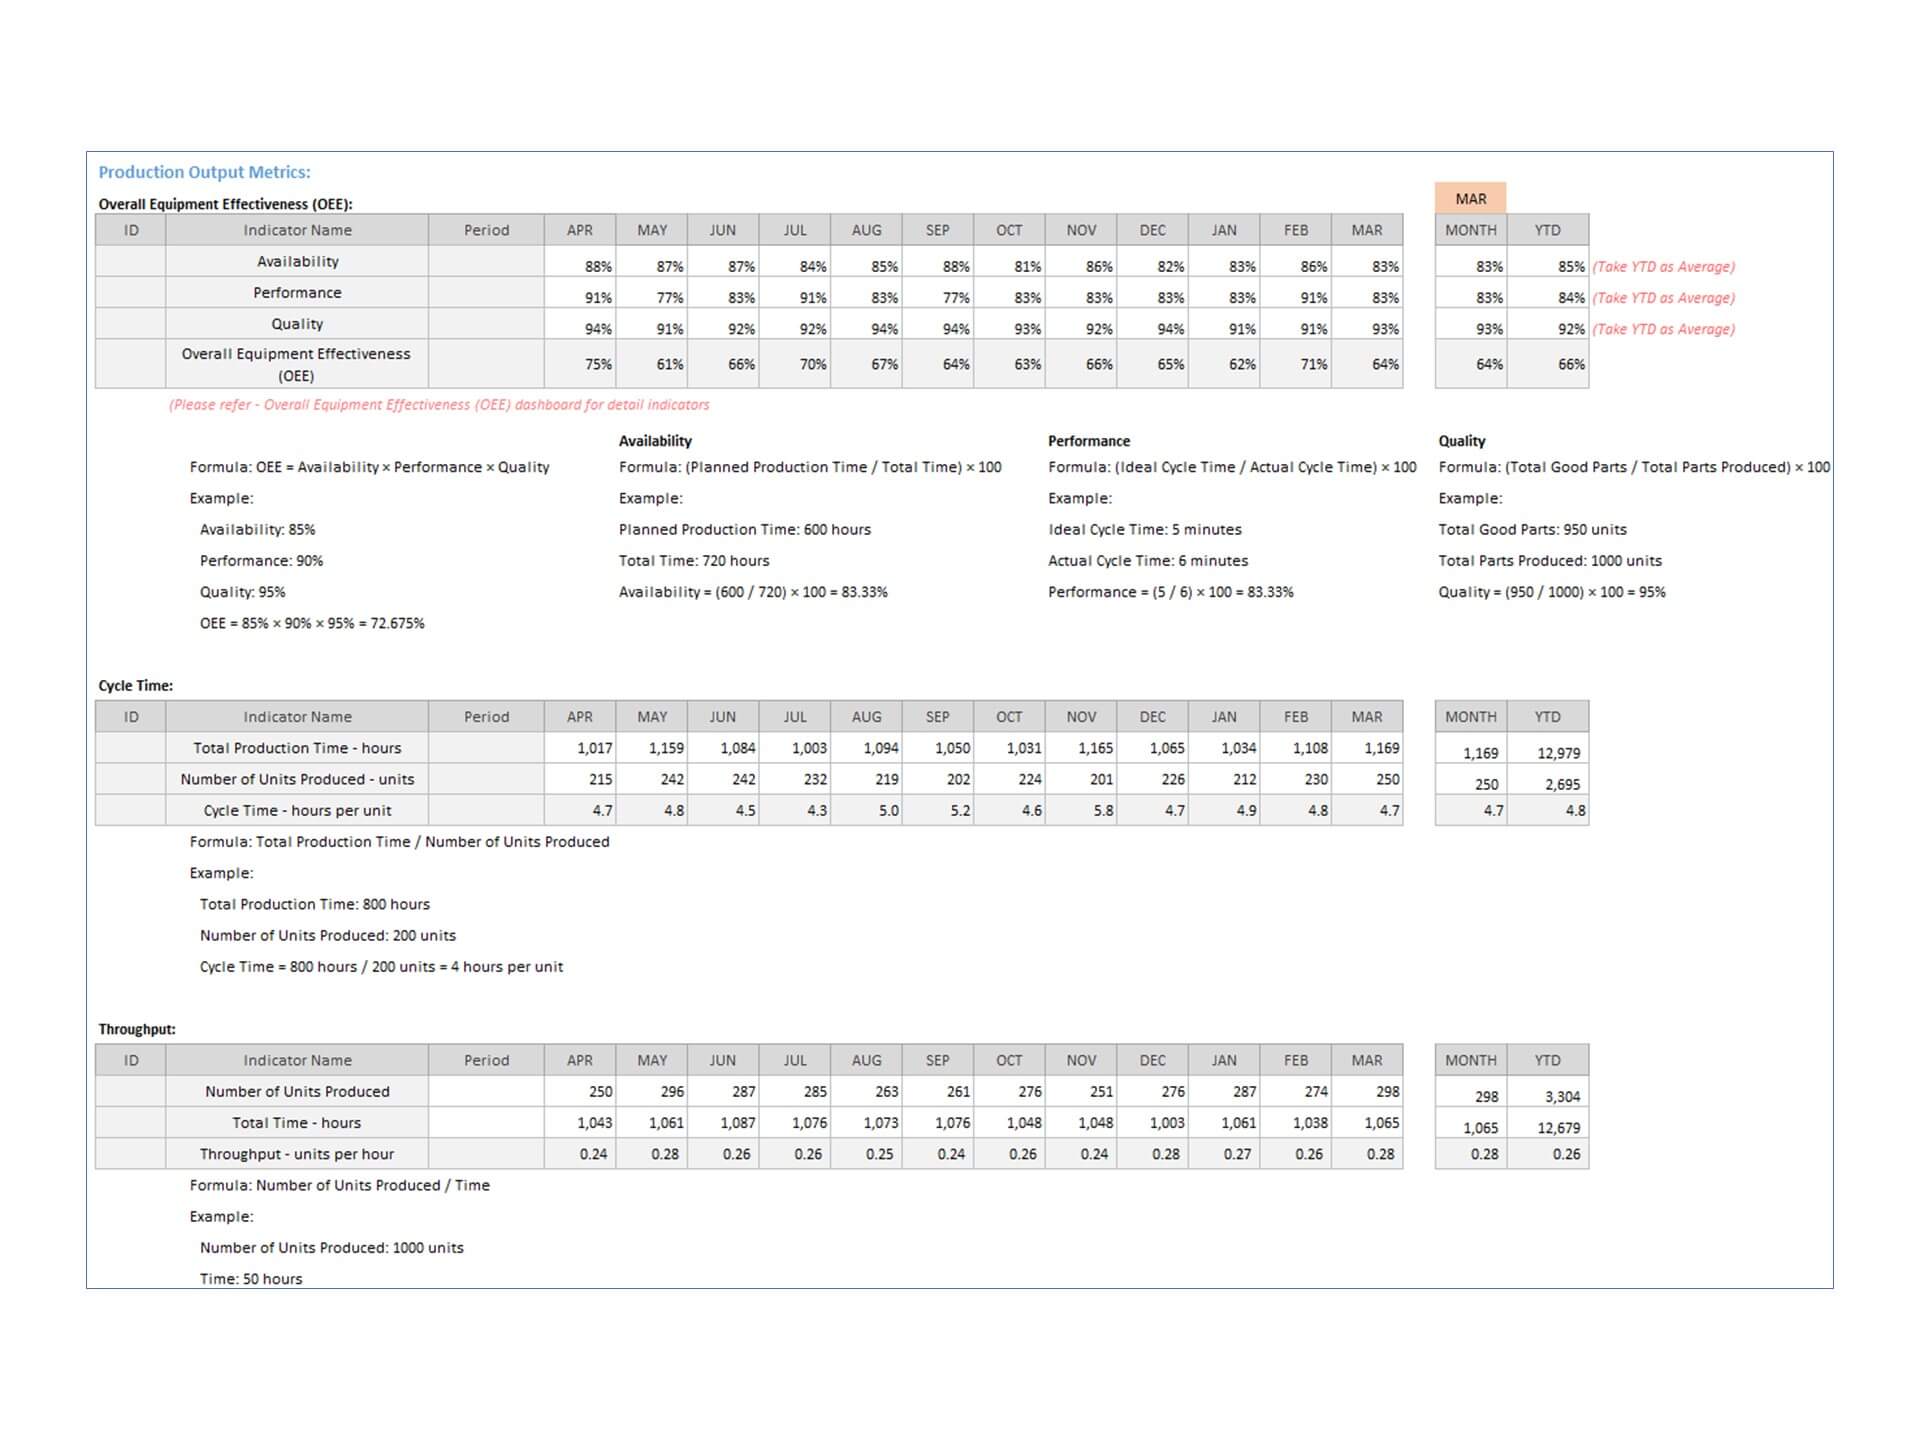
The Production Efficiency Dashboard in Excel – Manufacturing Dashboard epitomizes a comprehensive toolkit tailored for manufacturing professionals seeking to optimize production processes and bolster operational excellence. Central to this dashboard is the Overall Equipment Effectiveness (OEE), a fundamental measure amalgamating availability, performance, and quality metrics. OEE serves as a pivotal benchmark, offering a holistic view of equipment efficiency by quantifying how well resources are utilized, how efficiently they perform, and the quality of output. This multifaceted index enables teams to identify bottlenecks, strategize improvements, and drive consistent enhancements in production efficiency.
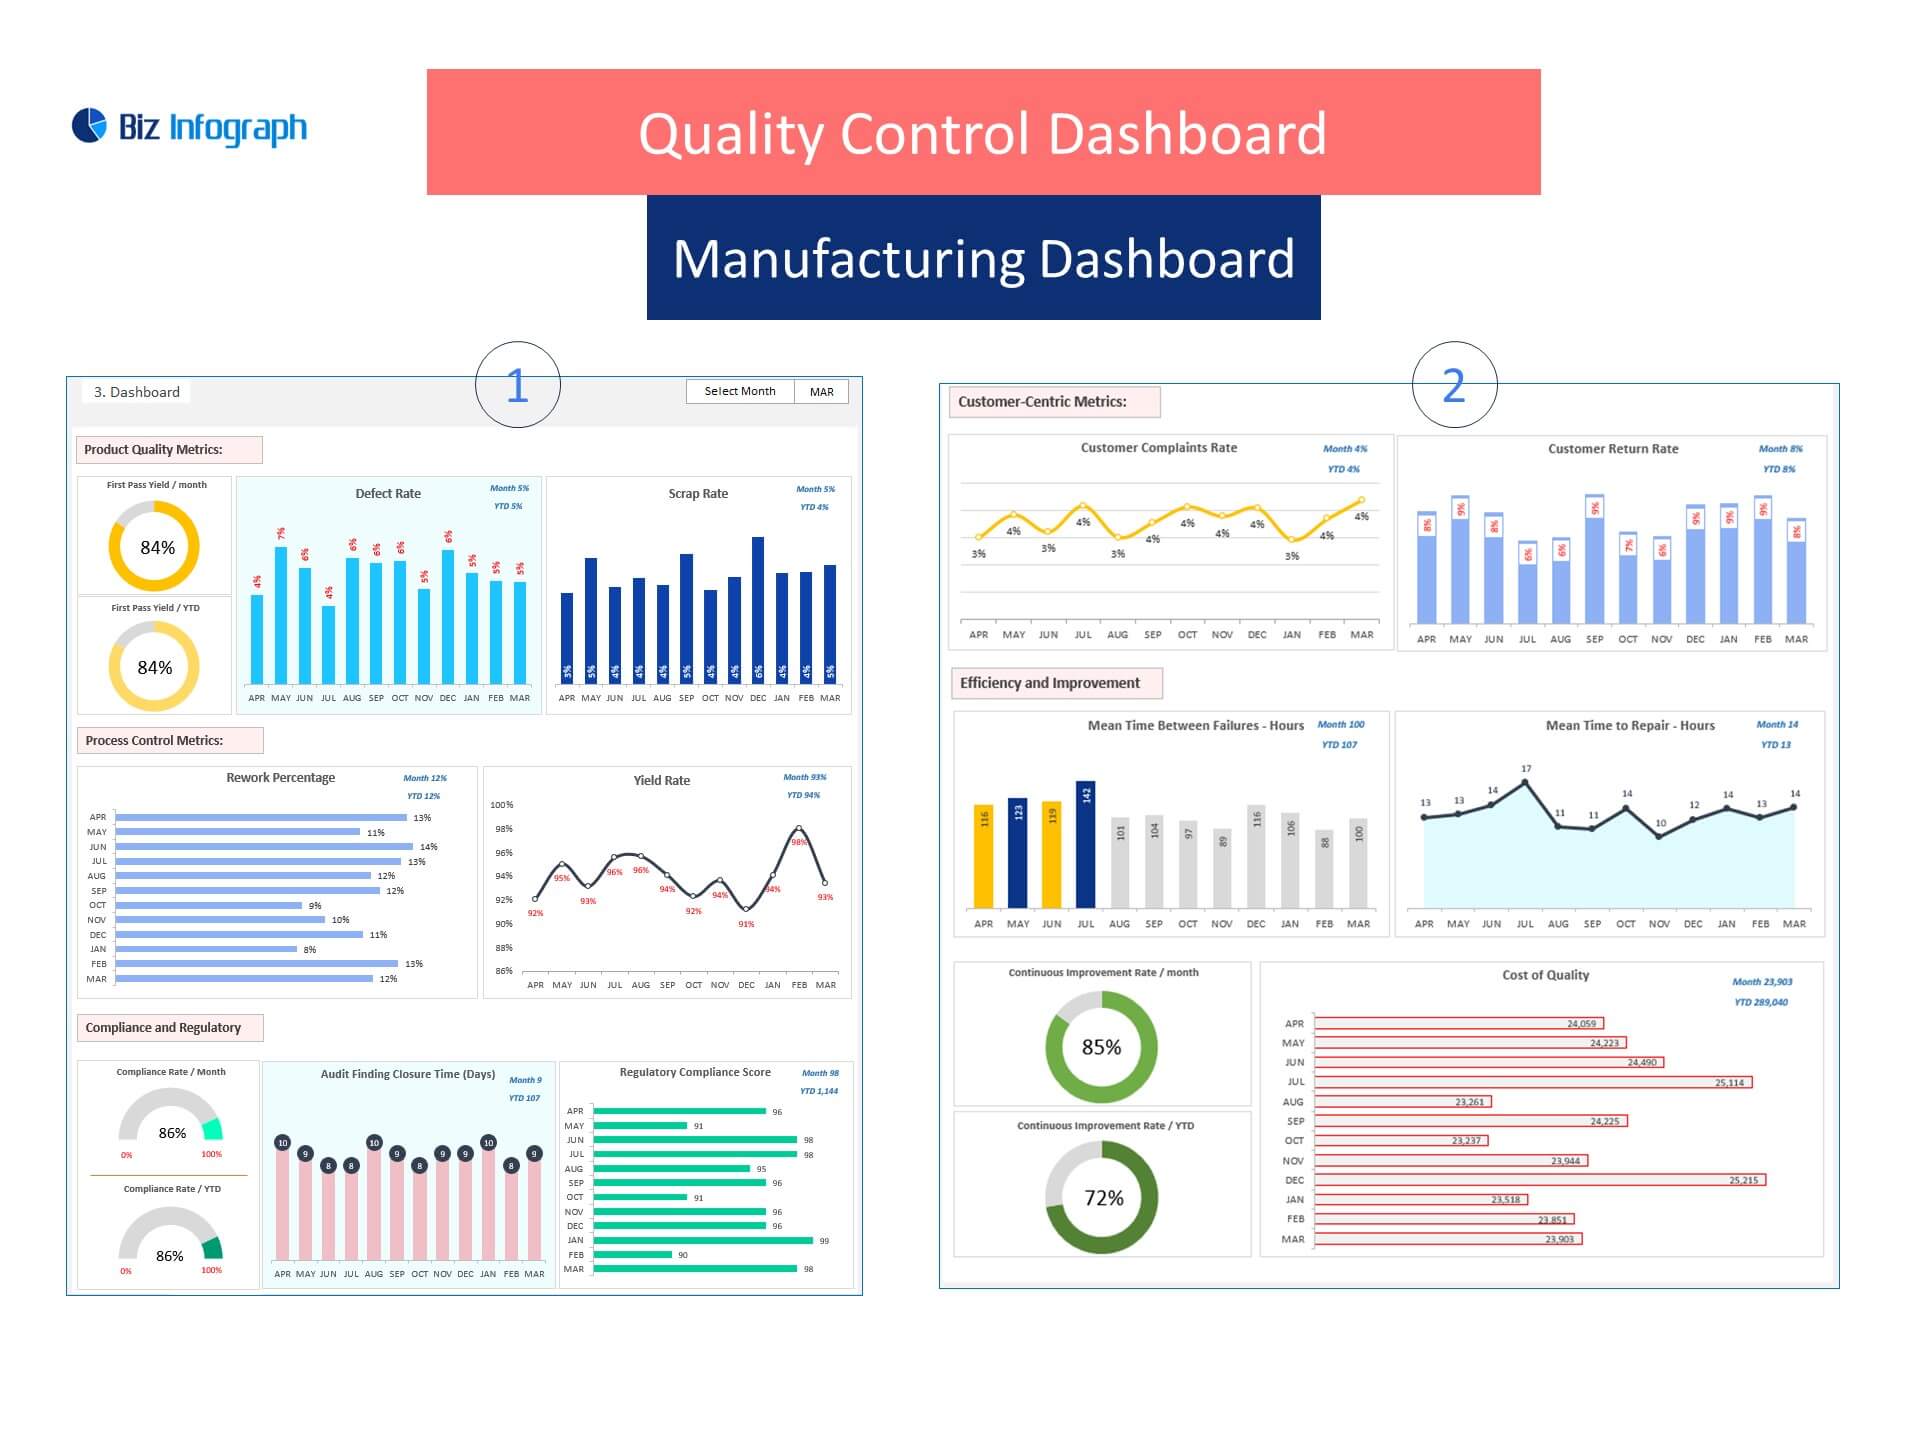
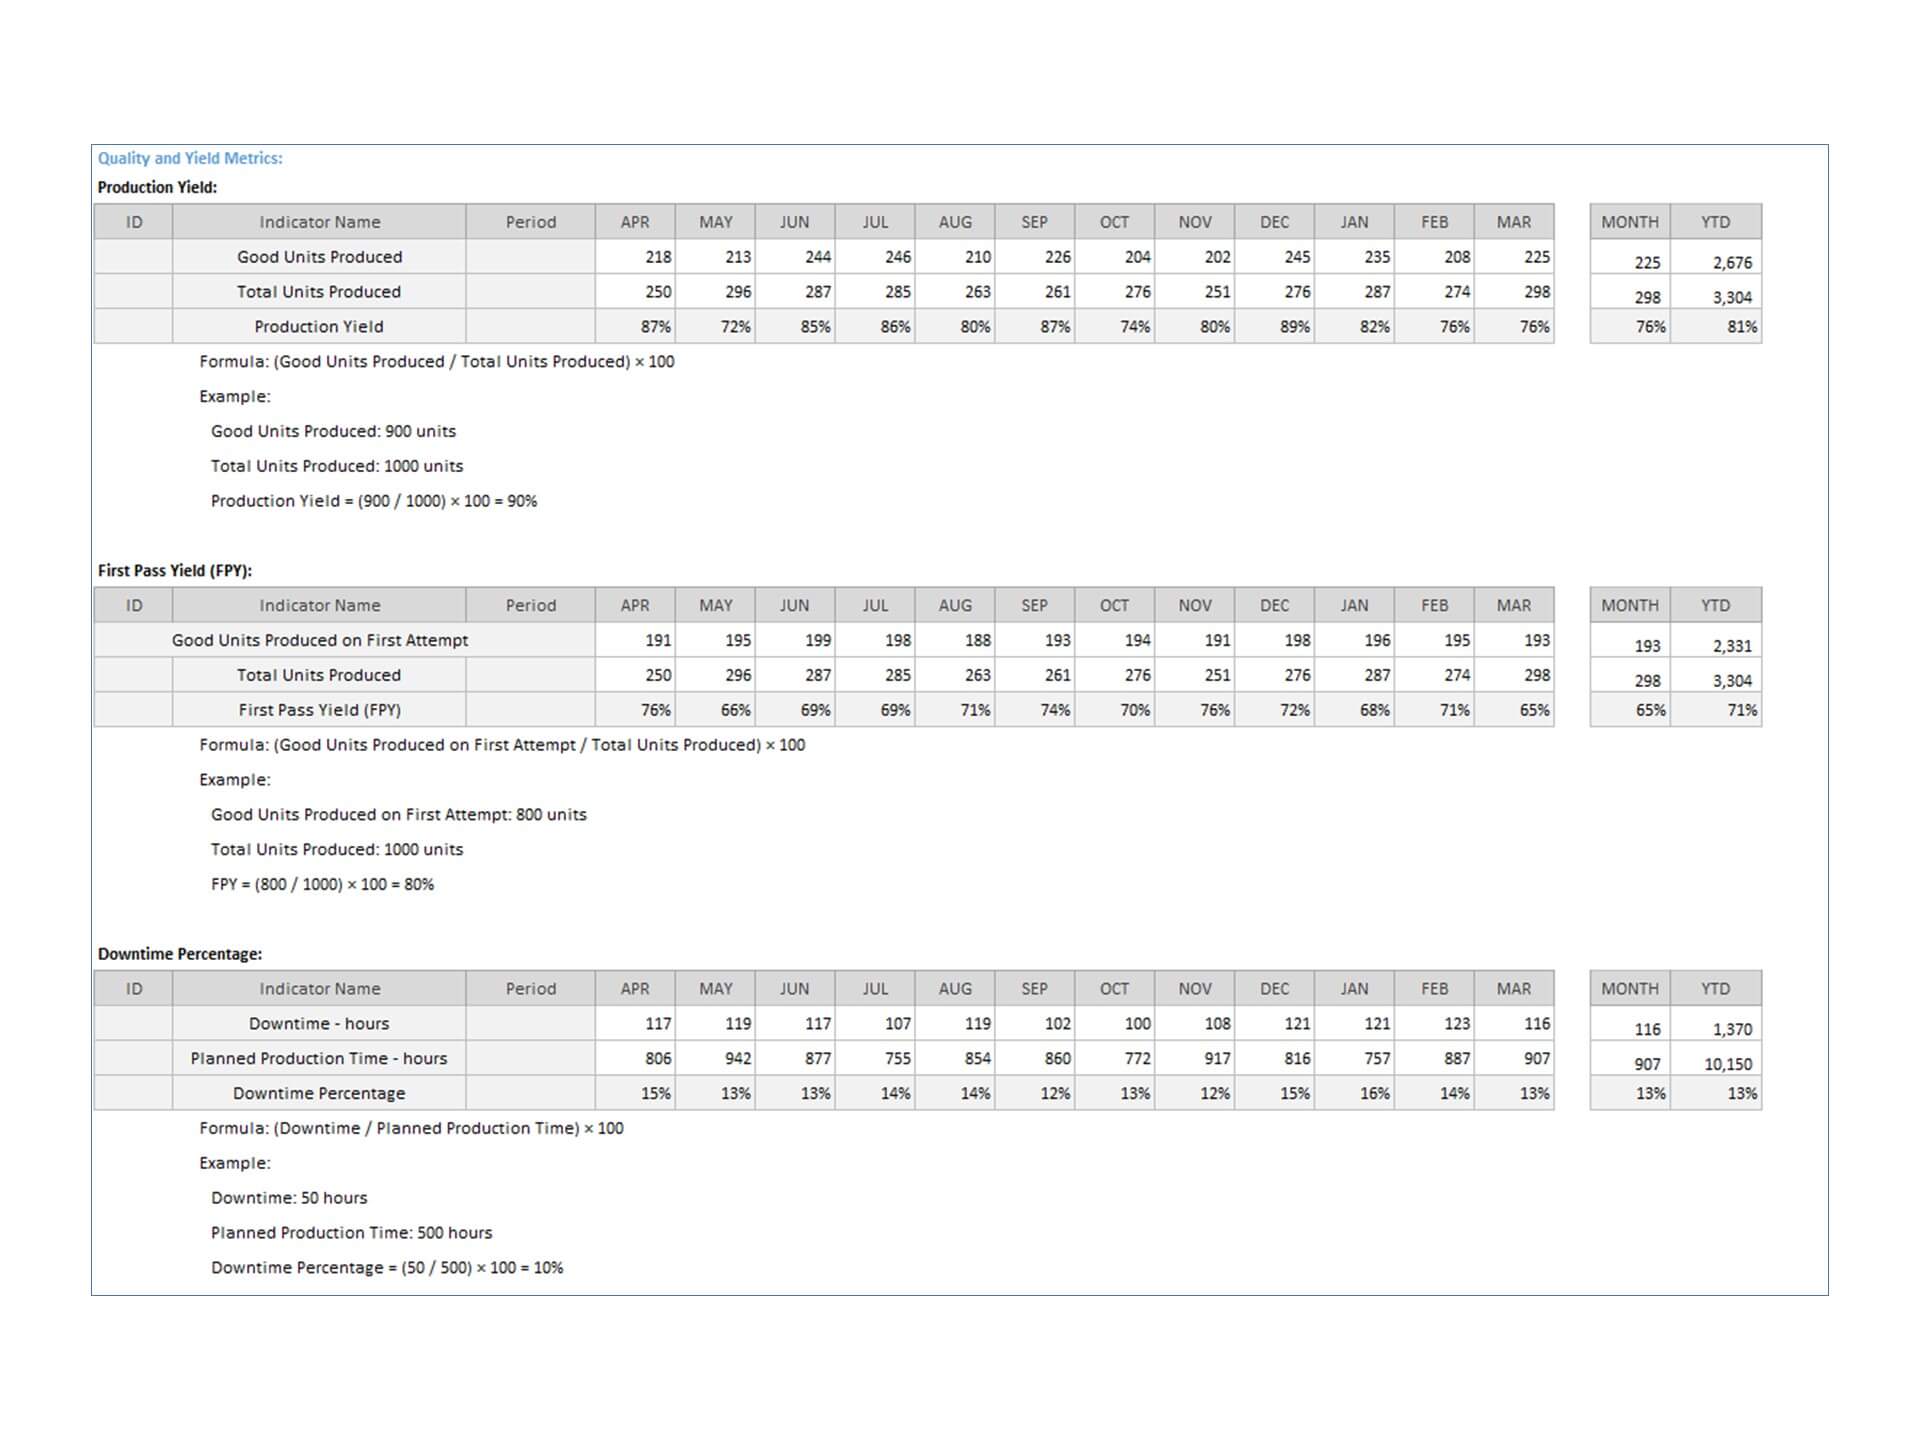
Quality and yield metrics within this dashboard are instrumental in scrutinizing the production output against predefined quality standards. By evaluating the percentage of defect-free products and the yield of acceptable units from raw materials, manufacturing teams gain insights into process integrity and product quality. This segment facilitates proactive measures to enhance product quality, reduce waste, and fortify customer satisfaction, thereby fostering a culture of continuous improvement within the production cycle.
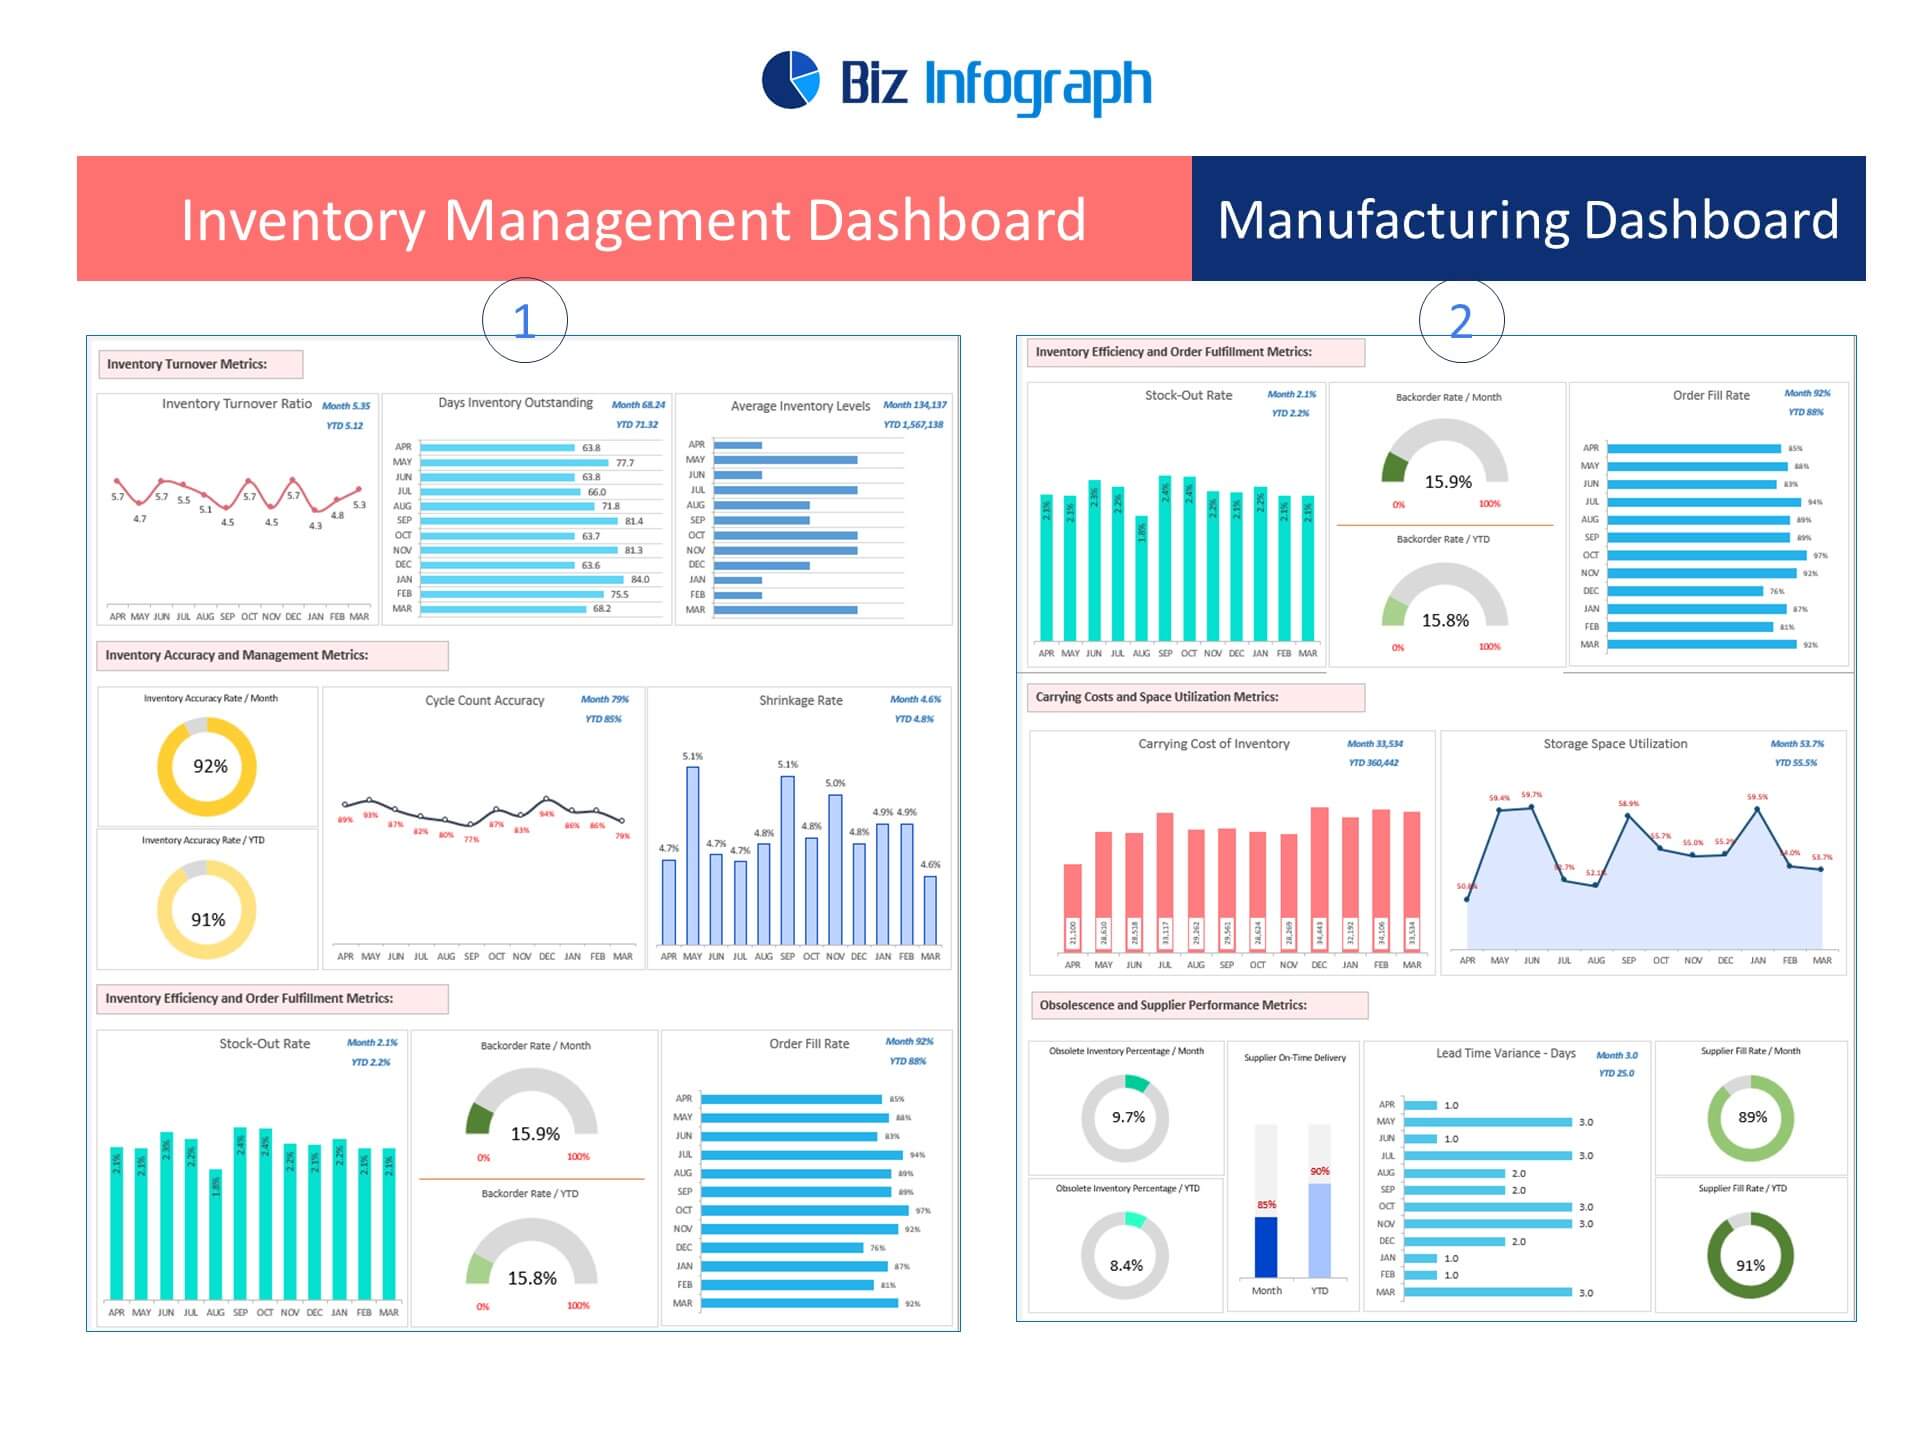
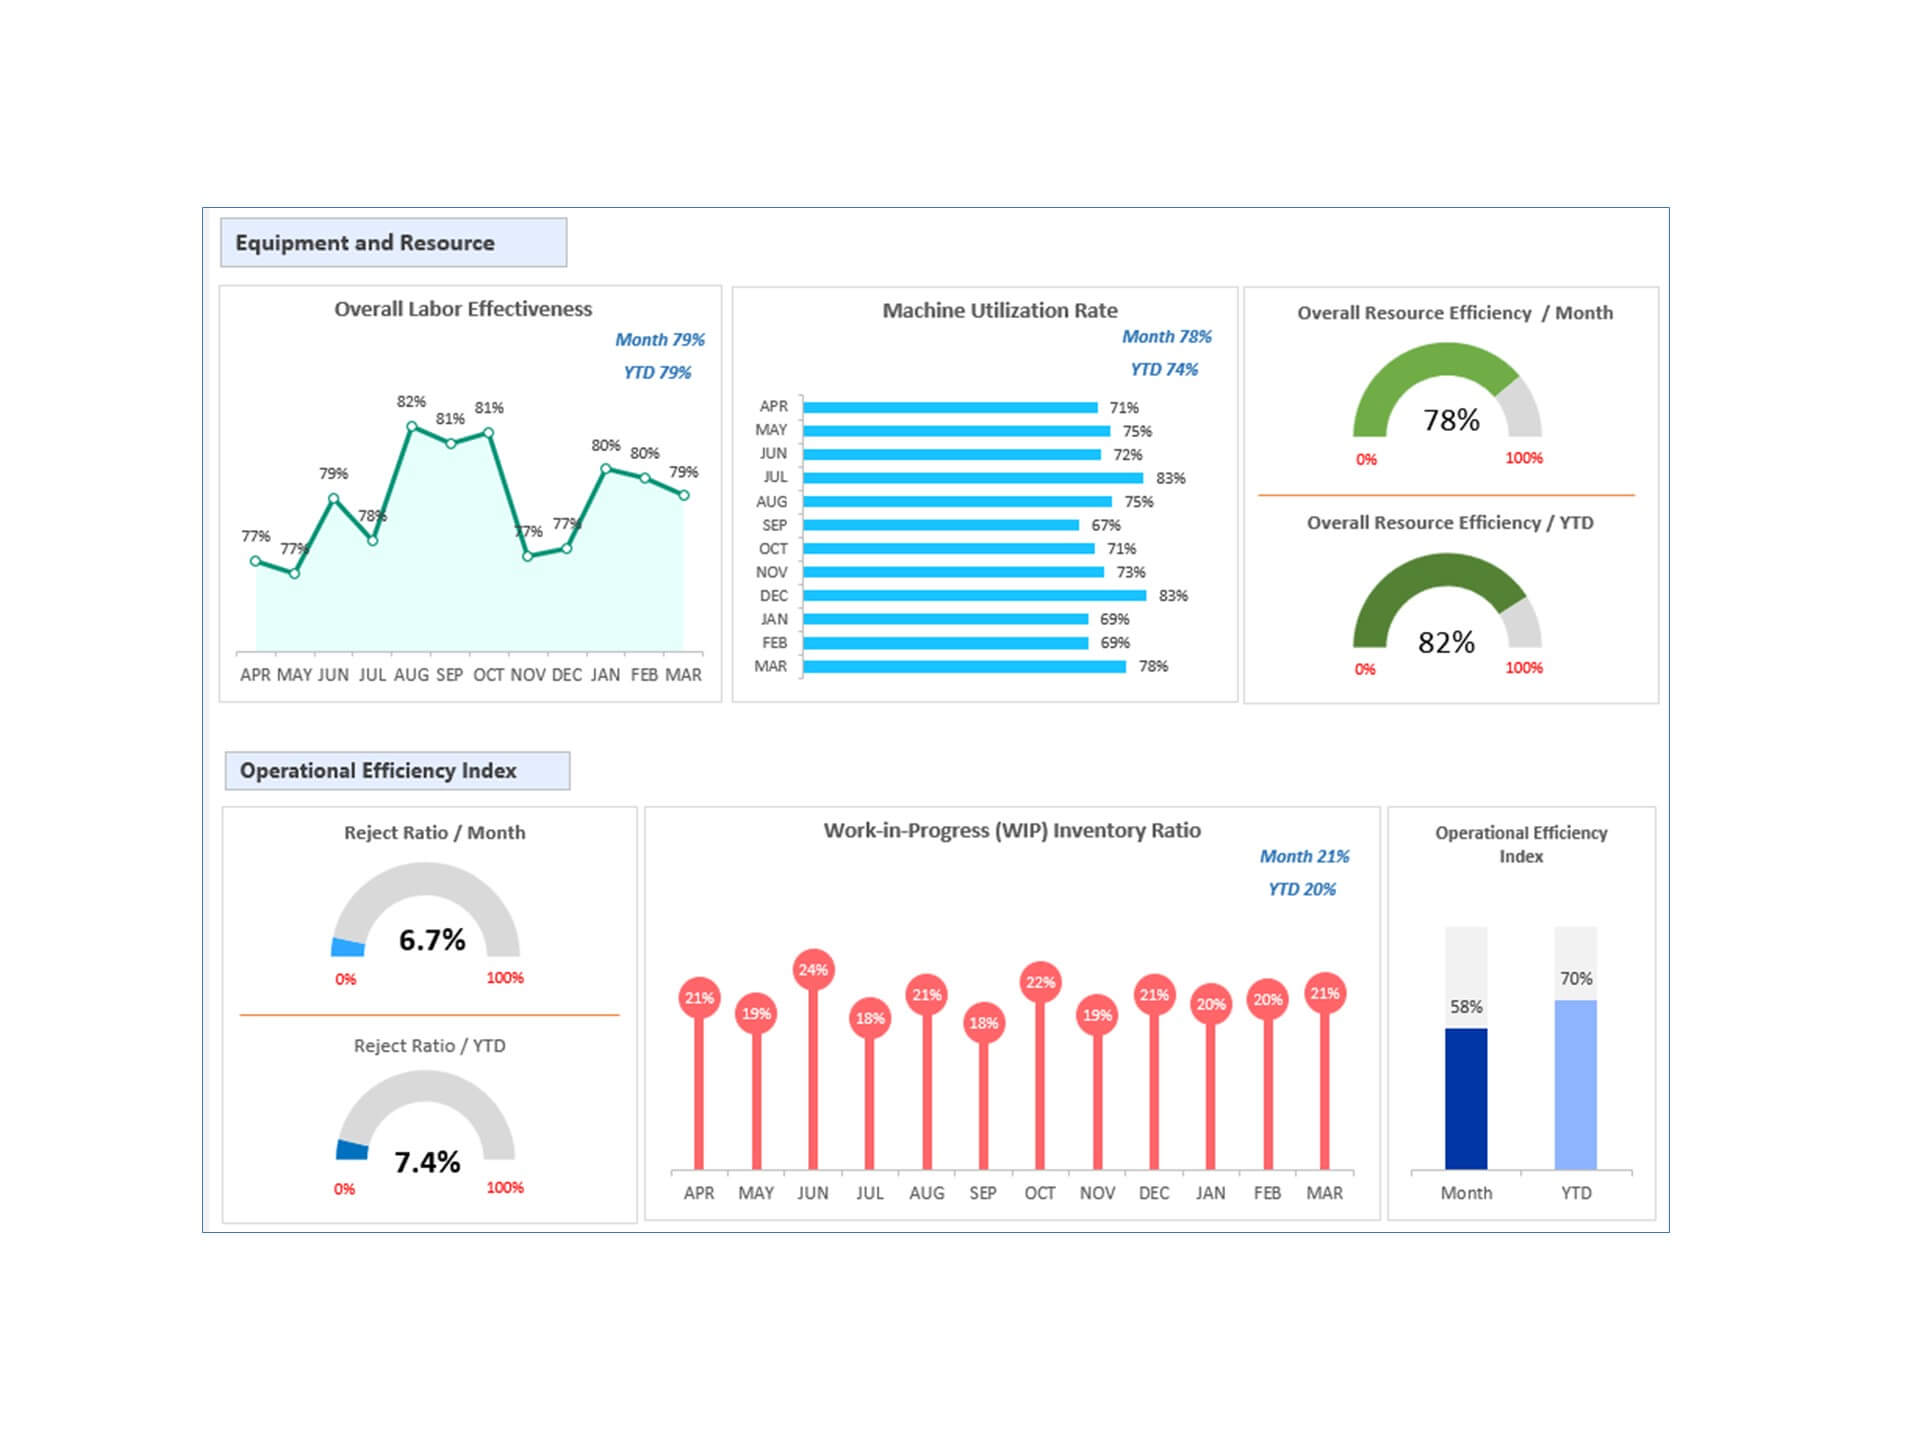
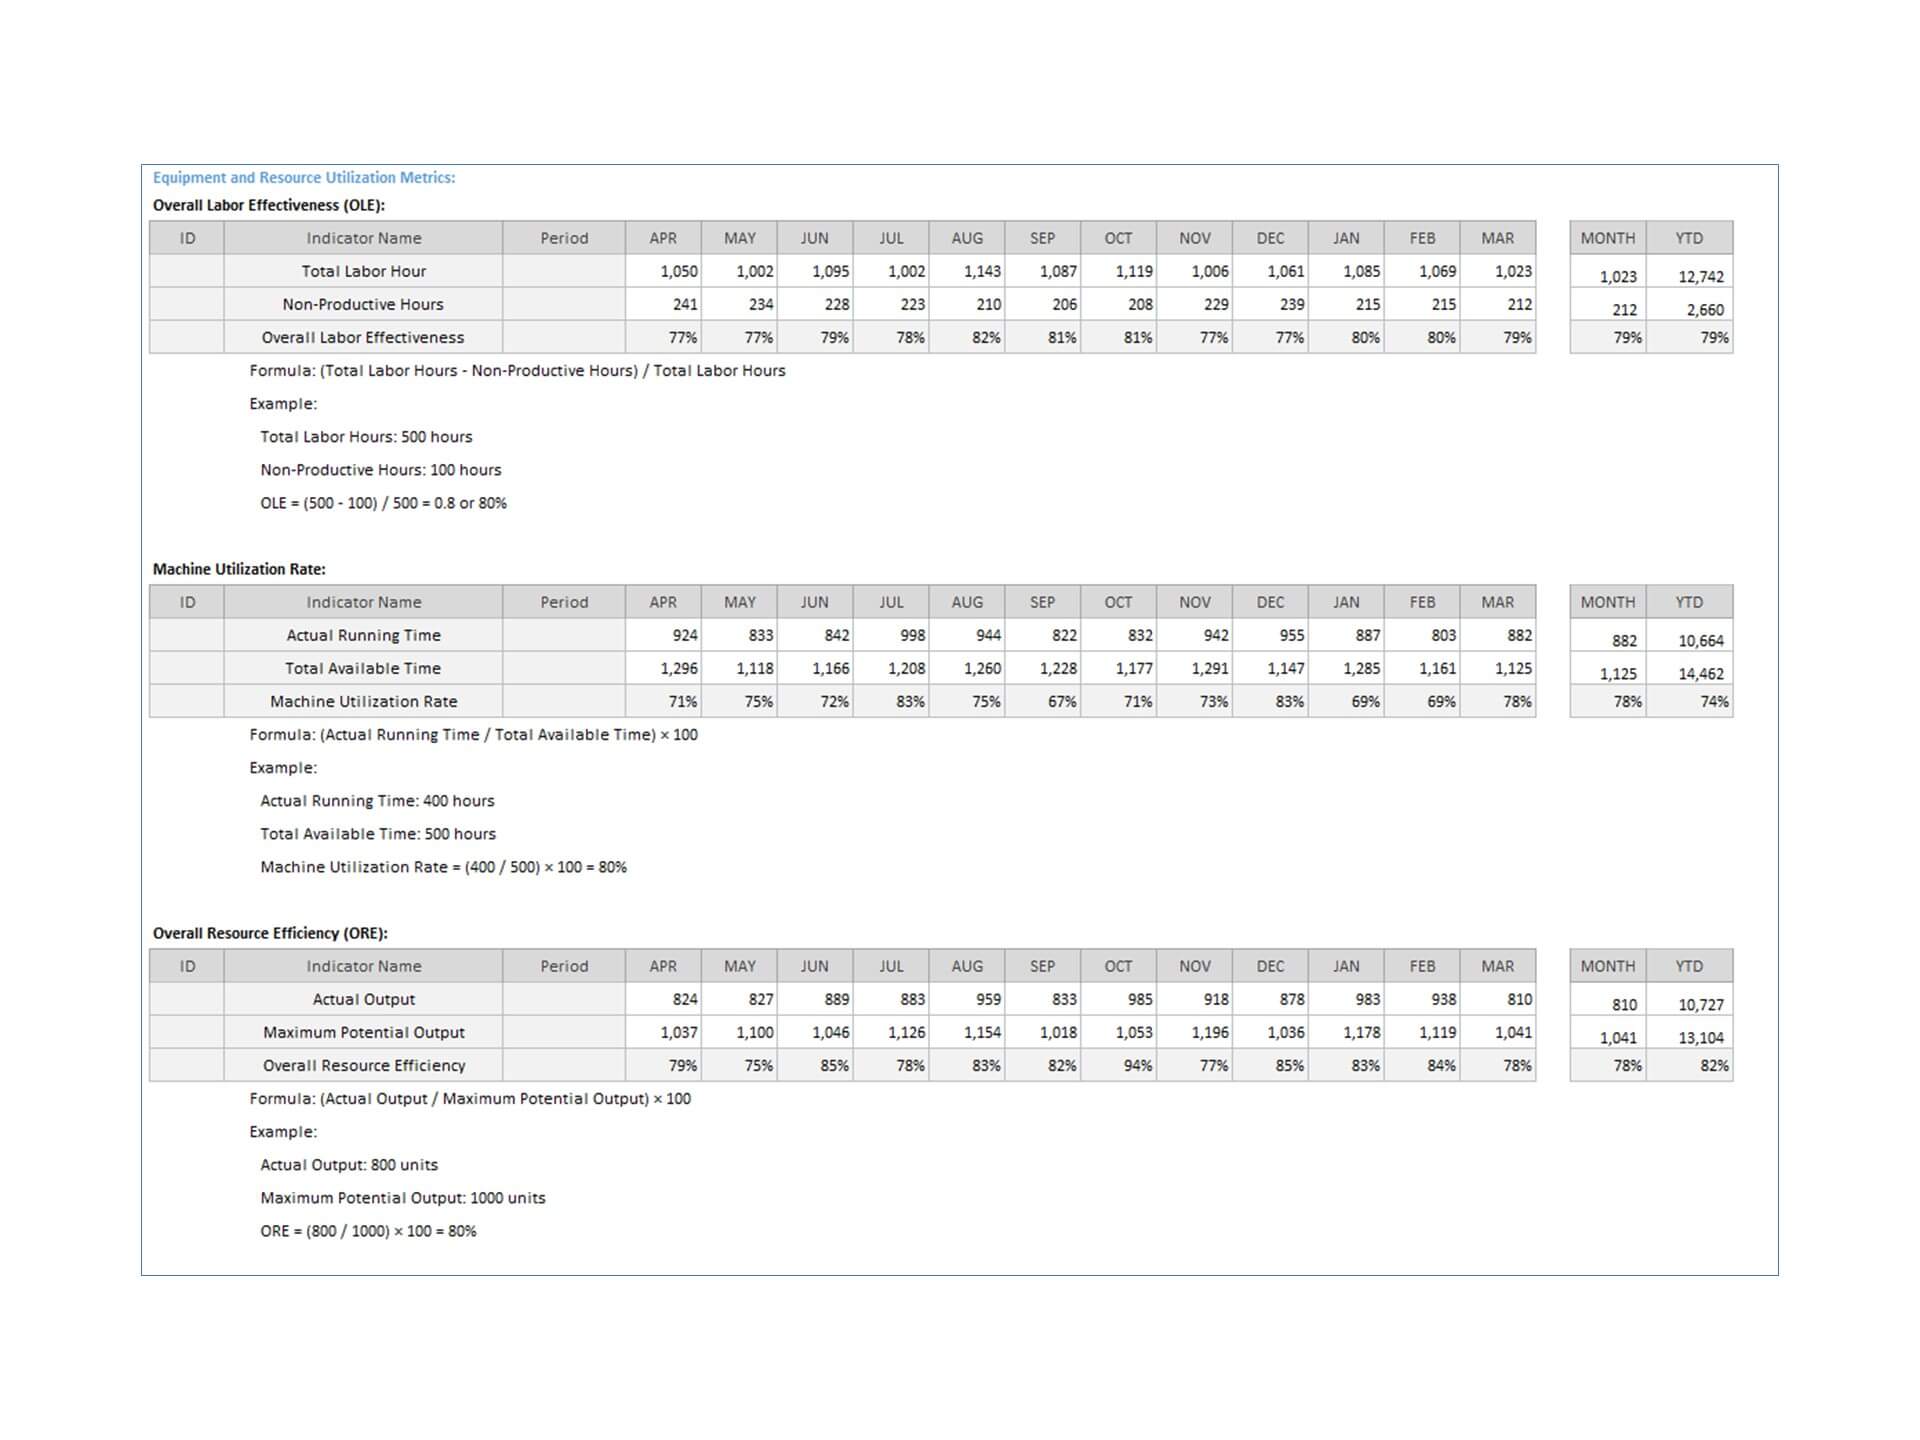
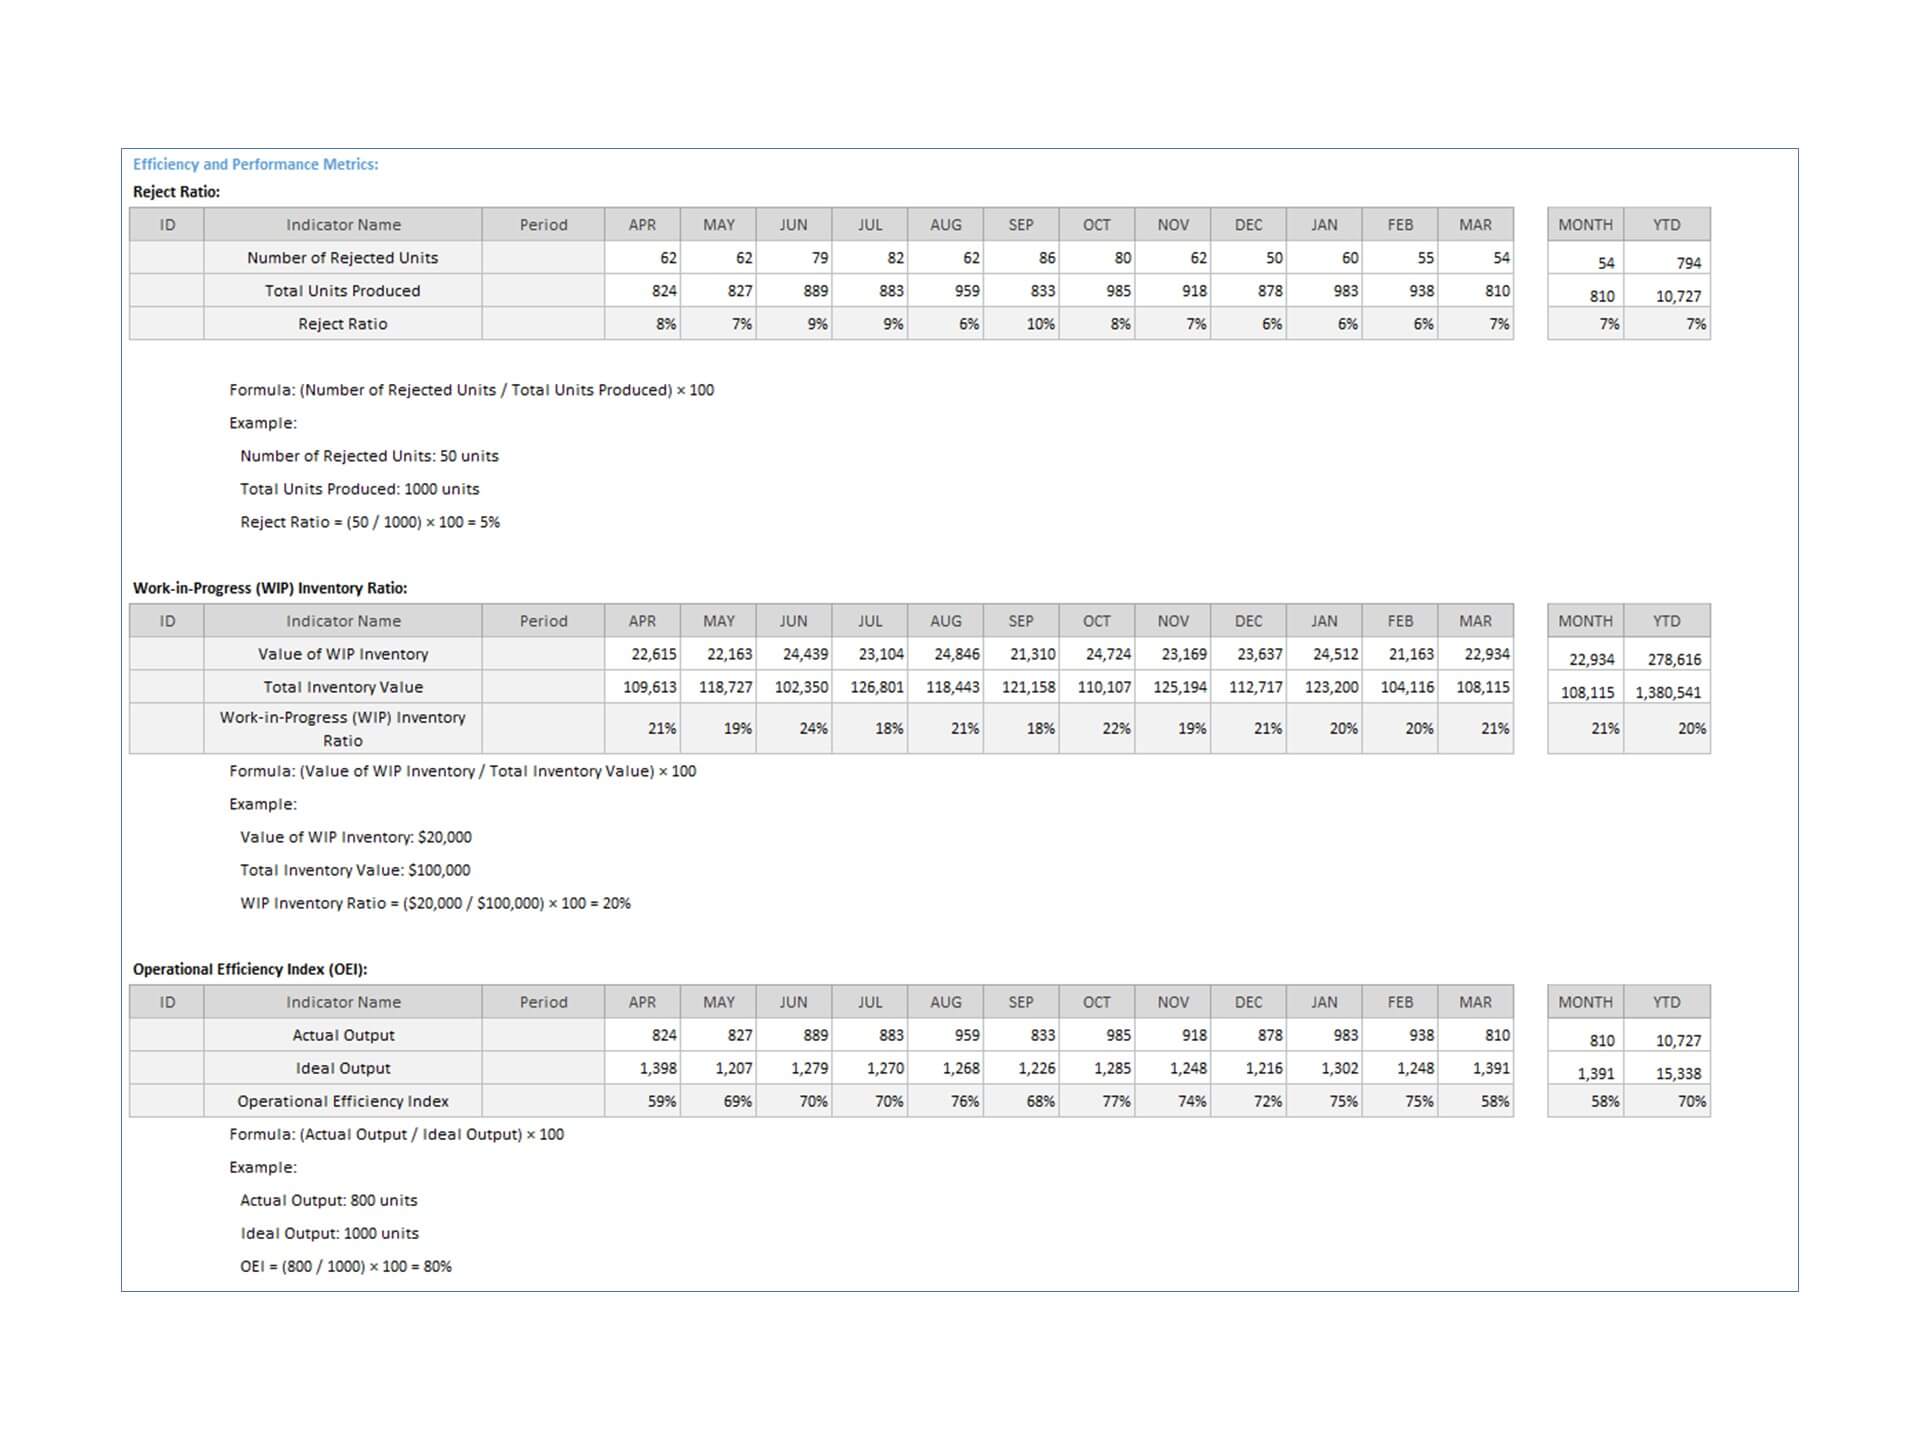
The dashboard delves into equipment and resource utilization metrics, providing a comprehensive overview of how effectively assets are utilized during production. This includes insights into machinery uptime, downtime, changeovers, and overall resource allocation. Evaluating equipment and resource utilization aids in pinpointing underutilized resources or bottlenecks in equipment efficiency, fostering strategies to optimize asset deployment, minimize downtime, and maximize production output. Simultaneously, efficiency and performance metrics hone in on the speed, effectiveness, and output of machinery and processes. By benchmarking actual performance against expected or ideal outputs, these metrics unveil areas for enhancement, empowering teams to streamline operations, reduce inefficiencies, and elevate overall manufacturing efficiency.
Key Features:
- Fully editable, easy to use, template with sample data
- Eye-catching design and customizable
- Change the sample data with your data
- Spreadsheets ready for printing without Biz Infograph logo
- Consolidate key business performance indicators in one dashboard
- No monthly fees
- Immediate download
- No VBA, no Macro
- No installation necessary
- Professionally designed
What is included in this dashboard template?
- Just plug your data, the rest dashboard will be ready instantly and start using.
- A guide to unlocking all the elements in the dashboard
Professional Support:
- Video tutorial guide on how to navigate and use Dashboard
- Professional service to customize dashboard template in Excel as per business need
- Help and support in post-purchase
- Payment secured by Stripe and PayPal (no PayPal account needed)
A brief guide to using the dashboard template:
- Open the dashboard template
- Go to the ‘Indicators’ menu – choose the start month of the fiscal year (i.e. Jan, Feb, Jul, etc.).
- Go to the respective Dashboard page and select the relevant Month to see the performance.
- Each page is ready for printing – just press CTRL+P
This Excel dashboard template is password-protected to avoid mistakes, such as accidentally deleting formulas. When you completed the purchase, the password will be available.