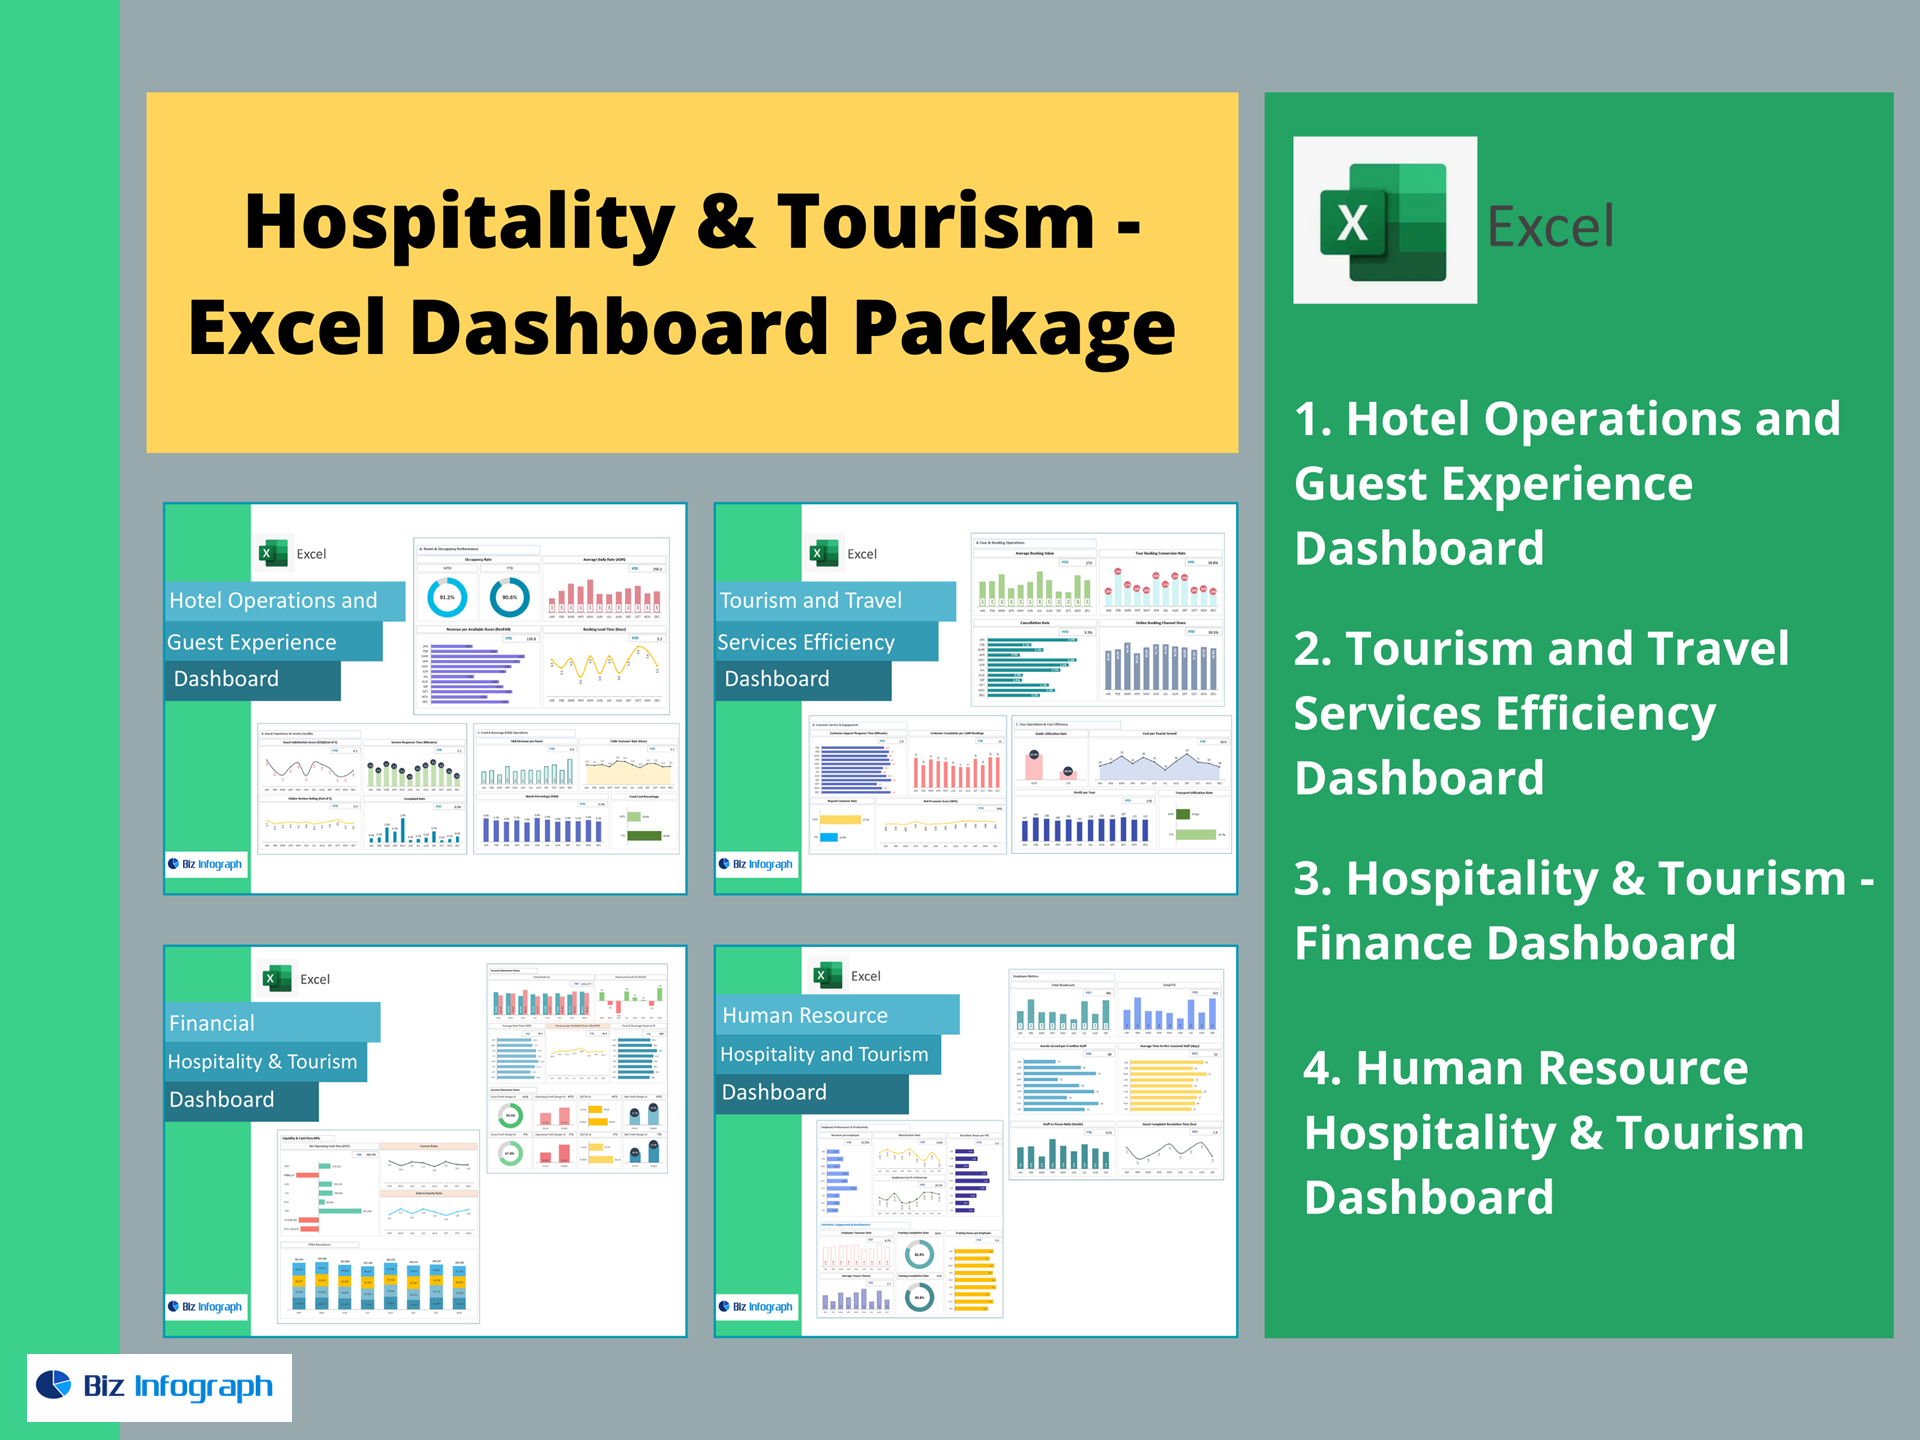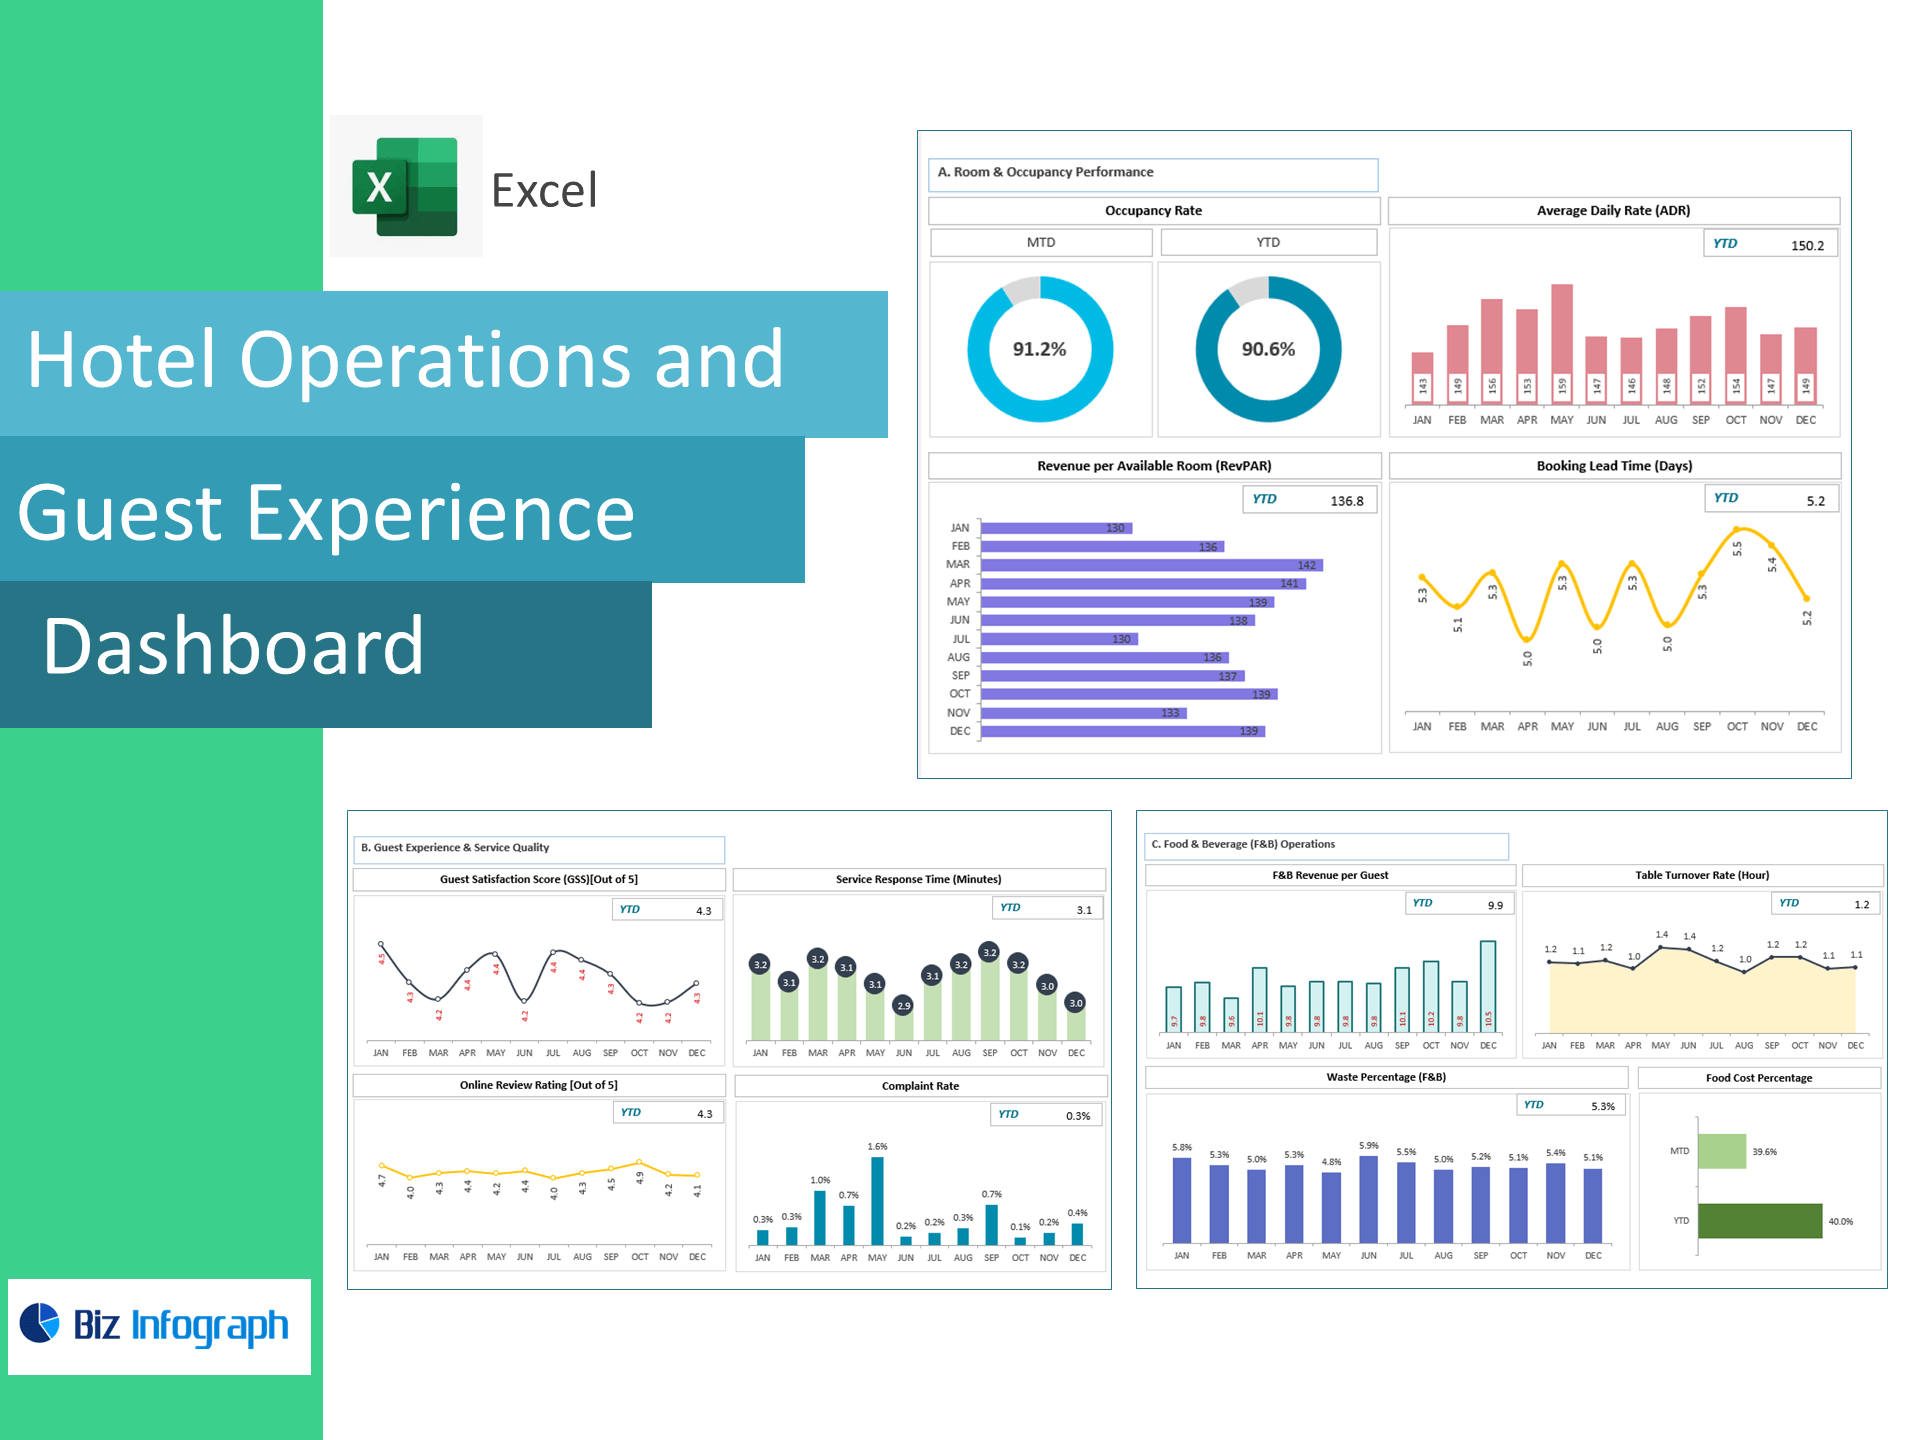
Hotel Operations & Guest Experience Dashboard — Excel Template
Lift occupancy, delight guests, and optimize F&B—right in Excel. Built for hotels, resorts, and serviced apartments, this template turns PMS, POS, and survey exports into a live dashboard tracking Occupancy Rate, ADR, RevPAR, Booking Lead Time, Guest Satisfaction Score (GSS), Online Review Rating, Service Response Time, Complaint Rate, F&B Revenue per Guest, Table Turnover Rate, Food Cost %, and Food Waste %—so you can grow RevPAR while improving service quality.
Why hoteliers choose this template
-
Ops + CX in one view: See how room performance and service speed impact reviews and repeat stays.
-
Revenue drivers at a glance: Monitor ADR/RevPAR and booking lead time to tune pricing and promos.
-
F&B efficiency: Control food cost %, raise table turns, and reduce waste.
-
Excel-native: Paste your CSVs and go—no add-ins or BI setup required.
KPIs included (ready-made formulas)
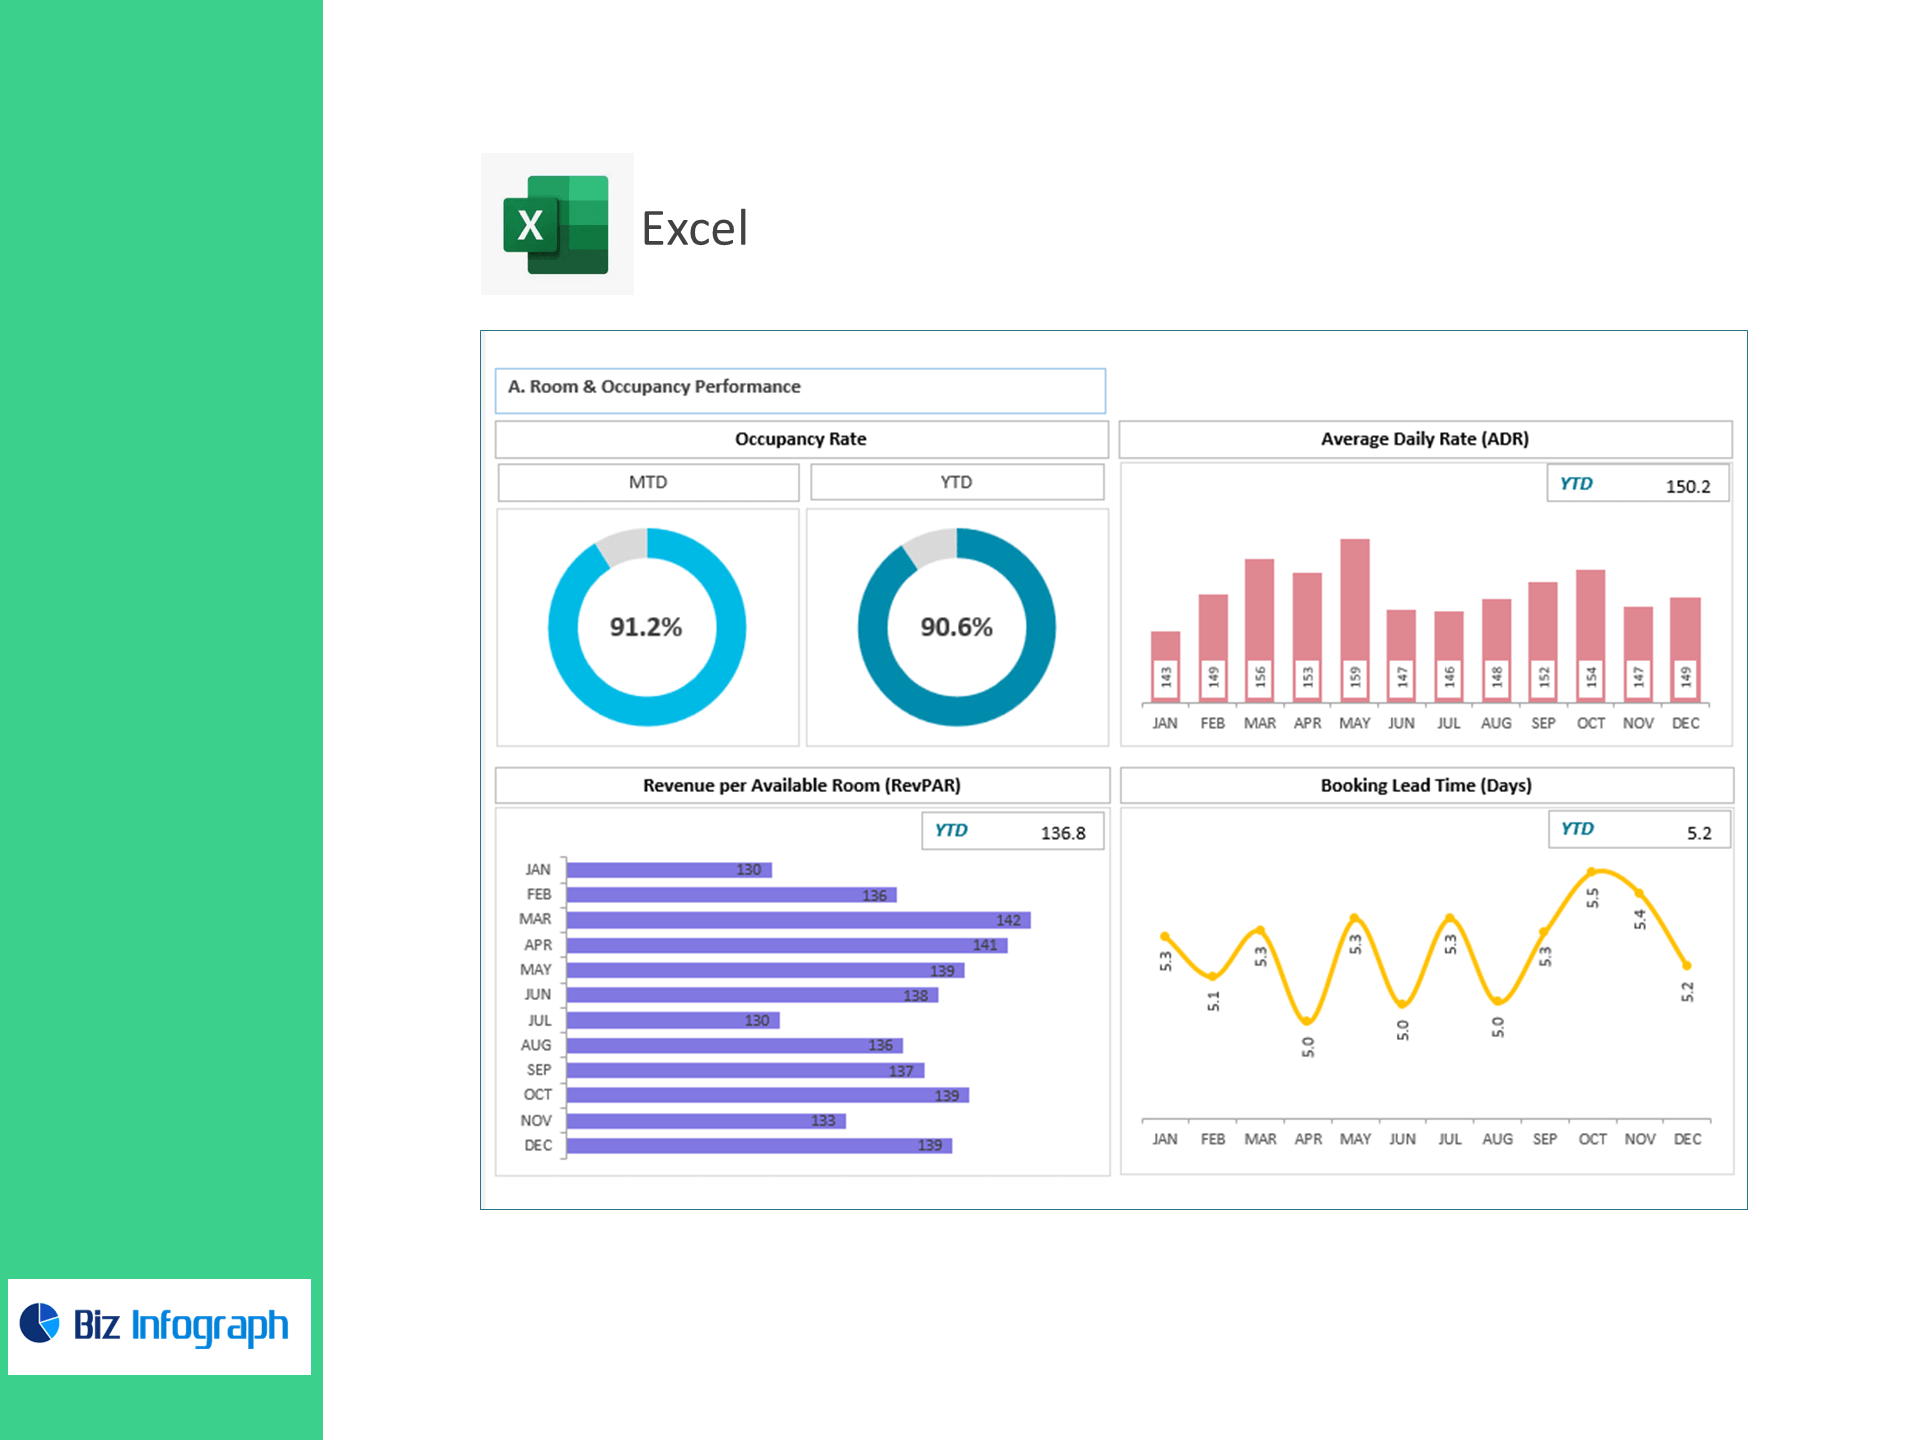
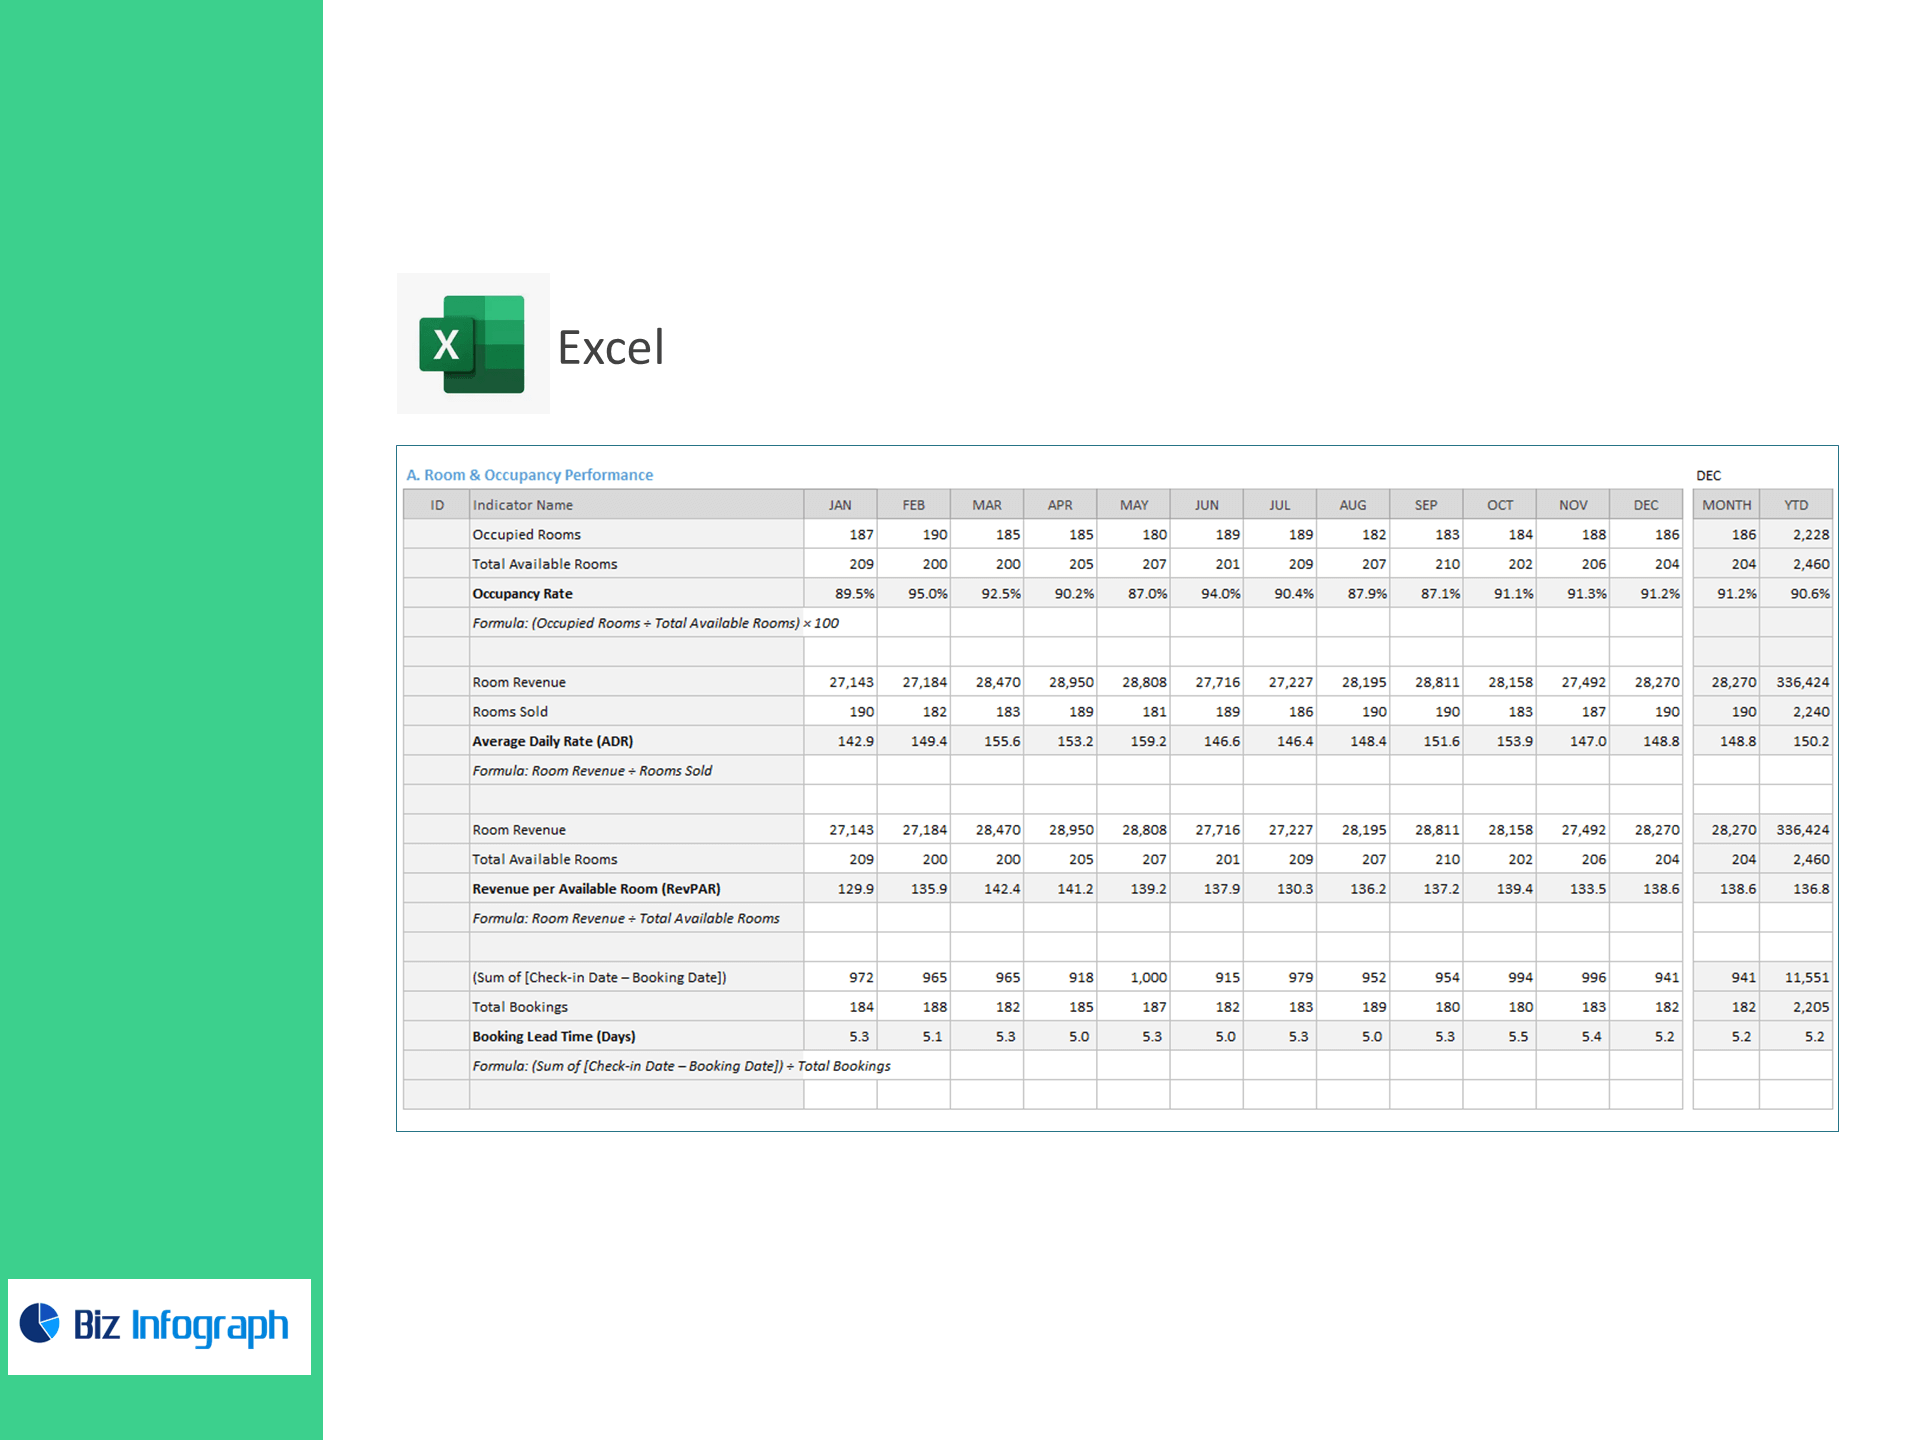
A) Room & Occupancy Performance
-
Occupancy Rate (%) = Occupied Rooms ÷ Available Rooms × 100
-
Average Daily Rate (ADR) = Room Revenue ÷ Rooms Sold
-
RevPAR = Room Revenue ÷ Available Rooms
-
Booking Lead Time (days) = Σ(Check-in − Booking) ÷ Total Bookings
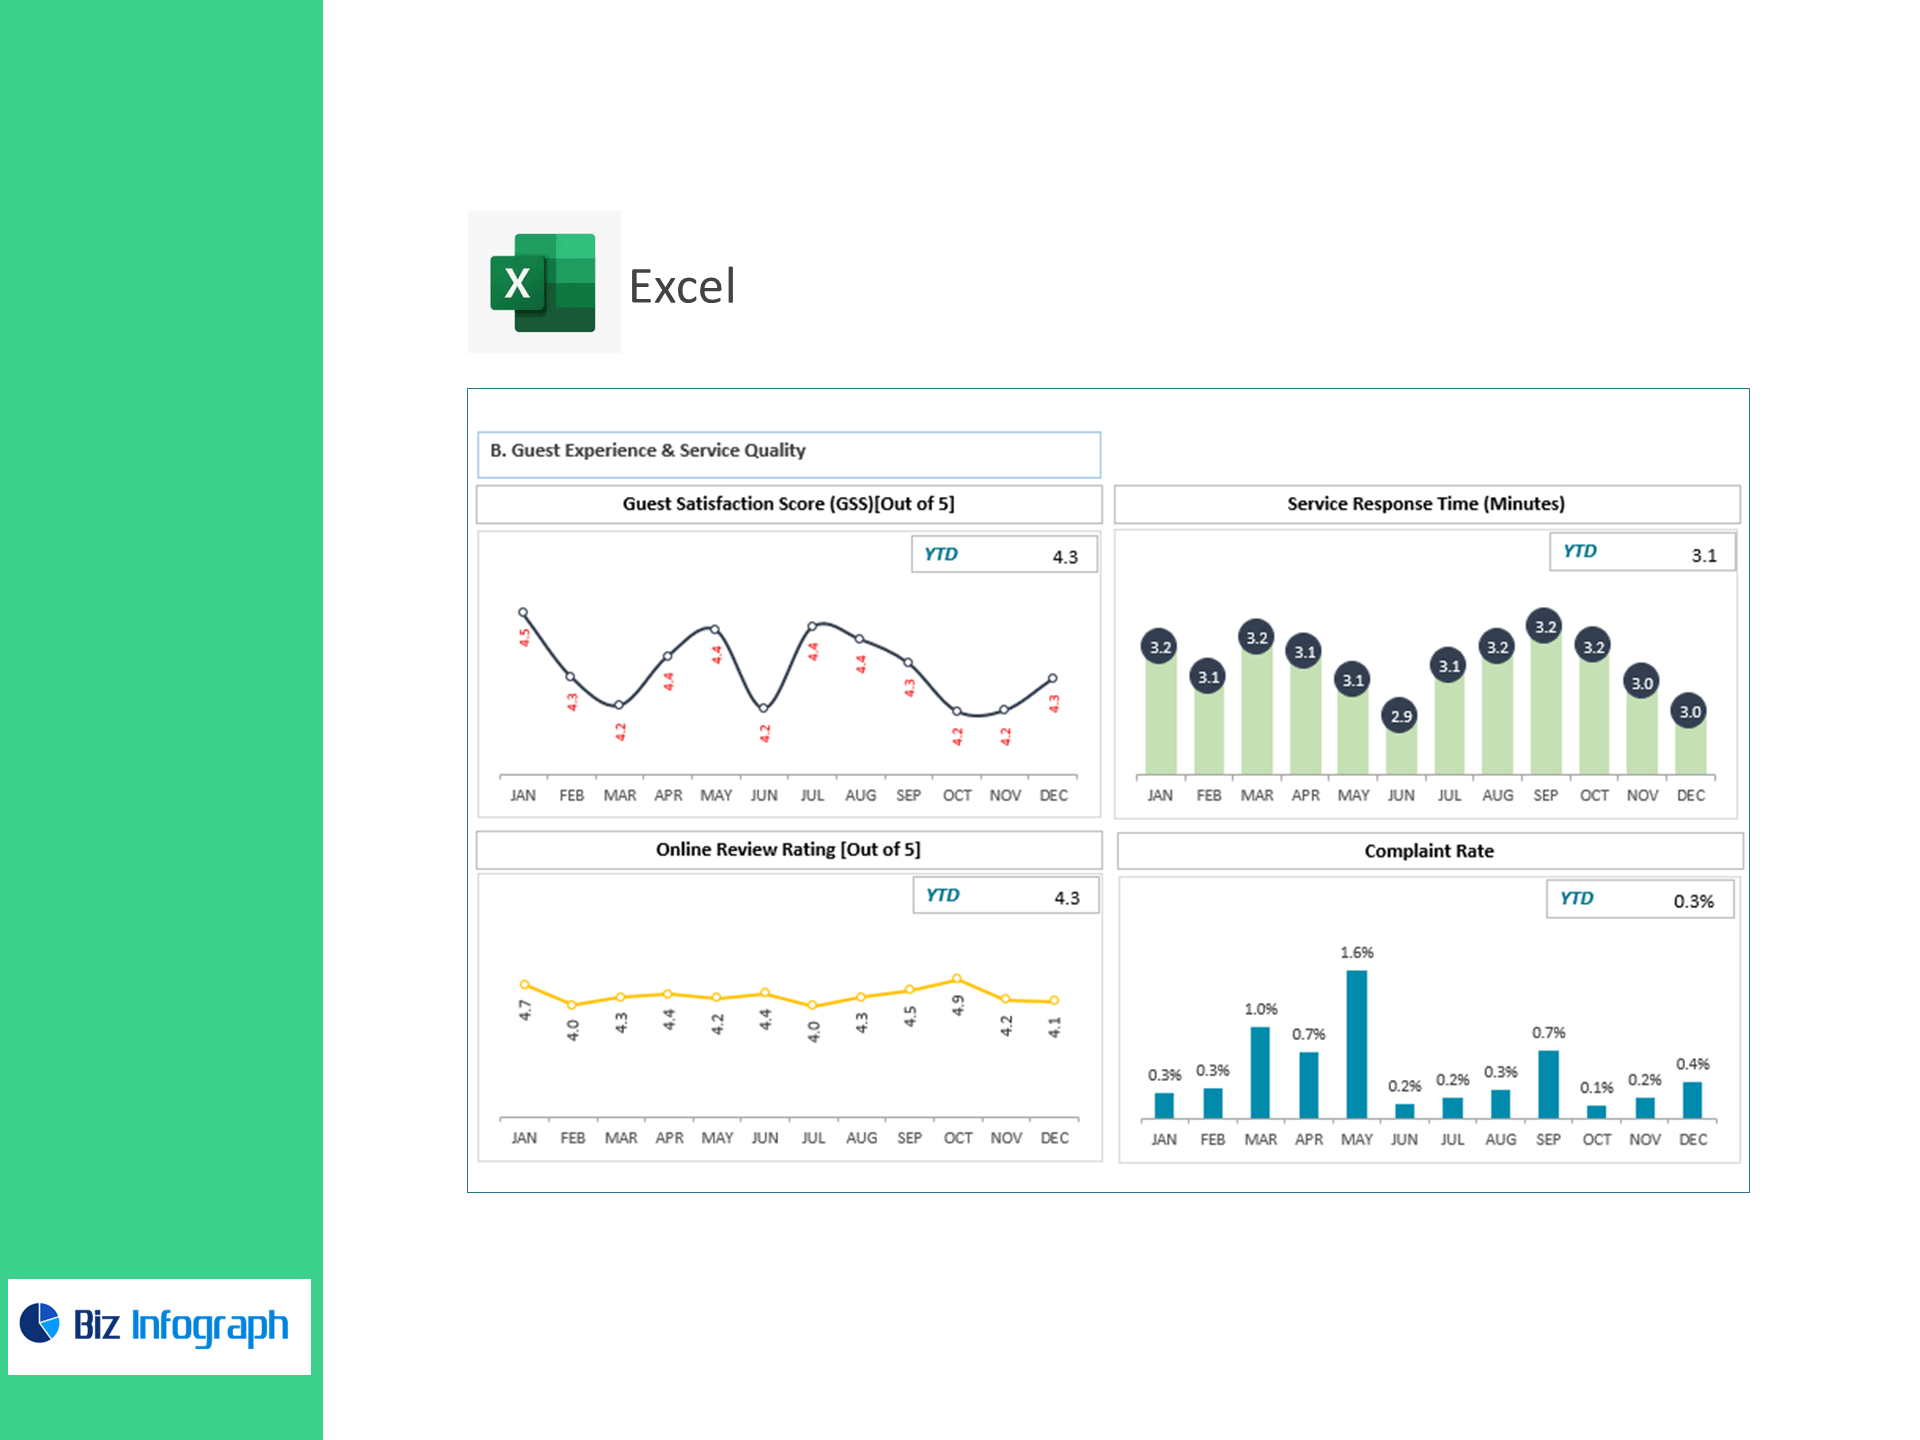
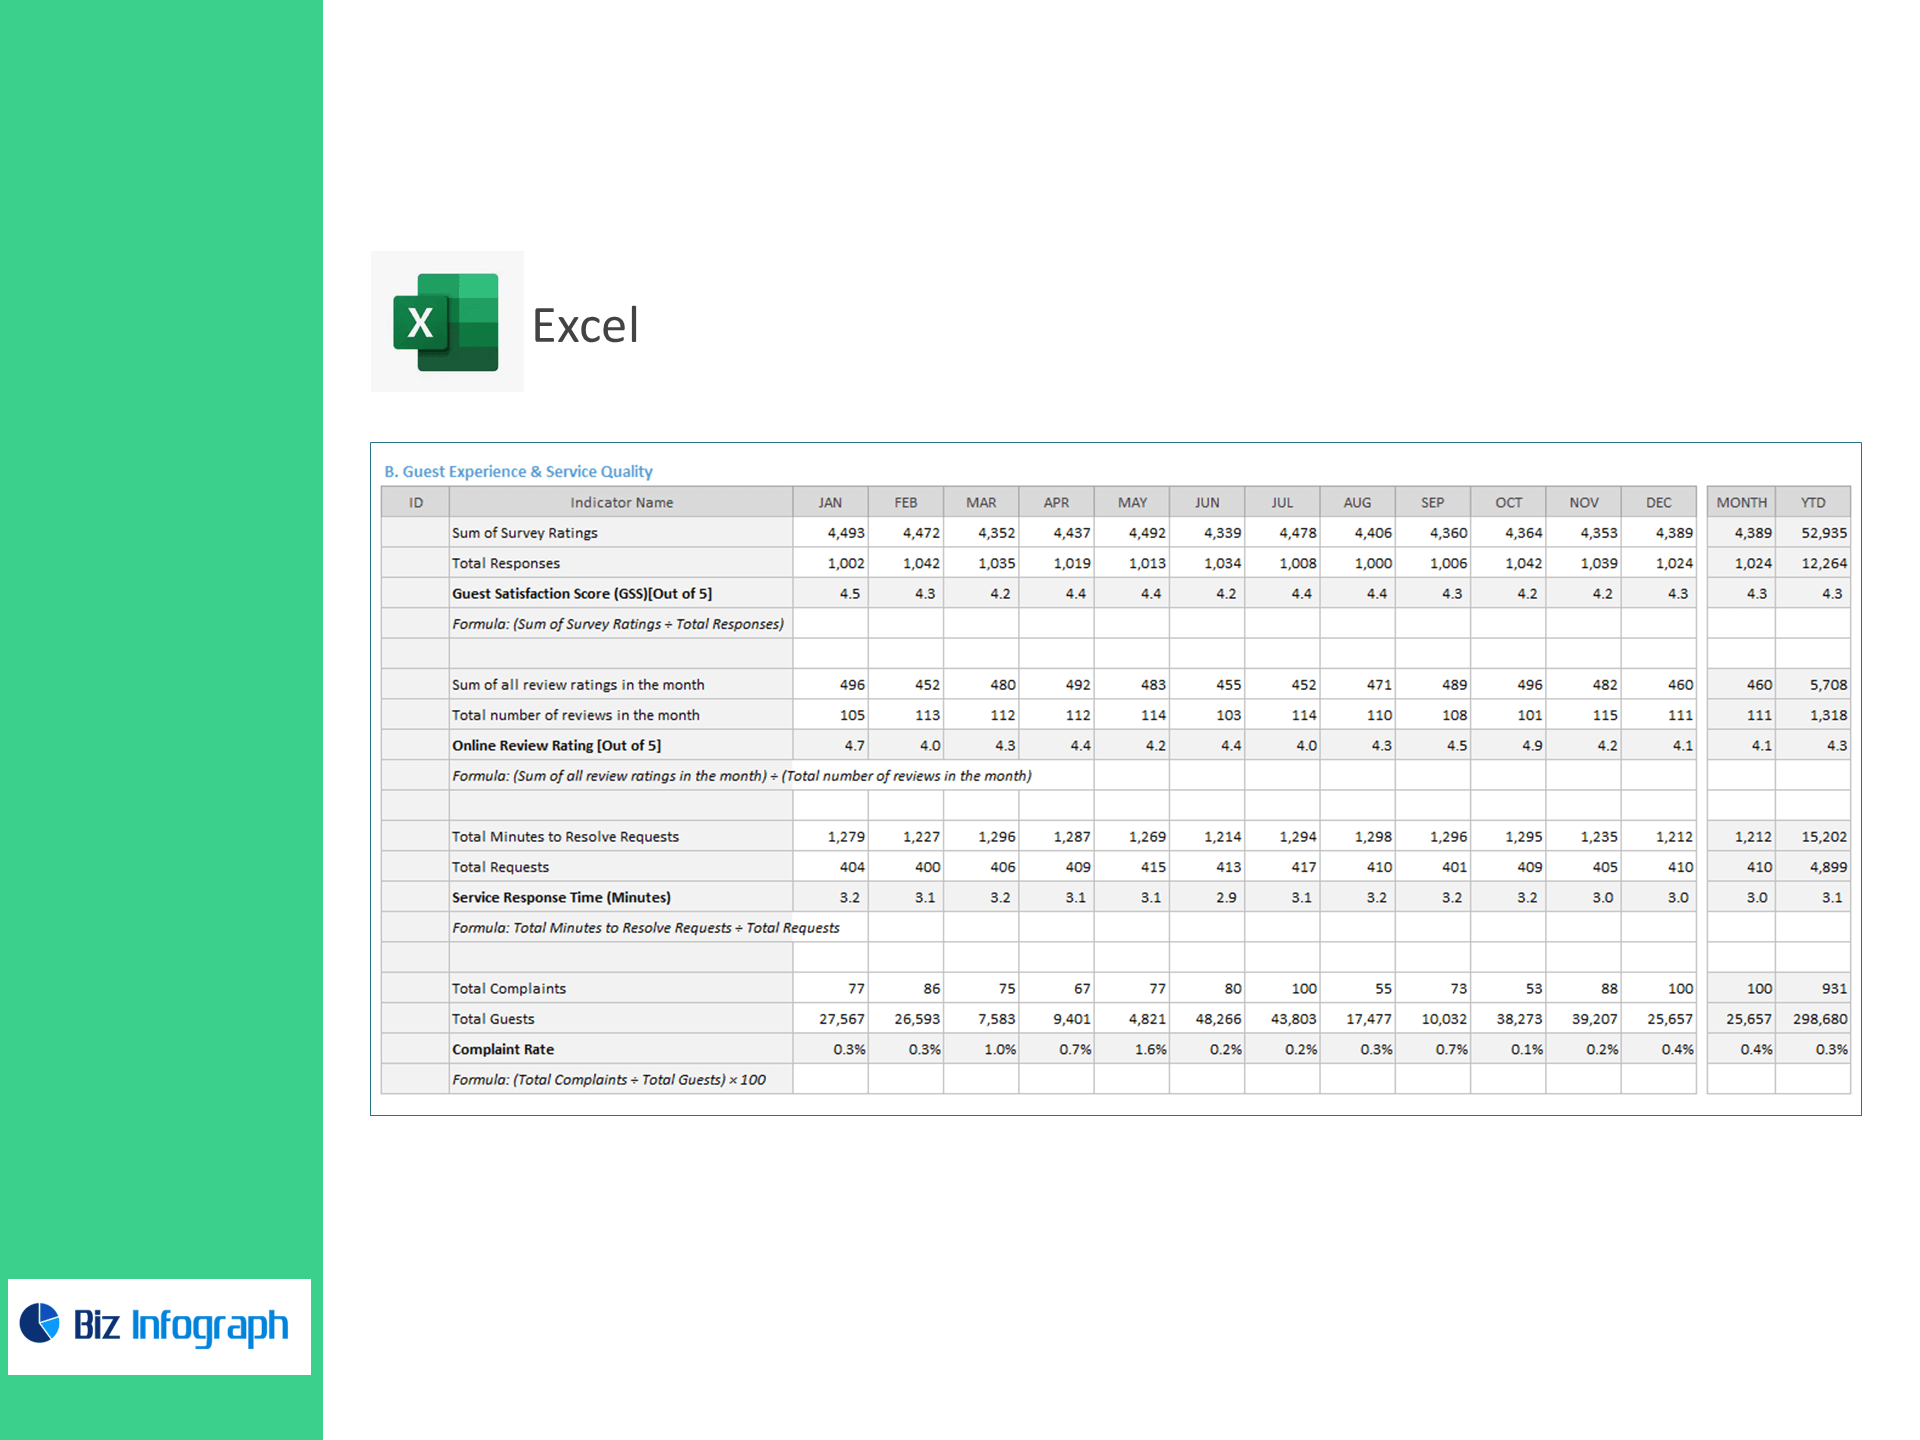
B) Guest Experience & Service Quality
-
Guest Satisfaction Score (GSS, /5) = Σ Survey Ratings ÷ Responses
-
Online Review Rating (/5) = Σ Review Ratings ÷ # Reviews
-
Service Response Time (mins) = Minutes to Resolve ÷ Requests
-
Complaint Rate (%) = Complaints ÷ Guests × 100
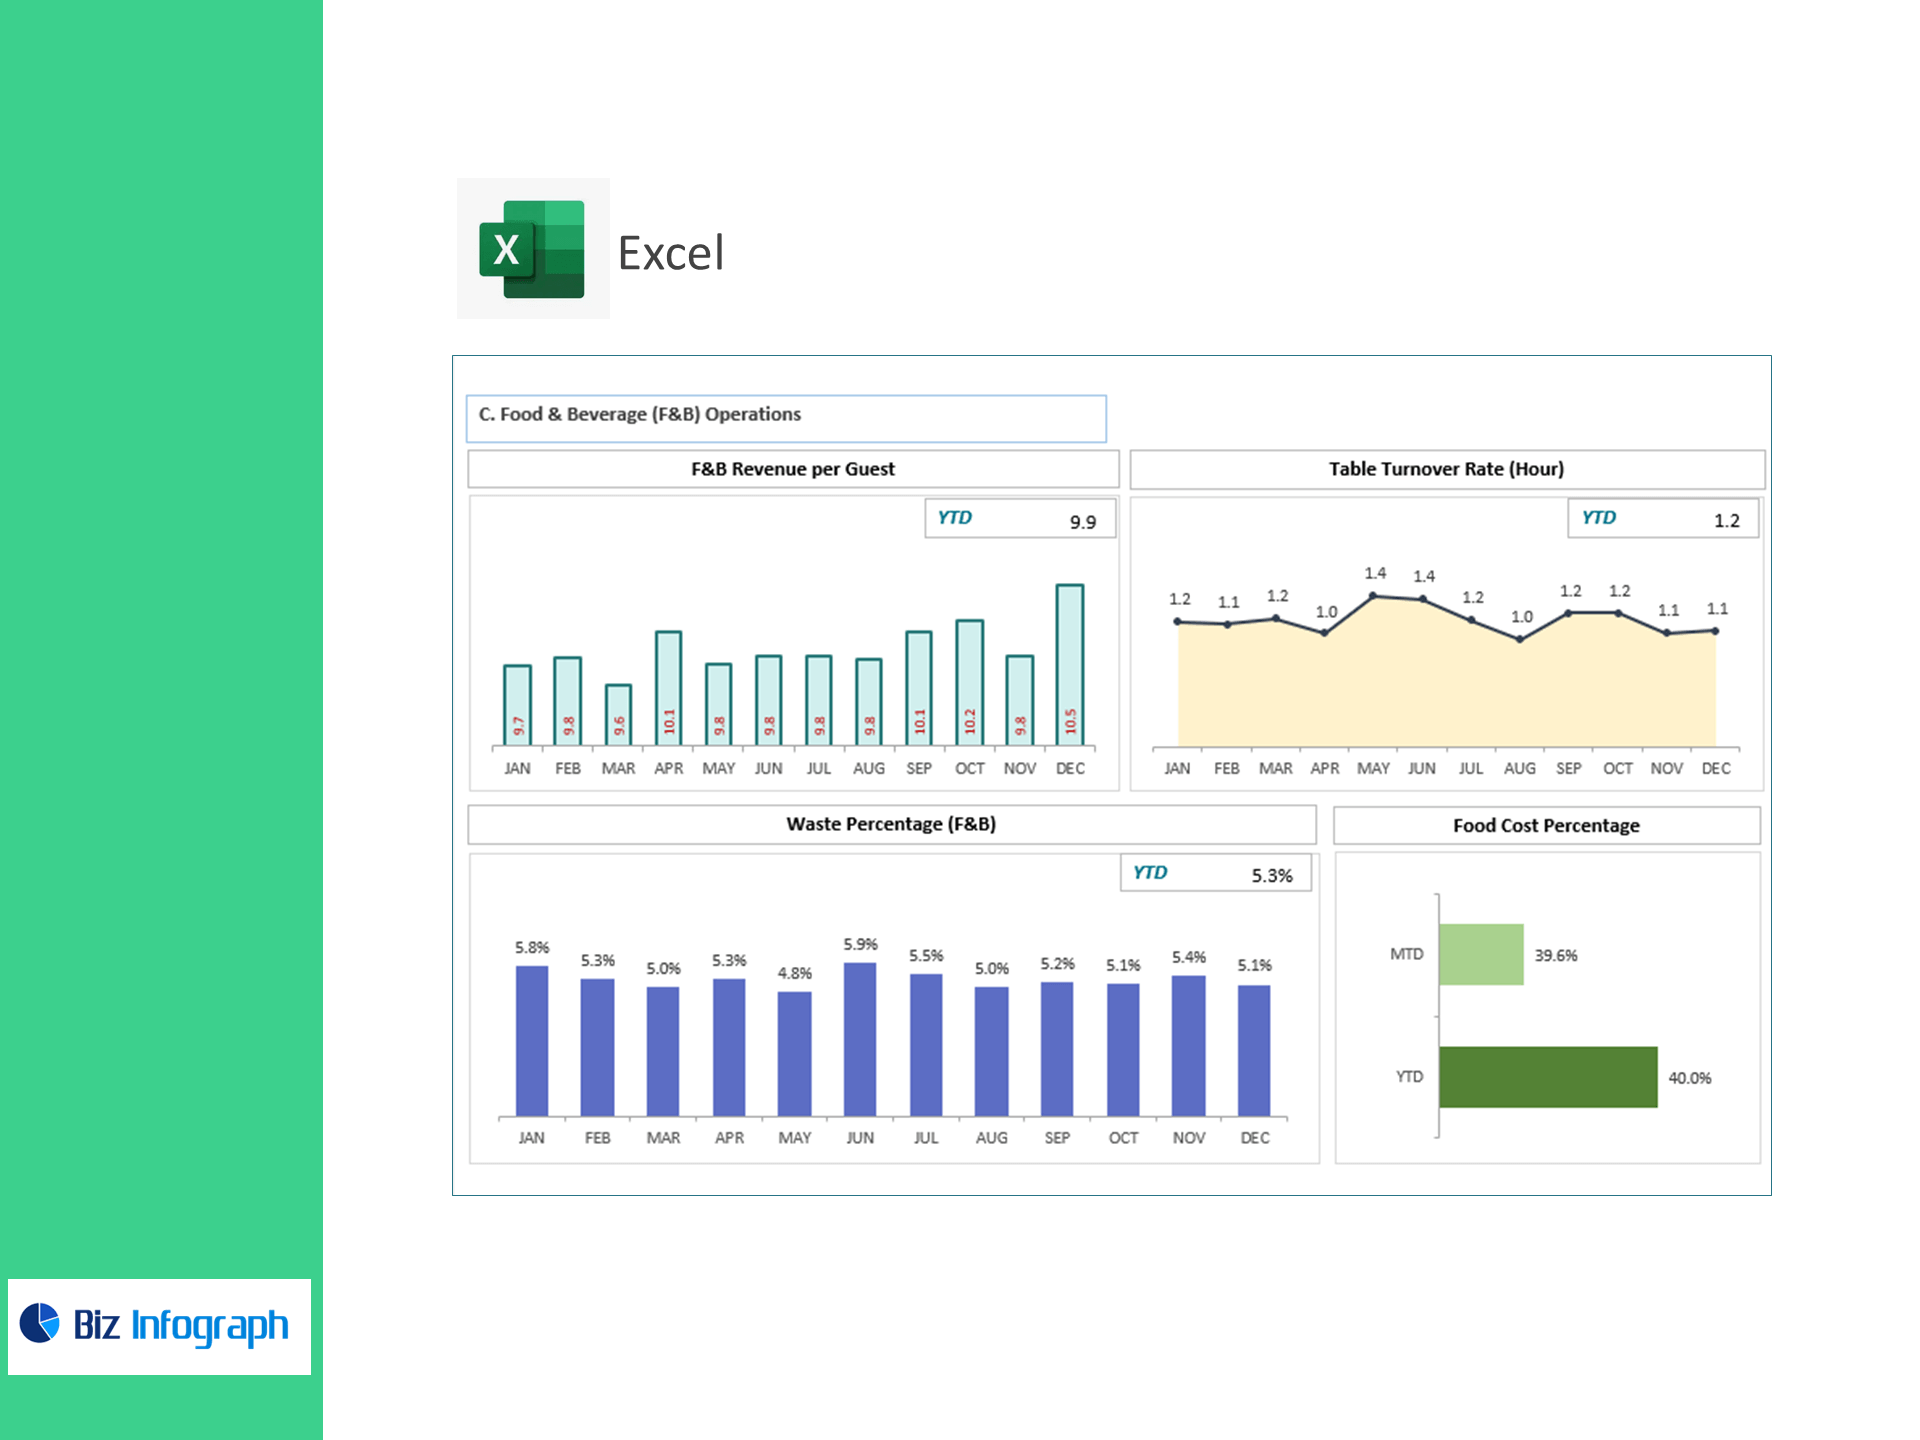
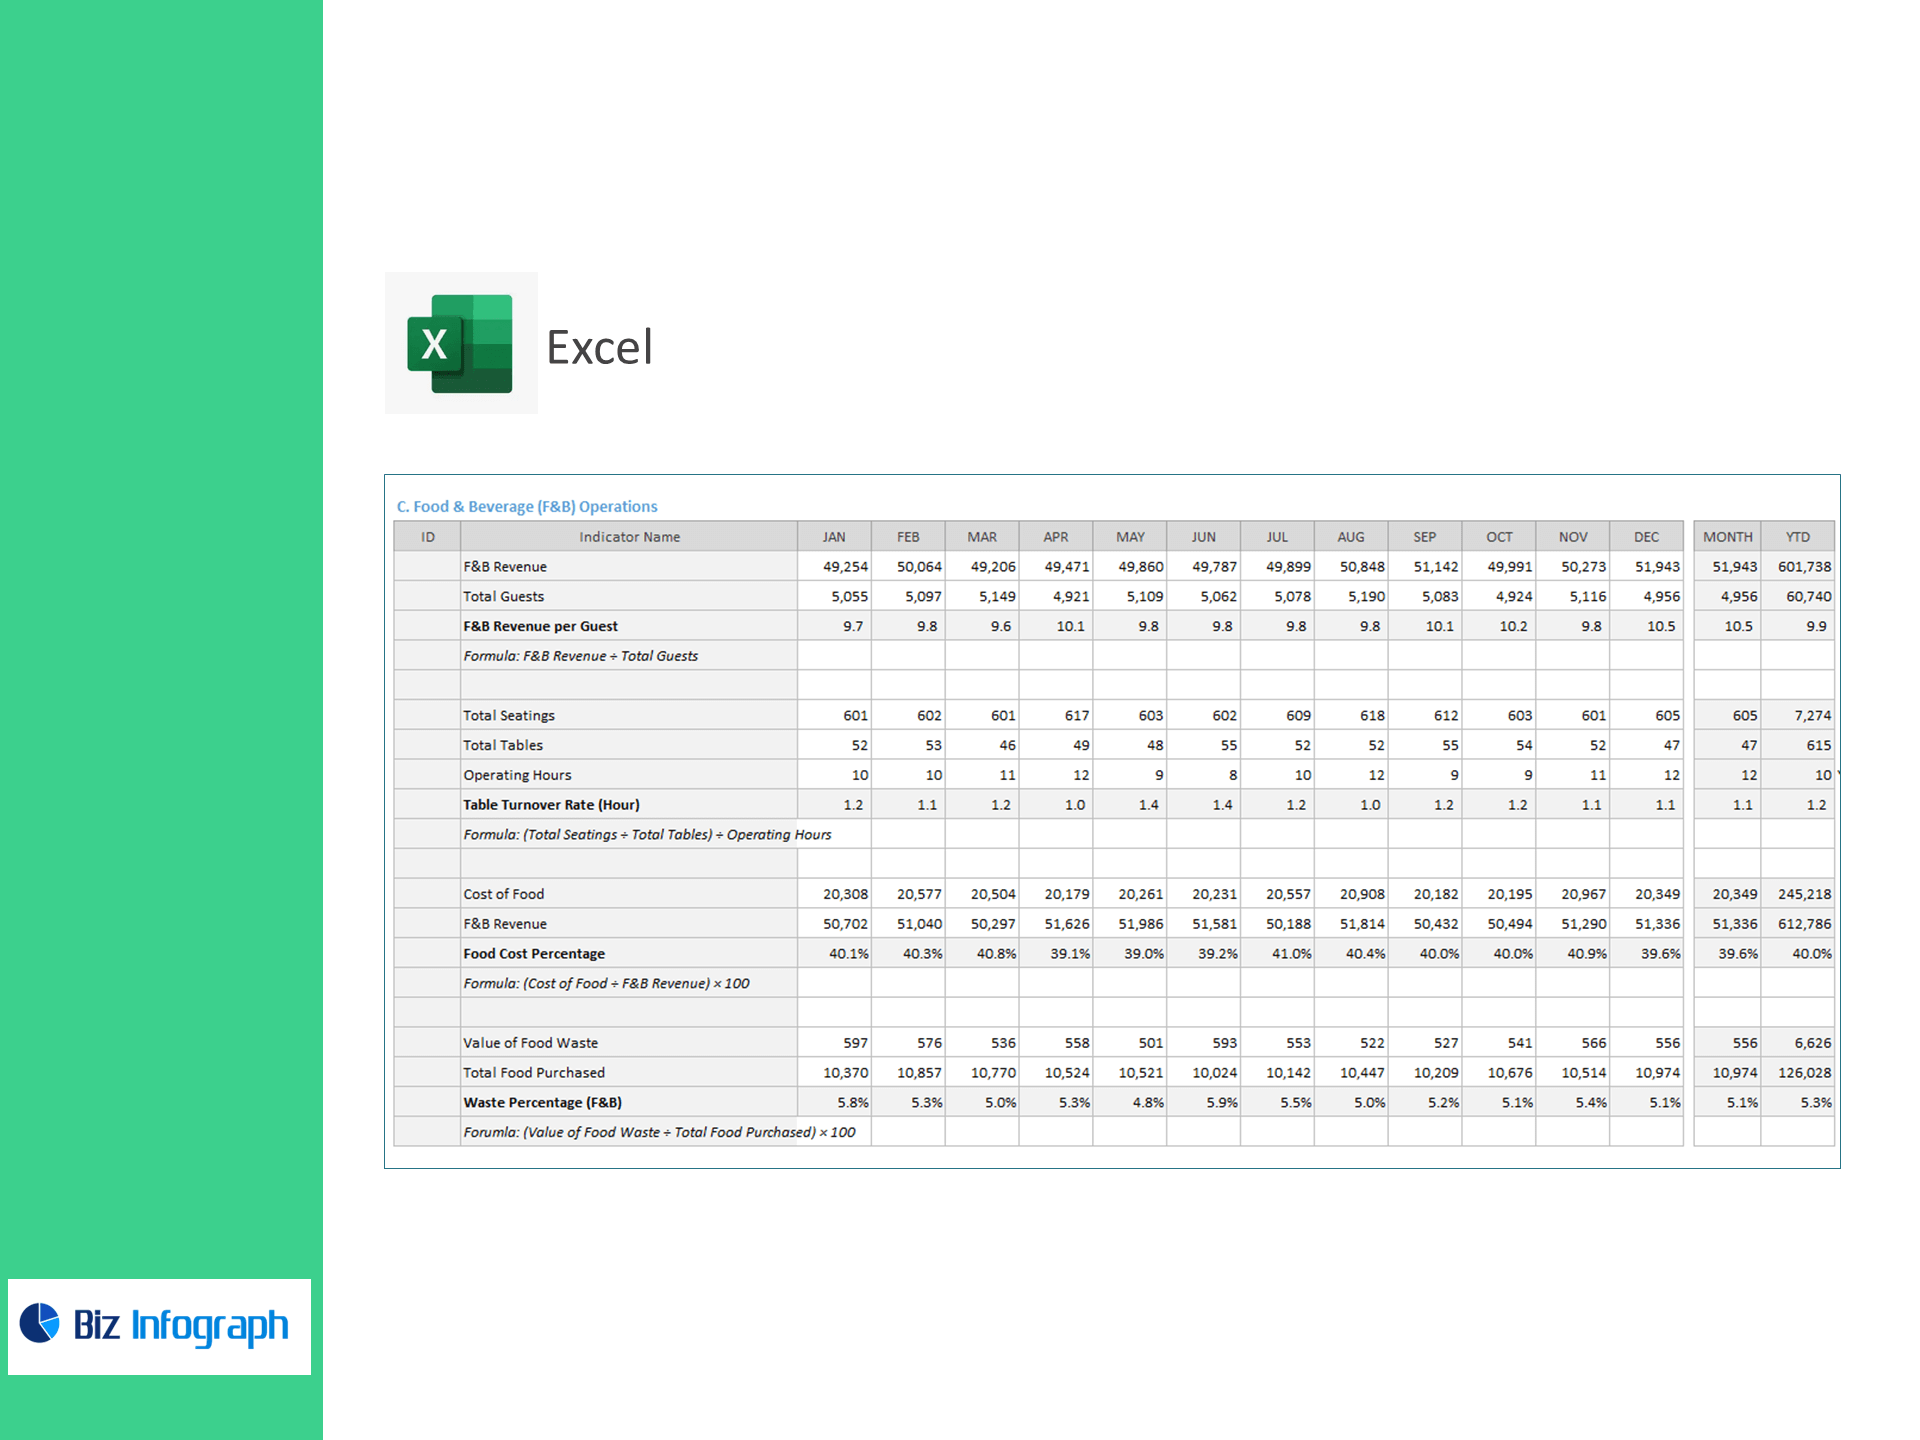
C) Food & Beverage (F&B) Operations
-
F&B Revenue per Guest = F&B Revenue ÷ Guests
-
Table Turnover Rate (per hour) = (Seatings ÷ Tables) ÷ Operating Hours
-
Food Cost % = Cost of Food ÷ F&B Revenue × 100
-
Waste % (F&B) = Food Waste Value ÷ Total Food Purchased × 100
What’s inside
-
Executive Dashboard: Tiles & trends for Occupancy, ADR, RevPAR, Lead Time, GSS/Reviews, Response Time, Complaints, F&B per Guest, Table Turns, Food Cost %, and Waste %—with variance to target.
-
Revenue & Demand Panel: Mix of rooms sold by segment, pacing vs. prior period.
-
Service Command Center: Request SLAs, complaint hotspots, and staff action tracking.
-
F&B Control Sheet: Cost, yield, and waste analysis by outlet/meal period.
-
Targets & Assumptions: Enter KPI targets; automatic Above/Below Target flags.
-
Clean Data Sheets: Import-ready tables for Rooms, Bookings, Surveys/Reviews, Requests, F&B sales, Seatings, and COGS/Waste.
Benefits
-
Grow RevPAR sustainably: Balance price, occupancy, and lead time to maximize yield.
-
Boost satisfaction: Shorten response time, reduce complaints, and raise ratings.
-
Cut F&B leakage: Track food cost and waste to protect margin.
-
Decide faster: Board-ready visuals with transparent, audit-friendly formulas.
For ready-to-use Dashboard Templates: