Logistics Operations Efficiency Dashboard — Excel Template
Run your network like a power plant: precise, predictable, and efficient. This ready-to-use Excel dashboard gives logistics leaders a control tower for uptime, reliability, safety, sustainability, and capacity utilization—no macros, no add-ins.
Why it’s different
-
Operations as a system: borrows proven reliability KPIs (uptime, outage rate, MT measures) to reveal hidden bottlenecks in fleets, hubs, and lanes.
-
Sustainability built-in: track emissions compliance, water use, and recycling alongside service KPIs.
-
Fast setup: paste monthly data → refresh → get executive-ready visuals.
KPIs you’ll track (out-of-the-box)
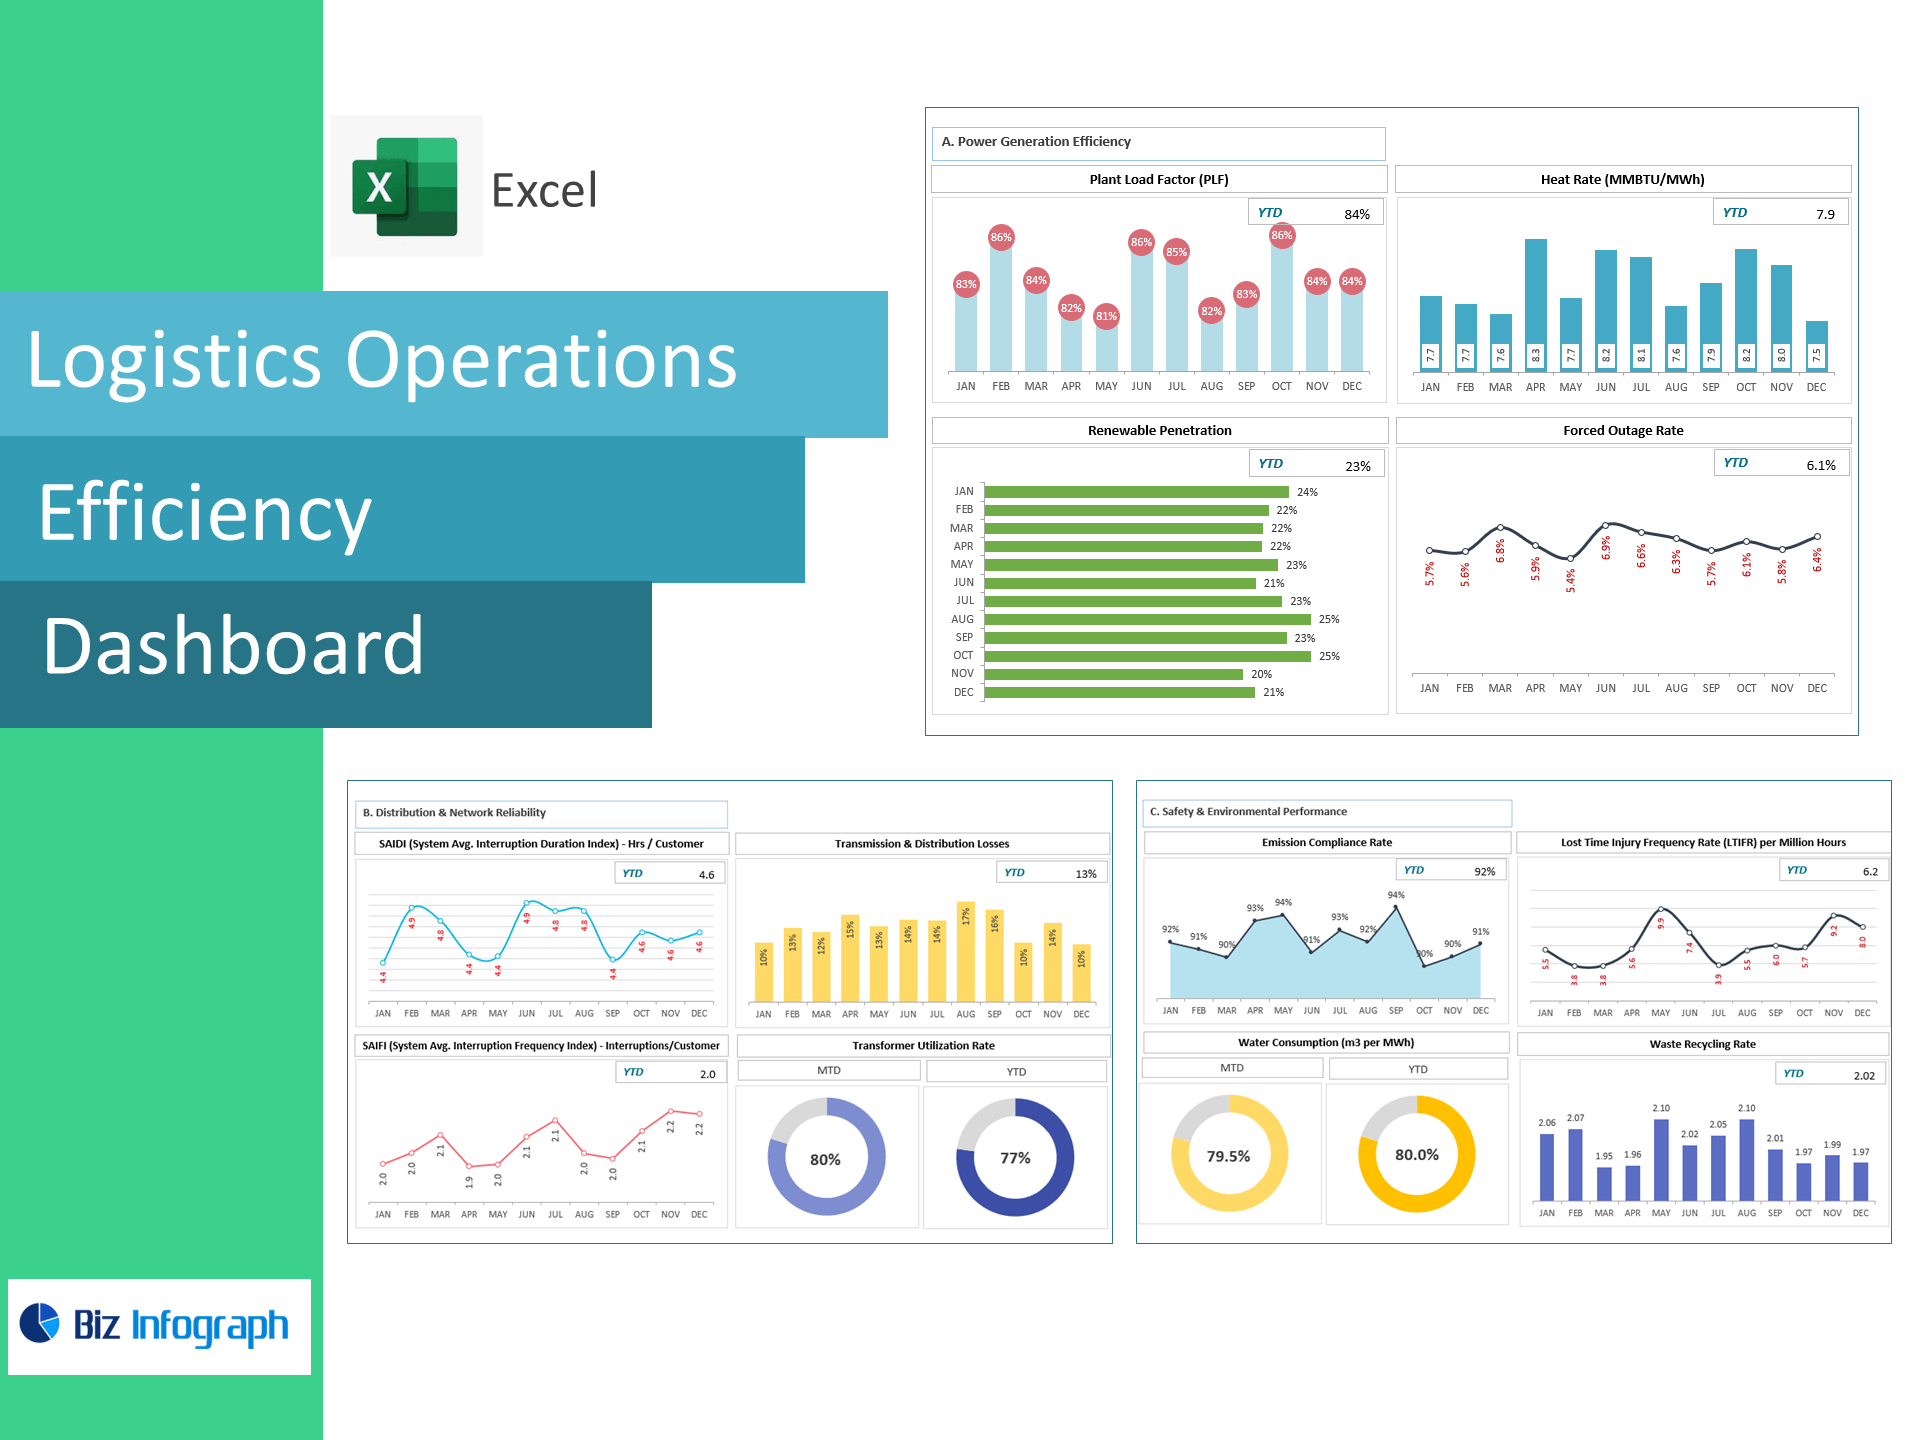
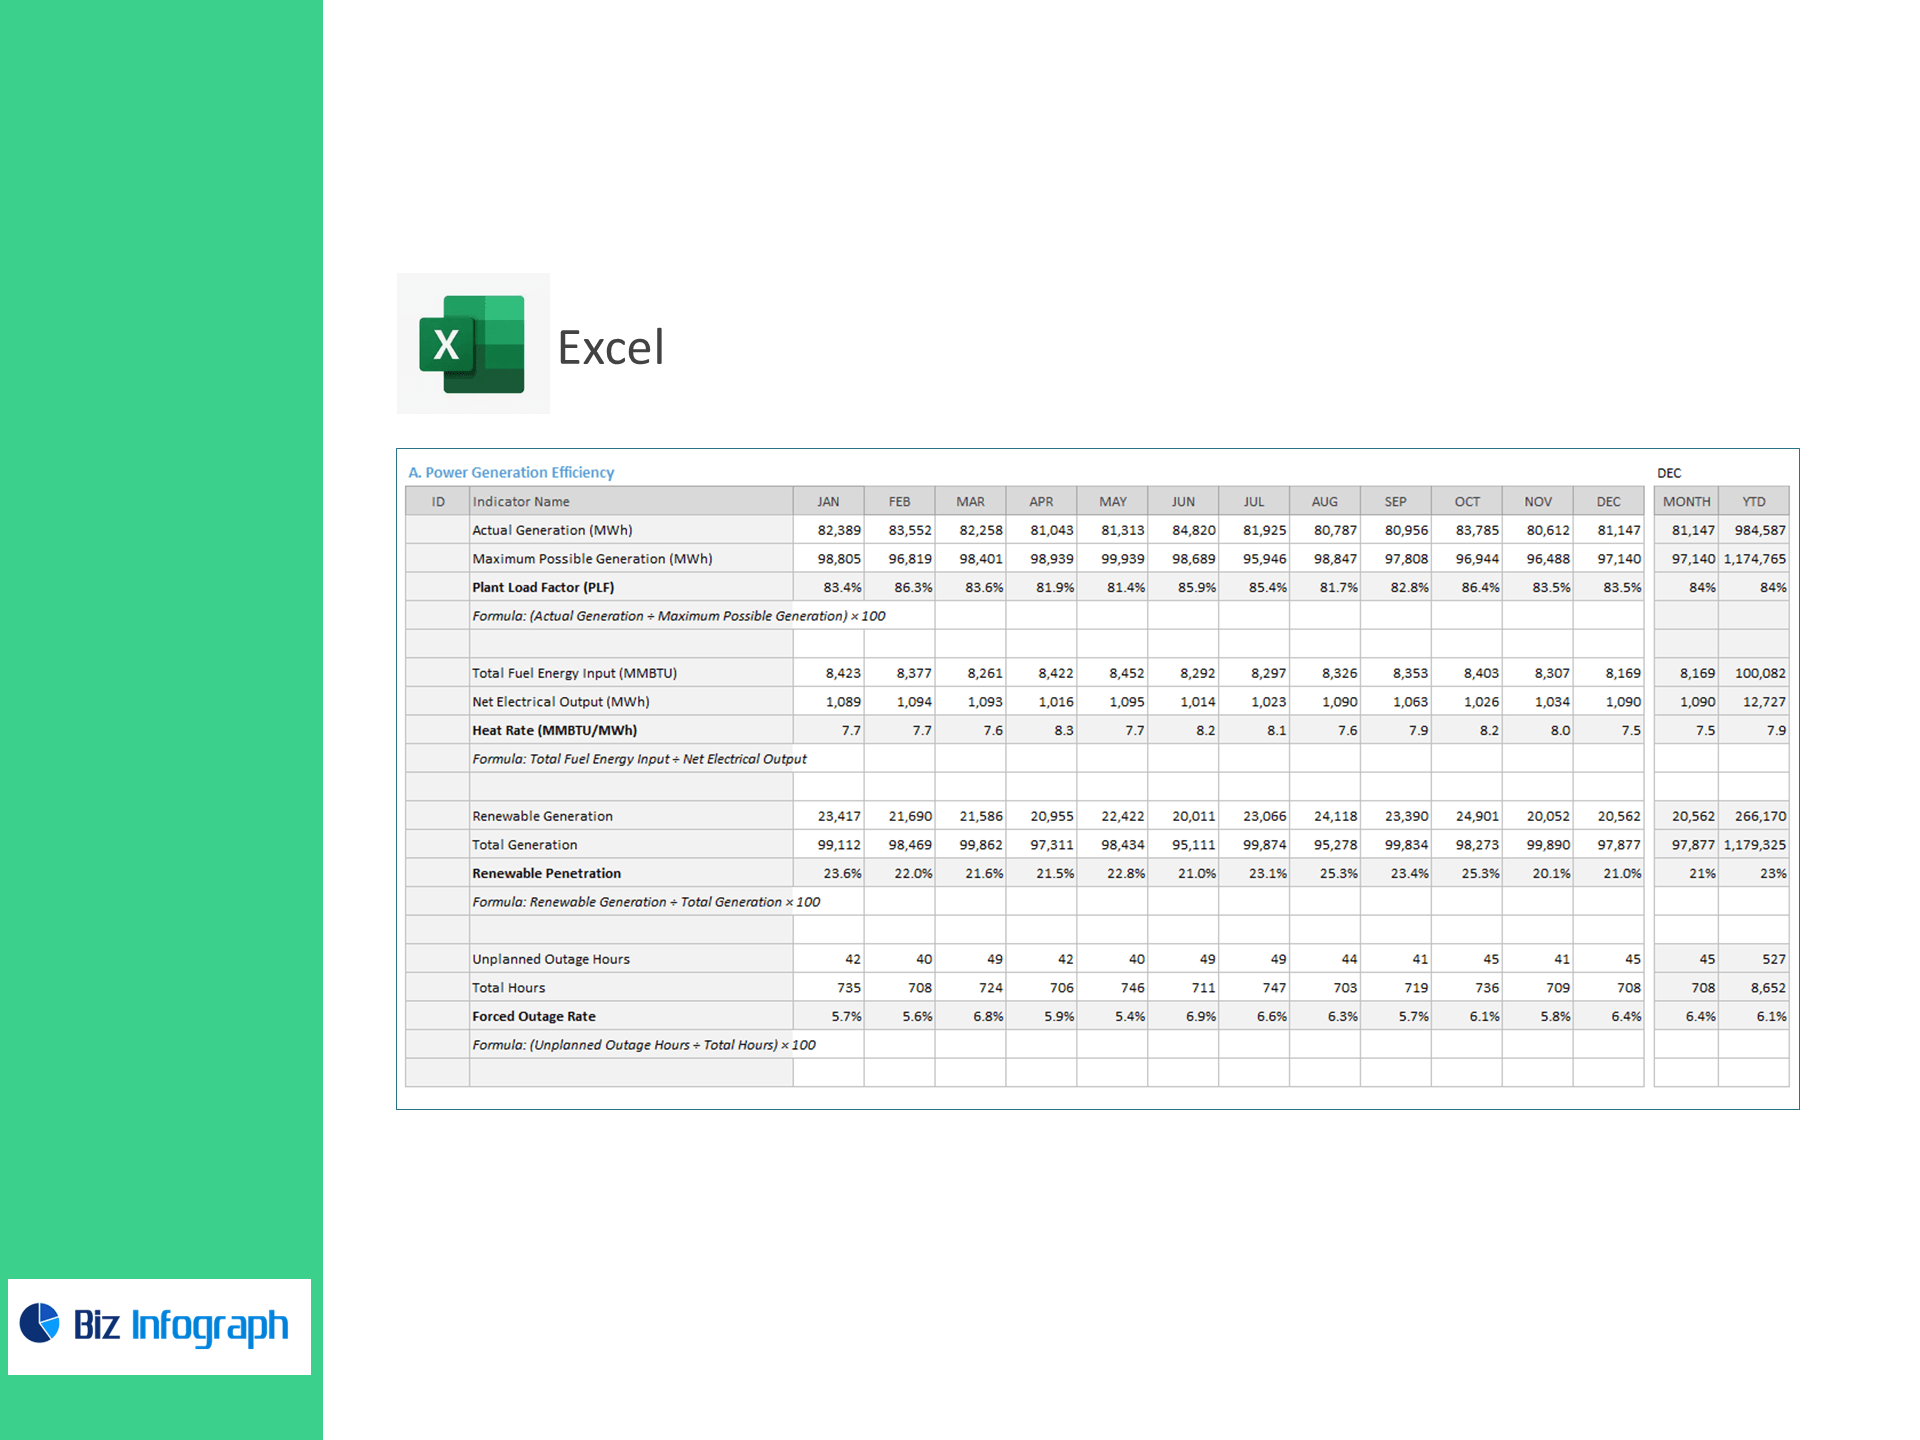
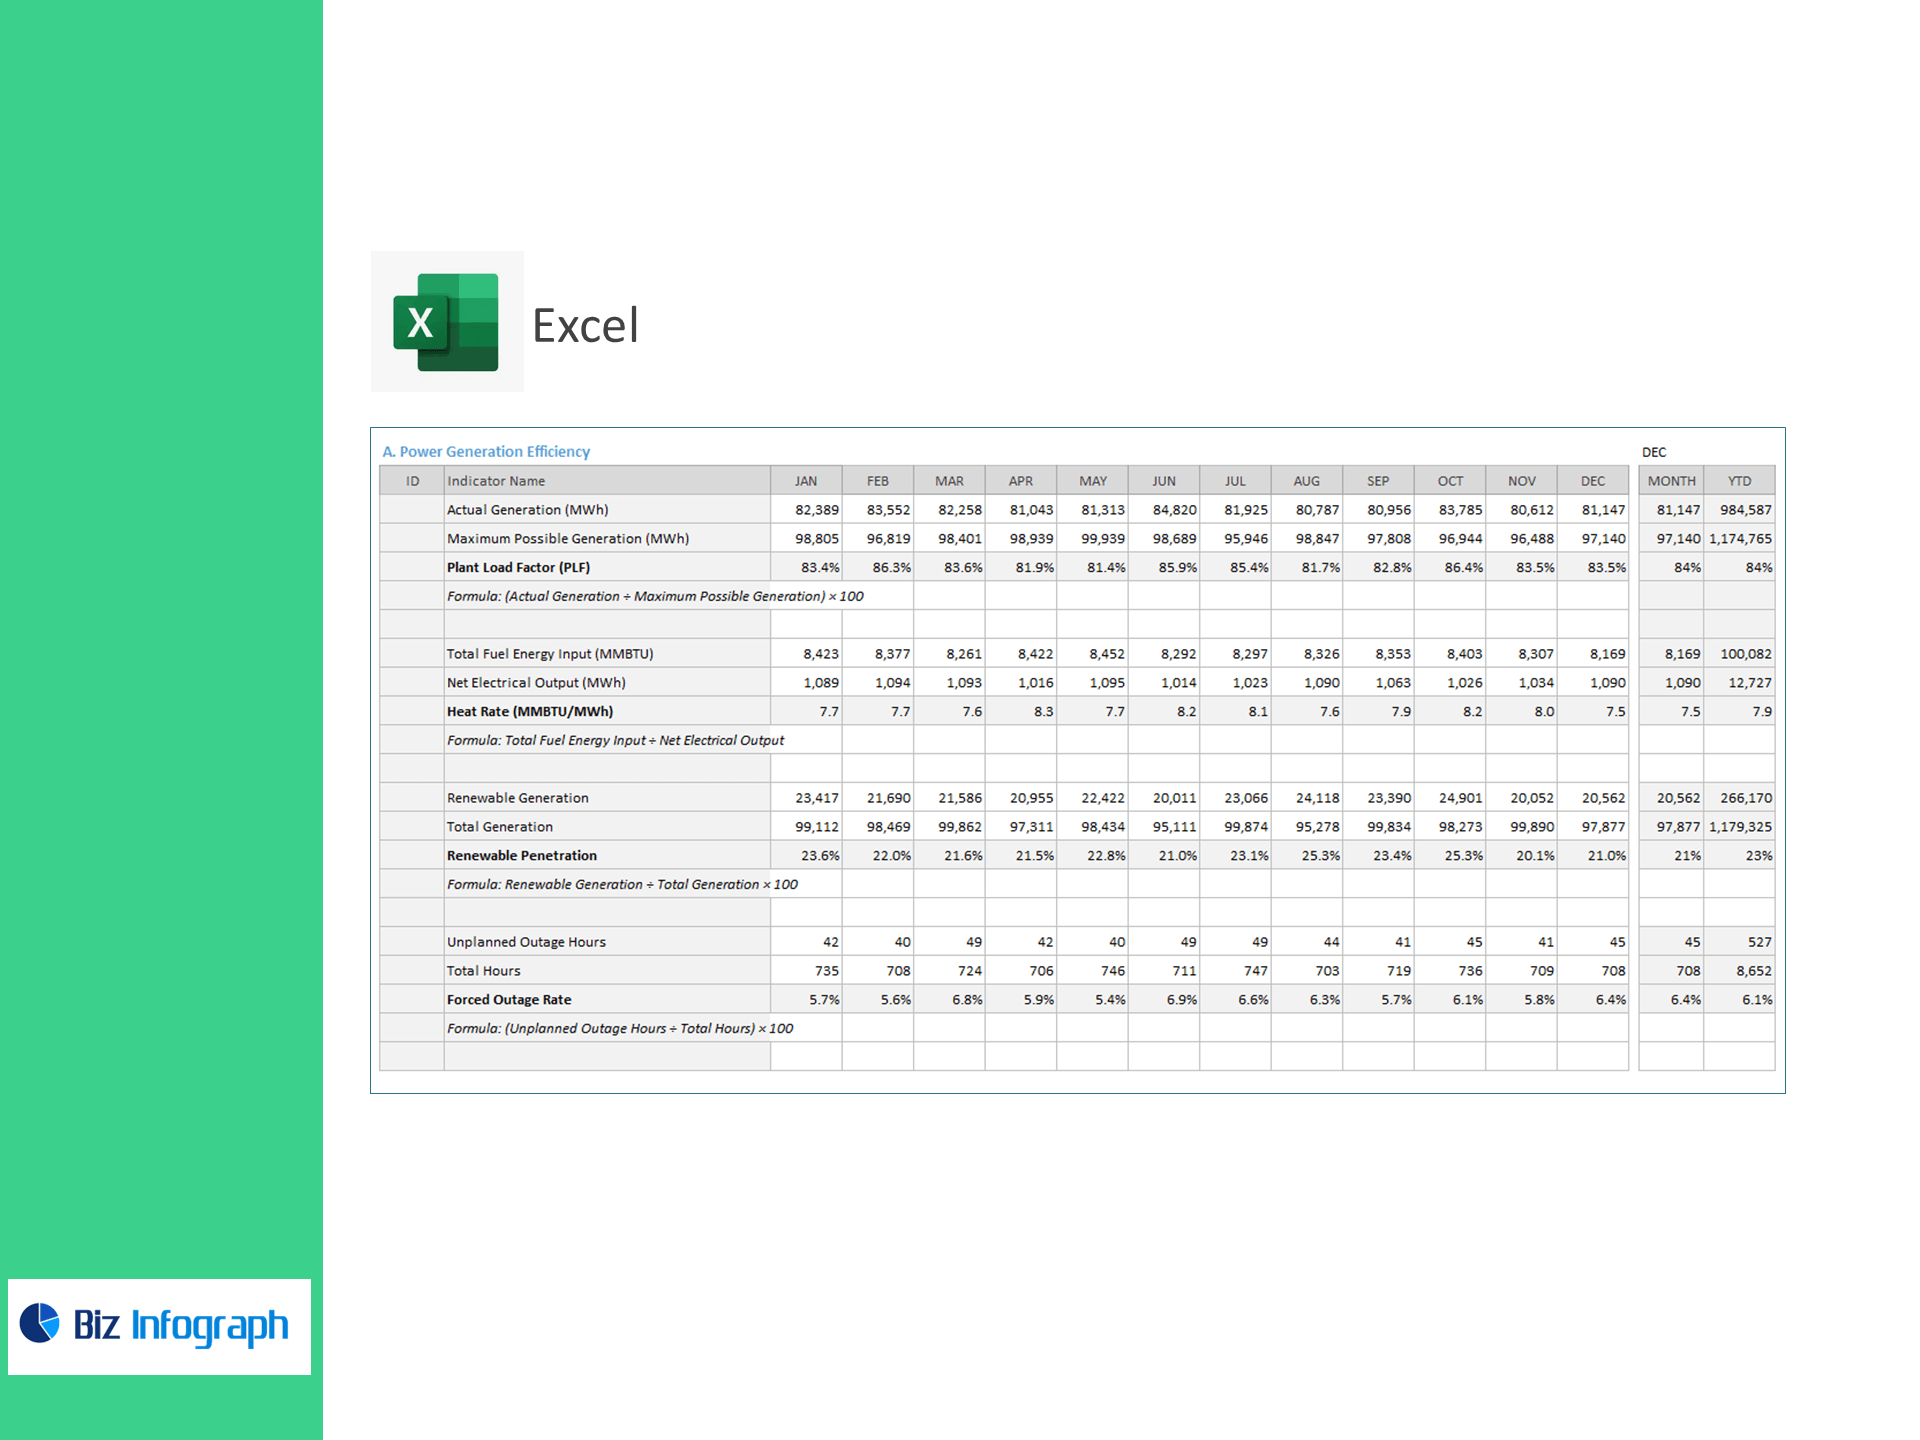
A) Fleet & Facility Efficiency (Utility-style reliability for logistics)
-
Asset Uptime % (Plant Load Factor analogue): actual productive hours ÷ scheduled hours × 100
-
Fuel Efficiency (Heat-Rate analogue): total fuel energy input ÷ net linehaul output (e.g., ton-km)
-
Alternative/Electric Share (Renewable Penetration): alt-fuel mileage ÷ total mileage × 100
-
Unplanned Downtime Rate (Forced Outage Rate): unplanned outage hours ÷ total hours × 100
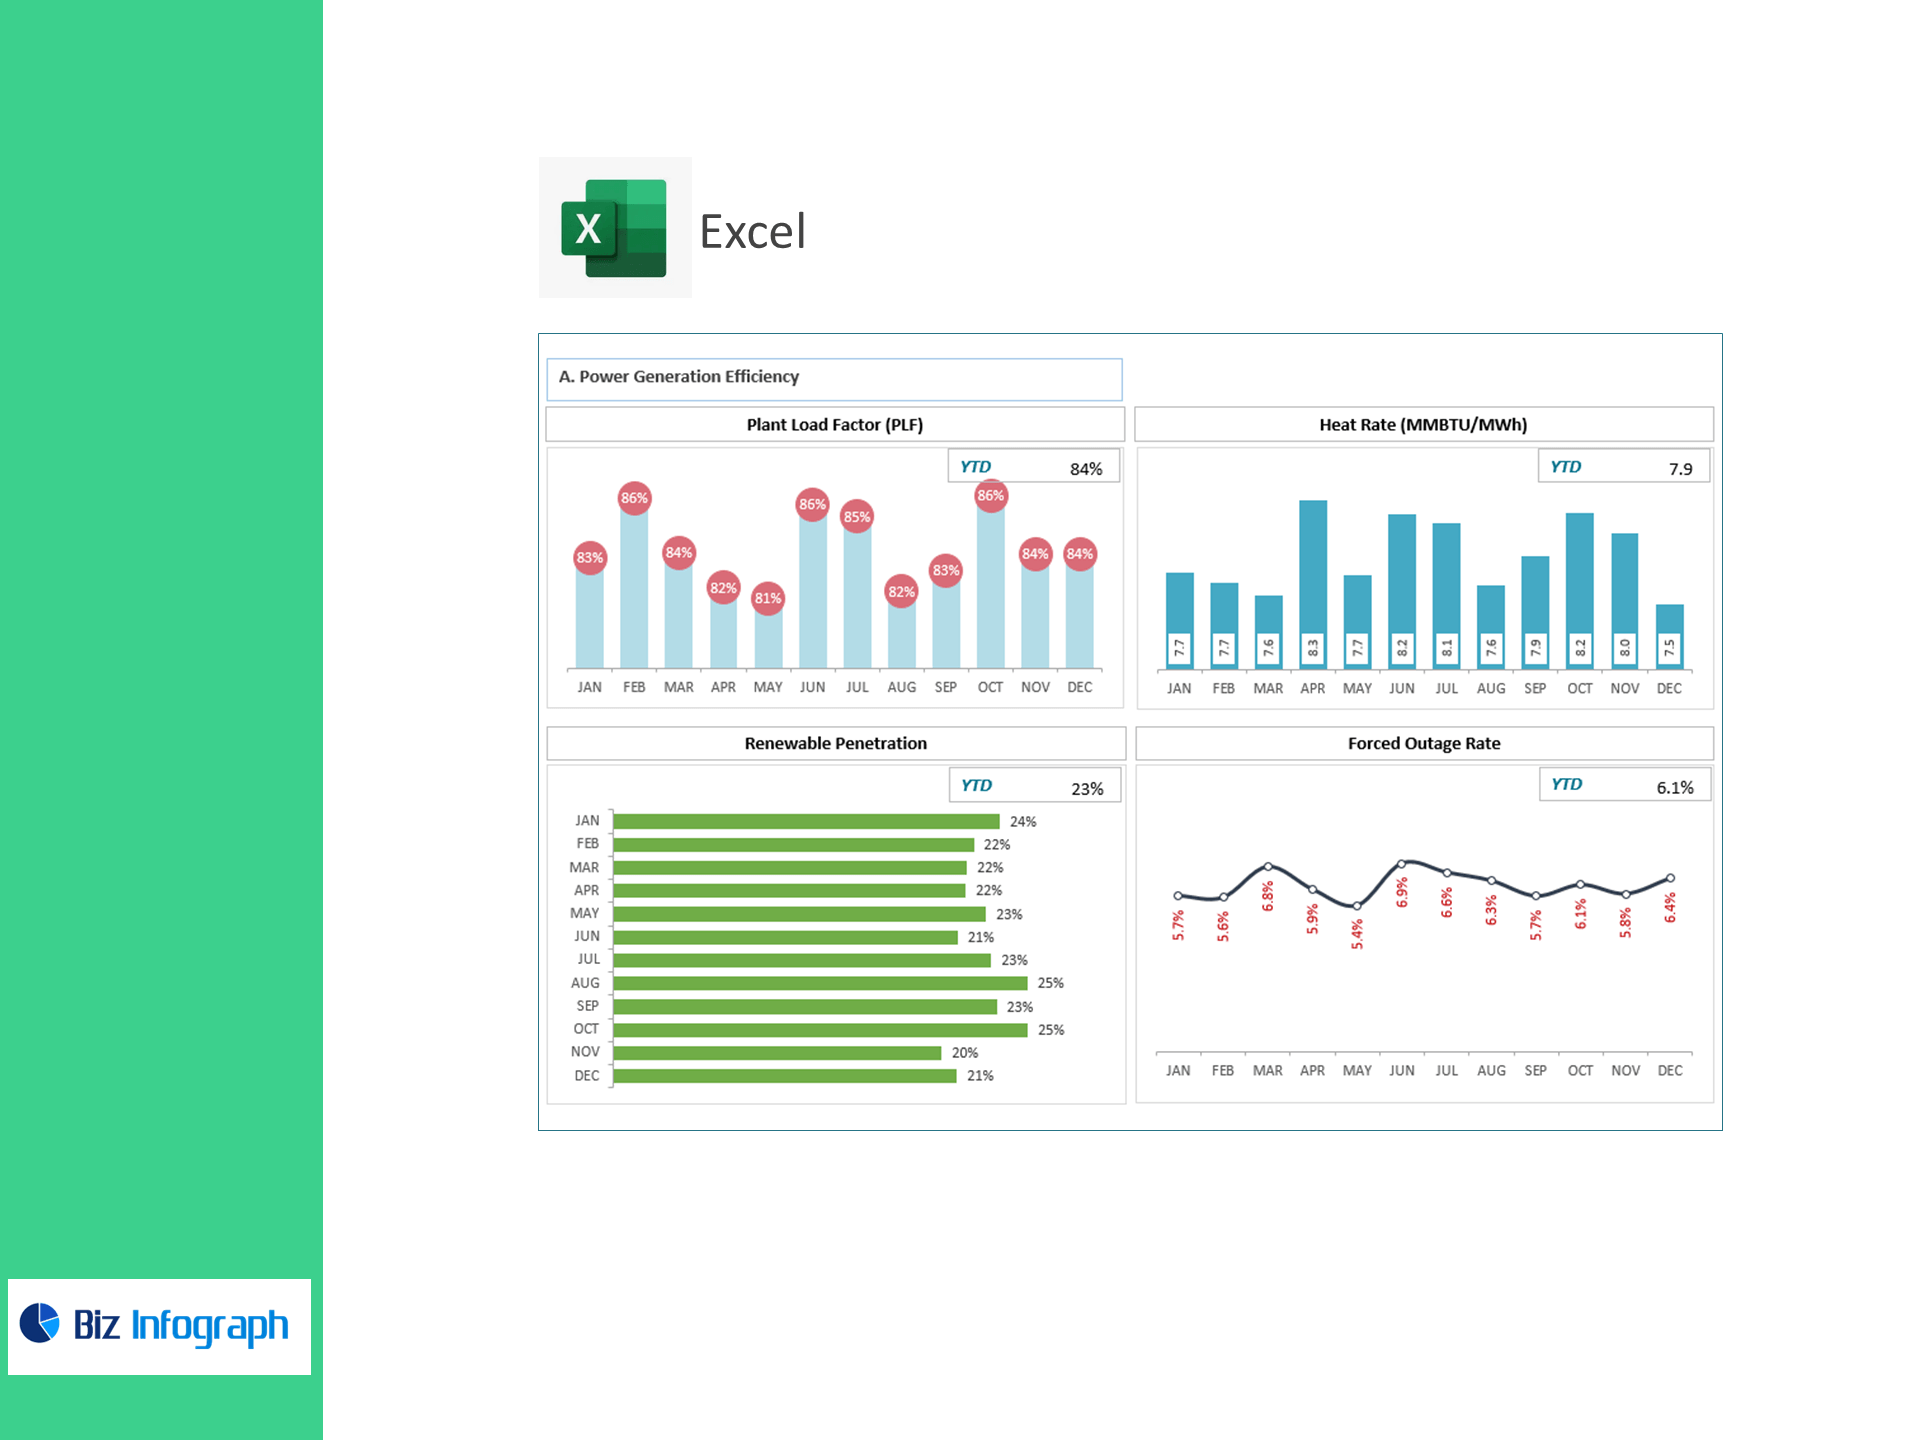
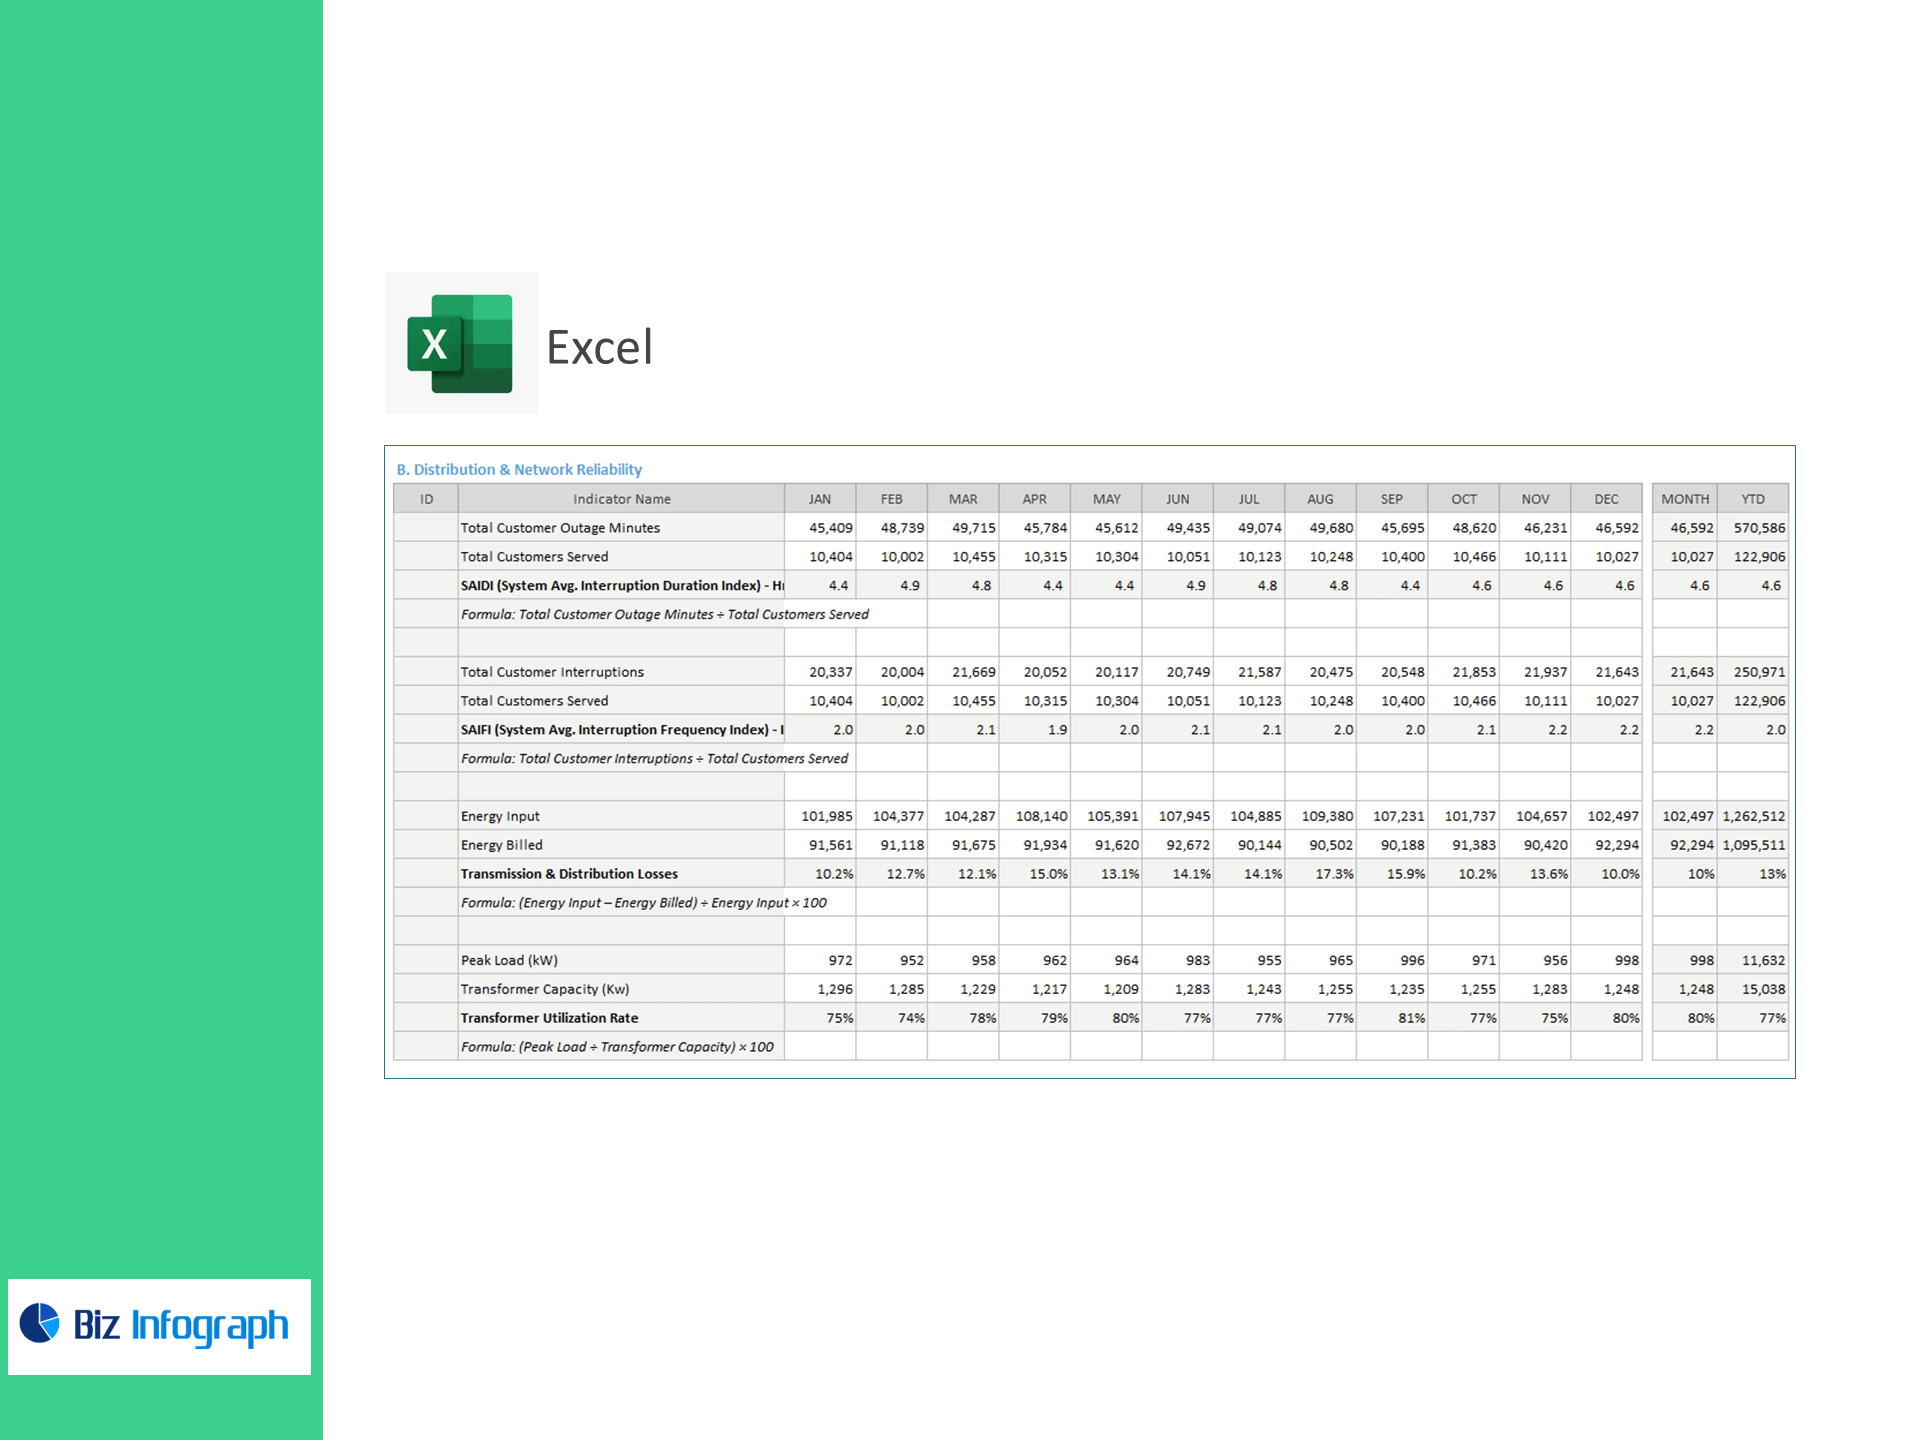
B) Service Reliability & Network Health
-
Average Delay Minutes per Shipment (SAIDI analogue): total customer delay minutes ÷ total shipments
-
Interruption Frequency per 1,000 Stops (SAIFI analogue): total service interruptions ÷ total stops × 1,000
-
Loss/Damage % (T&D Losses analogue): (inbound units – billed/clean units) ÷ inbound units × 100
-
Dock/Yard Peak Utilization (Transformer Utilization): peak load ÷ capacity × 100
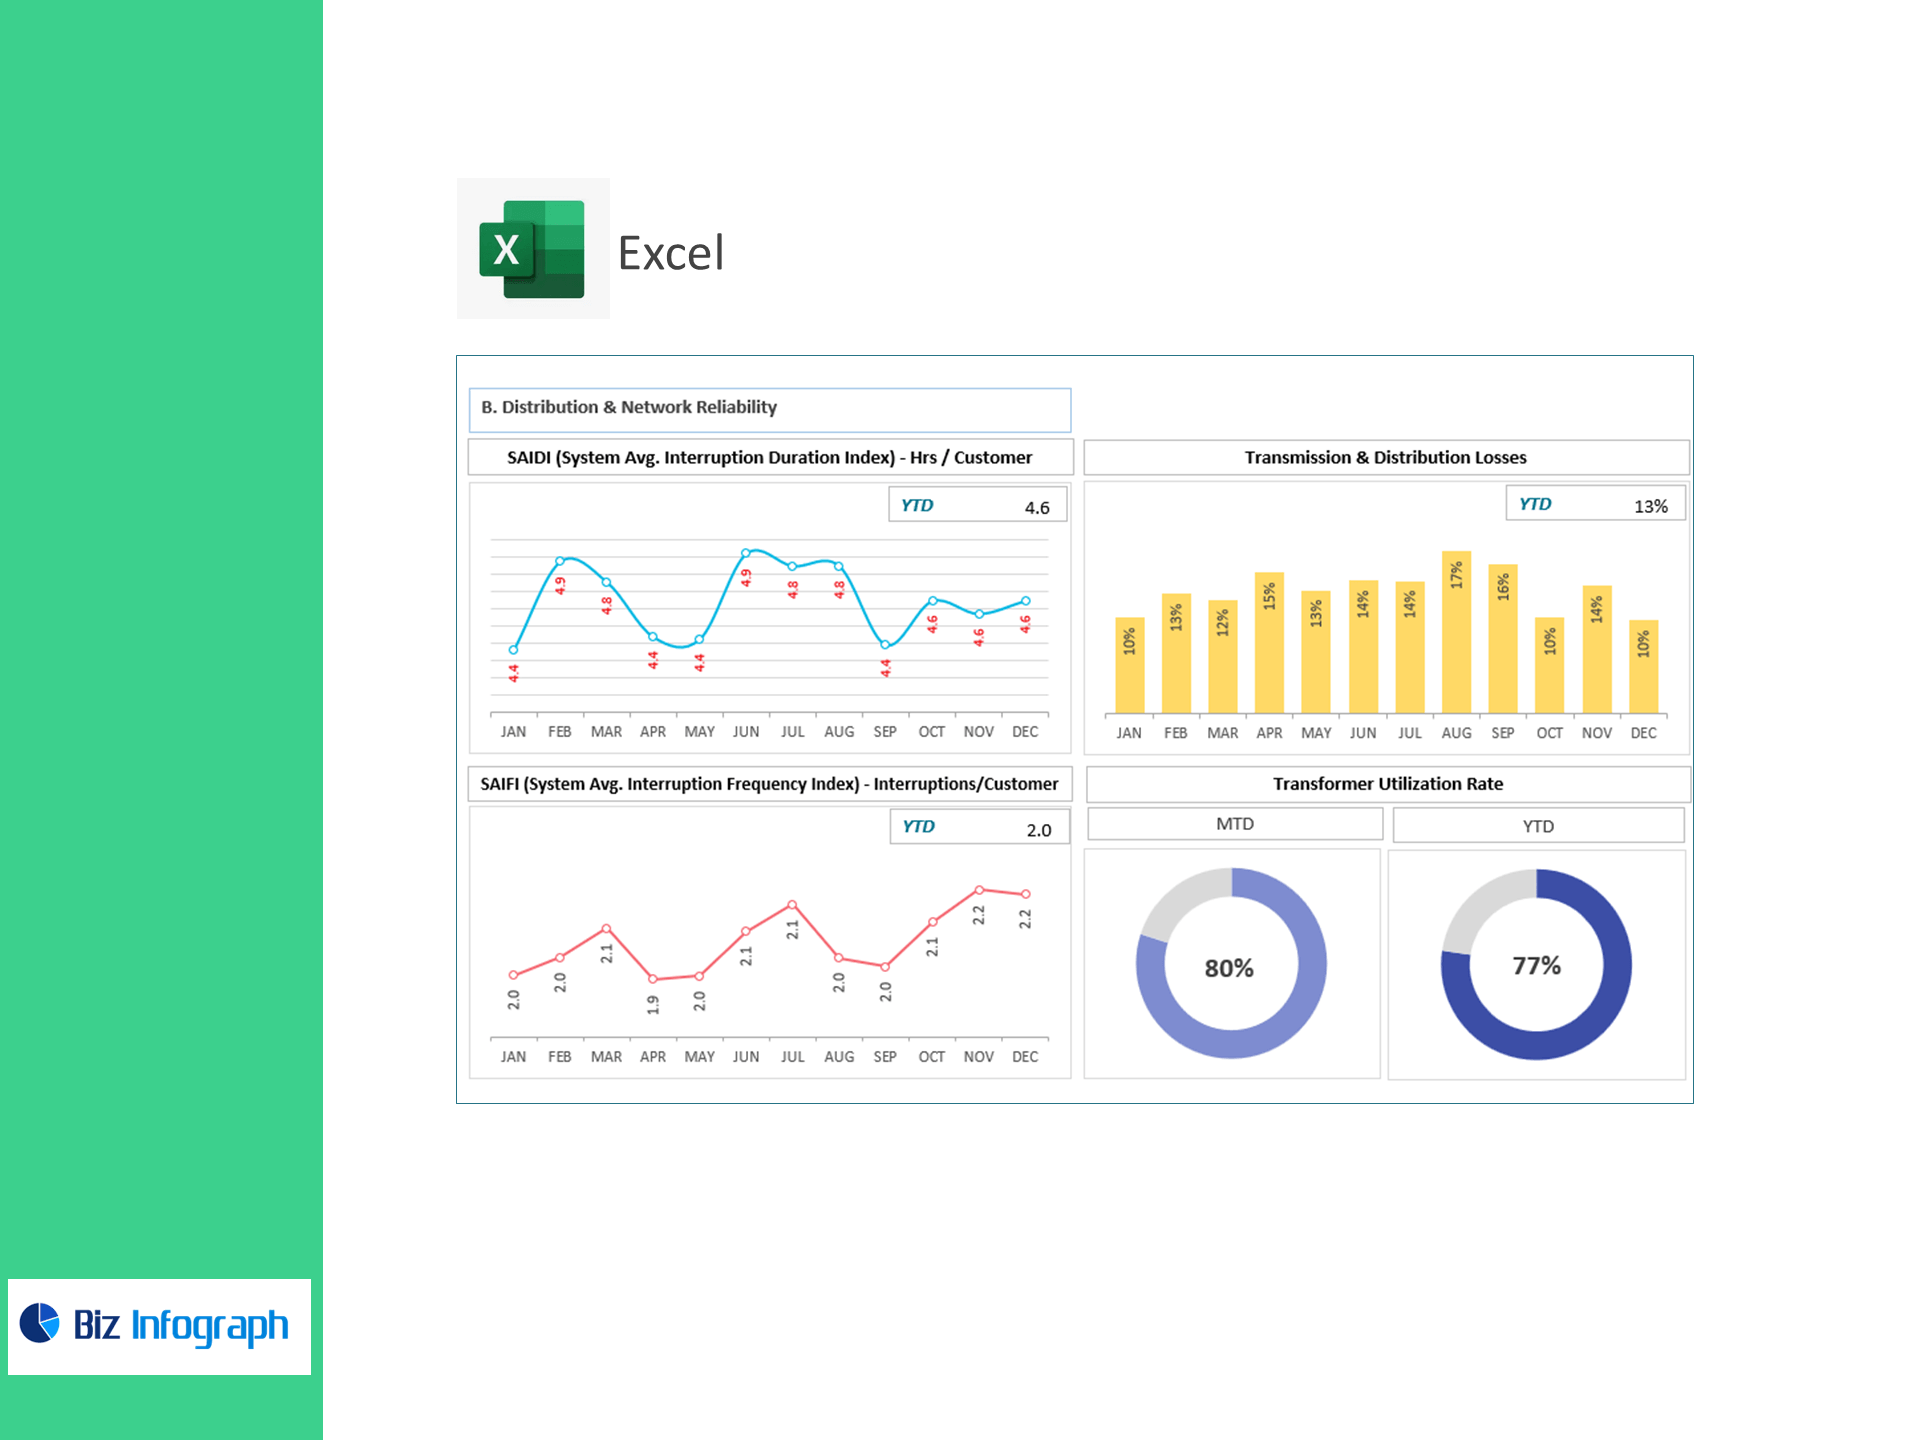
C) Safety & Environmental Performance
-
LTIFR (Lost-Time Injury Frequency Rate): injuries × 1,000,000 ÷ total hours worked
-
Emissions Compliance Rate: compliant readings ÷ total readings × 100
-
Water Consumption per 1,000 Orders: total water used ÷ orders × 1,000
-
Waste Recycling Rate: recycled waste ÷ total waste × 100
What’s inside
-
Interactive Dashboard: uptime, delays, incidents, loss/damage, utilization, safety, and ESG in one view.
-
Data Tabs: fleet hours, stops/shipments, delays & incidents, fuel & energy, capacity, safety, and sustainability.
-
Targets & RAG: configurable thresholds with MoM/YoY trends and variance-to-goal.
-
Print-ready pages: export concise PDFs for ops reviews and QBRs.
-
Definitions & Formulas: plain-English KPI guide so teams trust the numbers.
Benefits
-
Cut downtime: treat trucks, MHE, and hubs like critical assets; attack unplanned outages first.
-
Stabilize service: lower delay duration/frequency to protect SLAs and OTIF.
-
Protect margin: improve fuel intensity and loss/damage while using capacity smarter.
-
Prove sustainability: track compliance, water, and recycling with the same rigor as service.
For ready-to-use Dashboard Templates: