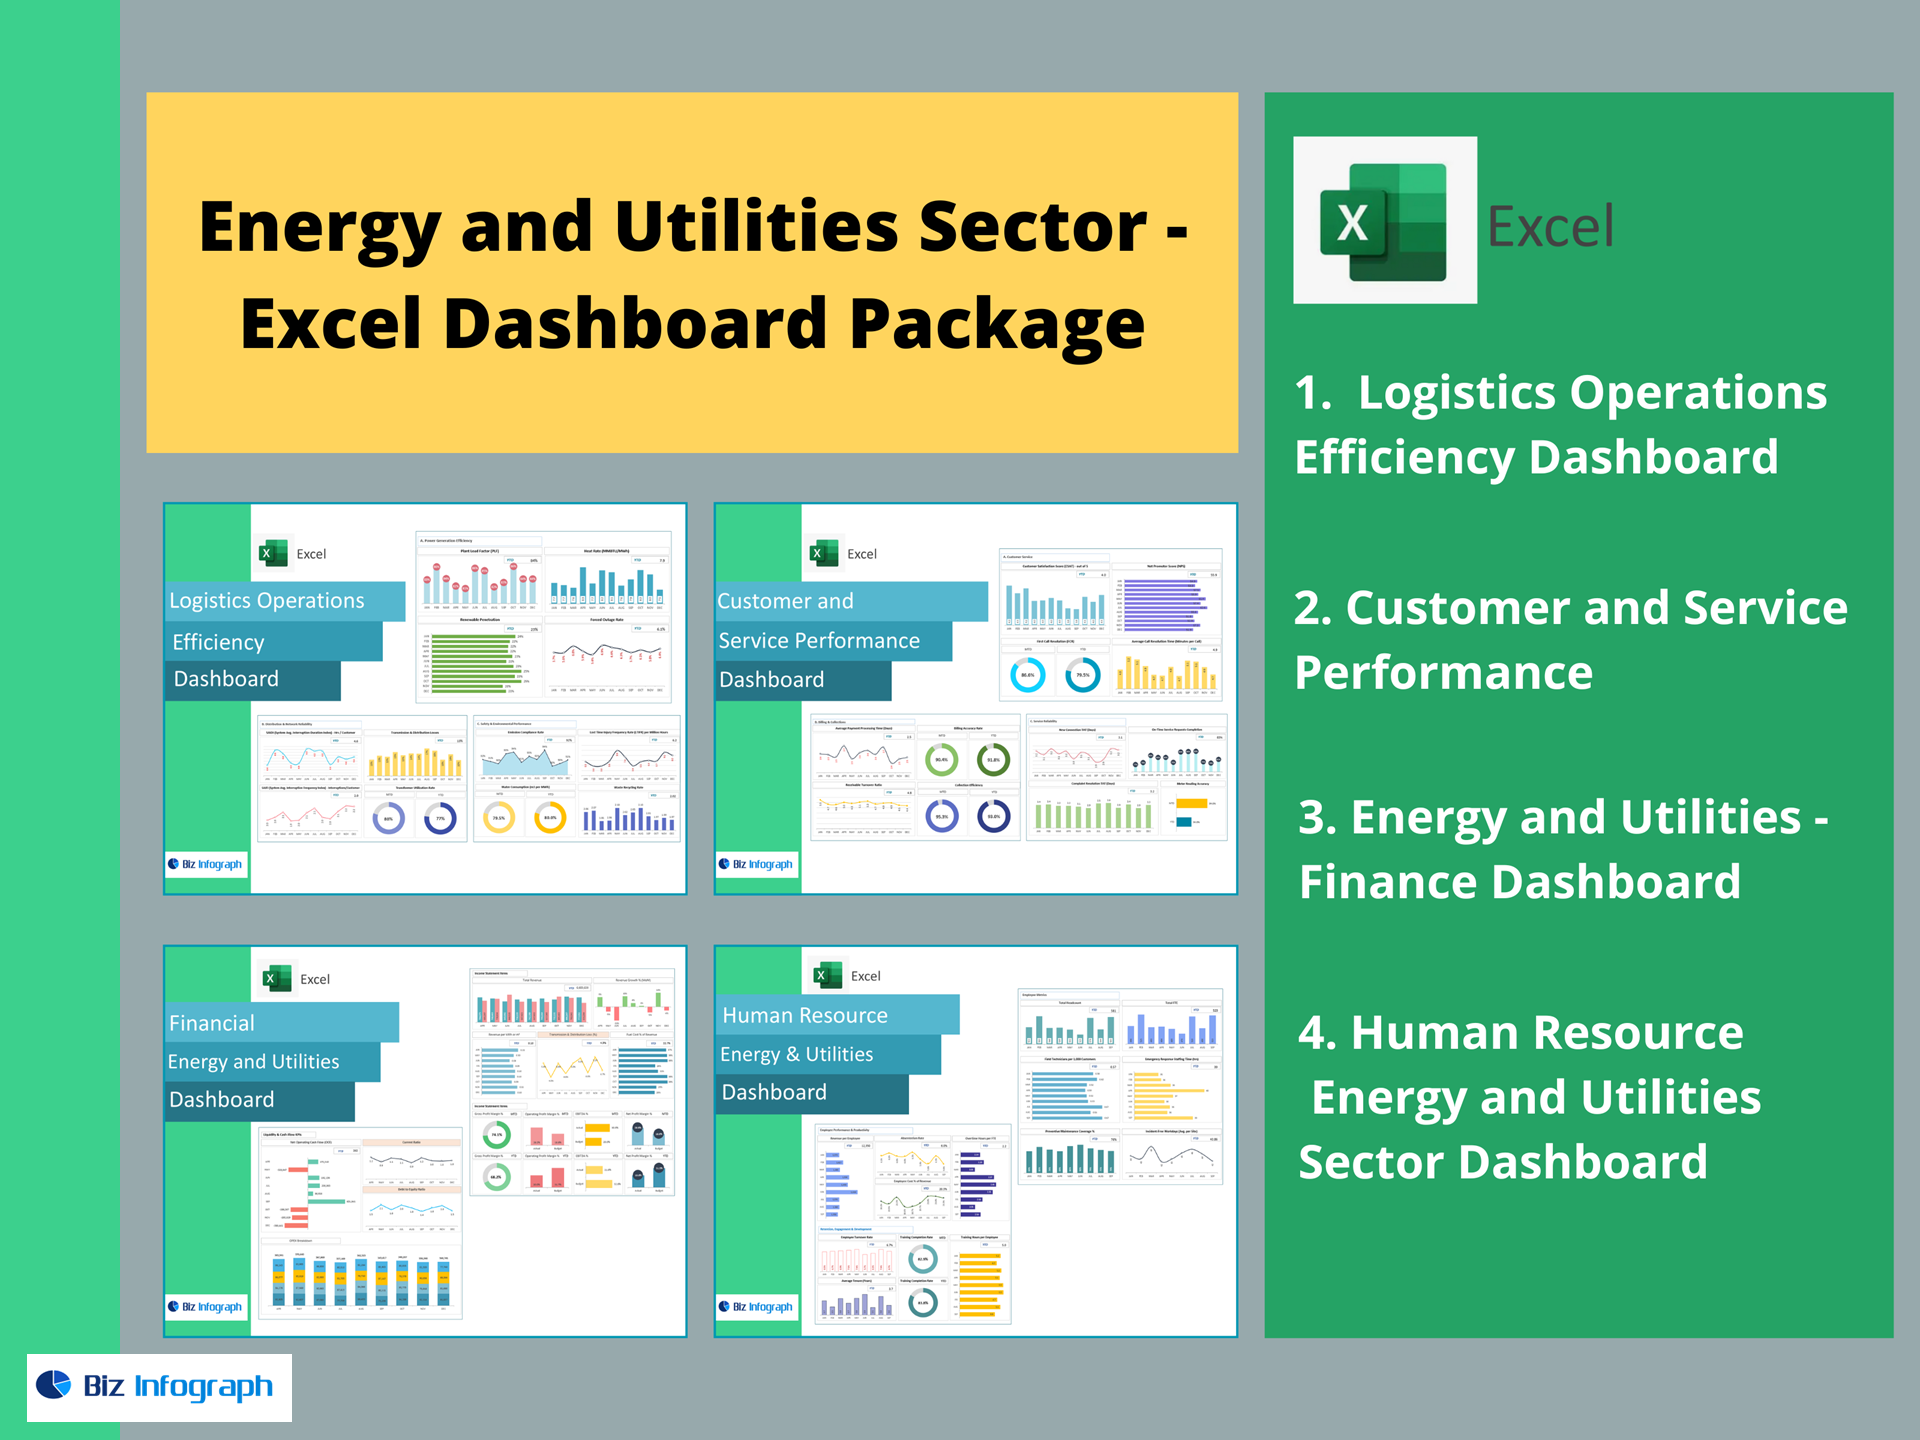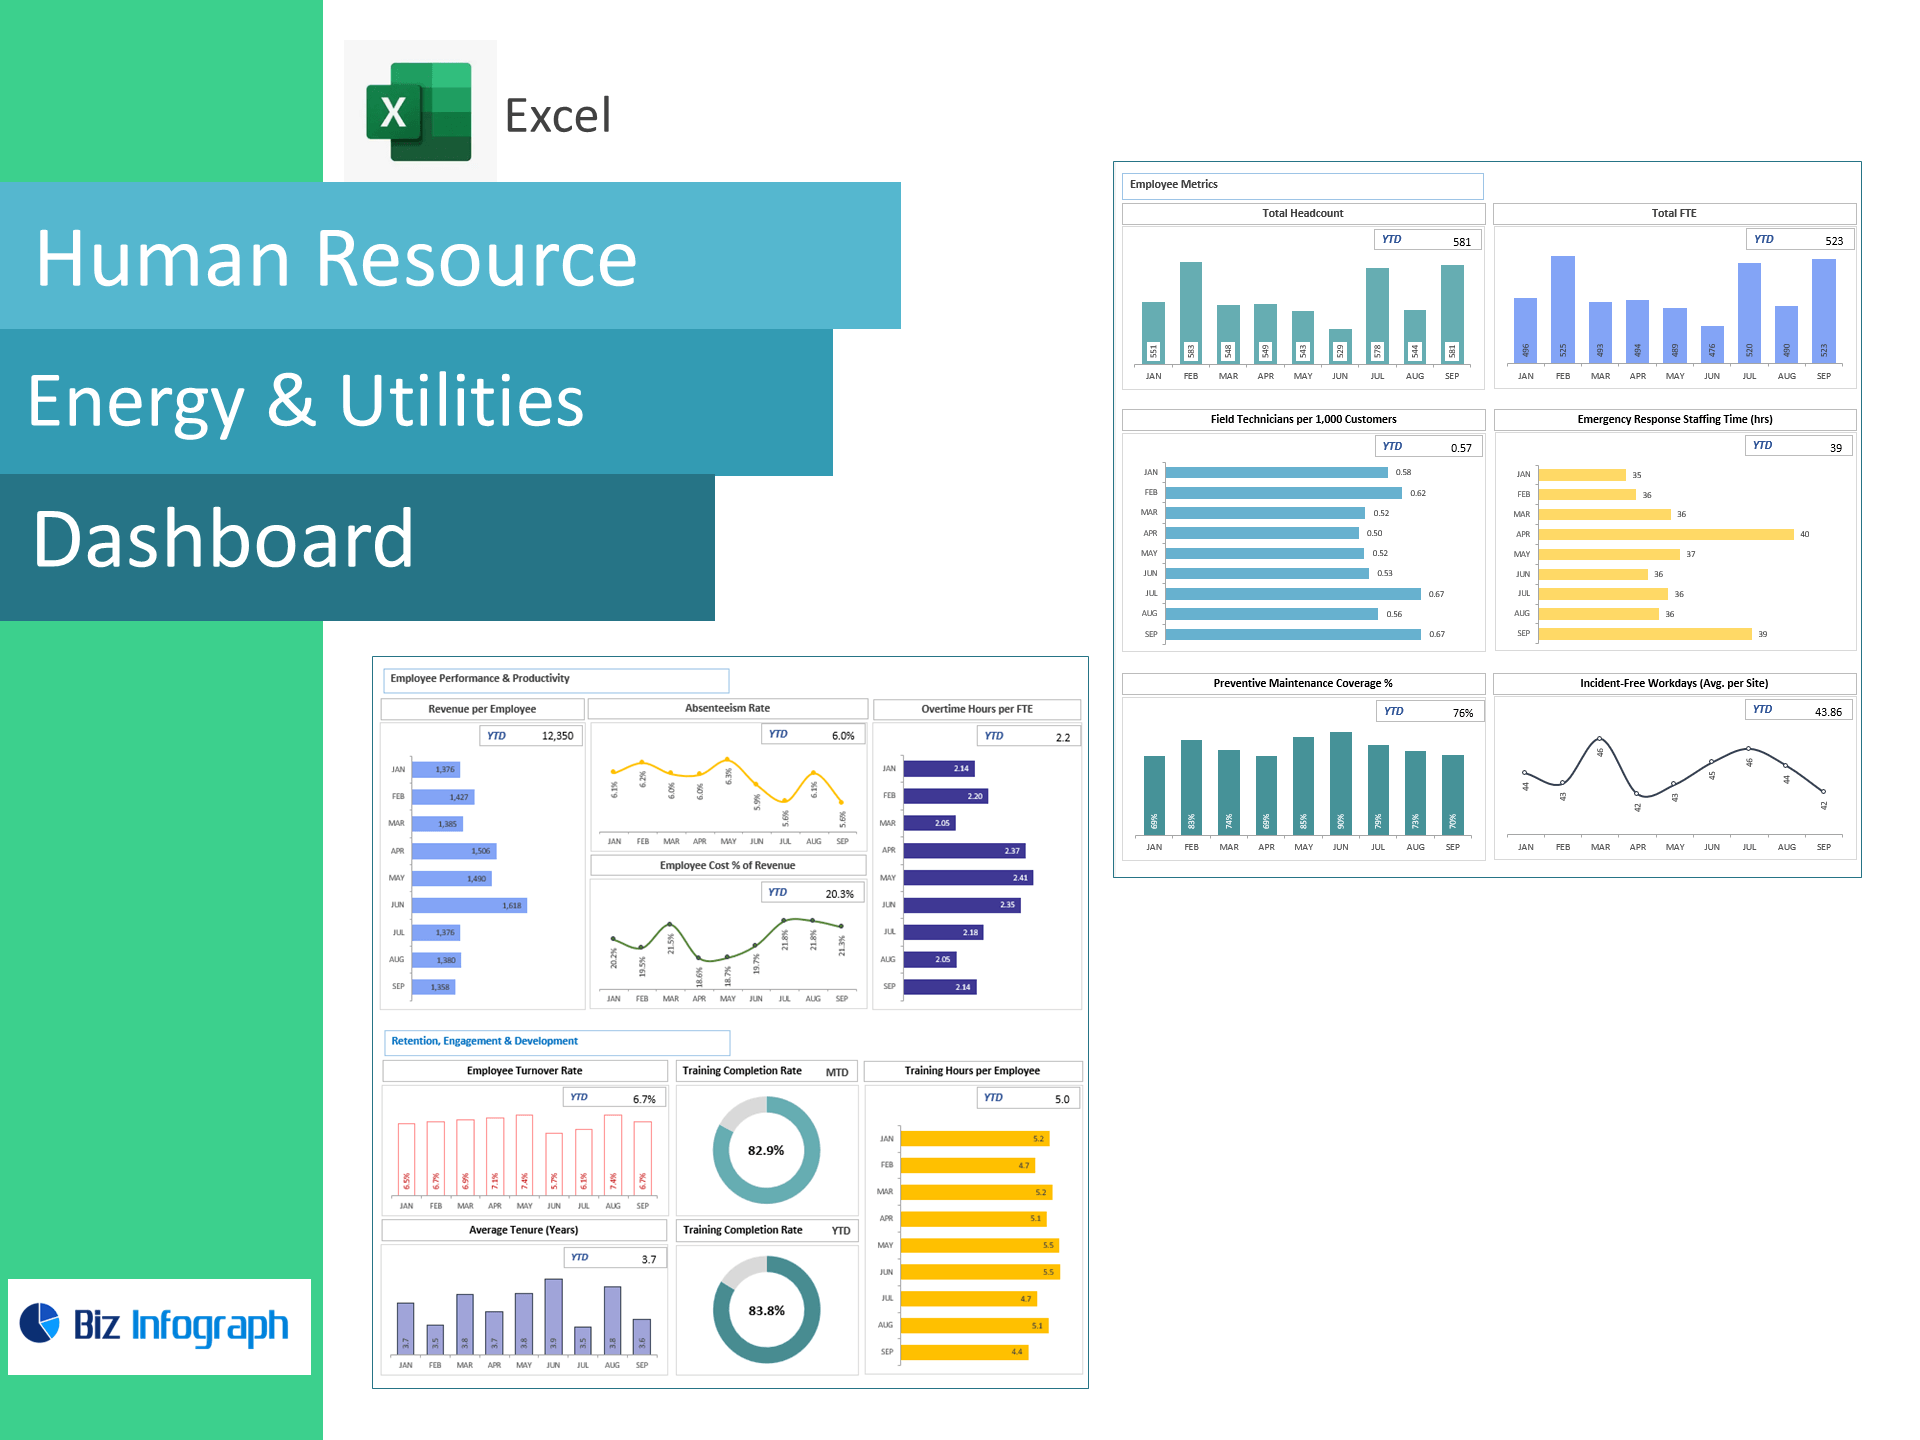
HR Energy & Utilities Dashboard — Excel Template
A plug-and-play Excel HR analytics dashboard for power, water, and gas utilities. Track field-force capacity, emergency readiness, preventive maintenance coverage, safety, absenteeism, overtime, labor cost, retention, tenure, and training—all in one workbook. No macros. Ready in minutes.
Who it’s for
HR leaders, Operations & Maintenance (O&M) managers, HSE teams, and People Analytics in electric, water, and gas utilities who need utility-specific workforce KPIs aligned to reliability and response SLAs.
What you get
-
Interactive dashboard: filter by site/substation, region, crew, union/non-union, and period.
-
Clean data tabs: paste monthly/weekly exports from HRIS, LMS, and work-management systems.
-
Targets & RAG status: instant red/amber/green vs. goals.
-
Print-ready views: export to PDF for executive and regulator reviews.
Built-in KPIs (with formulas)
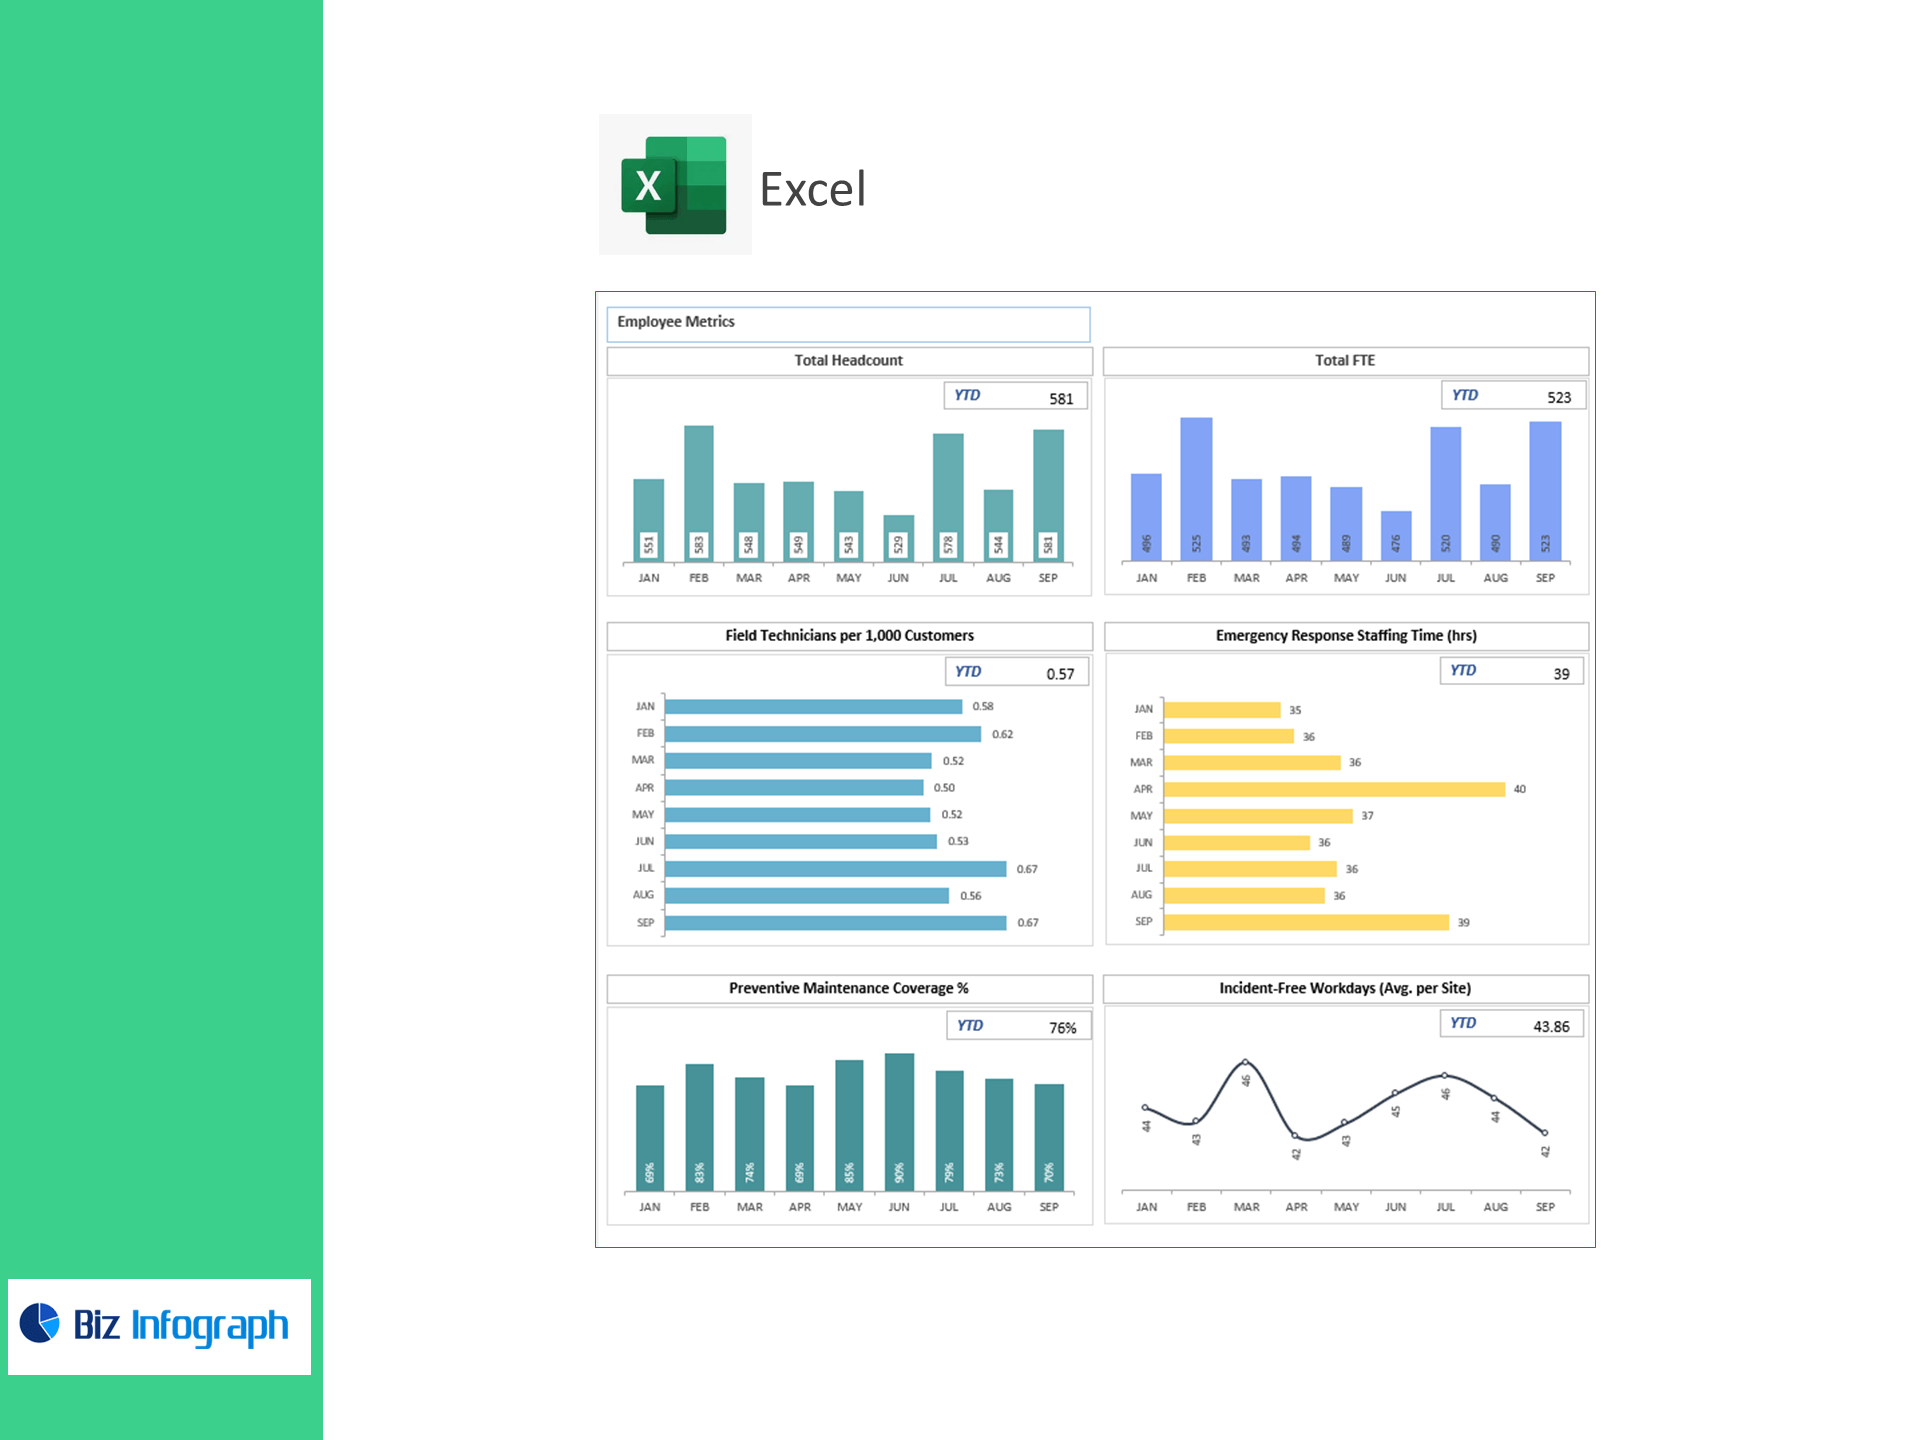
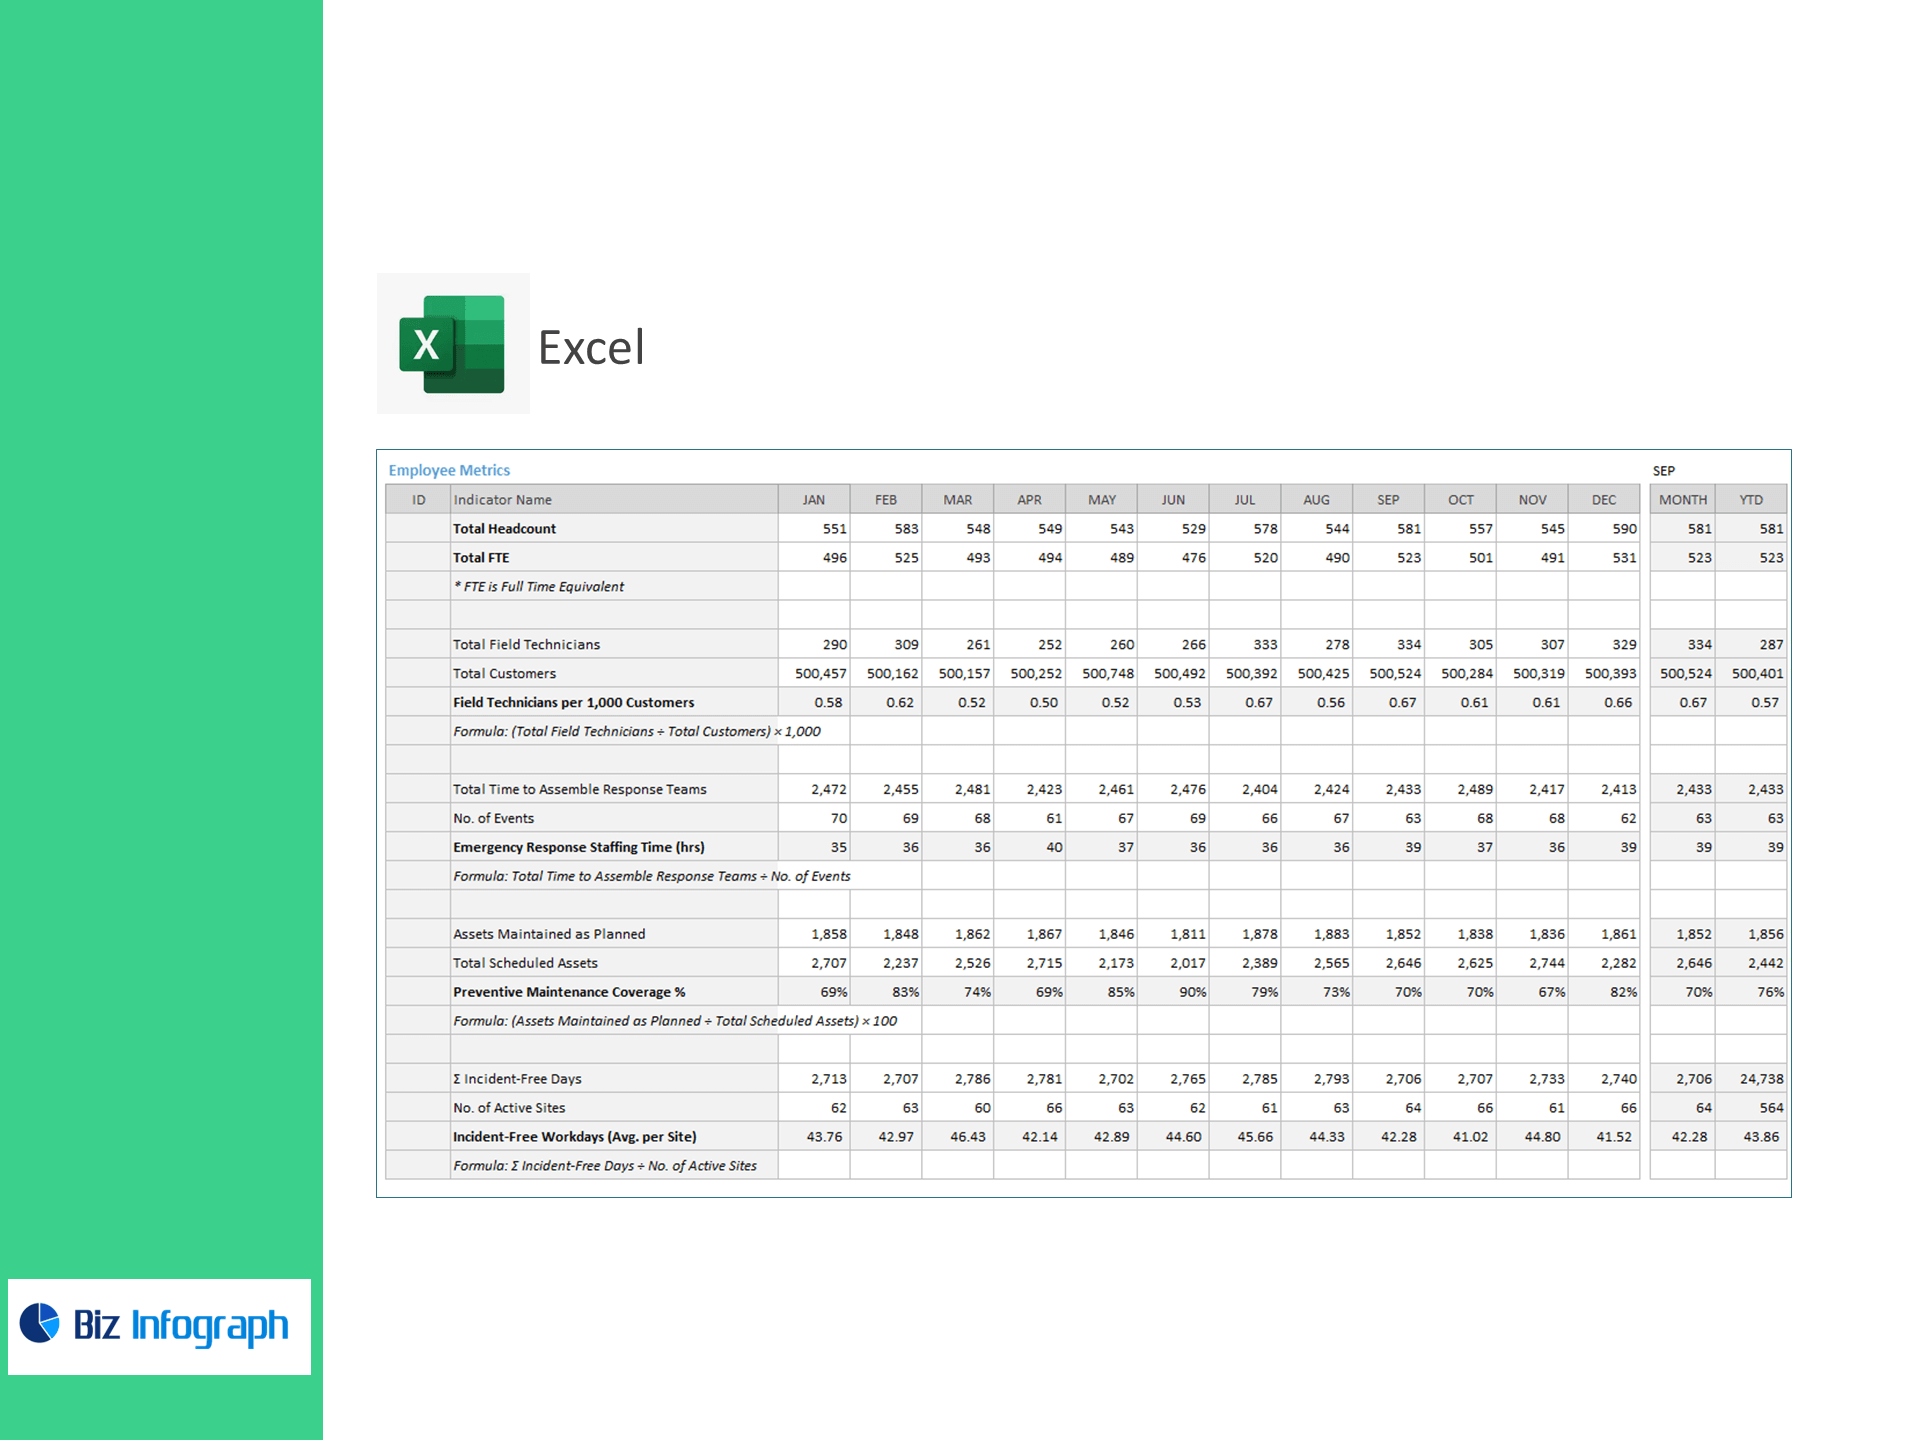
Employee Metrics
-
Total Headcount
-
Total FTE (Full-Time Equivalent)
Field-Force Capacity & Readiness
-
Field Technicians per 1,000 Customers
(Total Field Technicians ÷ Total Customers) × 1,000 -
Emergency Response Staffing Time (hrs/event)
Total Time to Assemble Response Teams ÷ No. of Events
Asset Care & Safety
-
Preventive Maintenance Coverage %
(Assets Maintained as Planned ÷ Total Scheduled Assets) × 100 -
Incident-Free Workdays (Avg. per Site)
Σ Incident-Free Days ÷ No. of Active Sites
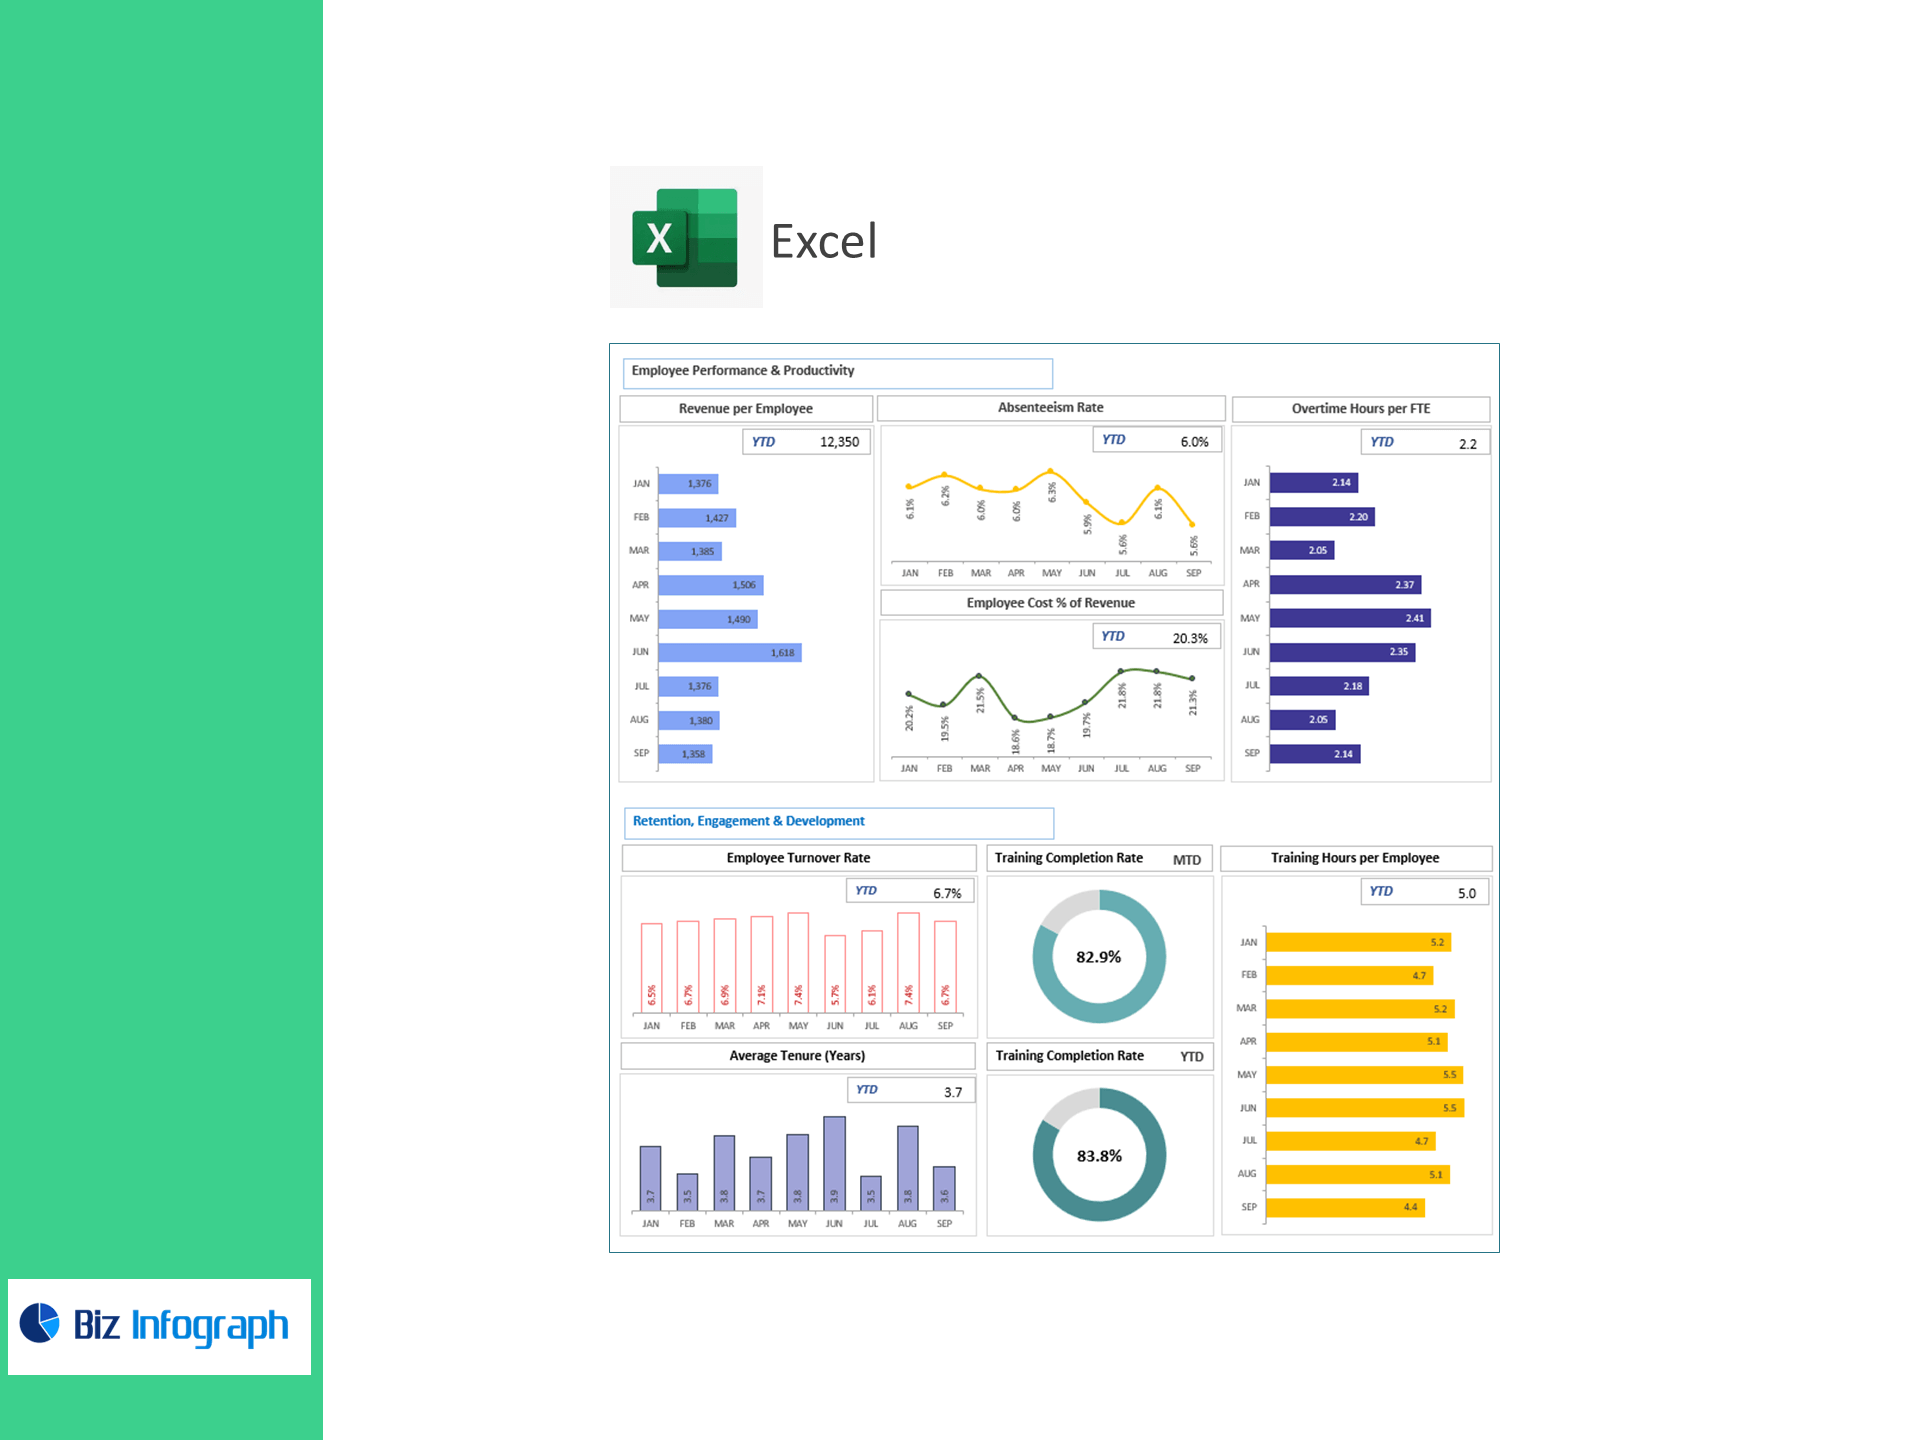
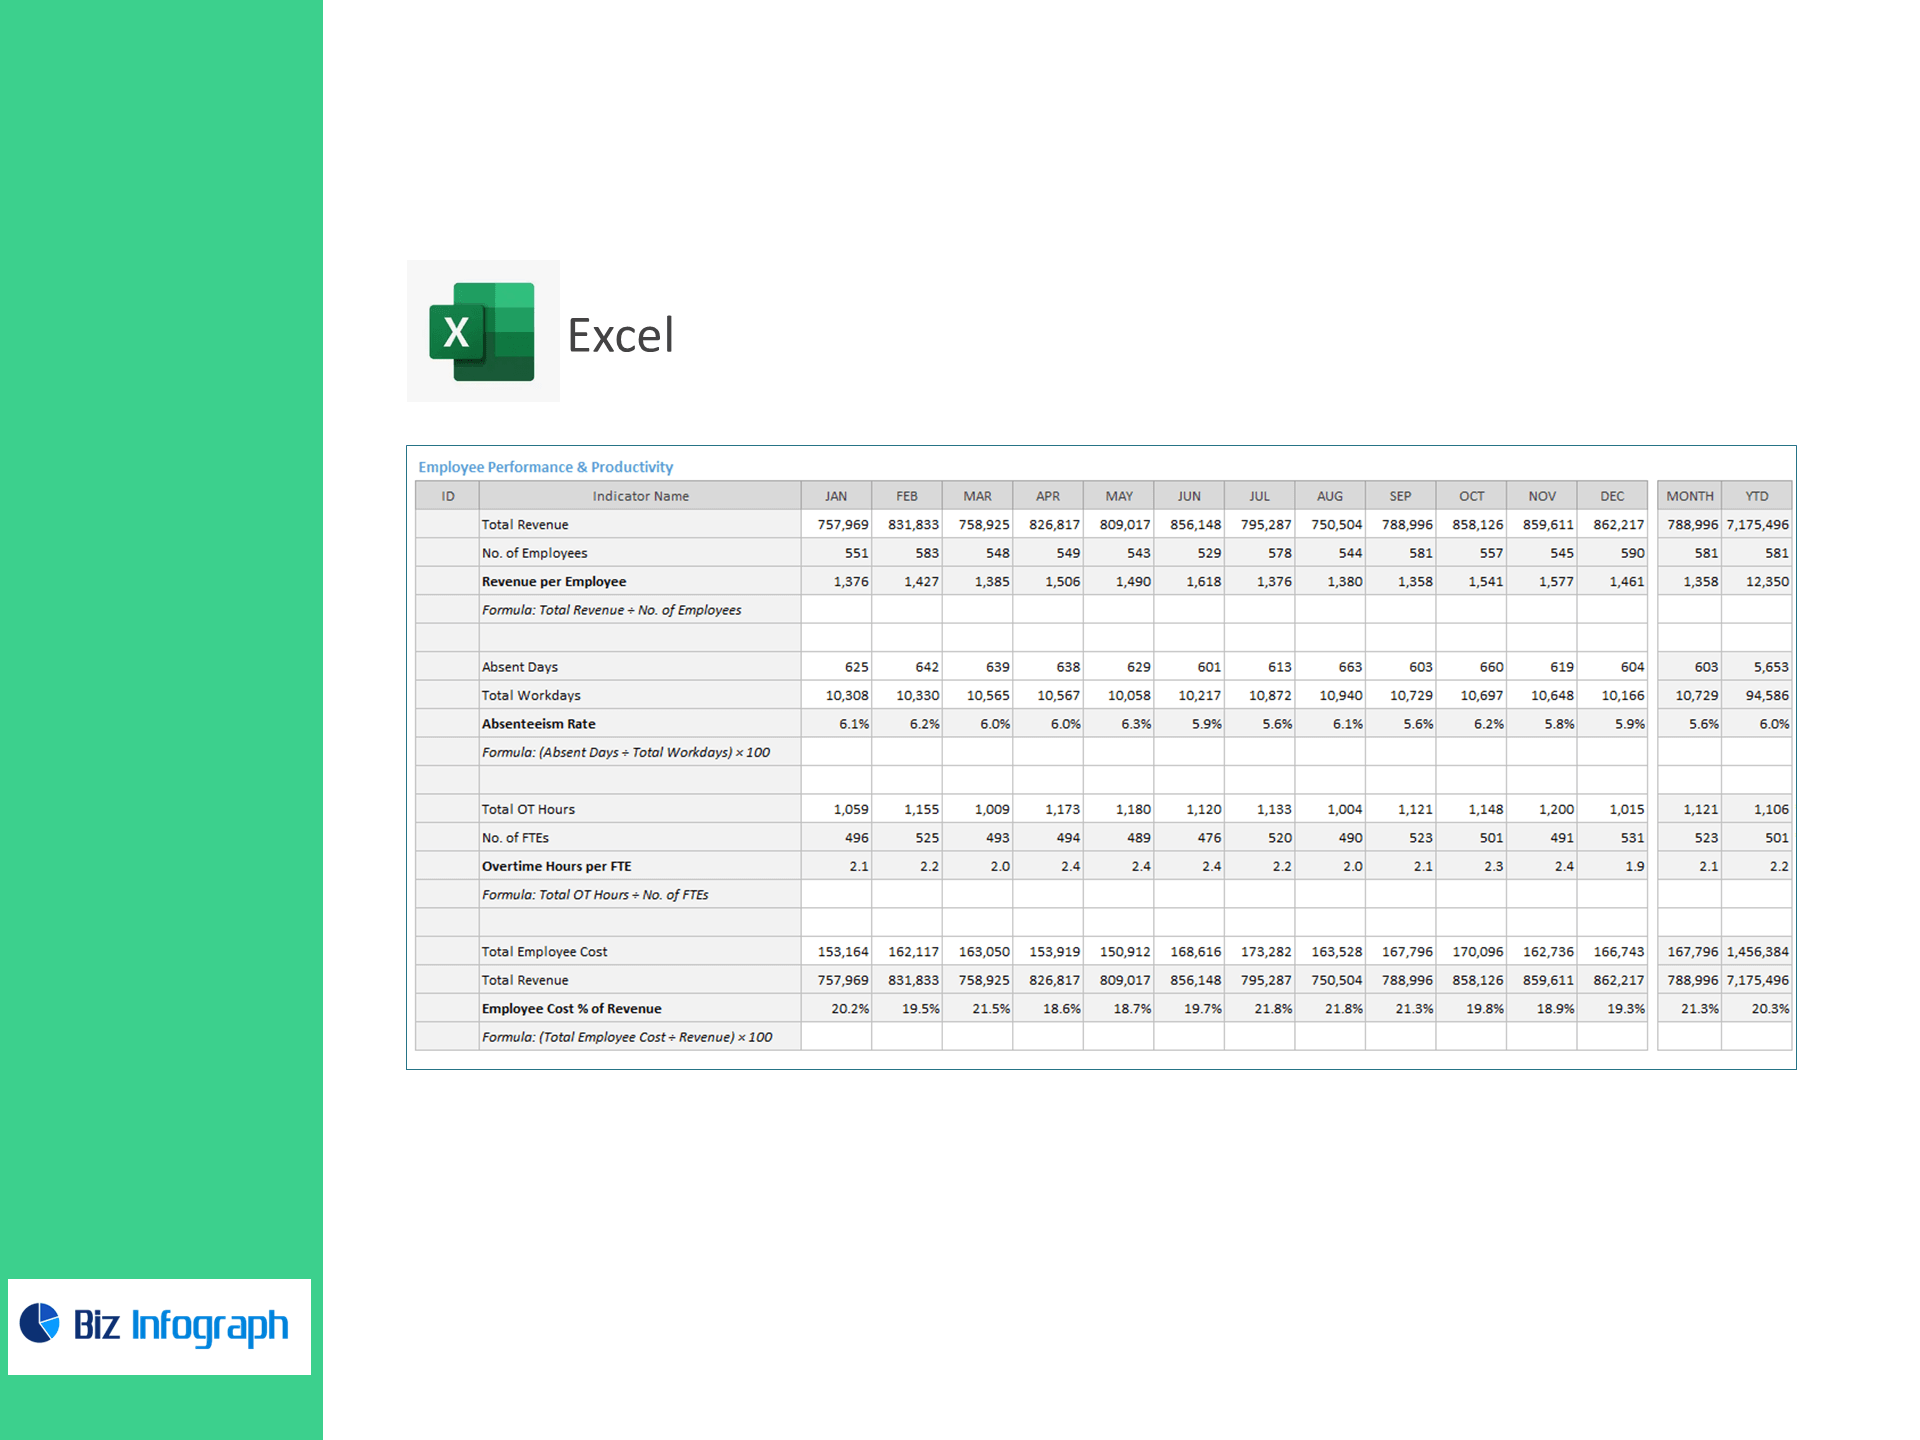
Employee Performance & Productivity
-
Revenue per Employee
Total Revenue ÷ No. of Employees
Attendance & Overtime
-
Absenteeism Rate %
(Absent Days ÷ Total Workdays) × 100 -
Overtime Hours per FTE
Total OT Hours ÷ No. of FTEs
Cost Control
-
Employee Cost % of Revenue
(Total Employee Cost ÷ Revenue) × 100
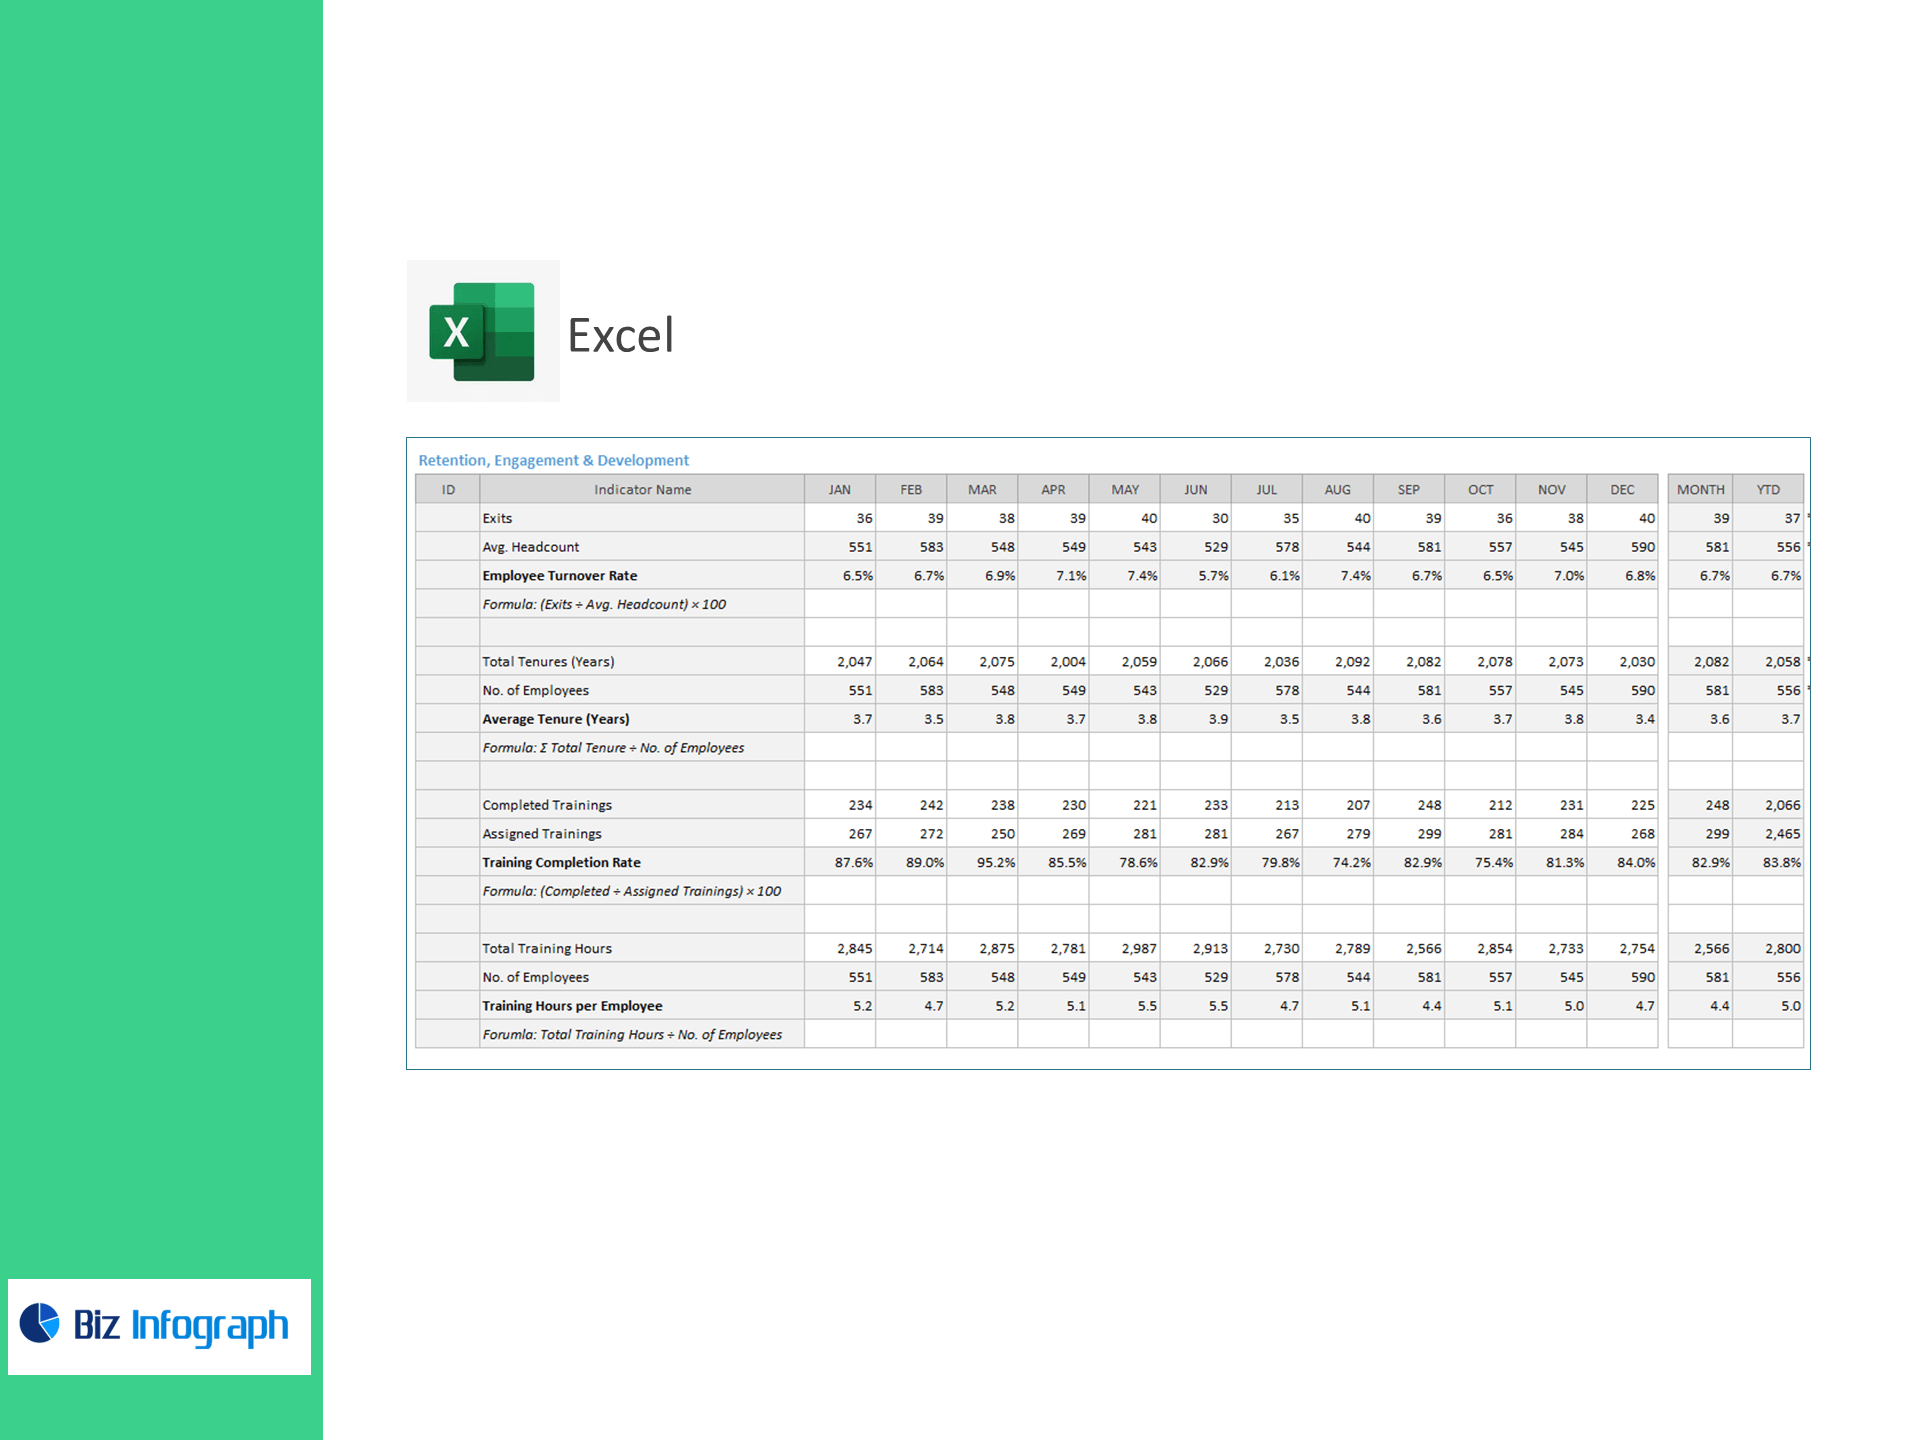
Retention & Experience
-
Employee Turnover Rate %
(Exits ÷ Avg. Headcount) × 100 -
Average Tenure (Years)
Σ Total Tenure ÷ No. of Employees
Learning & Compliance
-
Training Completion Rate %
(Completed Trainings ÷ Assigned Trainings) × 100 -
Training Hours per Employee
Total Training Hours ÷ No. of Employees
Why utility teams choose this template
-
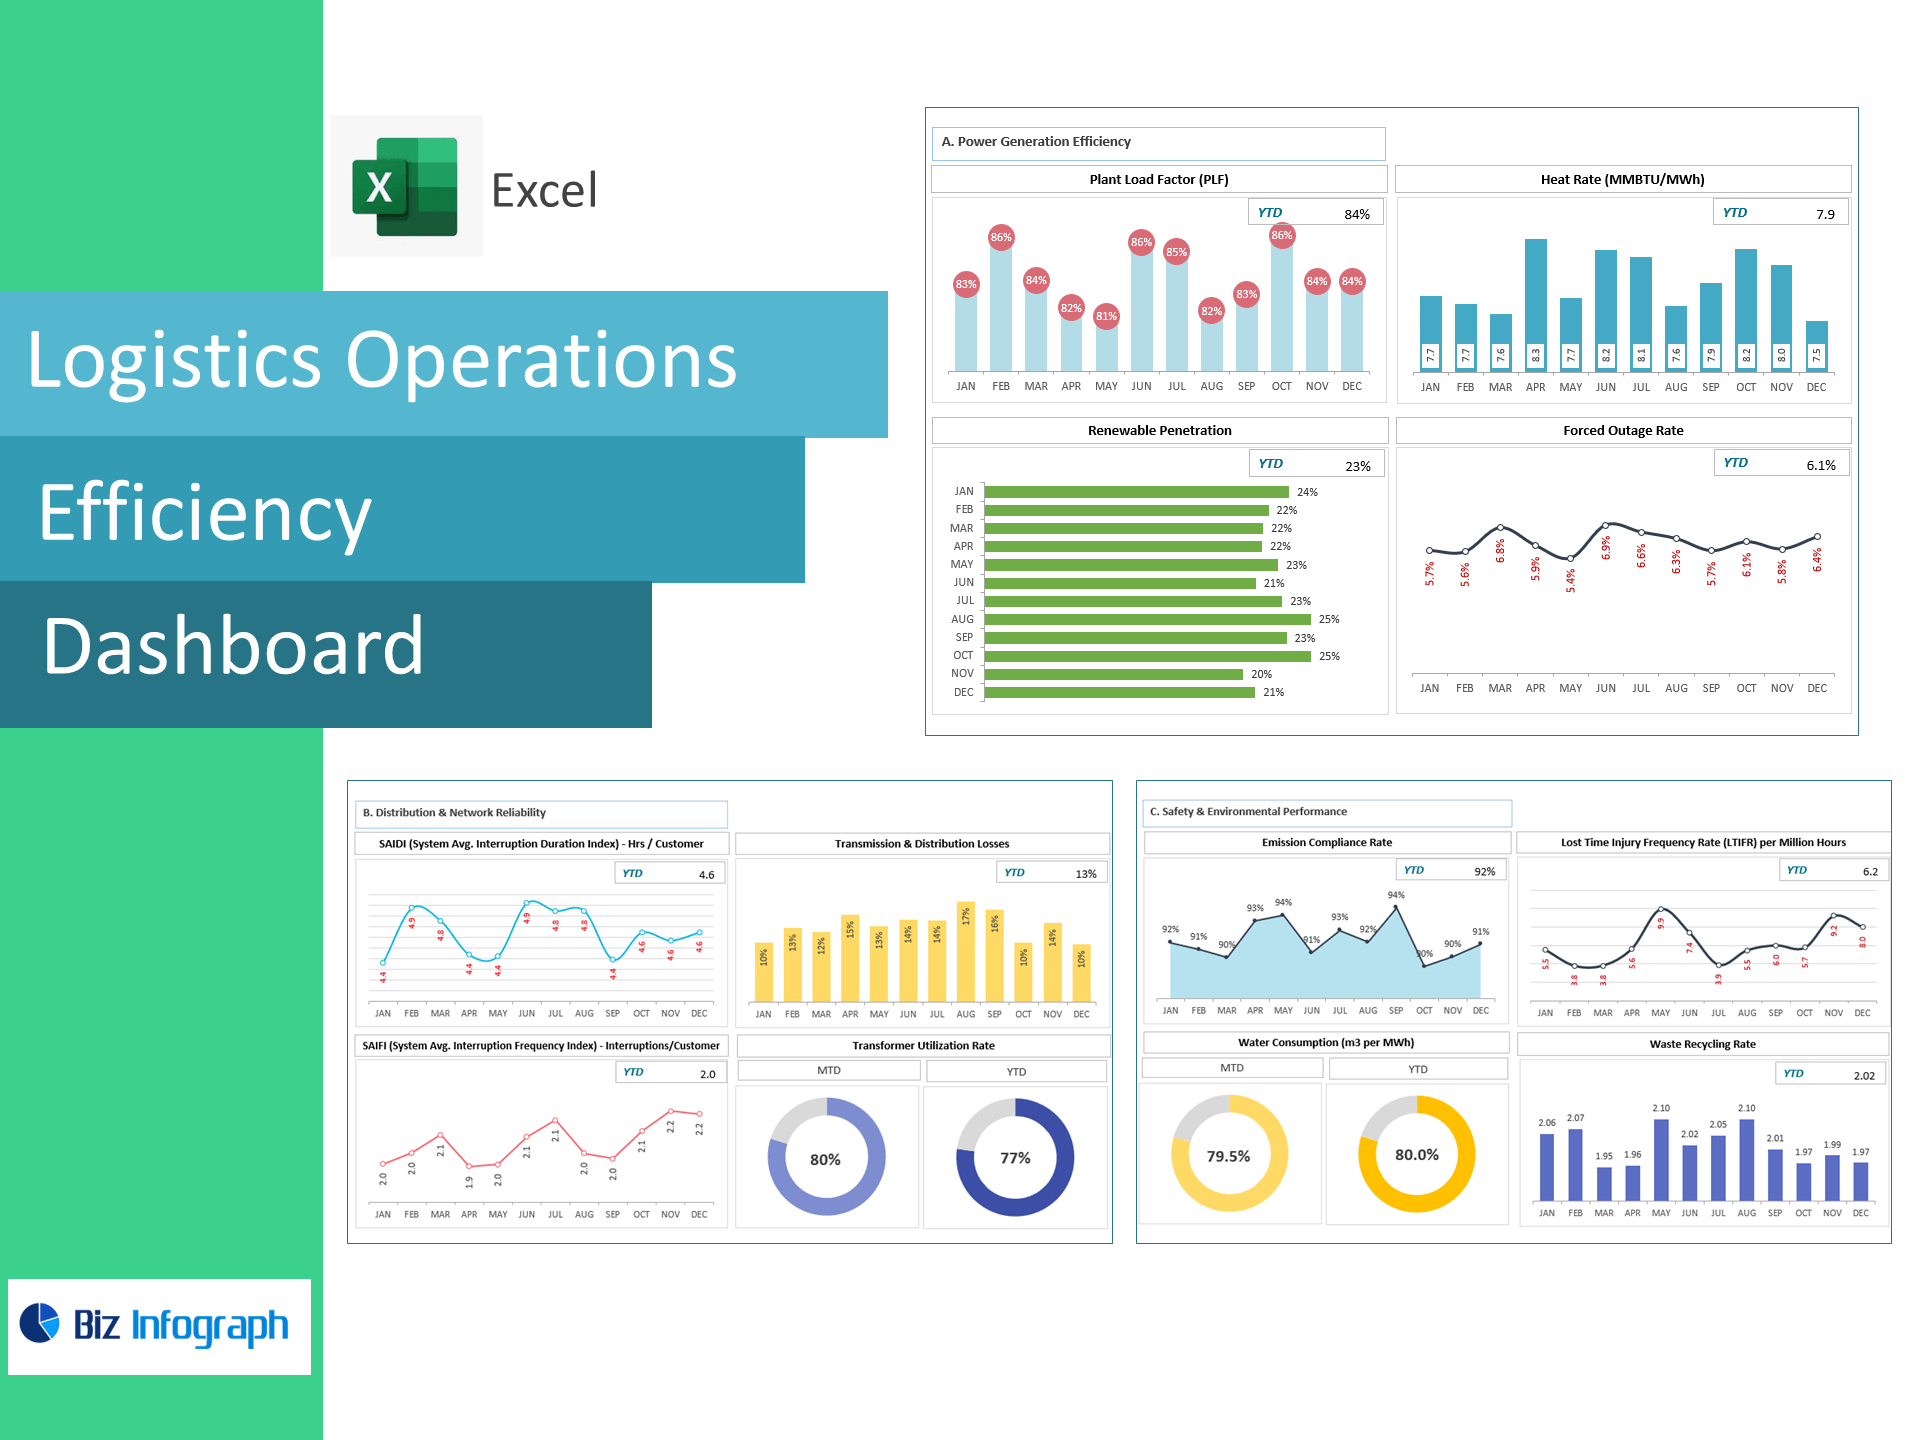
Improve reliability: link workforce capacity, PM coverage, and incident-free days to outage metrics.
-
Respond faster: watch response staffing time to meet storm and emergency SLAs.
-
Control labor cost: balance OT per FTE, absenteeism, and employee cost % of revenue.
-
Build skills & retain talent: track training, turnover, and tenure by craft and location.
What’s inside the workbook
-
Executive Overview: headline KPIs with MoM/YoY trends and variance to target.
-
Drilldowns: site/crew heatmaps, craft mix, union vs. non-union views.
-
Settings & Thresholds: define targets, business calendar, and crew/site mappings.
-
Documentation: plain-English KPI definitions and setup steps.
For ready-to-use Dashboard Templates: