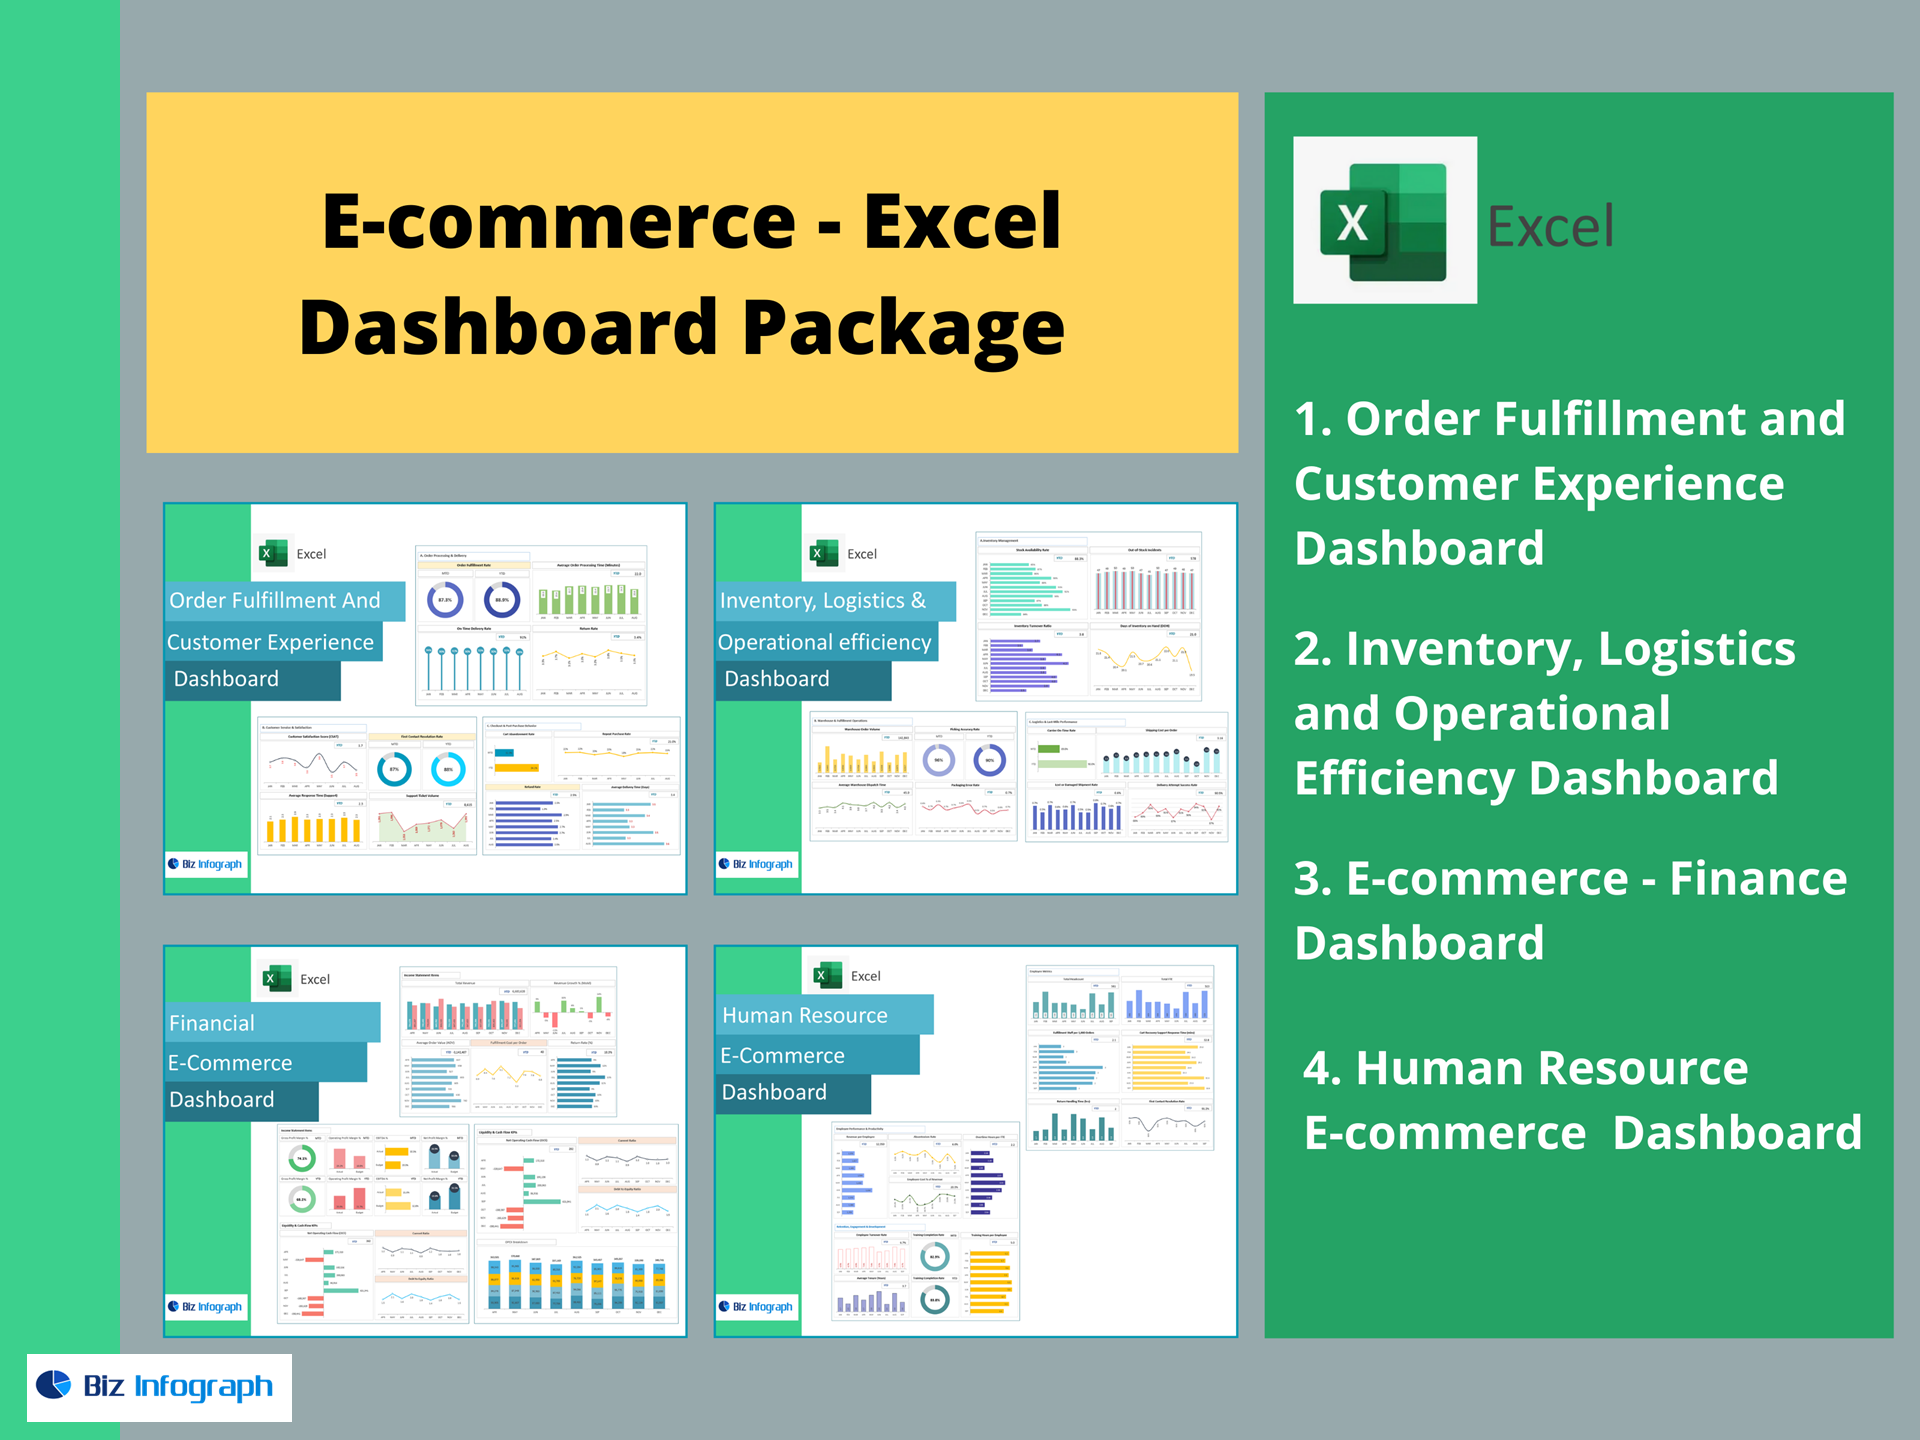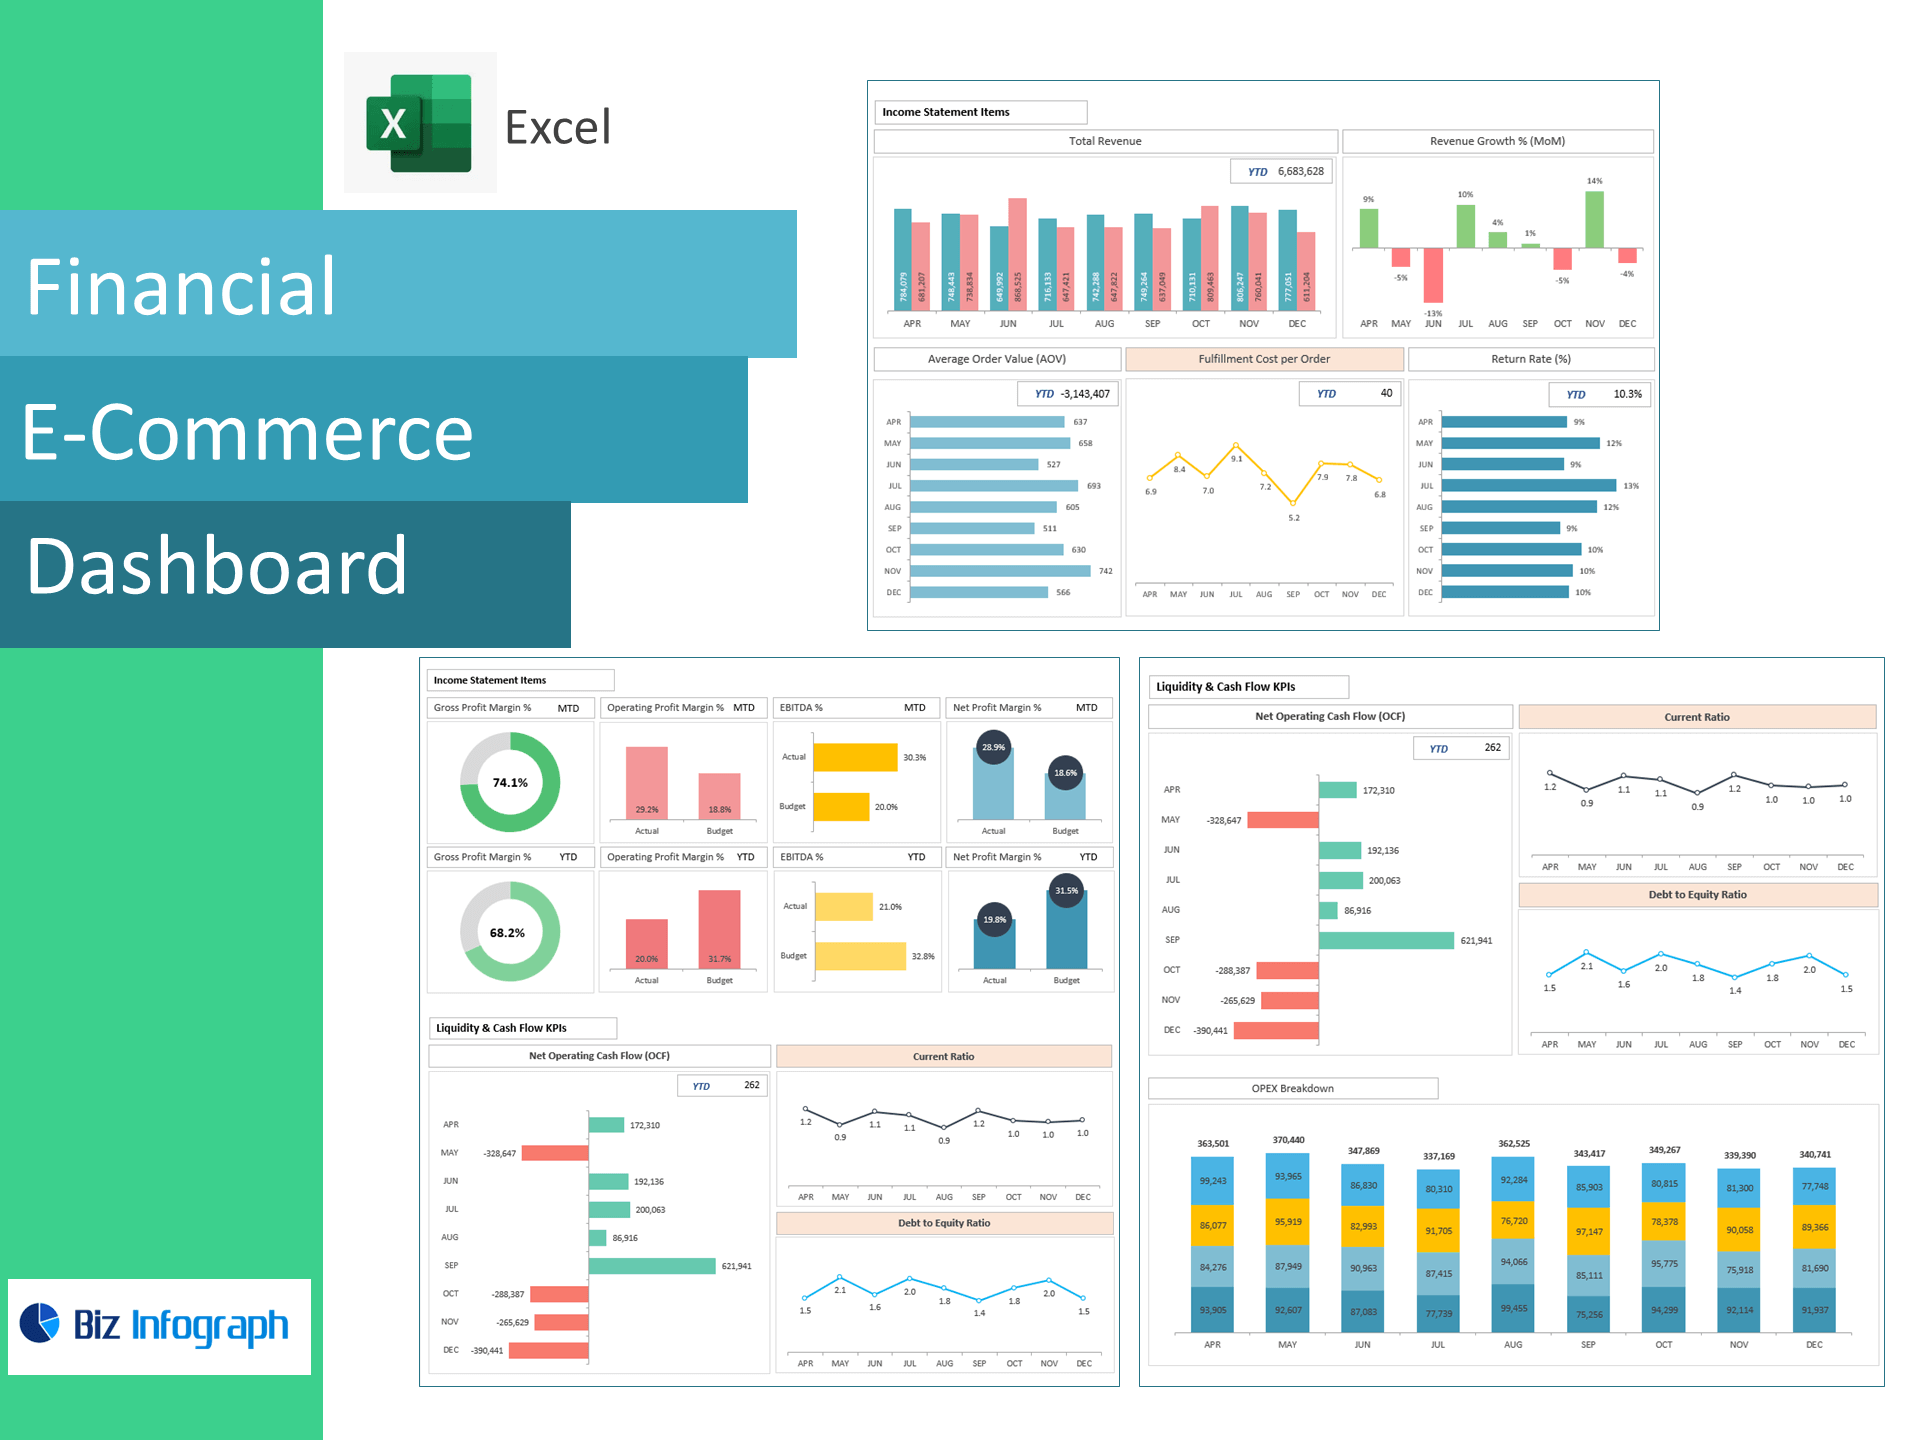
E-Commerce Finance Dashboard — Excel Template
See your store’s margins, cash flow, and order economics in one place—right in Excel. This template turns storefront, payment, and accounting exports into a board-ready dashboard tracking Revenue Growth, GP/EBIT/EBITDA/Net Profit, Net Operating Cash Flow (OCF), Current Ratio, Debt-to-Equity, Average Order Value (AOV), Fulfillment Cost per Order, and Return Rate—so you can scale profitably, not just grow topline.
Why brands choose this template
-
Finance + ops in one view: Connect income statement, liquidity, and order-level KPIs.
-
Actionable unit economics: Watch AOV, FCPO, and returns to tune pricing, shipping, and policy.
-
Cash clarity: Track OCF, working capital, and leverage to fund growth responsibly.
-
Excel-native: Paste your CSVs and go—no add-ins or BI setup required.
KPIs included (ready-made formulas)
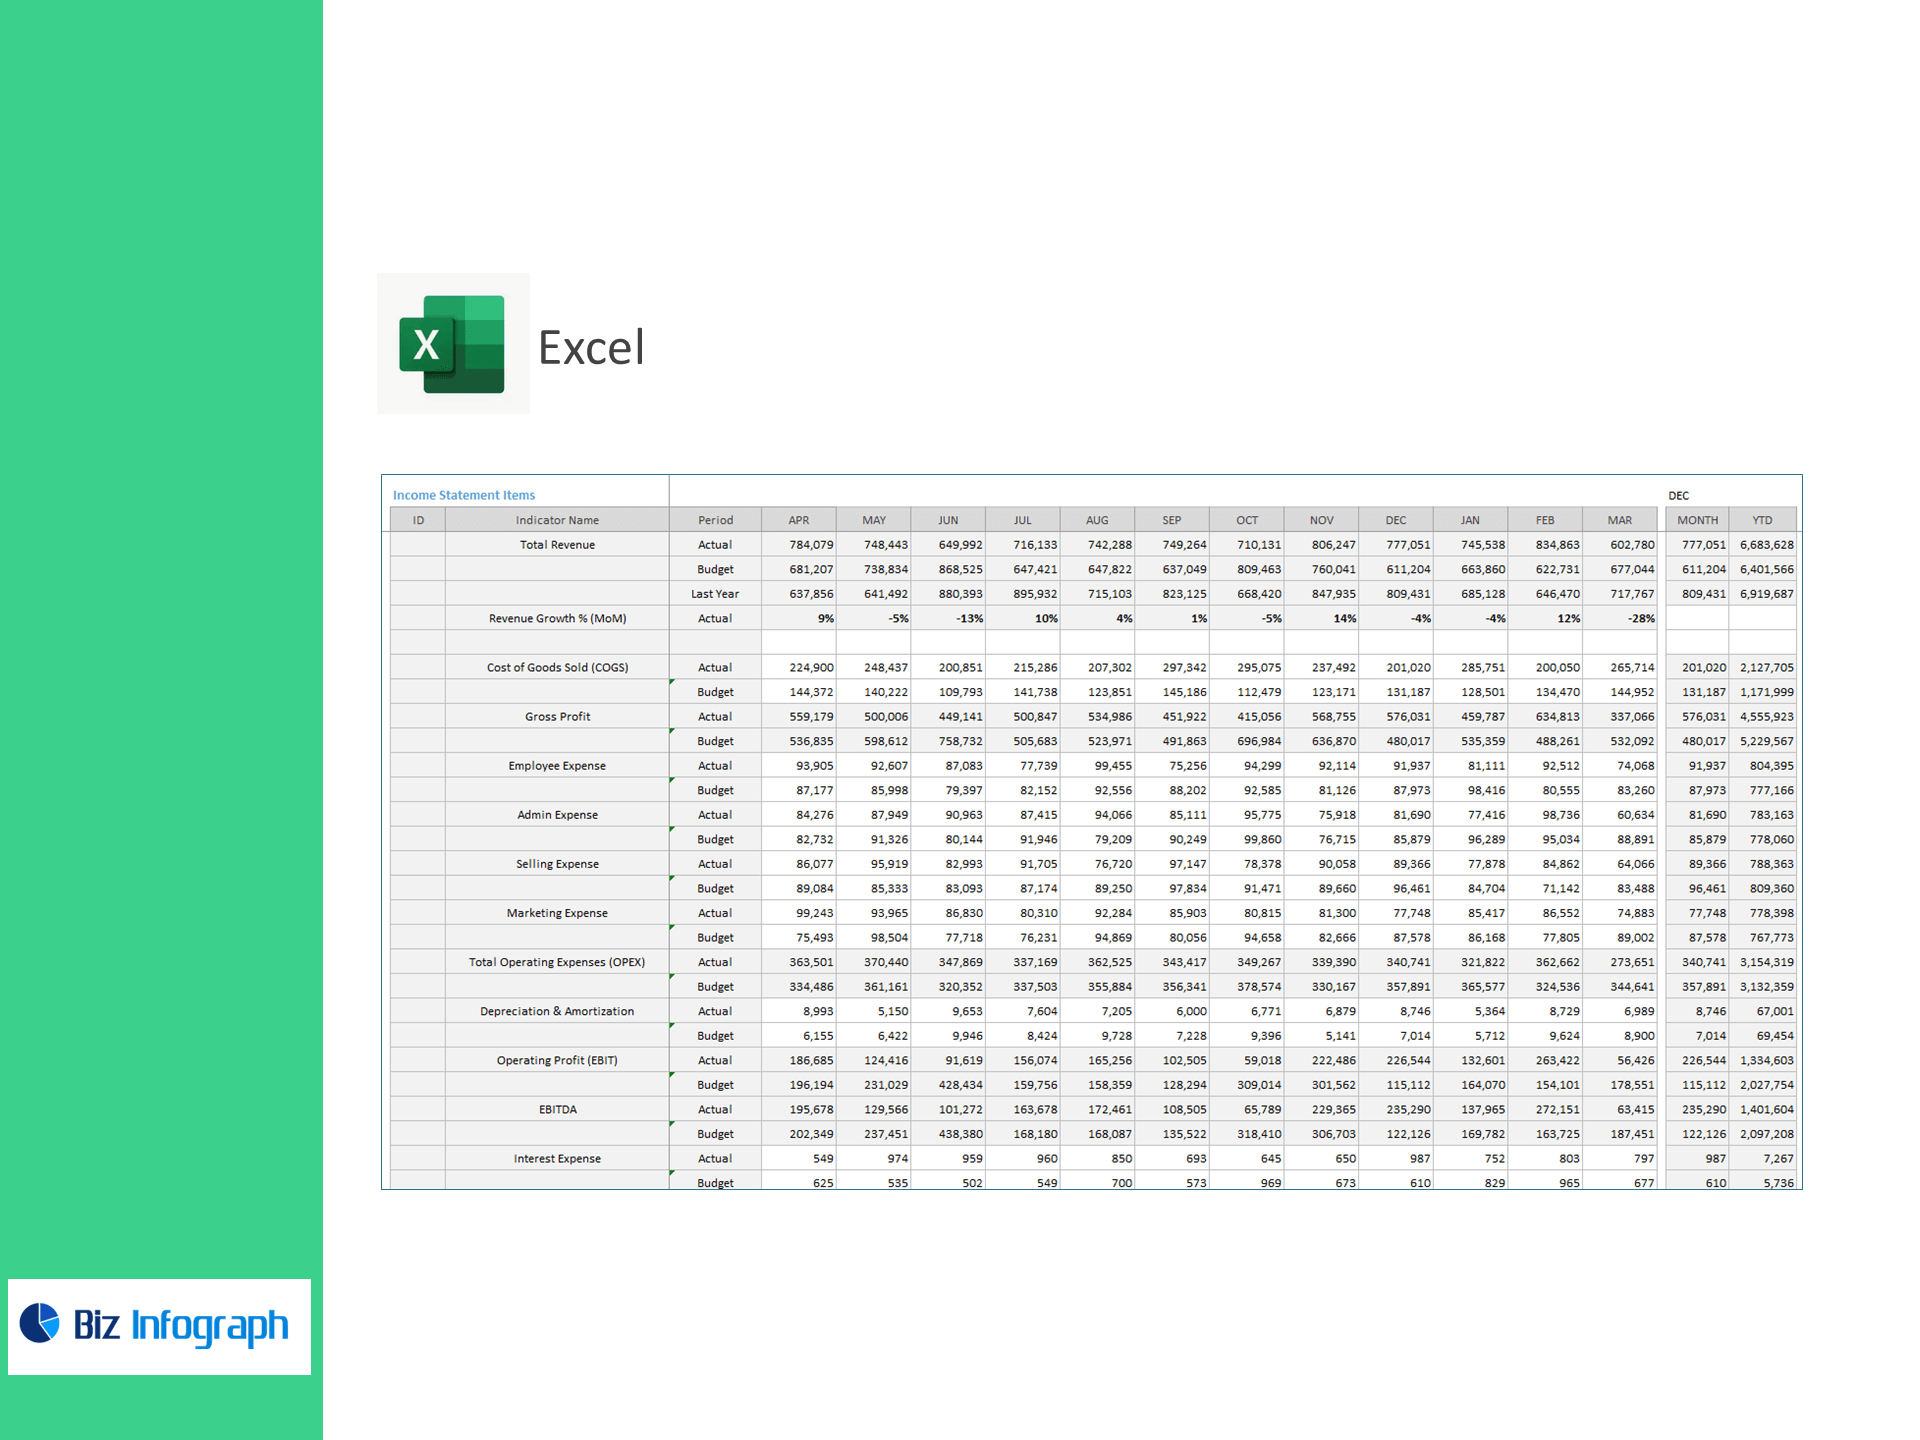
Income Statement & Profitability
-
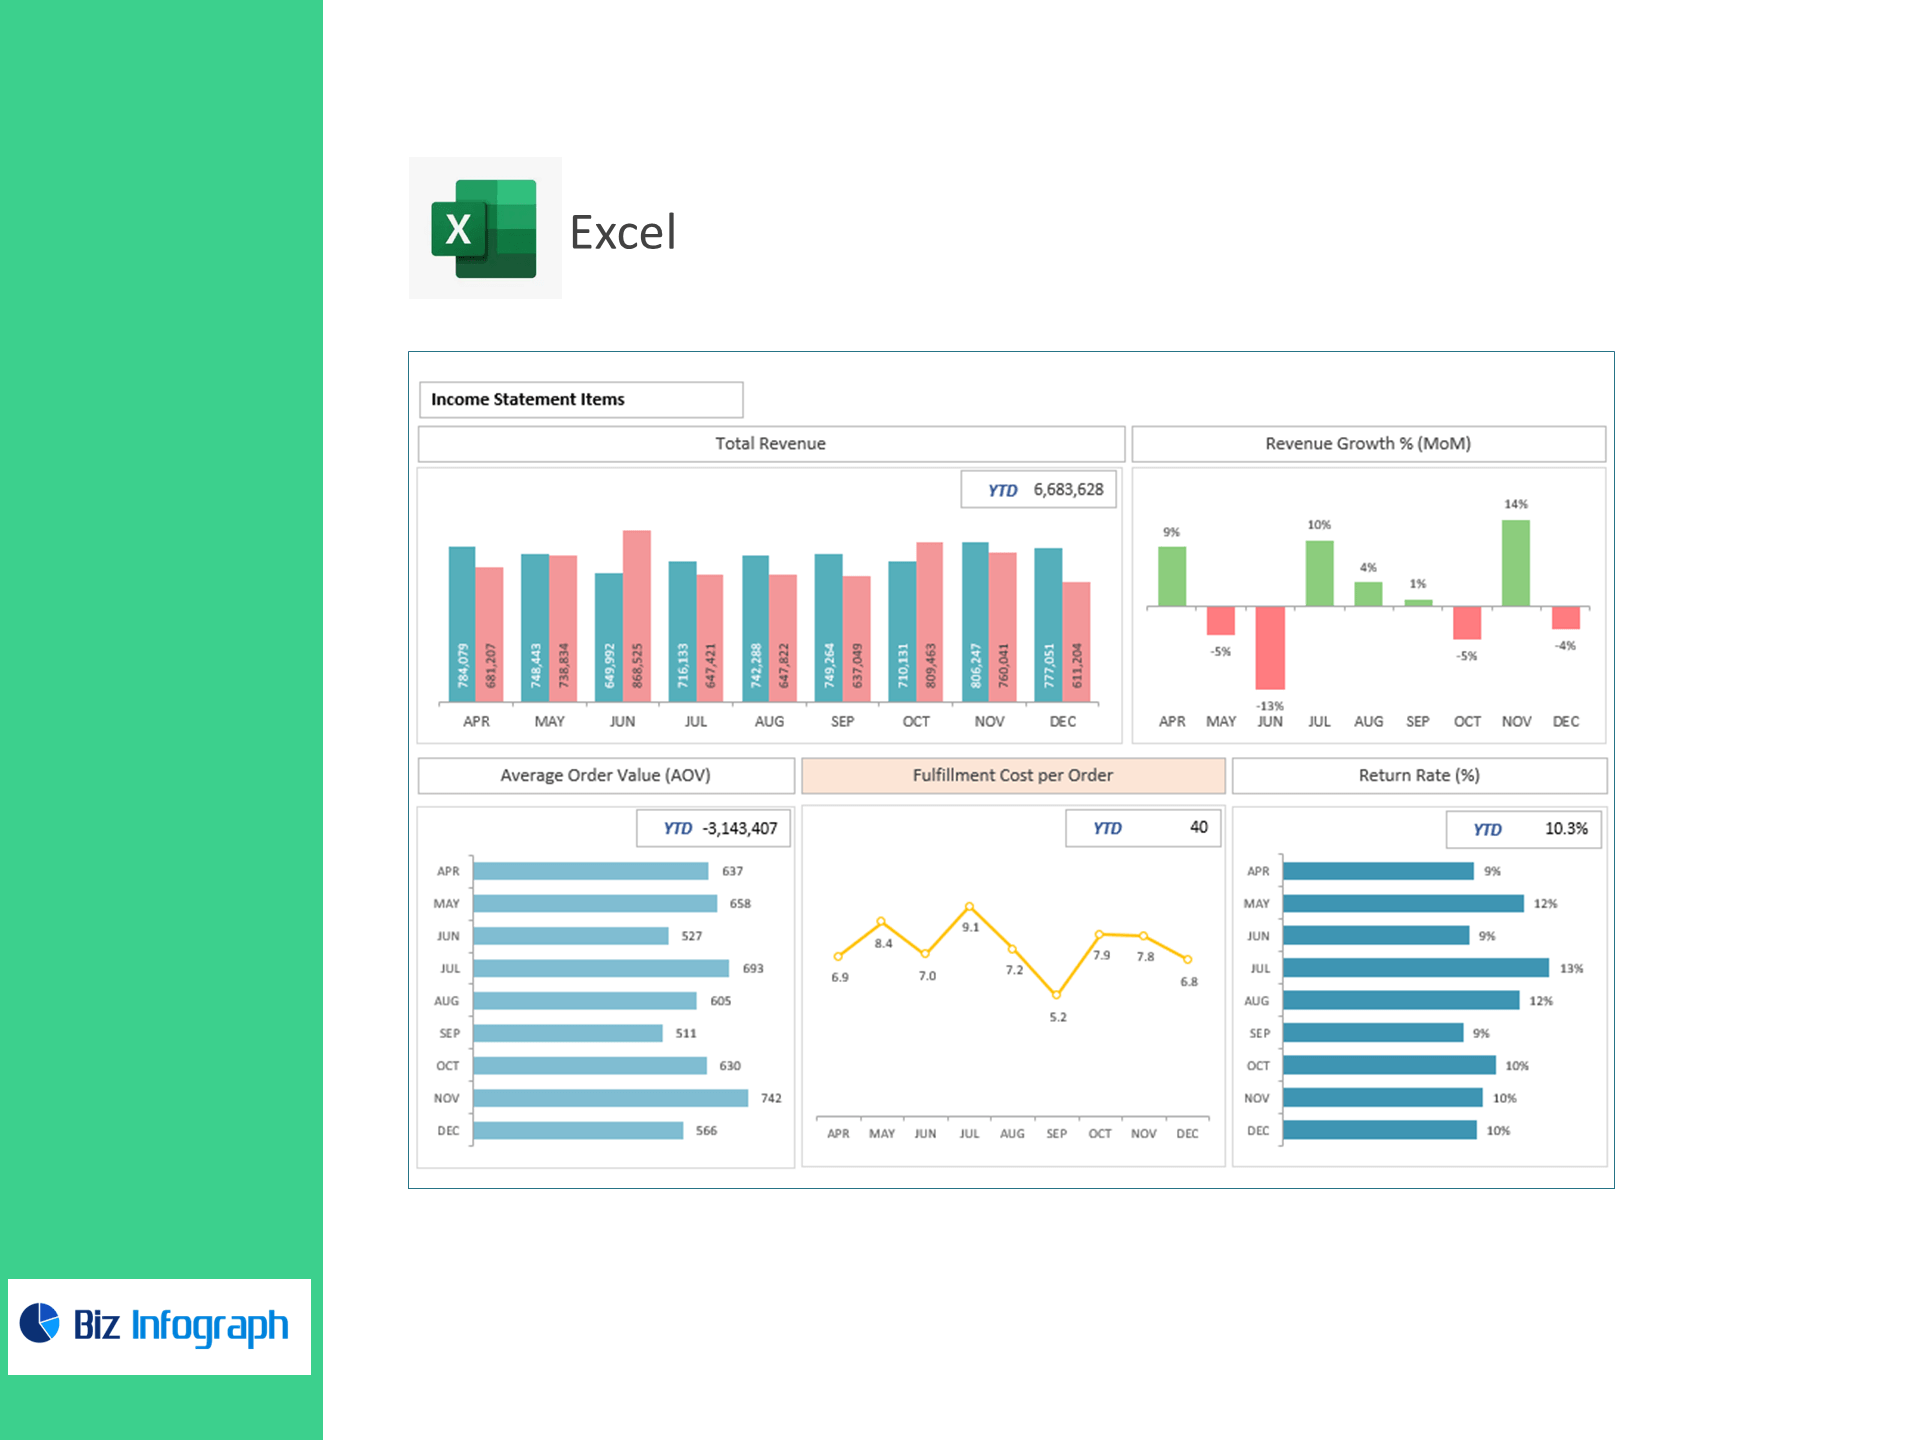
Total Revenue, Revenue Growth % (MoM)
-
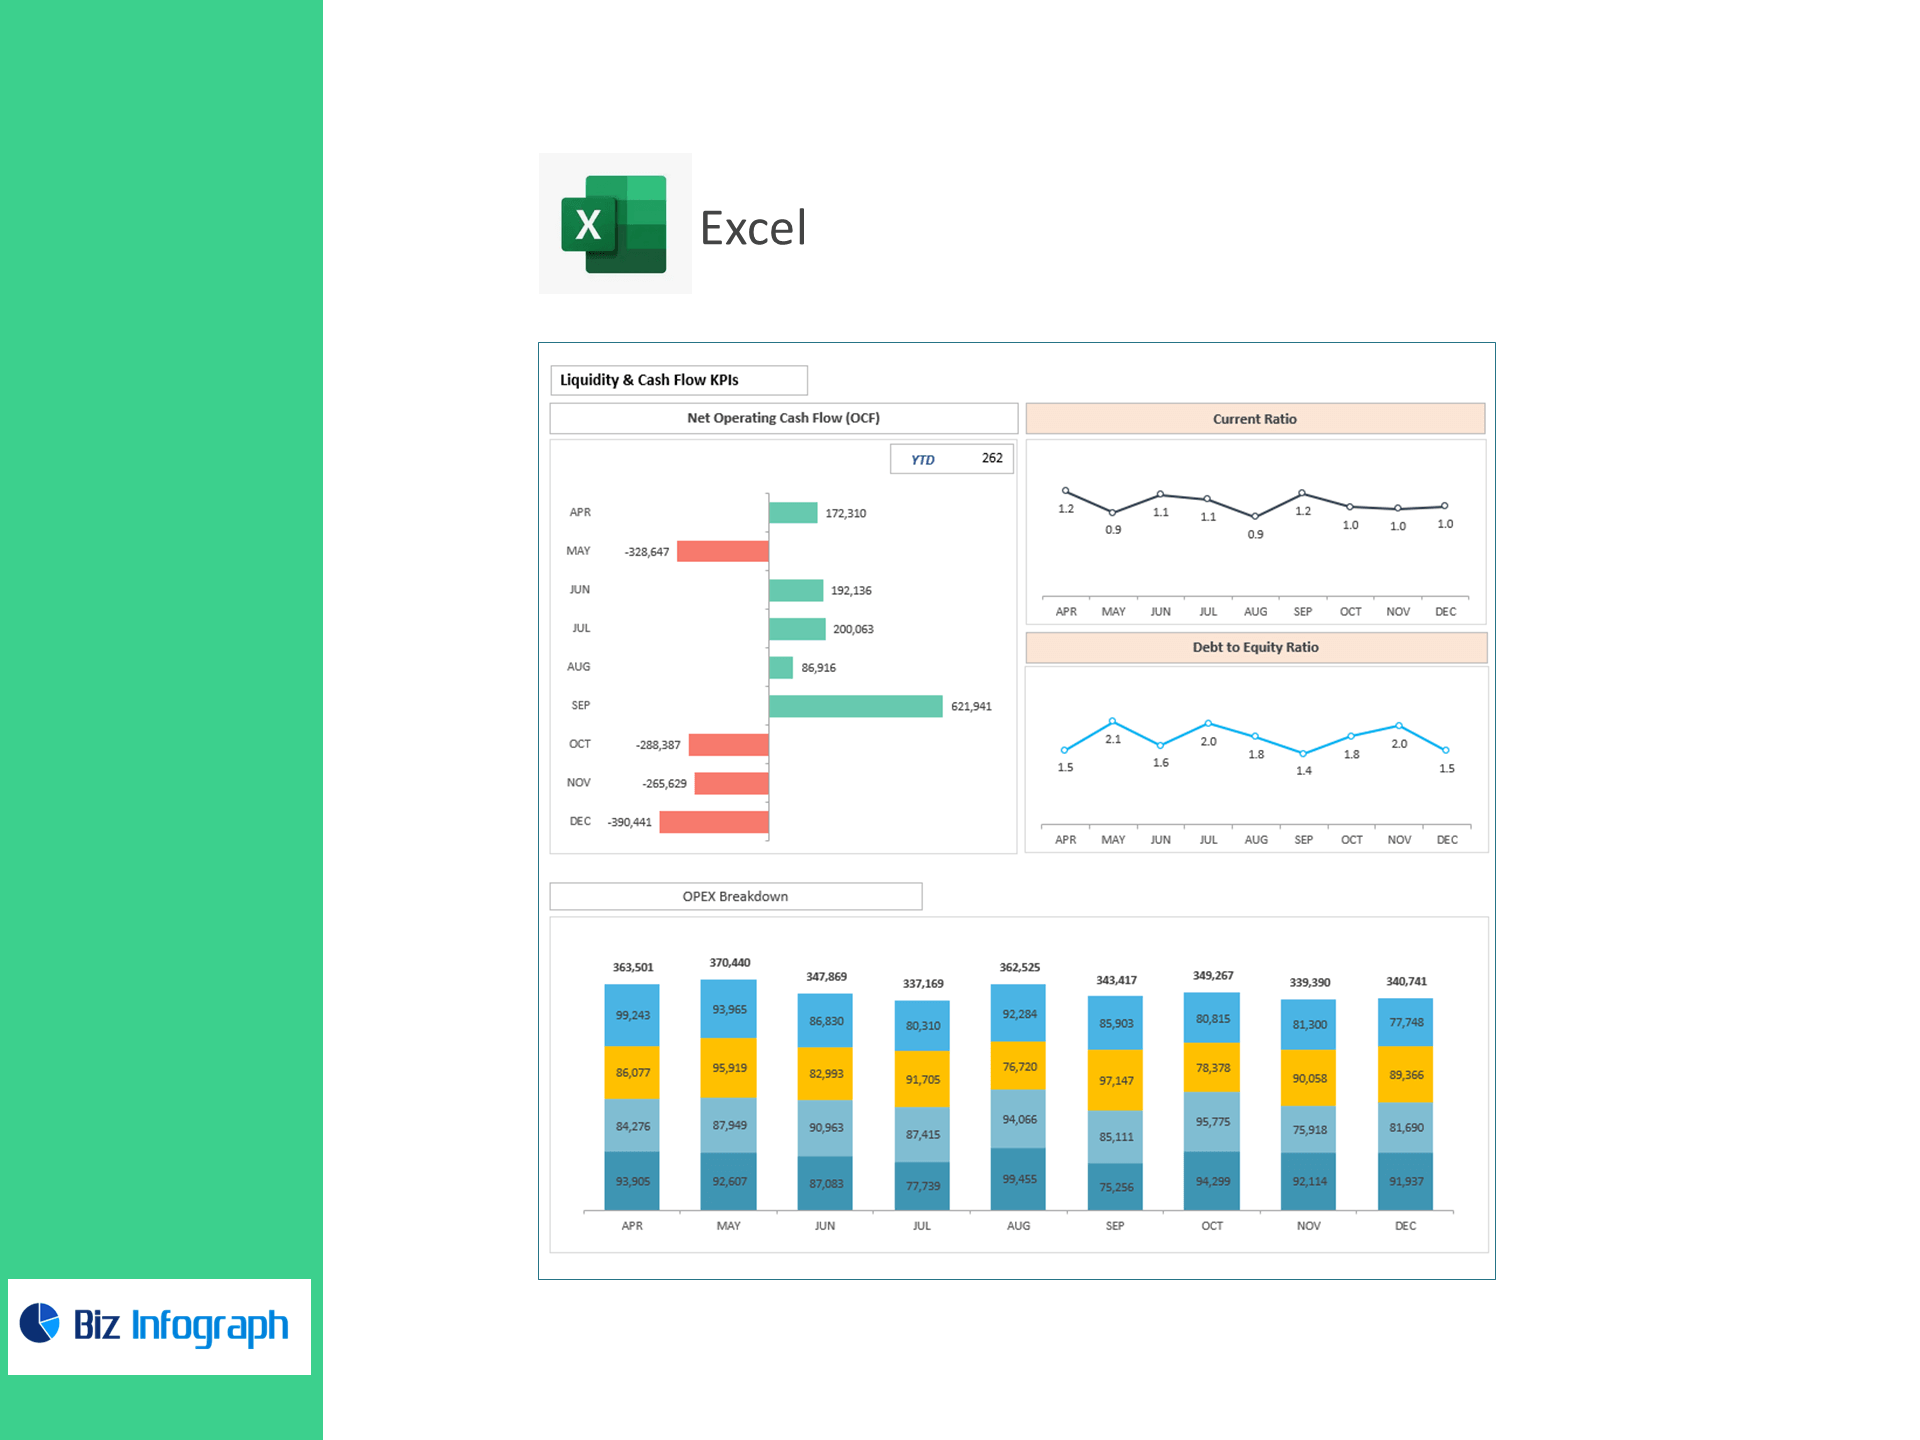
COGS, Gross Profit, Employee/Admin/Selling/Marketing → Total OPEX (+ breakdown)
-
Depreciation & Amortization, Operating Profit (EBIT), EBITDA, Interest, Other Inc/(Exp), Taxes, Net Profit
-
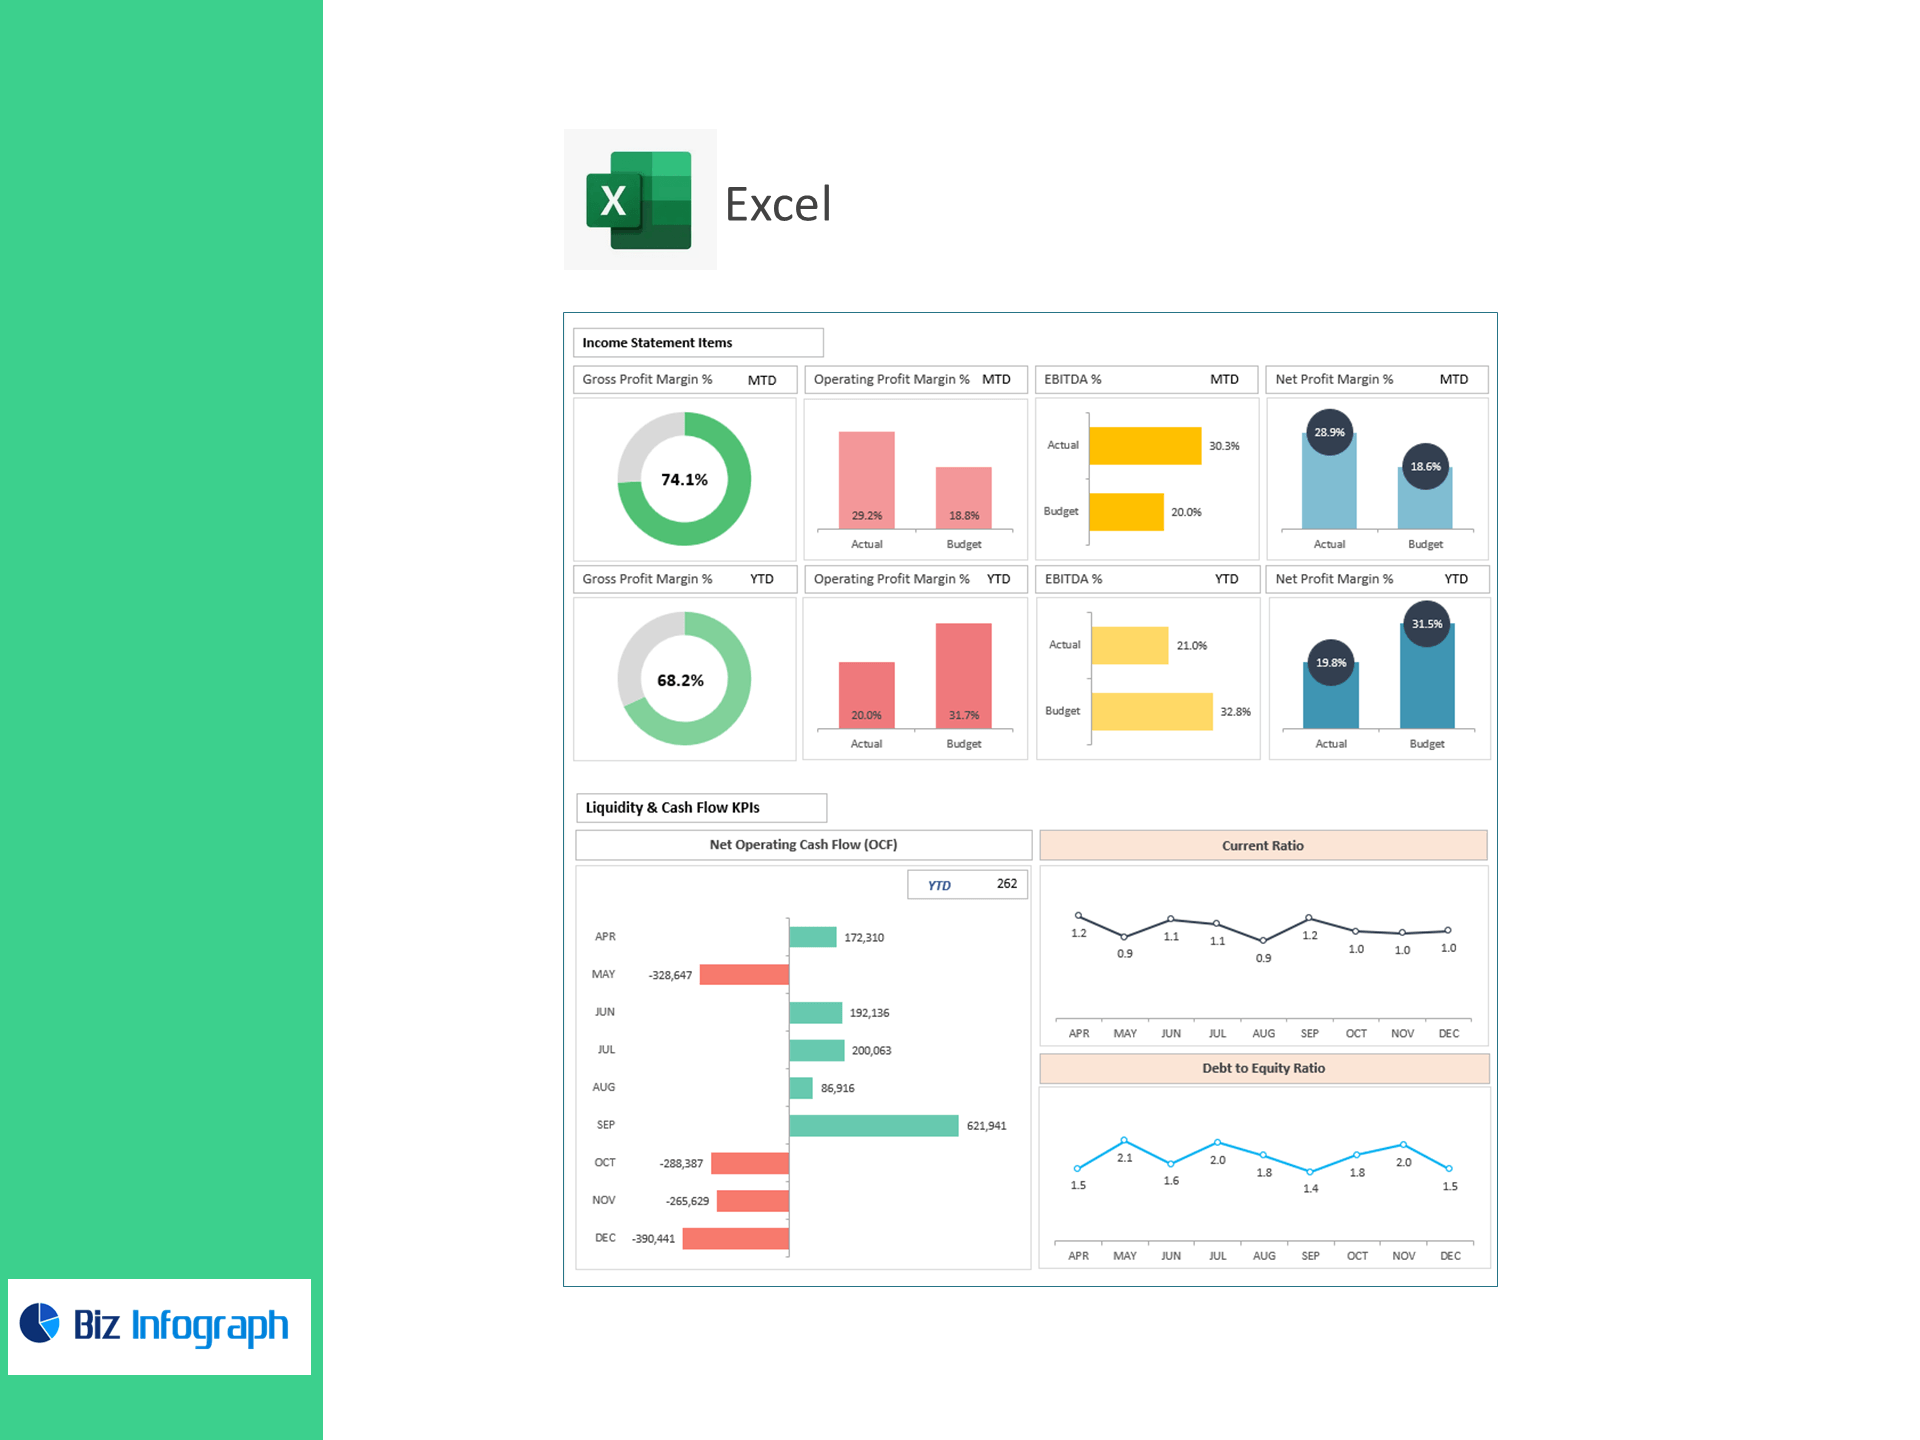
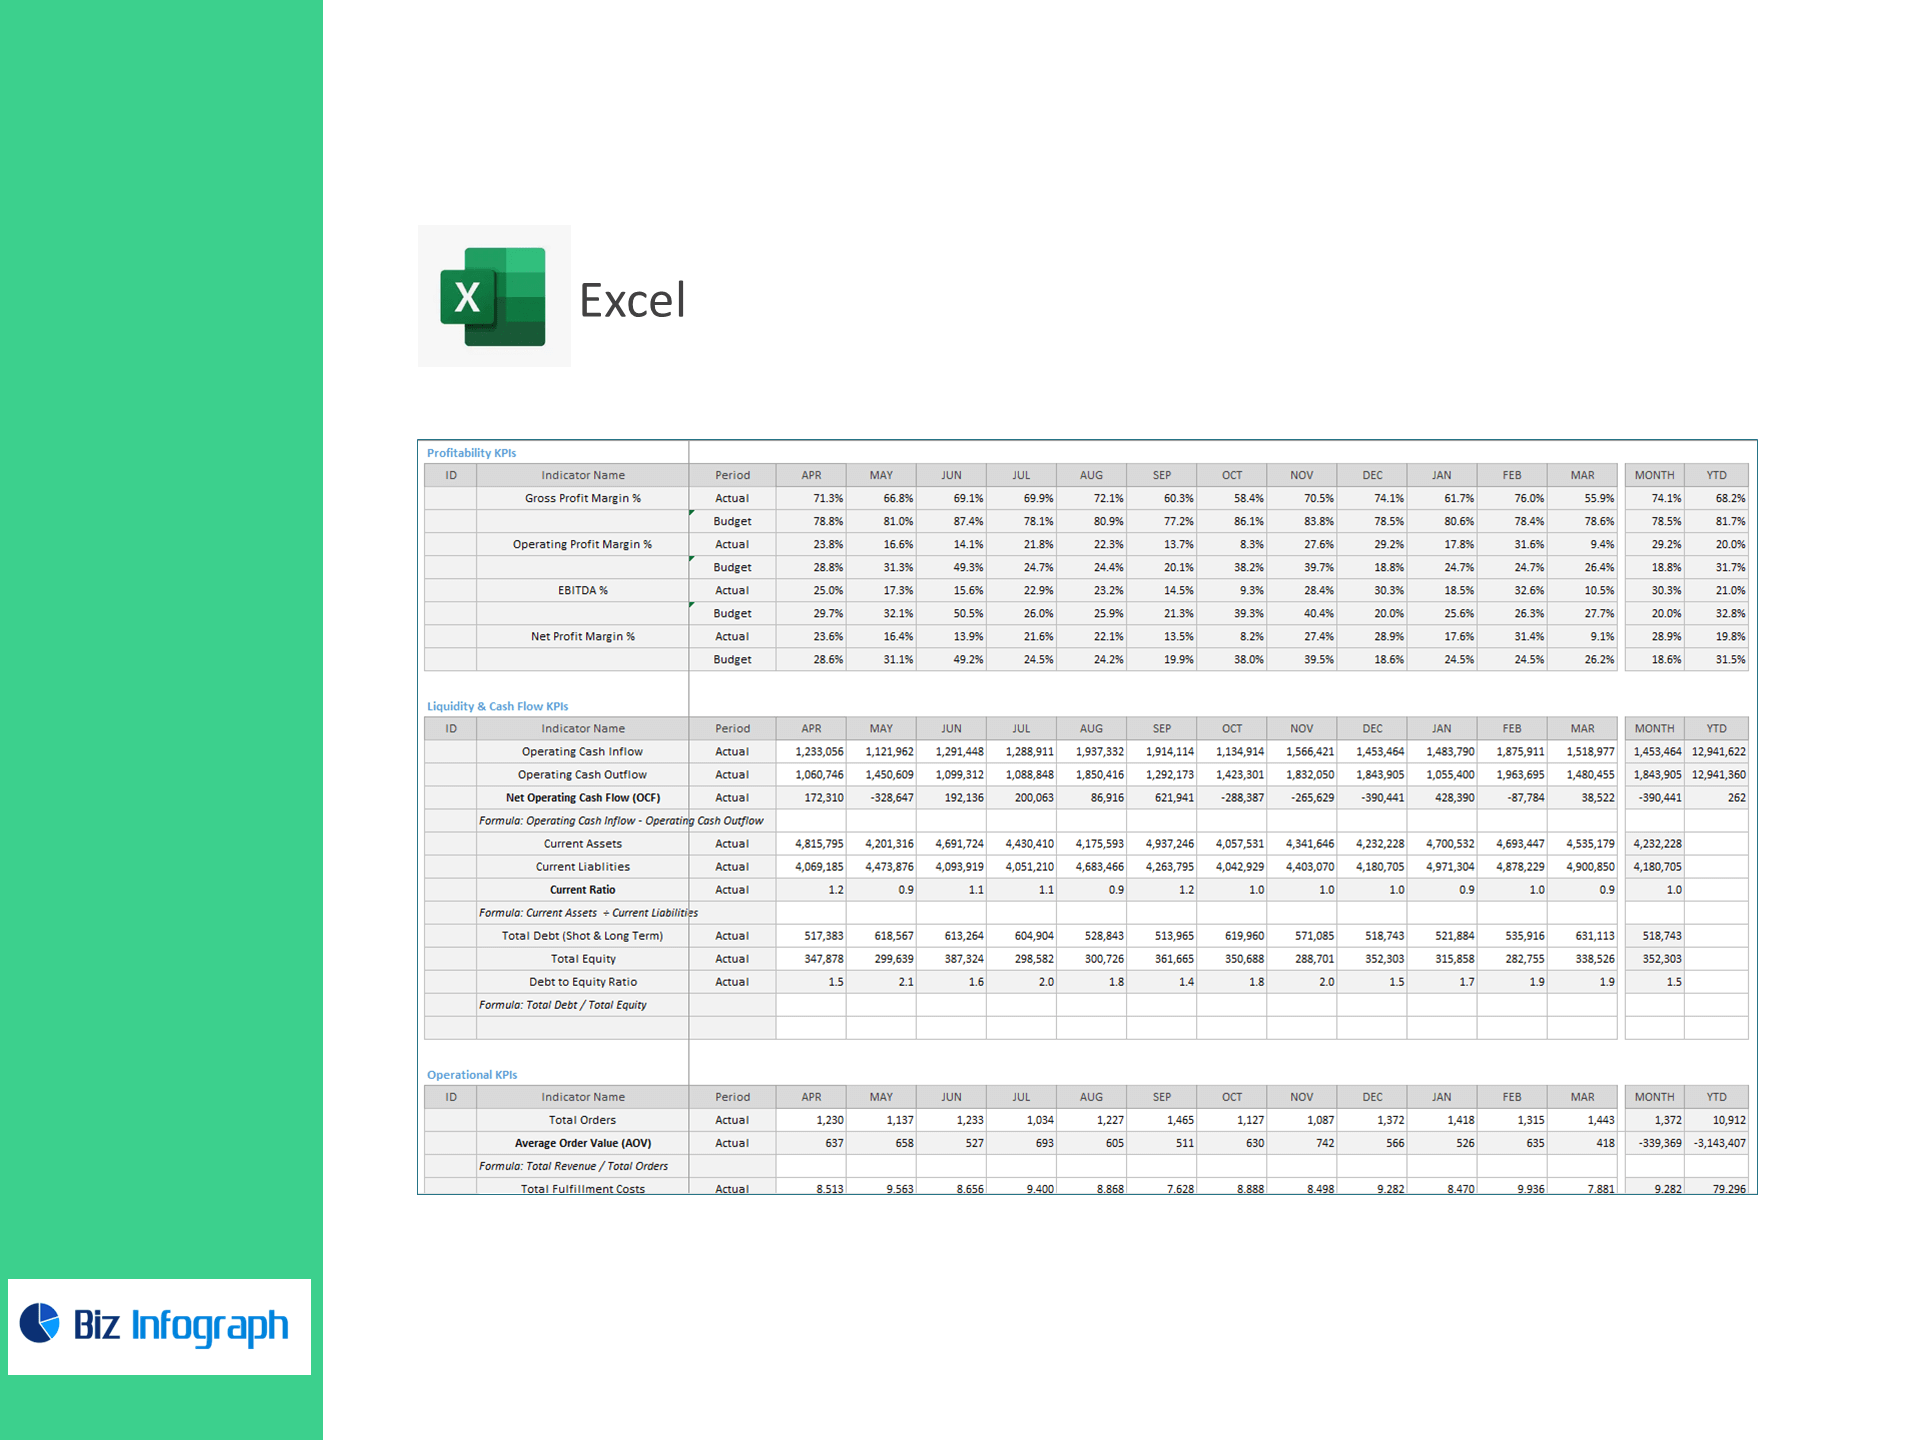
Gross Profit Margin %, Operating Profit Margin %, EBITDA %, Net Profit Margin %
Liquidity & Cash Flow
-
Operating Cash Inflow/Outflow → Net Operating Cash Flow (OCF) = Inflow − Outflow
-
Current Ratio = Current Assets ÷ Current Liabilities
-
Debt-to-Equity = Total Debt ÷ Total Equity
E-commerce Unit Economics
-
Average Order Value (AOV) = Total Revenue ÷ Total Orders
-
Fulfillment Cost per Order (FCPO) = Total Fulfillment Costs ÷ Total Orders
-
Return Rate (%) = Returned Orders ÷ Total Orders × 100
What’s inside
-
Executive Dashboard: Tiles for Revenue Growth, GP/EBIT/EBITDA/Net Profit, OCF, Current Ratio, D/E, AOV, FCPO, and Returns with trends & variance to target.
-
OPEX & Cost Analyzer: Drill into picking/packing, shipping, CX, and marketing spend.
-
Order Economics View: Track unit economics by channel, region, or product line.
-
Cash & Leverage Panel: Liquidity and debt health at a glance.
-
Targets & Assumptions: Set KPI targets; automatic Above/Below Target highlighting.
-
Clean Data Sheets: Import-ready tables for IS, Cash Flow, Balance Sheet, Orders, Returns, and Fulfillment Costs.
How it works
-
Paste your monthly exports (storefront, payment processor, 3PL, accounting).
-
Set targets for margins, OCF, and returns.
-
Review visuals to optimize pricing, shipping, and inventory strategy.
Benefits
-
Improve margins: Spot OPEX creep and shipping cost leaks early.
-
Protect cash: Monitor OCF, Current Ratio, and D/E while you scale.
-
Tune CX & policy: Balance AOV and Return Rate for profitable growth.
-
Decide faster: Board-ready visuals with transparent formulas.
For ready-to-use Dashboard Templates: