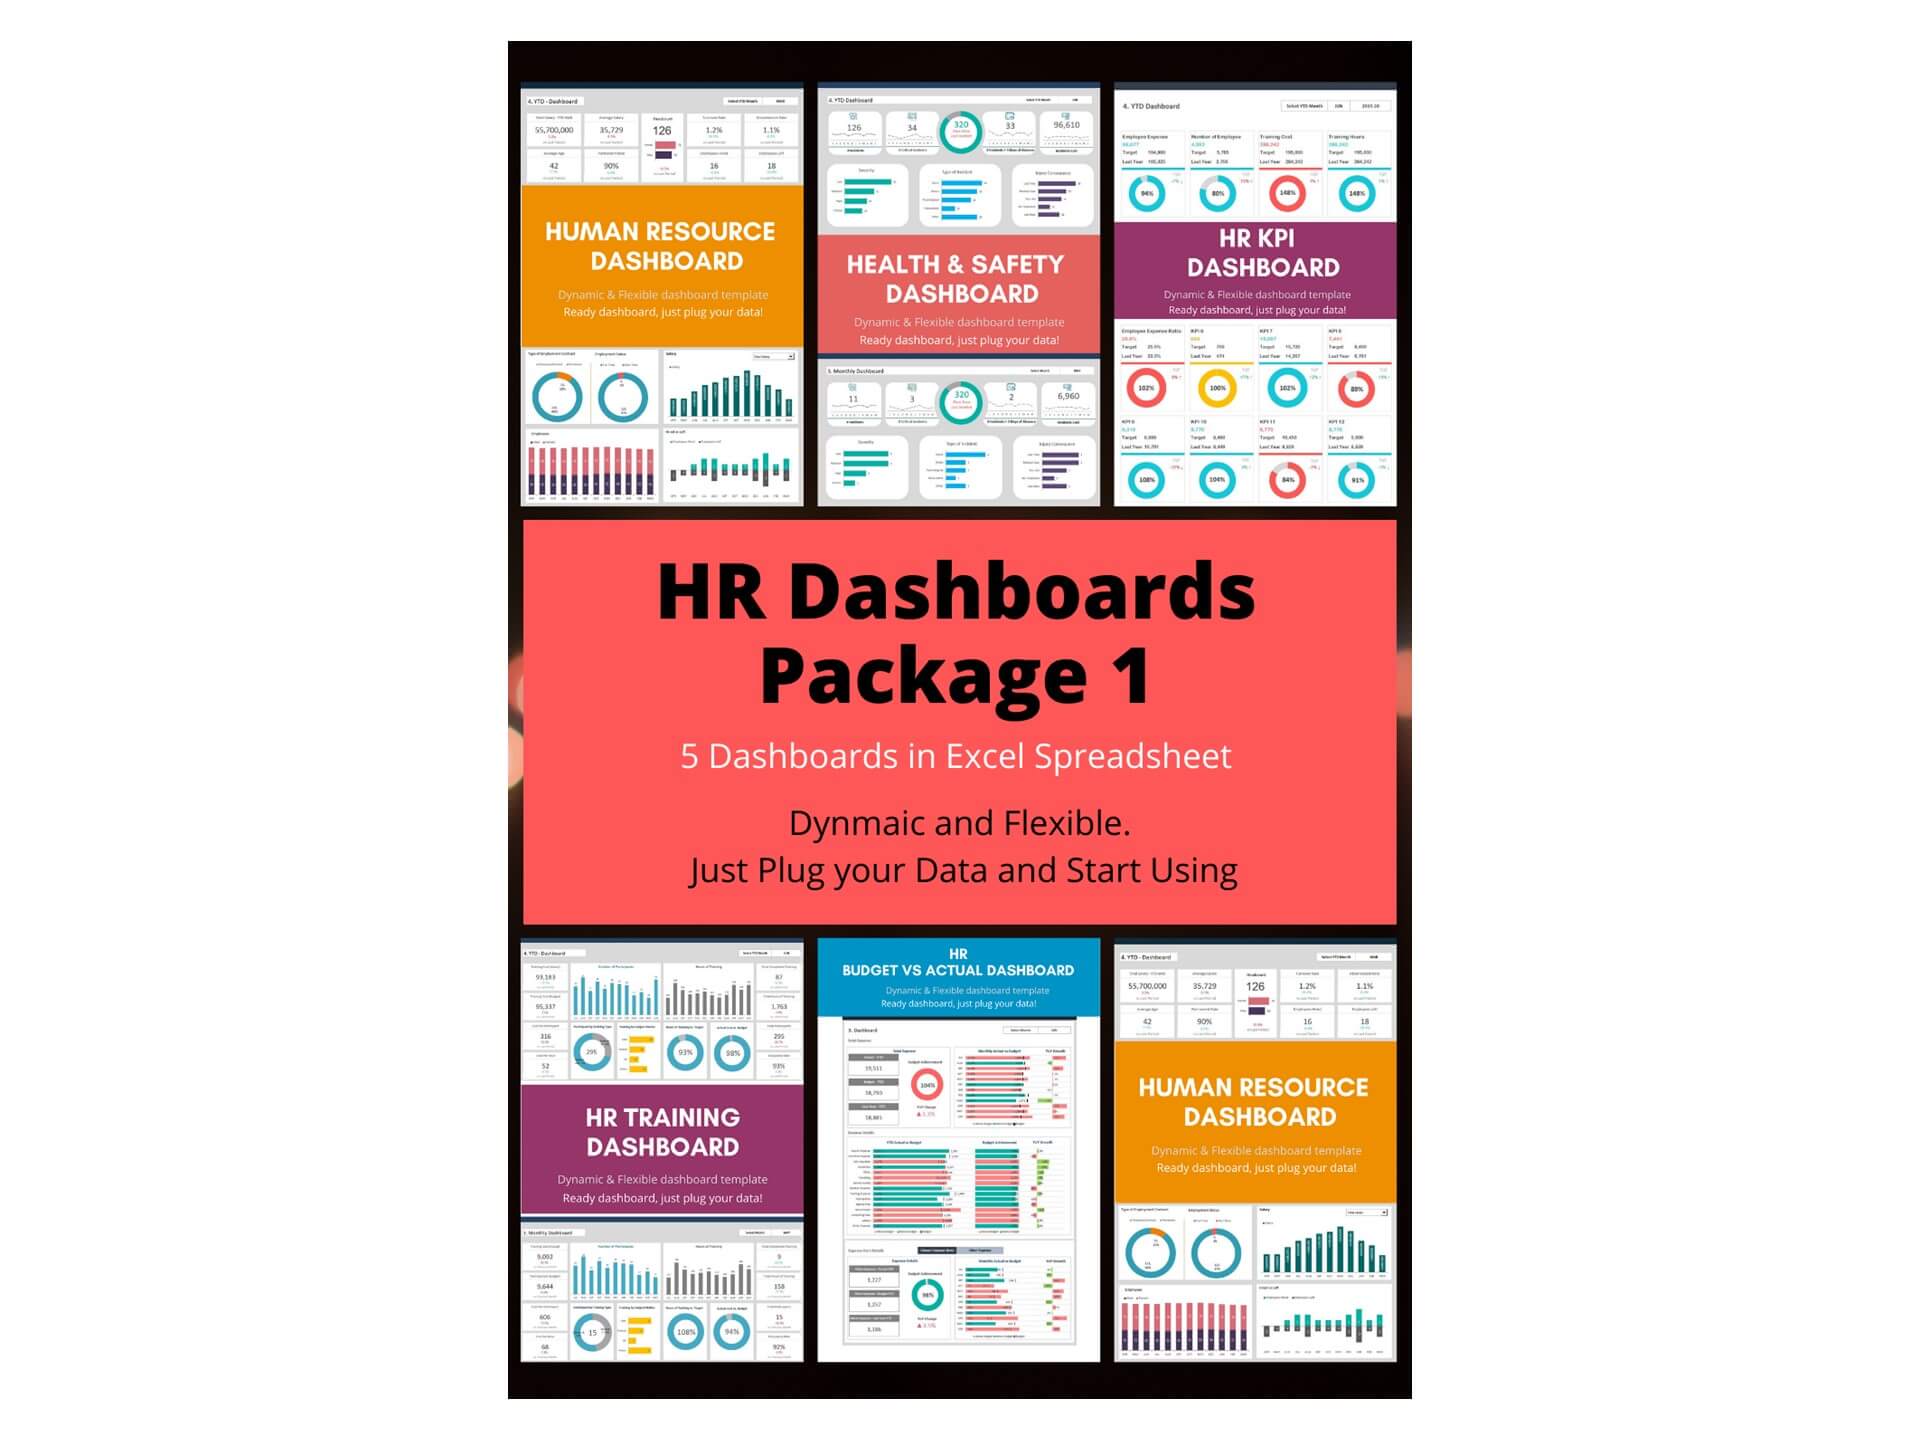
HR Health and Safety Dashboard Excel Template and Google Sheets
HR Health and Safety Dashboard Template is an Excel spreadsheet (Health and Saftey Dashboard Google Sheets) that is perfect for tracking important events in employee health and safety.
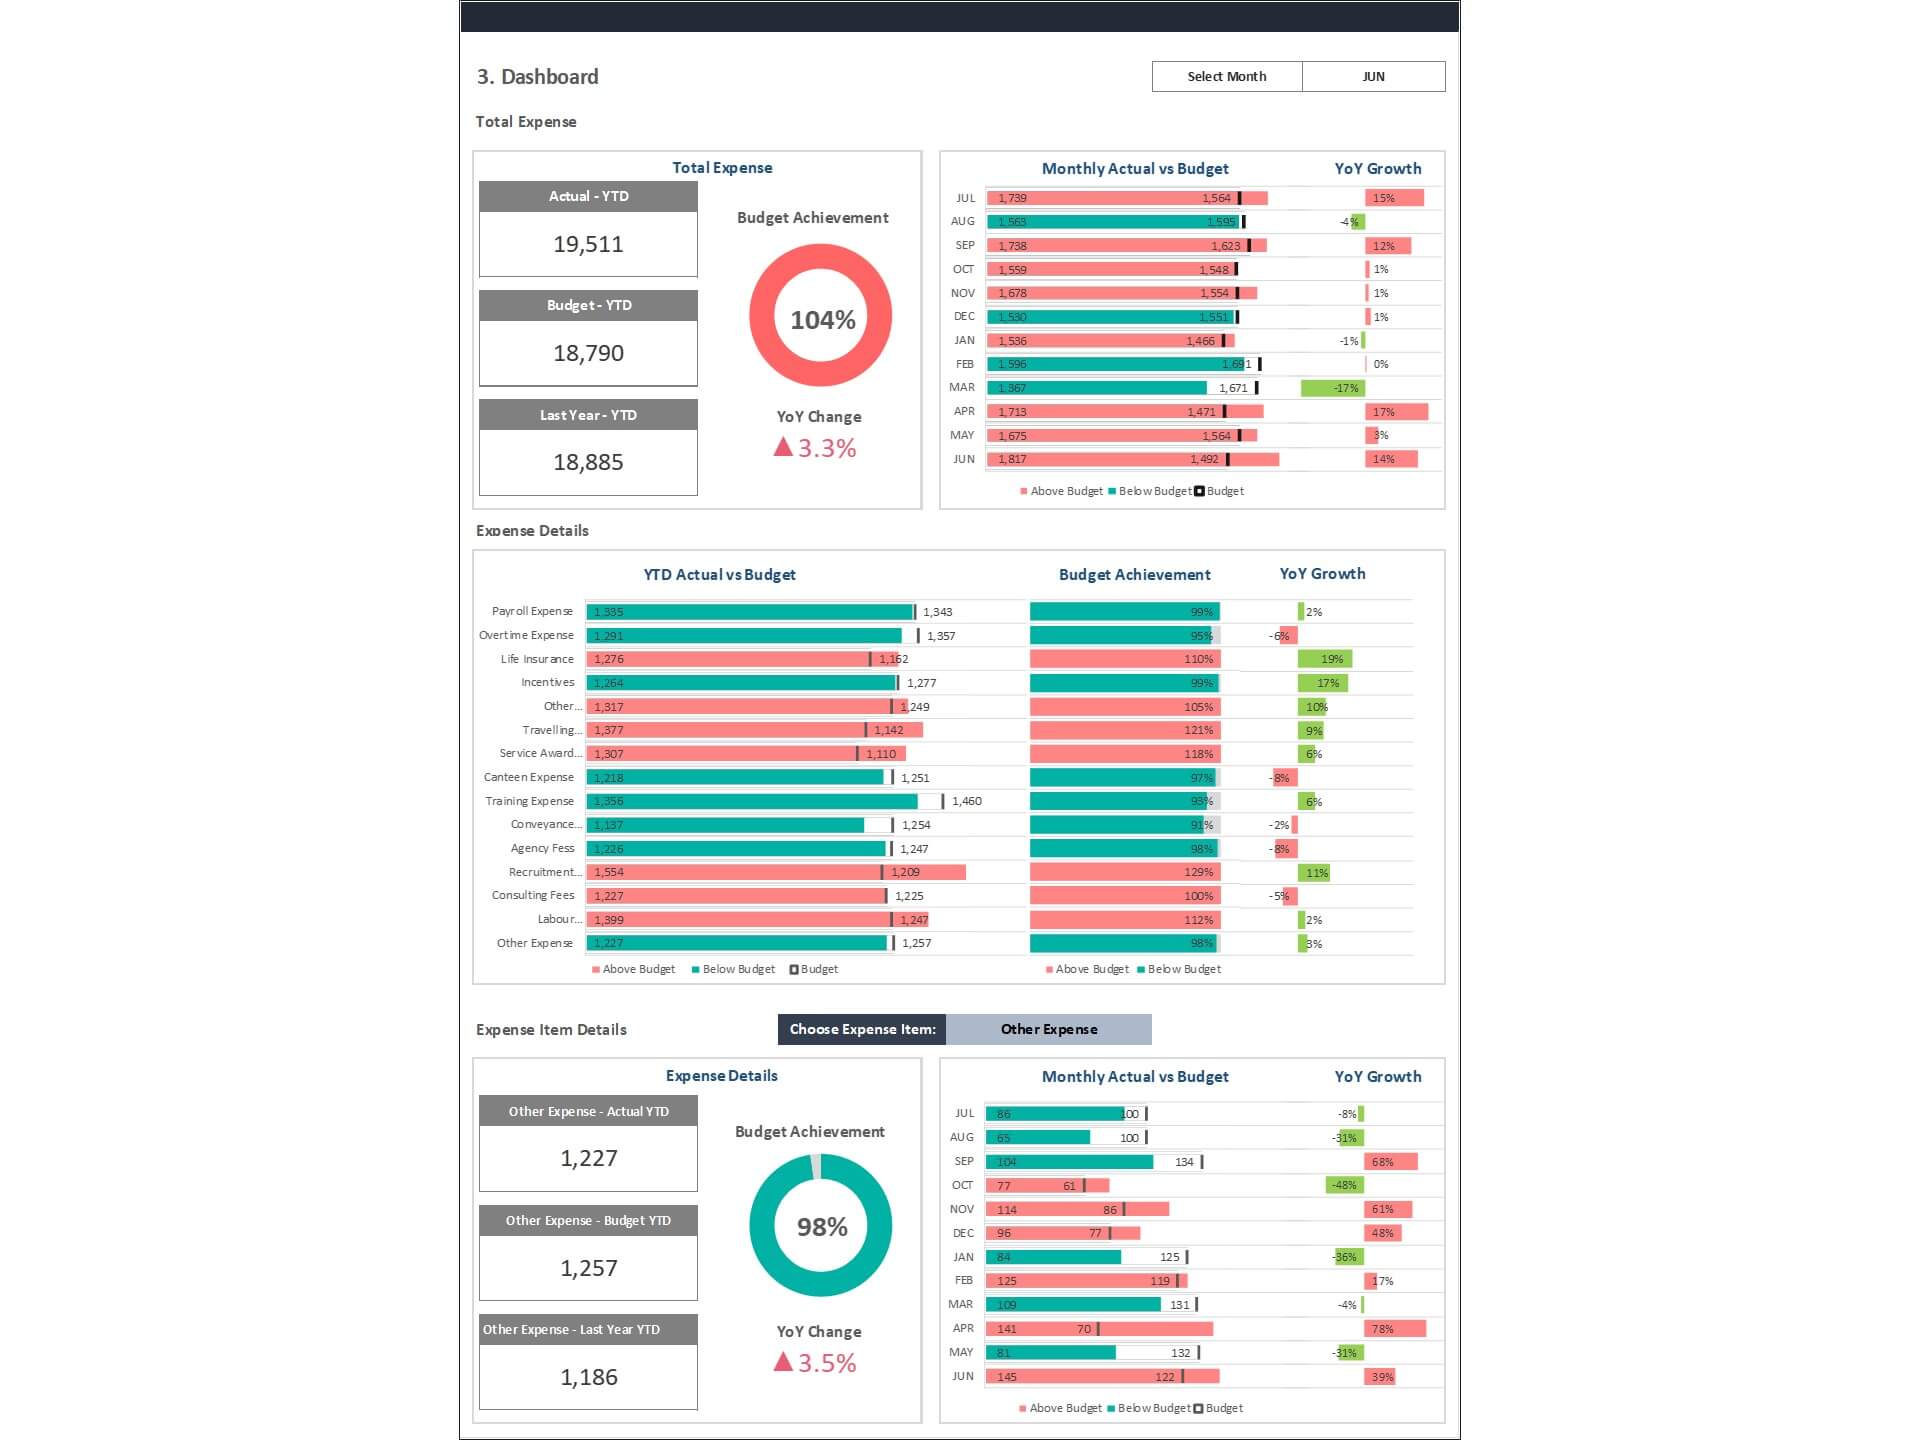
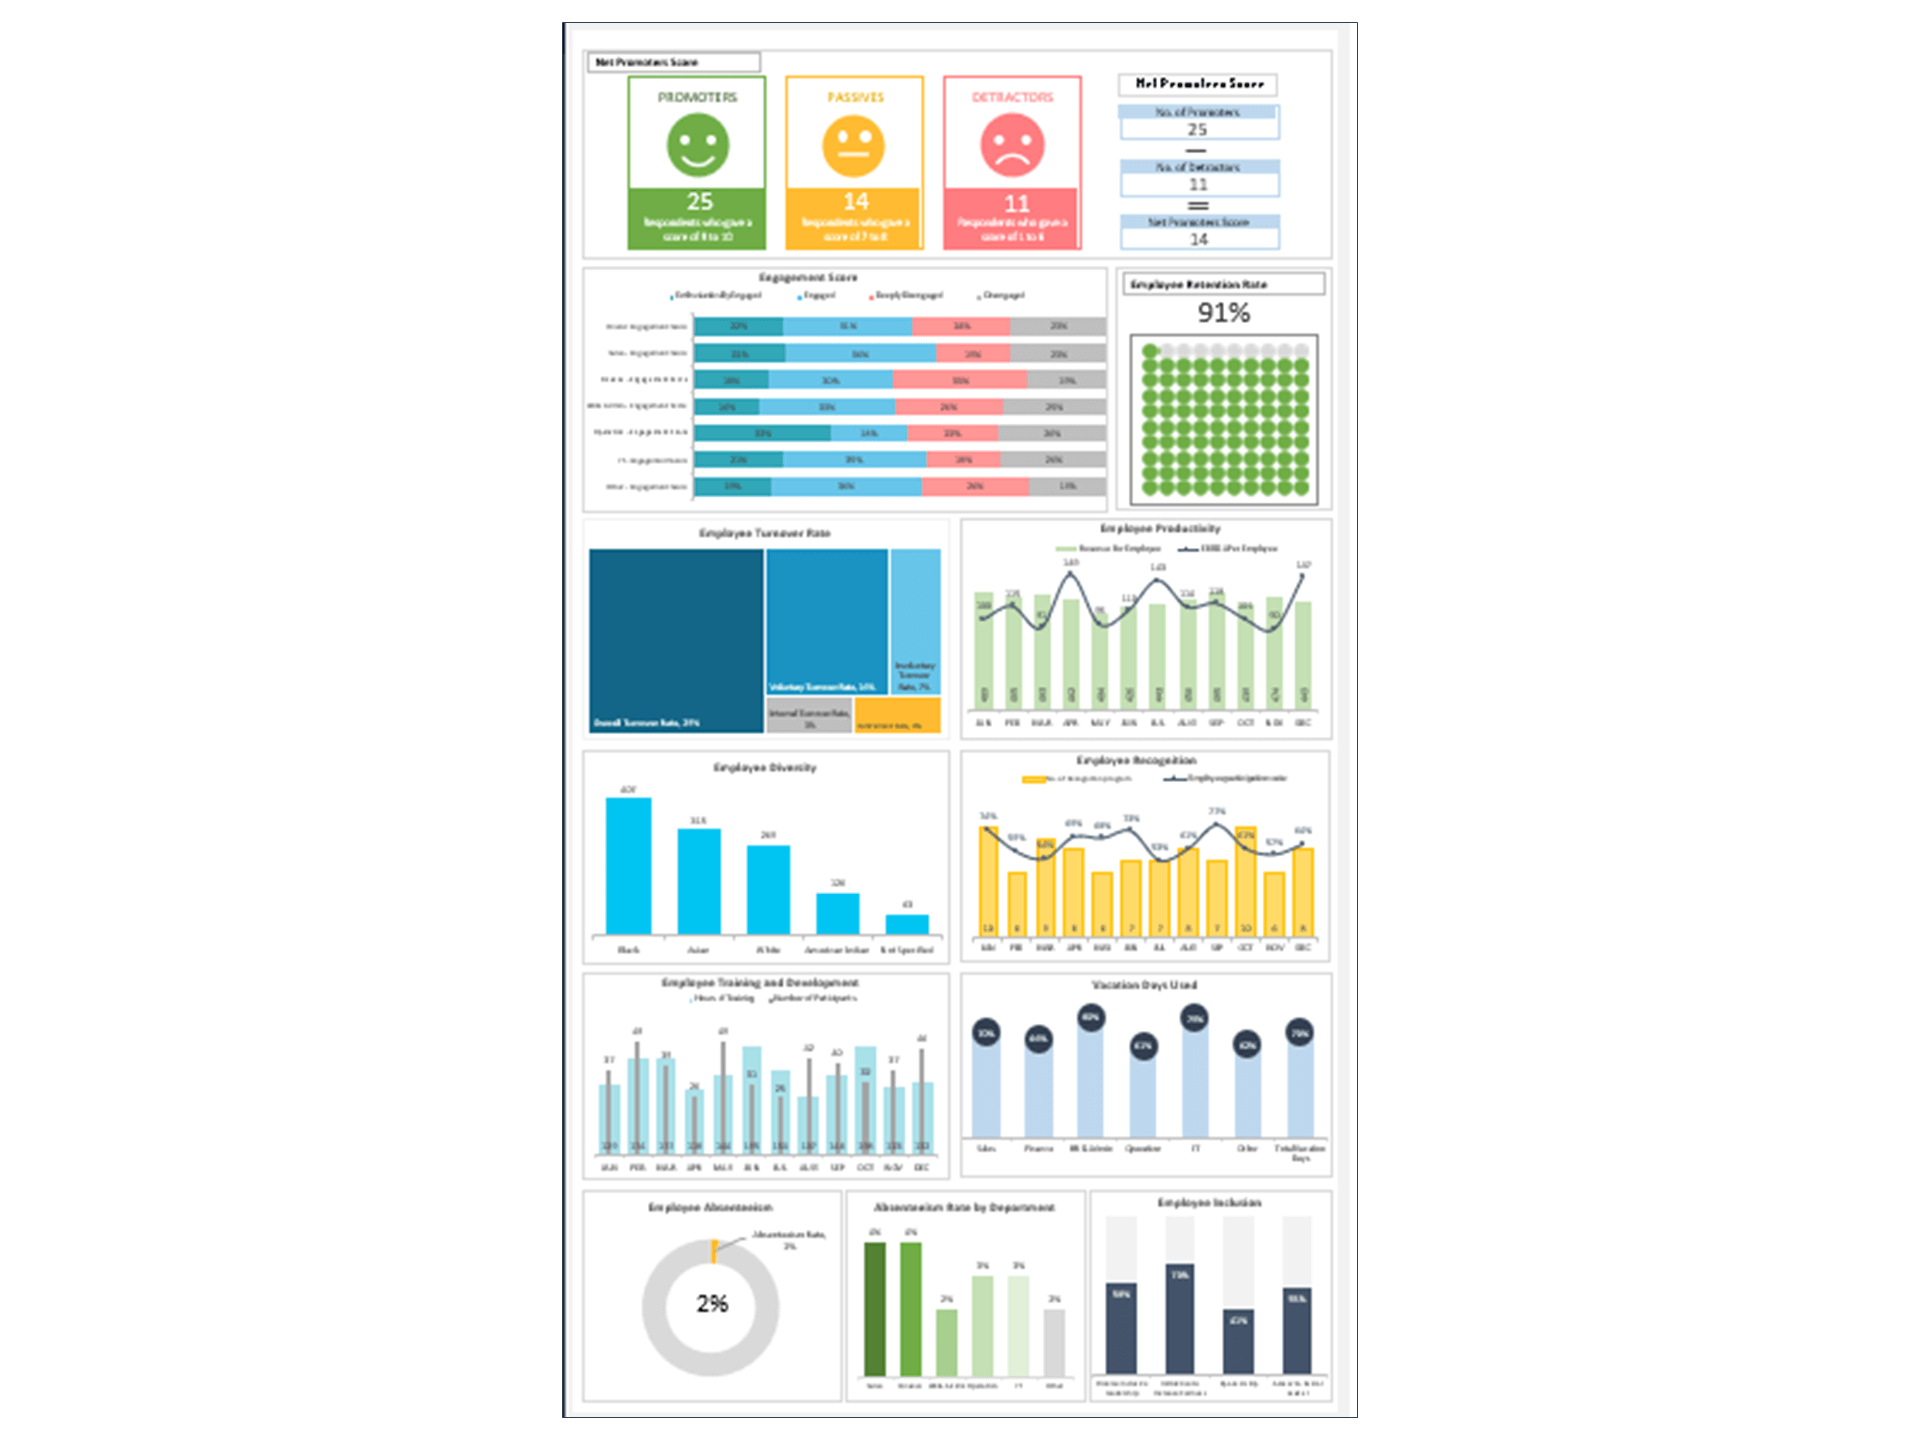
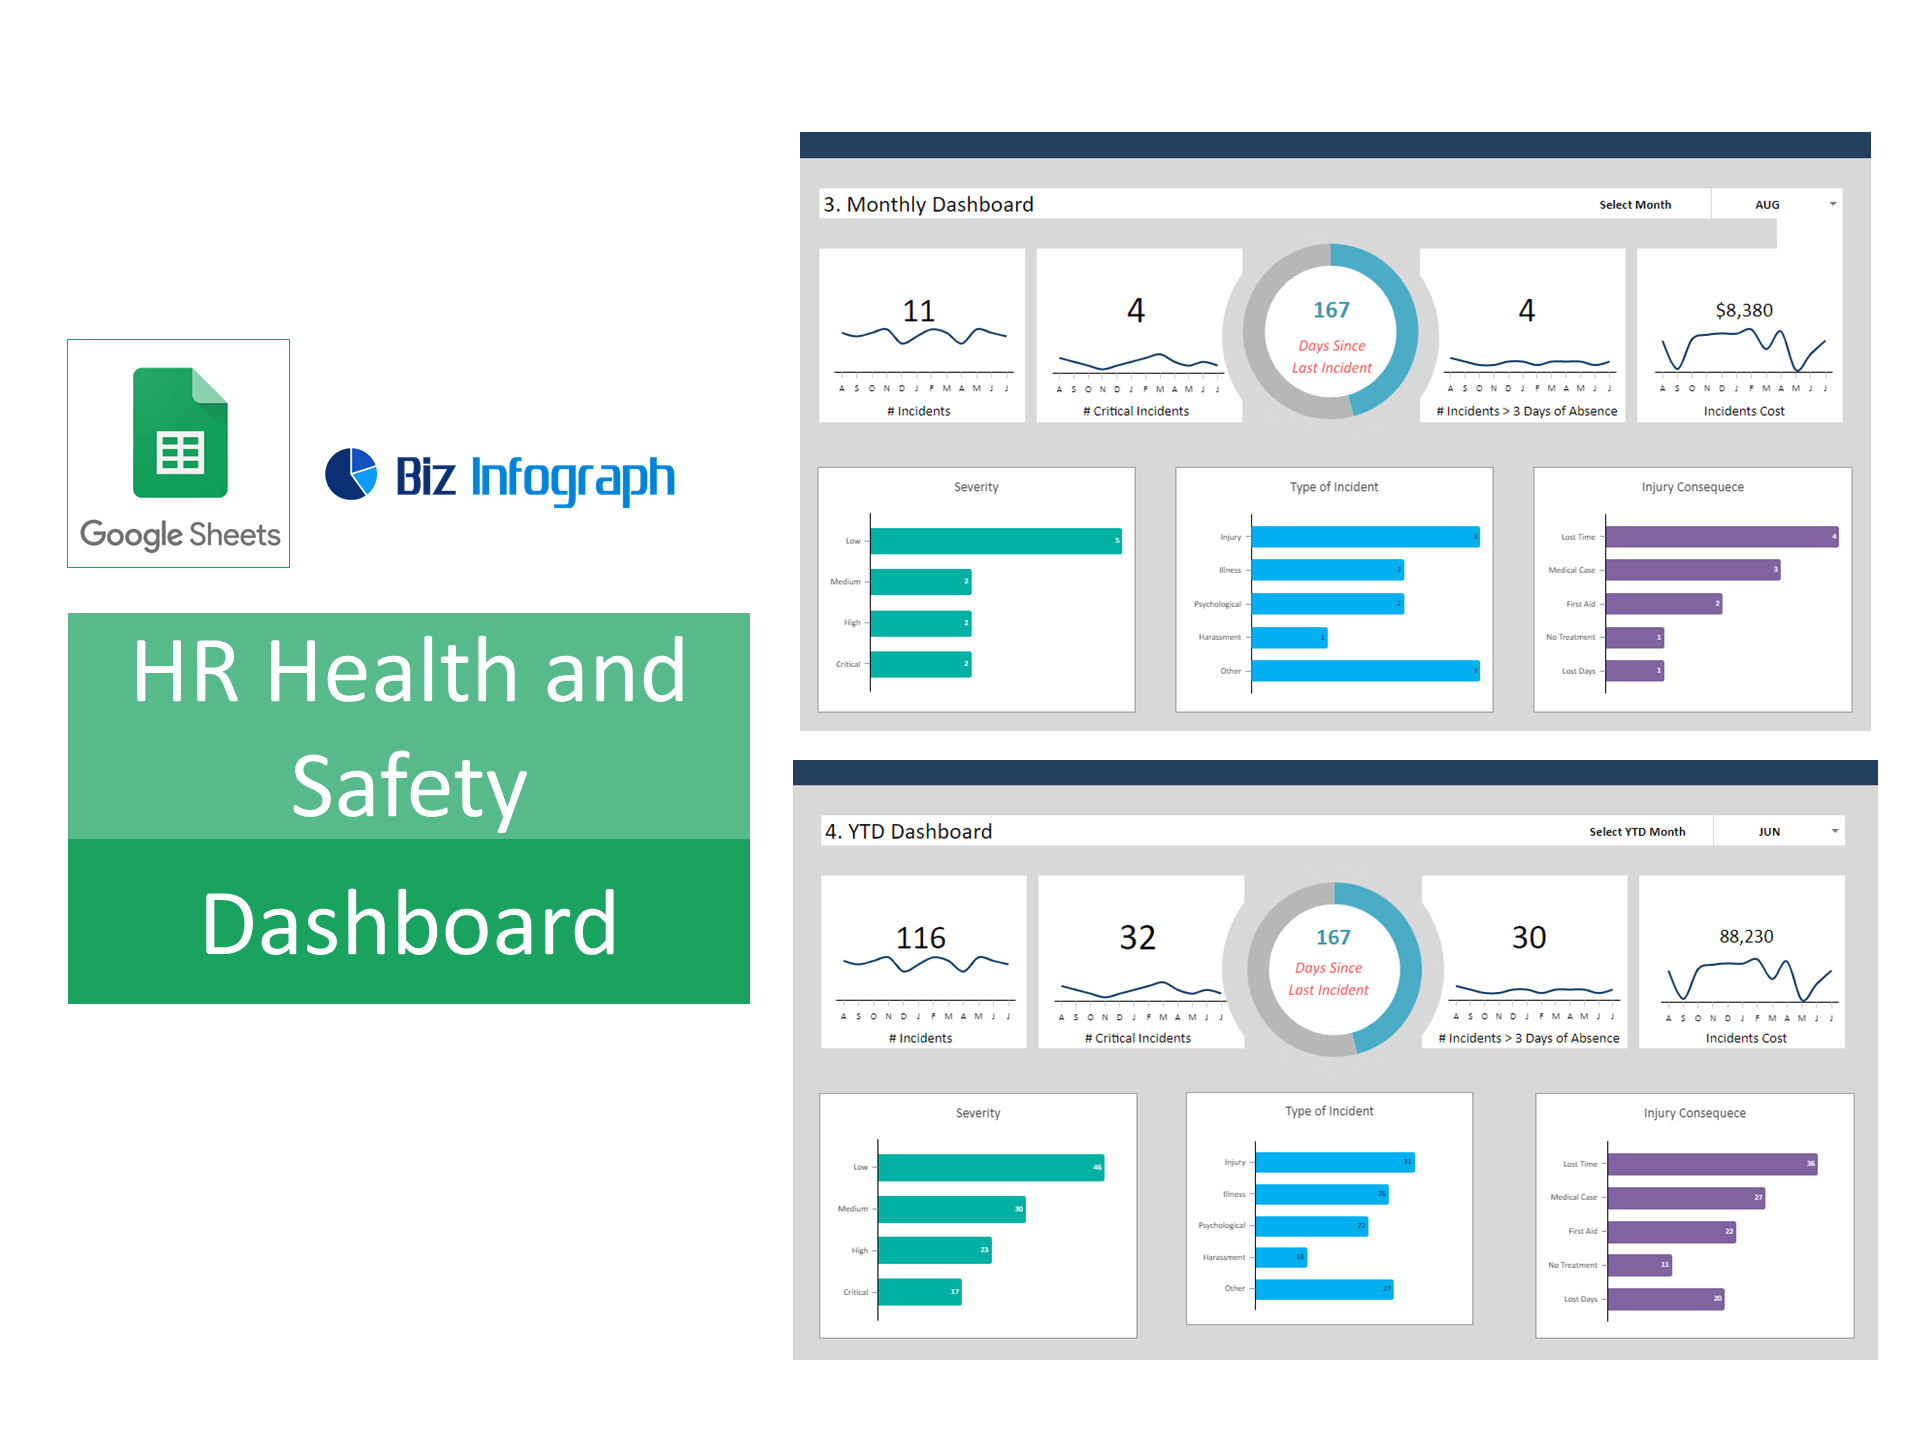
The HR Health and Safety Dashboard Excel Template is a practical tool designed to help organizations monitor workplace safety and manage employee well-being effectively. This HR Health and Safety Dashboard enables HR teams to track important safety metrics and ensure that the workplace meets required safety standards.
As part of a comprehensive Human Resource reporting system, the dashboard helps HR professionals monitor incidents, workplace injuries, safety training completion, and compliance indicators. By visualizing this information in a clear format, the template functions as a powerful HR Dashboard that supports proactive risk management.
The template also serves as an HR KPI Dashboard, allowing organizations to track key safety performance indicators such as incident frequency, lost workdays, safety training participation, and compliance levels. These insights help HR teams identify safety trends and take preventive actions to improve workplace conditions.
Overall, the Health and Safety dashboard provides valuable visibility into workplace risks and supports organizations in building a safer and more responsible work environment.
Core Elements of a Health and Safety Dashboard
Defining Key Safety Metrics and KPIs
Essential safety metrics and KPIs form the backbone of an effective health and safety dashboard. Metrics like injury rates, incident frequencies, near misses, and compliance rates provide crucial insights into workplace safety conditions. These KPIs help organizations track their safety performance over time, highlighting areas that require immediate attention and areas where they excel. Incorporating these metrics into a safety dashboard enables businesses to establish benchmarks, set safety goals, and measure progress towards these objectives systematically, fostering a safer work environment.
Designing Your Safety Dashboard Template
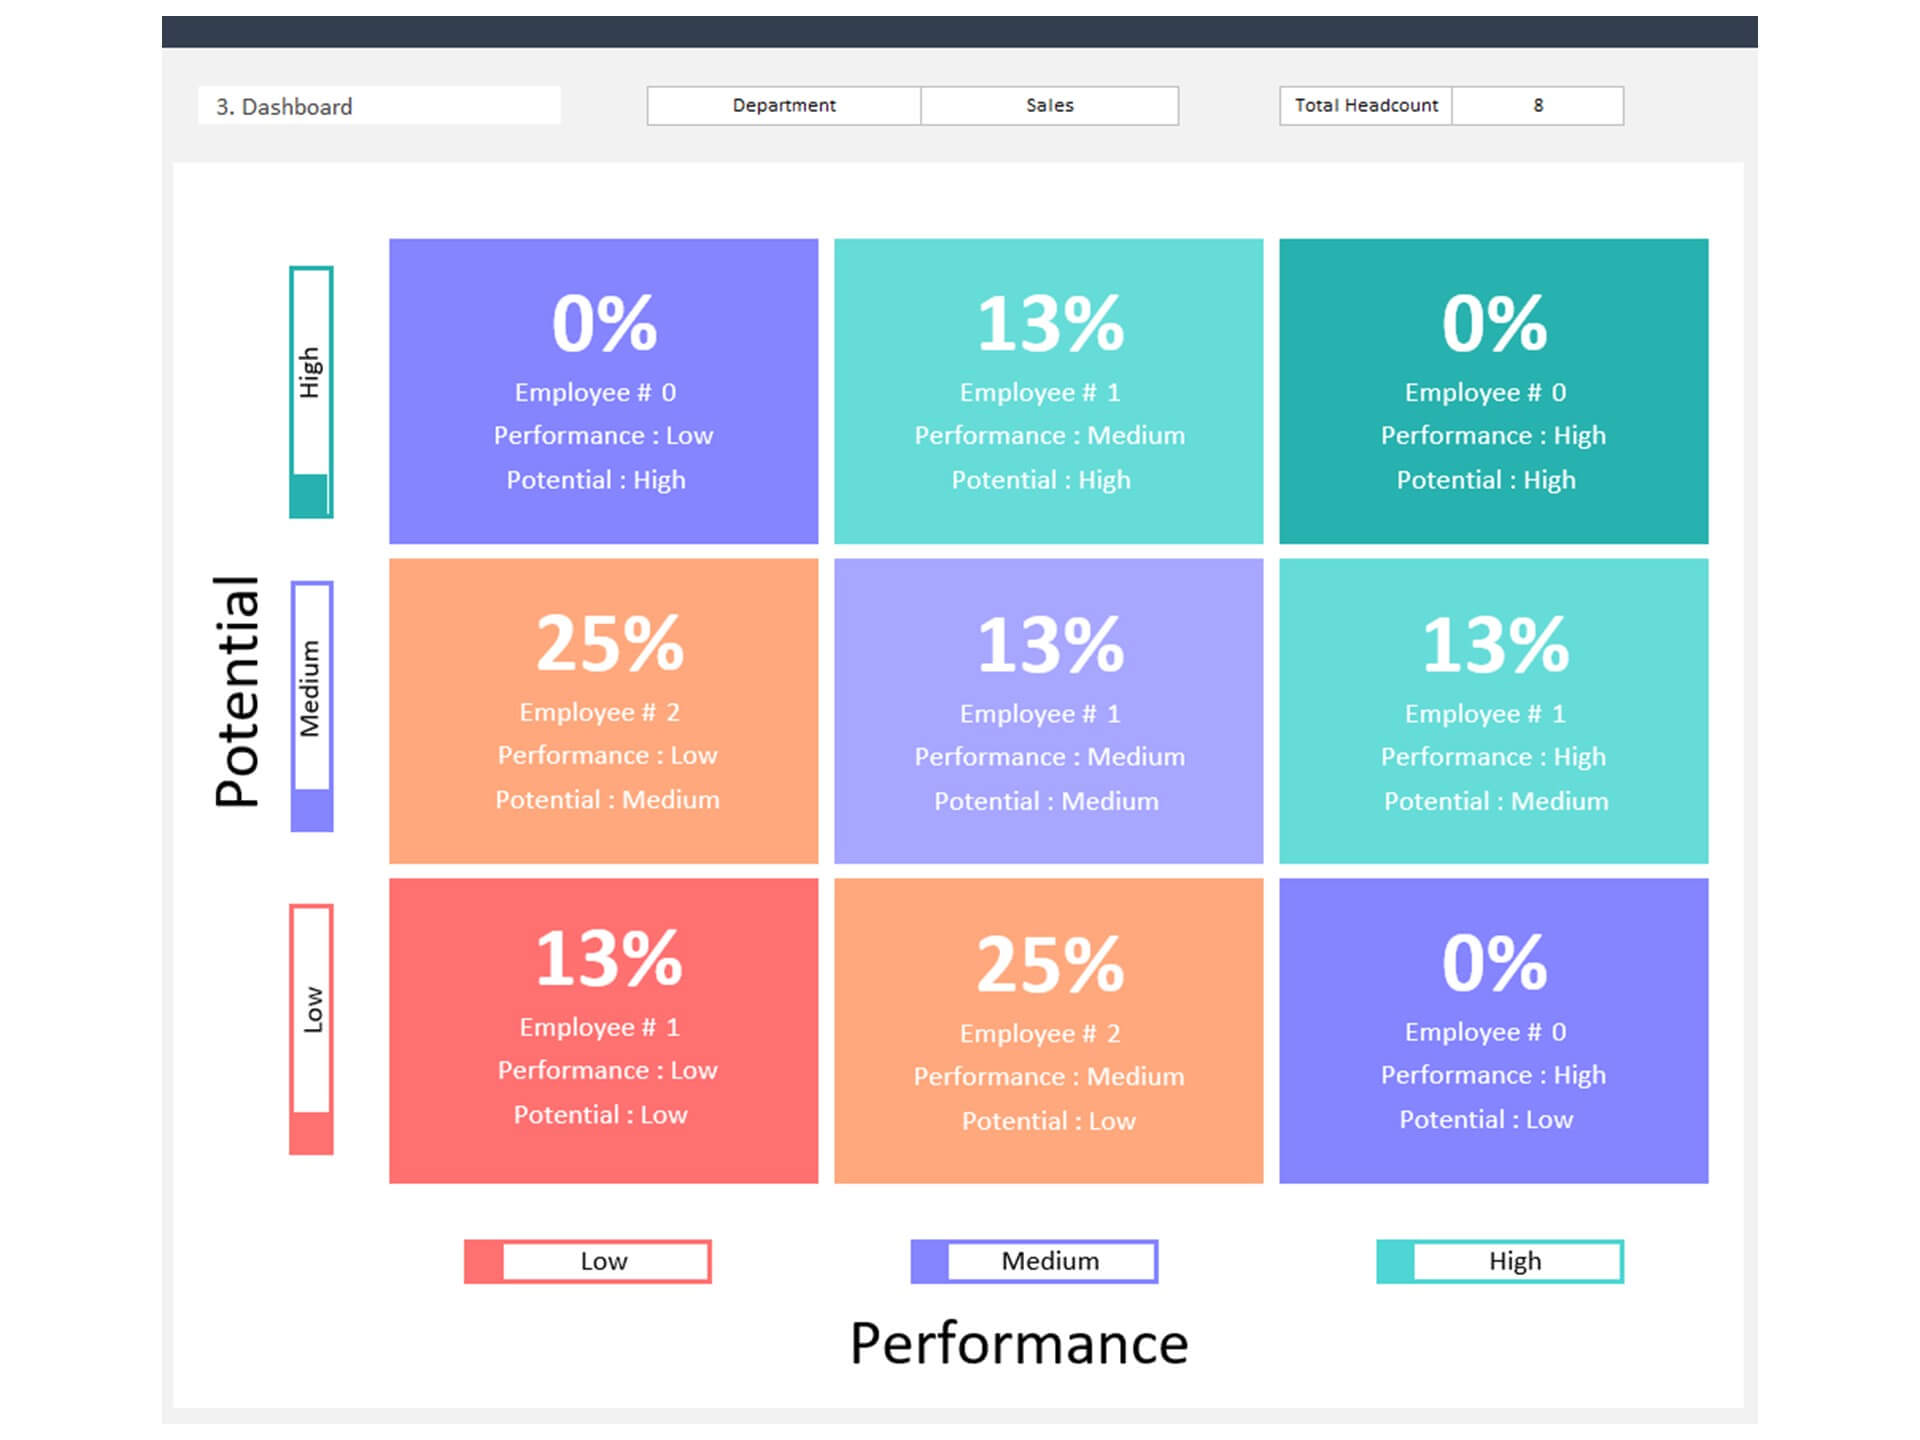
Designing a user-friendly safety management dashboard template involves selecting a layout that presents complex data in an understandable and actionable manner. Platforms like Excel or specialized EHS (Environmental, Health, and Safety) software offer flexibility in dashboard creation. A good template should separate different safety KPI metrics, use color coding for quick assessment, and provide tooltips for additional information. It should also allow customization to cater to specific organizational needs and ensure that key safety information is accessible to all relevant parties.
Integrating Safety Data for Comprehensive Monitoring
Tracking Incidents and Hazards in Real-Time
Real-time tracking of workplace incidents and hazards is pivotal for immediate response and mitigation. A well-integrated safety dashboard should enable organizations to log incidents as they occur, categorize them according to severity, and initiate appropriate response protocols. Incorporating real-time data feeds and notification systems into the dashboard ensures that safety managers and employees are always aware of current risks and can take swift action to prevent accidents and ensure a safe working environment.
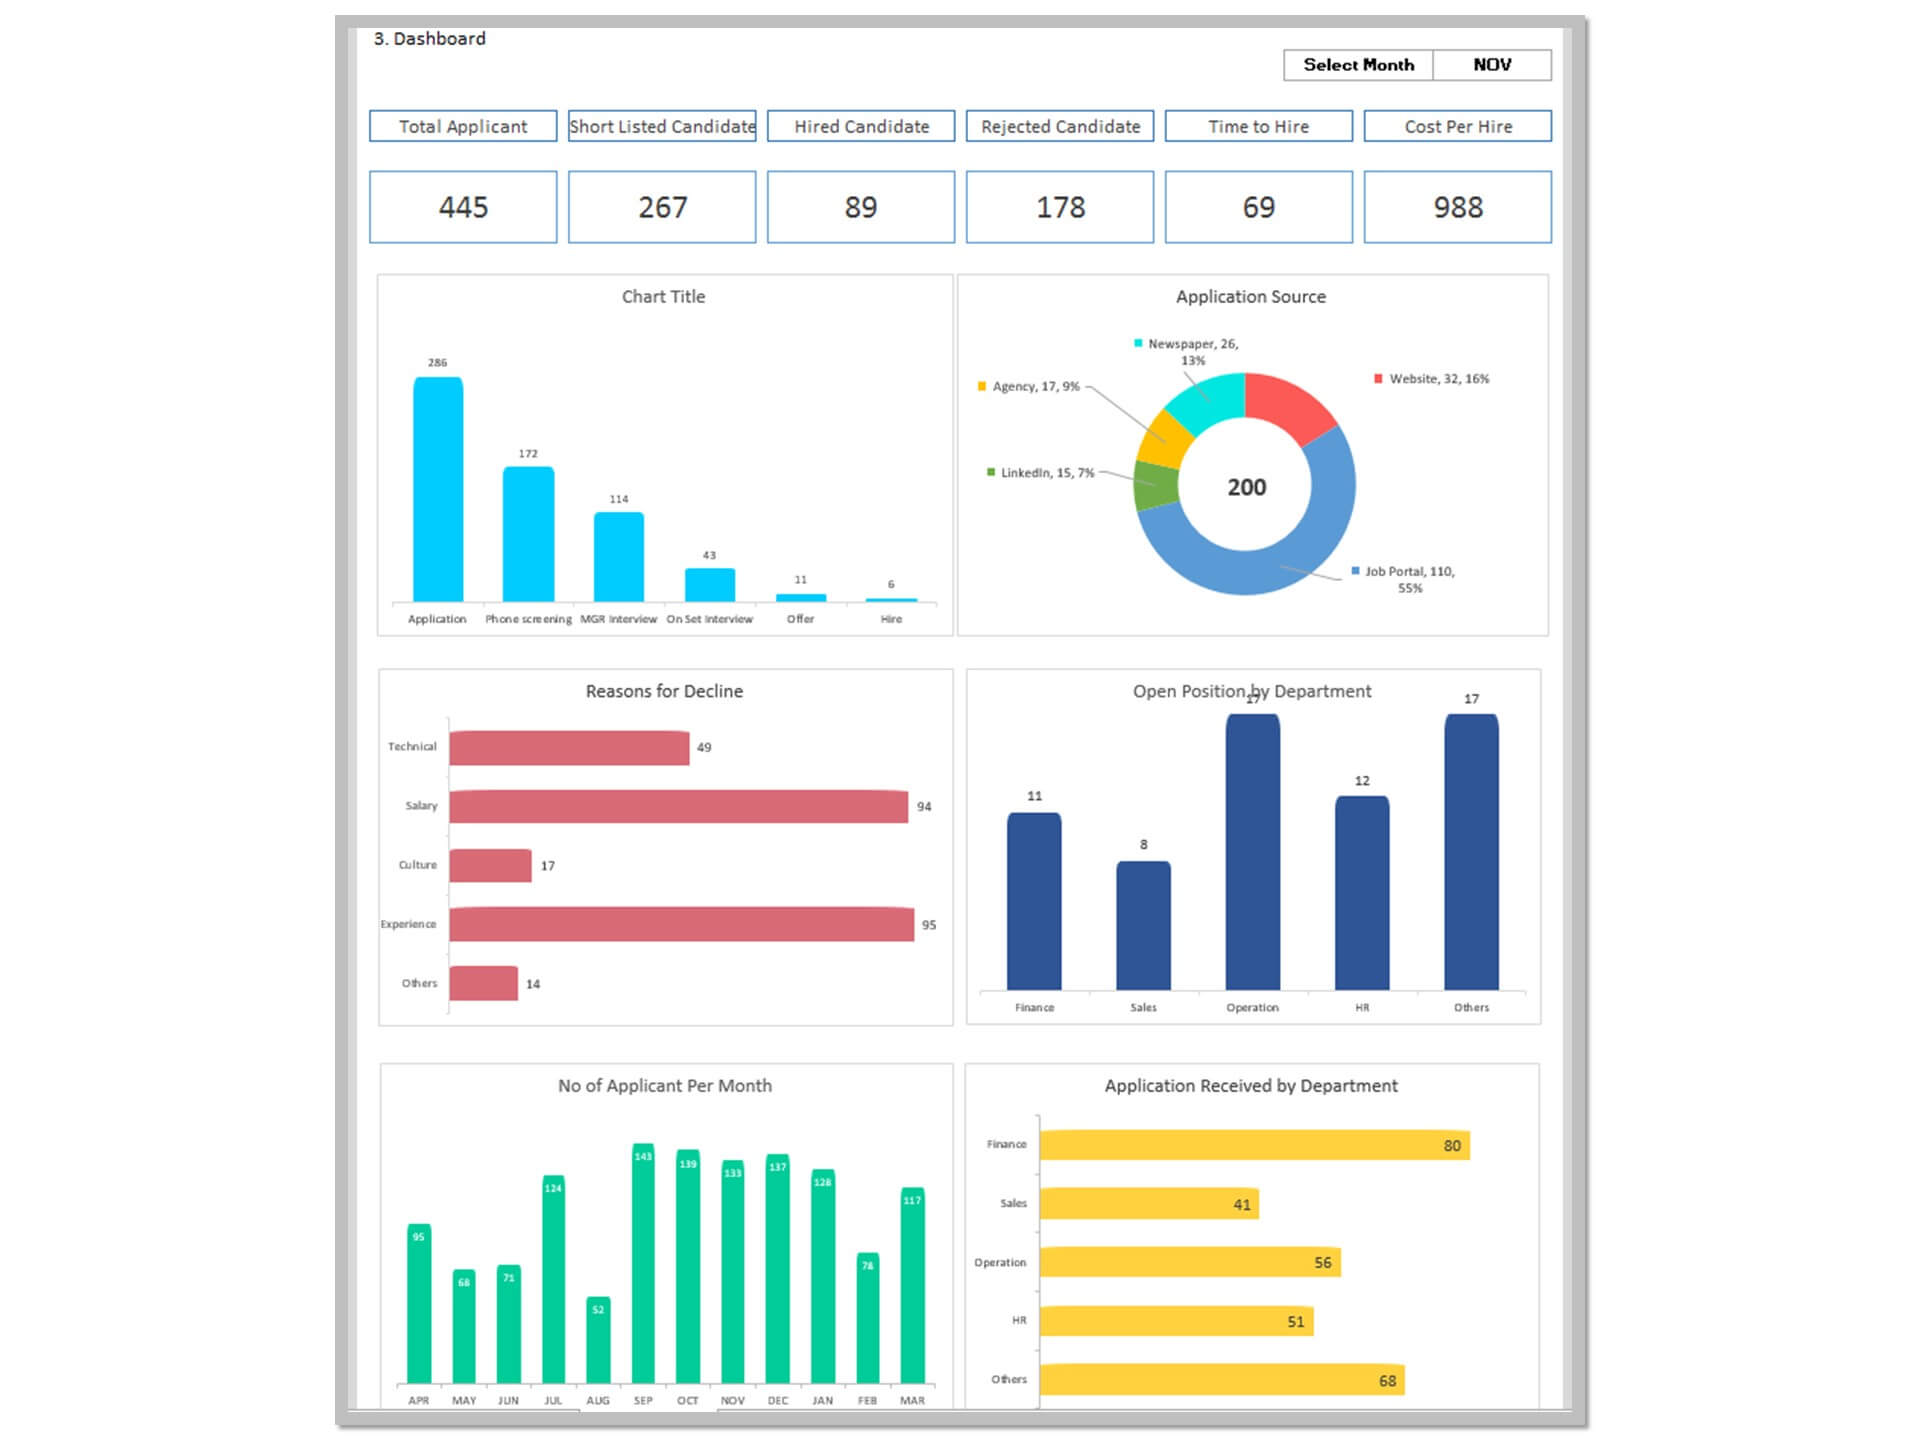
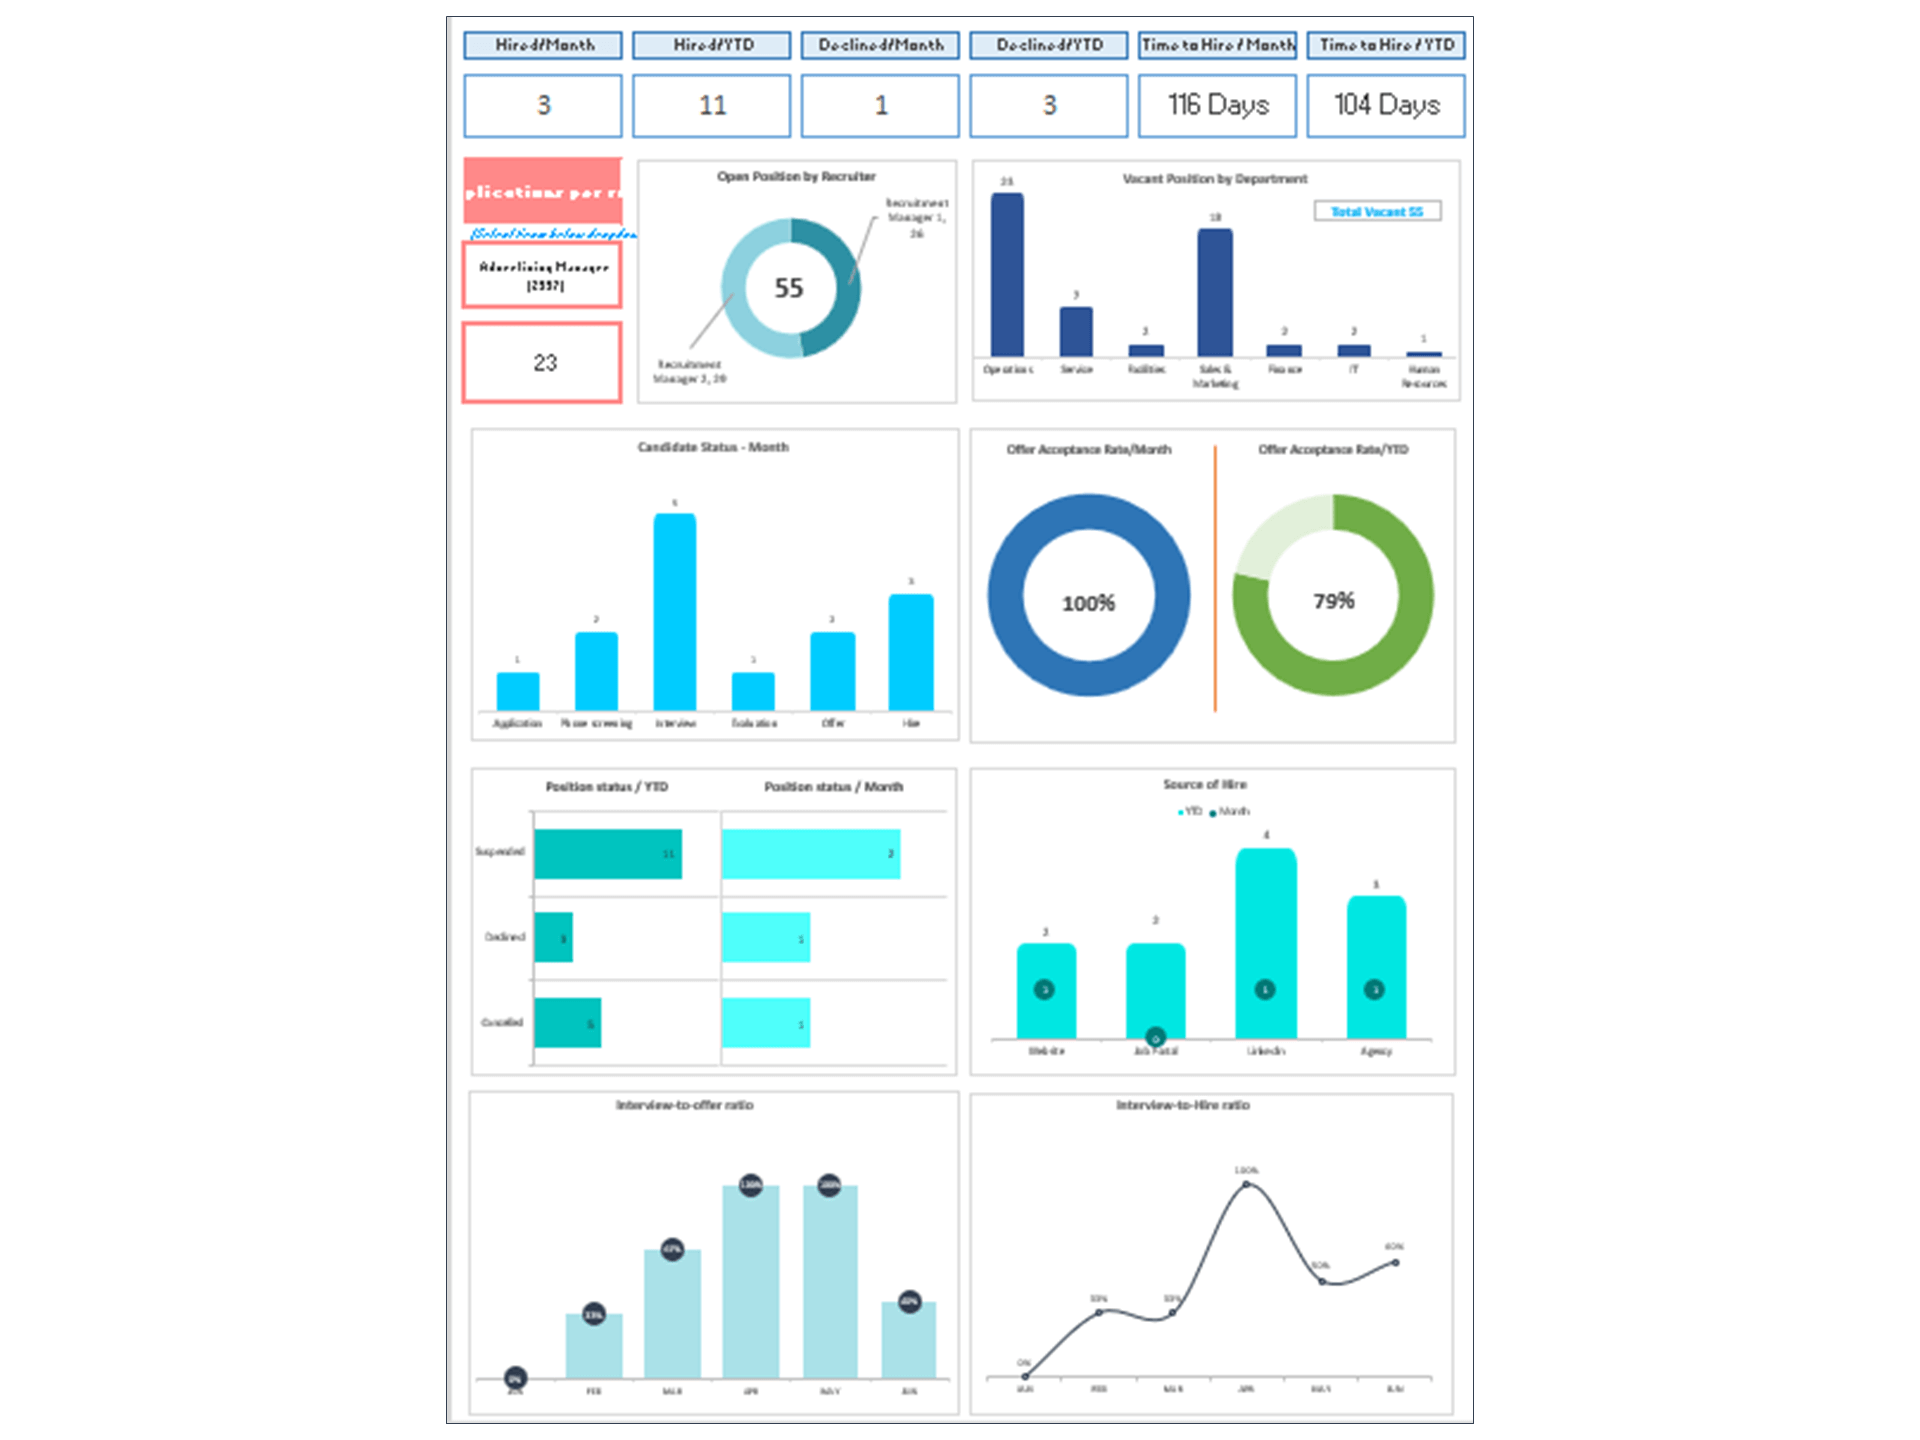
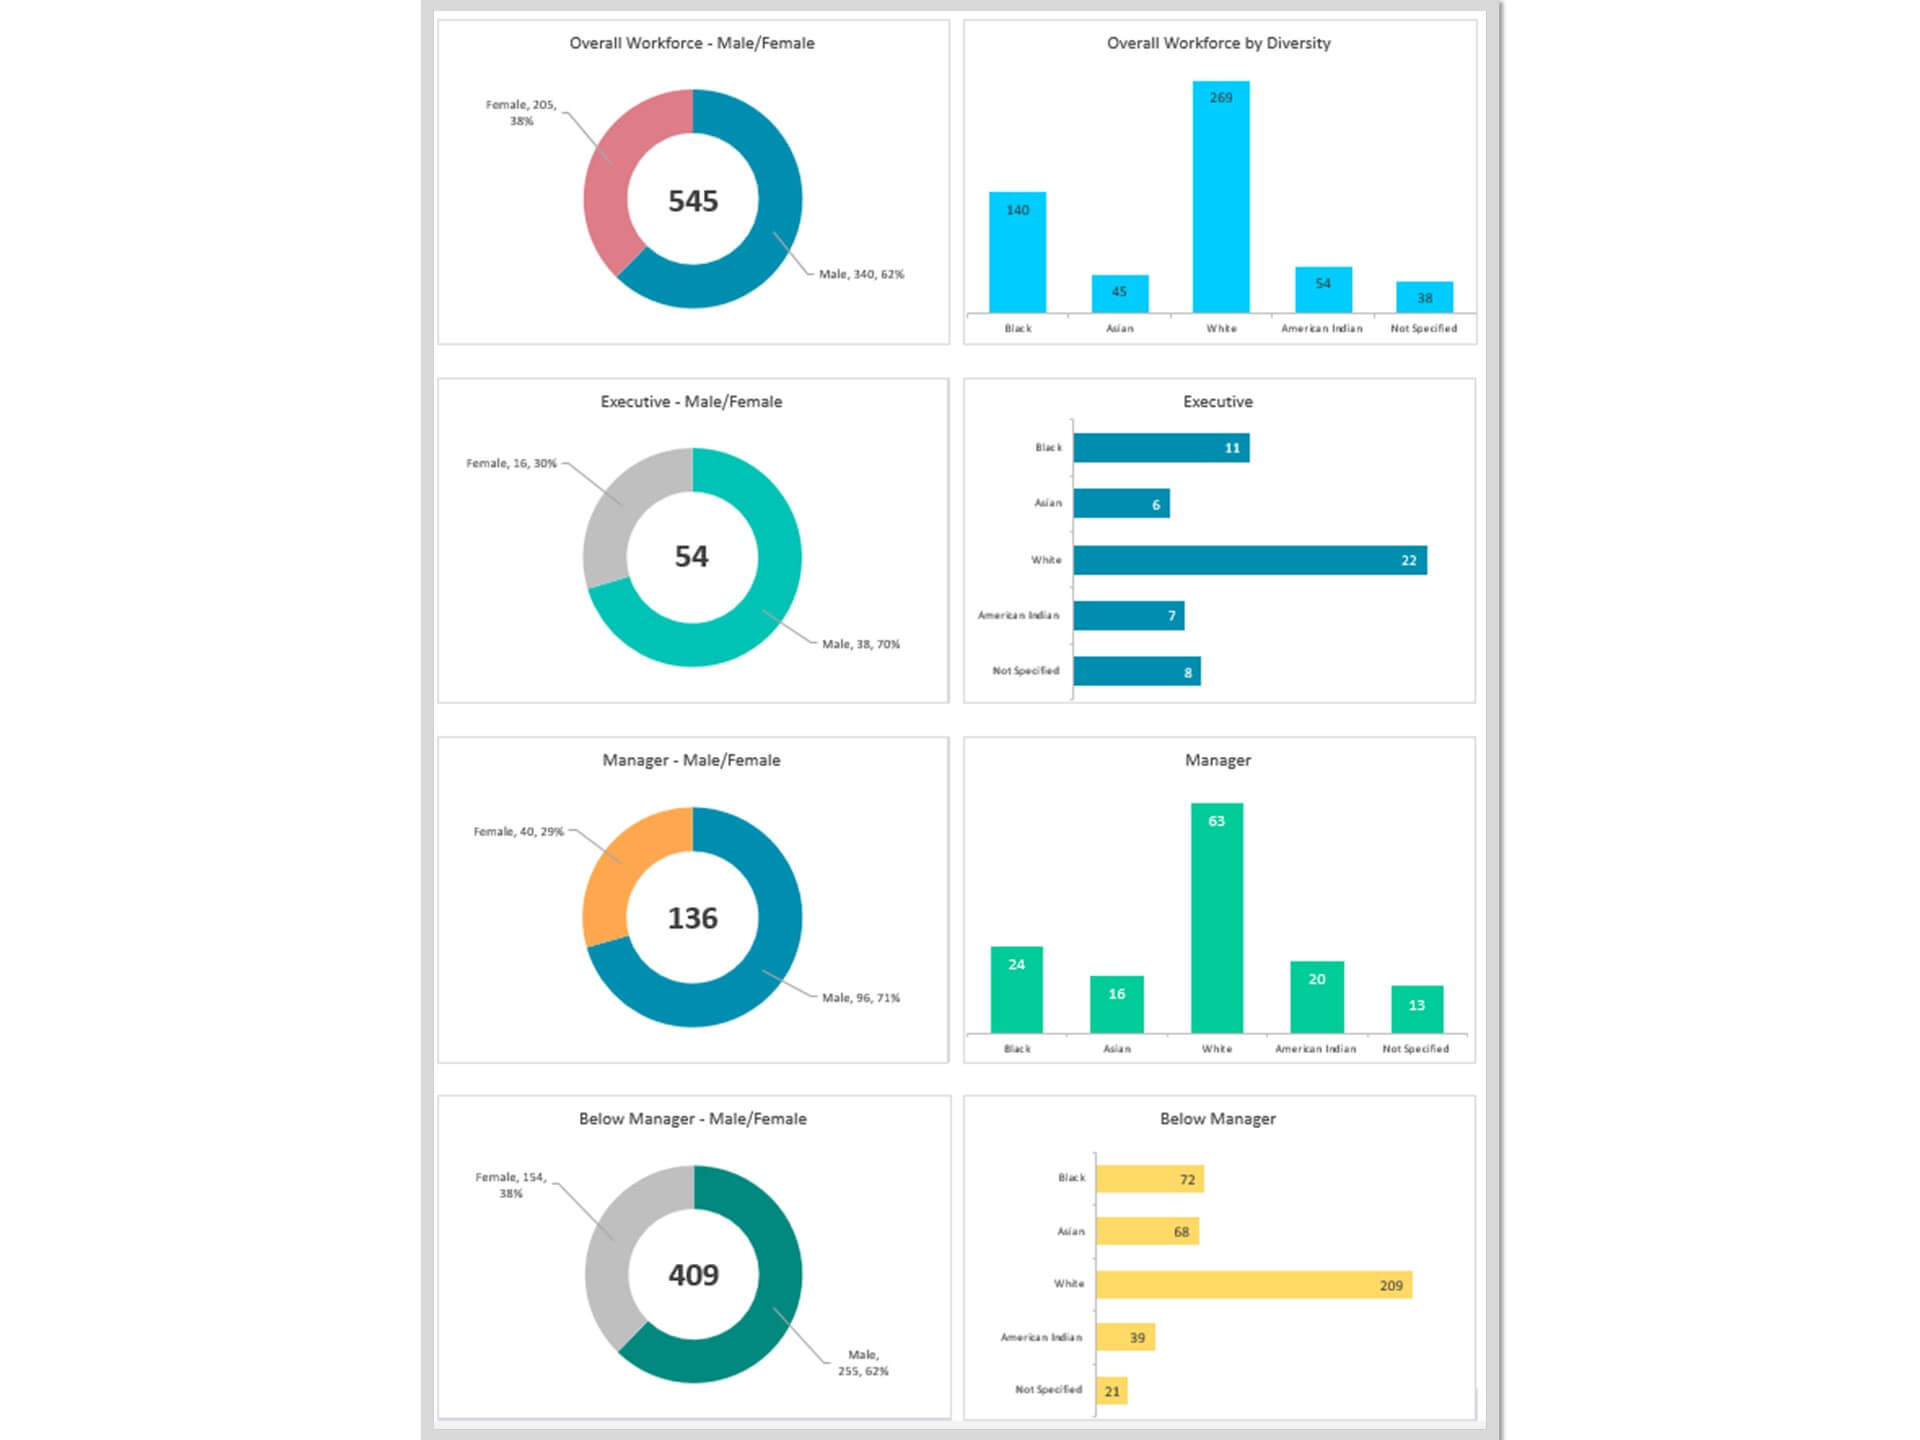
Visualizing Safety Performance for Better Insights
Effective visualization of safety performance involves the use of charts, graphs, and heat maps to illustrate data trends and patterns. Visual tools help highlight areas of concern and track improvements in key metrics over time. By presenting data visually, safety dashboards make it easier for employees and management to understand complex information, facilitating more informed decision-making and fostering a culture of safety awareness throughout the organization.
Advanced Safety Analysis and Reporting
Utilizing Advanced Analytics for Safety Insights
Advanced analytics and dashboard reporting allows for a deeper examination of safety data, uncovering underlying trends and root causes of safety incidents. By applying data analysis techniques, organizations can predict potential safety hazards and improve safety measures. Safety dashboards equipped with advanced analytics capabilities enable safety managers to develop more effective, data-driven safety strategies, reducing the likelihood of accidents and enhancing overall workplace safety.
Creating Impactful Safety Reports and KPI Dashboards
Compiling impactful safety reports and dashboards involves summarizing key safety performance indicators, incident reports, and compliance statuses in a coherent format. These reports should communicate safety trends, highlight achievements, and identify areas needing improvement. Effective safety dashboards and reports serve as powerful tools for communicating with stakeholders, from frontline employees to top management, ensuring alignment on safety priorities and fostering a collective commitment to maintaining a safe work environment.
Operational Practices for Safety Management
Implementing Effective Safety Observations and Audits
Conducting regular safety observations and audits is crucial for identifying potential hazards and non-compliance issues. Integrating findings from these audits into the safety management system, and subsequently into the safety dashboard, allows organizations to track corrective actions and verify compliance with safety standards. This continuous cycle of observation, reporting, and improvement helps build a proactive safety culture, minimizing risks and enhancing employee well-being.
Enhancing Compliance and Build a Safety Culture
The health and safety dashboard can be a vital tool in reinforcing compliance standards and cultivating a strong safety culture within an organization. By consistently monitoring and displaying compliance metrics and safety performance, dashboards remind employees and managers of the importance of safety protocols. They also provide a platform for recognizing safety achievements, which can boost morale and encourage proactive safety behaviors, further embedding safety into the organizational culture.
Collaboration and Engagement in Safety Management
Fostering Team Collaboration through Safety Dashboards in Excel
Safety dashboard templates in Excel can promote collaboration by providing a central platform for sharing safety information and insights. By making safety data accessible to all employees, dashboards encourage open communication and collective problem-solving regarding safety issues. Regular dashboard reviews and safety meetings can help teams align on safety objectives, share best practices, and work together to enhance workplace safety.
Engaging Employees with Interactive Safety Features
Interactive elements such as clickable charts, drill-down capabilities, and customizable views can significantly increase employee engagement with the safety dashboard. These features encourage employees to explore safety data relevant to their roles and contribute their insights, fostering a sense of ownership and participation in the company's safety initiatives. Engaging employees in this way helps ensure that safety is not just a management priority but a shared responsibility across the organization.
Streamlining Safety Processes with Dashboard Integration
Integrating Safety Dashboards with Workplace Safety Management Systems
Integrating safety dashboards with existing Environmental Health and Safety (EHS) management systems enhances data consistency and workflow efficiency. This integration allows for seamless data exchange between systems, ensuring that the dashboard reflects up-to-date information on incidents, audits, and compliance status. By consolidating all safety-related data into a single, unified platform, organizations can streamline their safety processes, reduce administrative burdens, and focus more on preventive measures.
Customizing Dashboards to Fit Industry-Specific Needs
Safety requirements can vary significantly across different industries, making it essential to customize safety dashboards to meet specific sector challenges and compliance standards. Tailoring the dashboard to reflect industry-specific metrics, regulations, and best practices ensures that it provides relevant and actionable insights. Customization allows organizations to address unique safety concerns effectively and maintain compliance with industry standards.
Maintaining and Enhancing Safety Dashboards
Regular Updates and Maintenance for Safety Key Performance Indicator Dashboards
Keeping safety dashboards up-to-date and well-maintained is essential for their effectiveness. Regular updates ensure that the dashboard accurately reflects the current safety status, incorporates the latest data, and remains aligned with organizational safety objectives. Routine maintenance checks can identify and rectify issues such as data discrepancies, broken links, or outdated information, maintaining the dashboard's reliability and utility.
Evolving Safety Strategies with Dashboard Insights
Safety dashboards provide valuable insights that can inform and shape evolving safety strategies. By continuously analyzing dashboard data, organizations can identify trends, assess the effectiveness of current safety measures, and adapt their strategies to address emerging risks and changing conditions. This iterative approach helps ensure that safety practices remain relevant, effective, and aligned with the organization's overall safety goals.
Leveraging Dashboards for EHS Safety Excellence
Benchmarking and Best Practices in Workplace Safety Dashboards
Benchmarking against industry standards and adopting best practices can significantly enhance the effectiveness of safety dashboards. By comparing safety performance with industry peers, organizations can identify areas for improvement, set realistic safety targets, and adopt proven strategies to achieve safety excellence. Embracing best practices in dashboard design and data presentation can also improve user engagement and decision-making.
Expanding Safety Awareness and Reduce Injury with Dashboard Accessibility
Ensuring that safety dashboards are accessible to all employees is crucial for promoting widespread safety awareness and compliance. Dashboards should be user-friendly and available across multiple devices and platforms, enabling employees to access safety information anytime, anywhere. This accessibility helps foster an informed and safety-conscious workforce, where every employee understands their role in maintaining a safe working environment.
Practical Guidance and Support
FAQs: Navigating Common Safety Dashboard Queries
Addressing common questions about safety dashboards can help users better understand how to effectively set up, utilize, and benefit from them. Providing clear answers to frequently asked questions empowers employees and safety managers to make the most of the dashboard's capabilities, enhancing their confidence and competence in managing workplace safety.
Troubleshooting Common Dashboard Challenges
Offering practical solutions to typical problems encountered with safety dashboards can improve user experience and dashboard functionality. Addressing issues such as data inaccuracies, integration challenges, or user interface problems ensures that the dashboard remains a valuable tool for safety management. Effective troubleshooting support helps maintain the integrity and effectiveness of the safety dashboard, supporting ongoing safety improvement efforts.
Key Features of our dashboard:
- Monitor employee health and safety information
- Provide actionable insights
- Consolidate all your health & safety metrics in one place
- Visualize overall HR department performance
- Fully editable, easy to use, template with sample data
- Eye-catching design and customizable
- Change the sample data with your data
- Spreadsheets ready for printing without Biz Infograph logo
- Consolidate key business performance indicators in one dashboard
- No monthly fees
- Immediate download
- No VBA, no Macro
- No installation necessary
- Professionally designed
What is included in this dashboard template?
- Ready dashboard just plug your data and start using. The dashboard will be ready instantly.
- A text file which contains a password to view and edit the formula
- A guide to unlocking all the elements in the dashboard
Professional Support:
- Video tutorial guide on how to navigate and use each Dashboard Template
- Professional service to customize dashboard template in excel as per business need
- Help and support in post-purchase
- Payment secured by Stripe and PayPal (no PayPal account needed)
A brief guide to using the dashboard template:
- Open the dashboard template
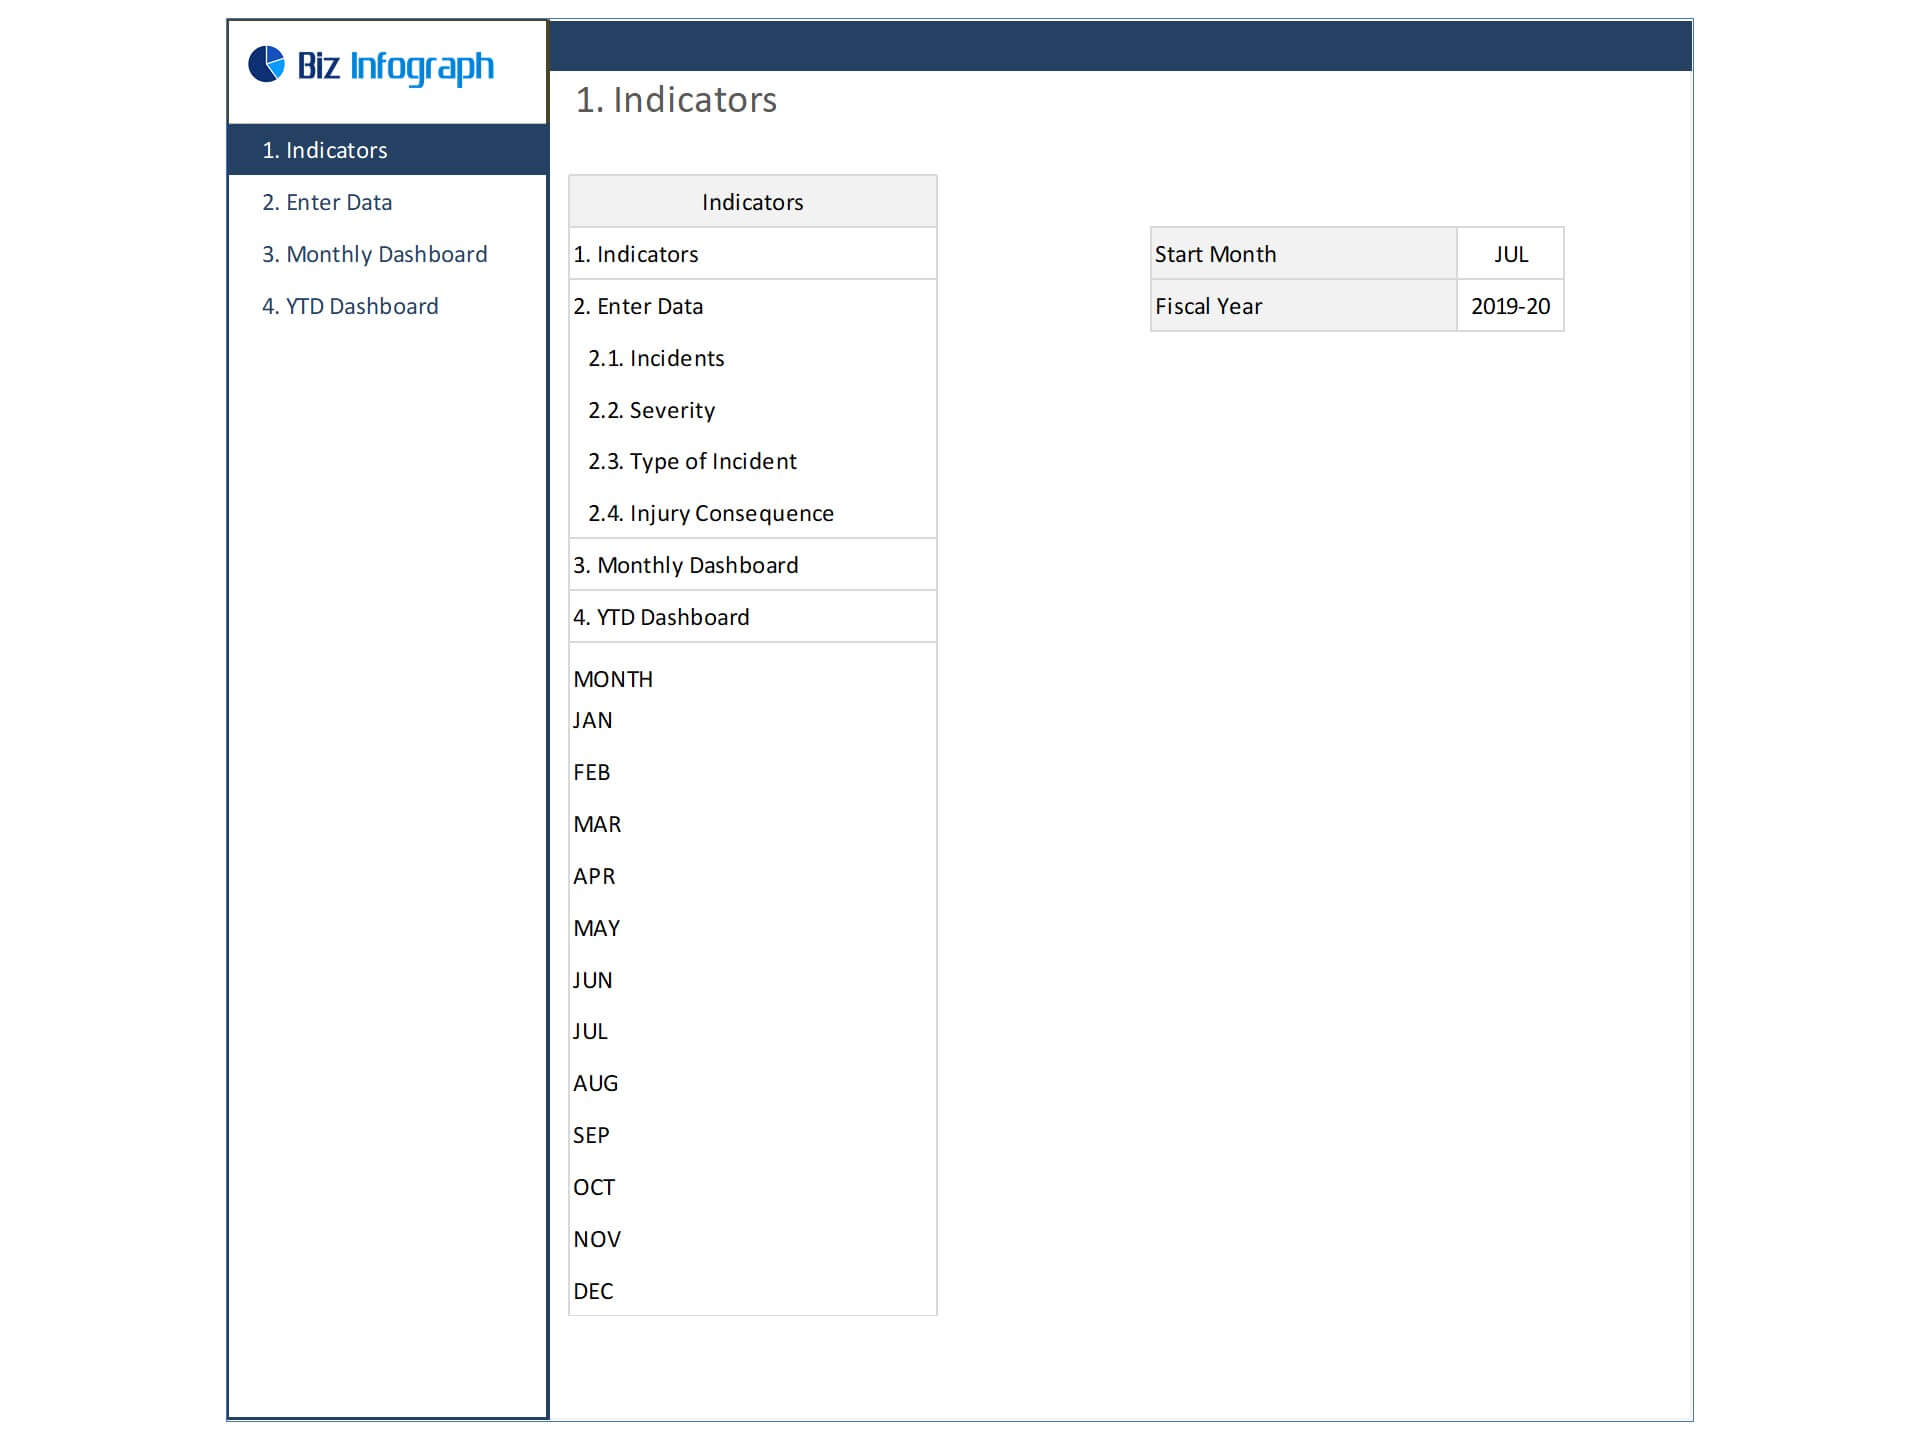
- Go to ‘Indicators’ menu – choose the start month of the fiscal year (i.e. Jan, Feb, Jul, etc.)
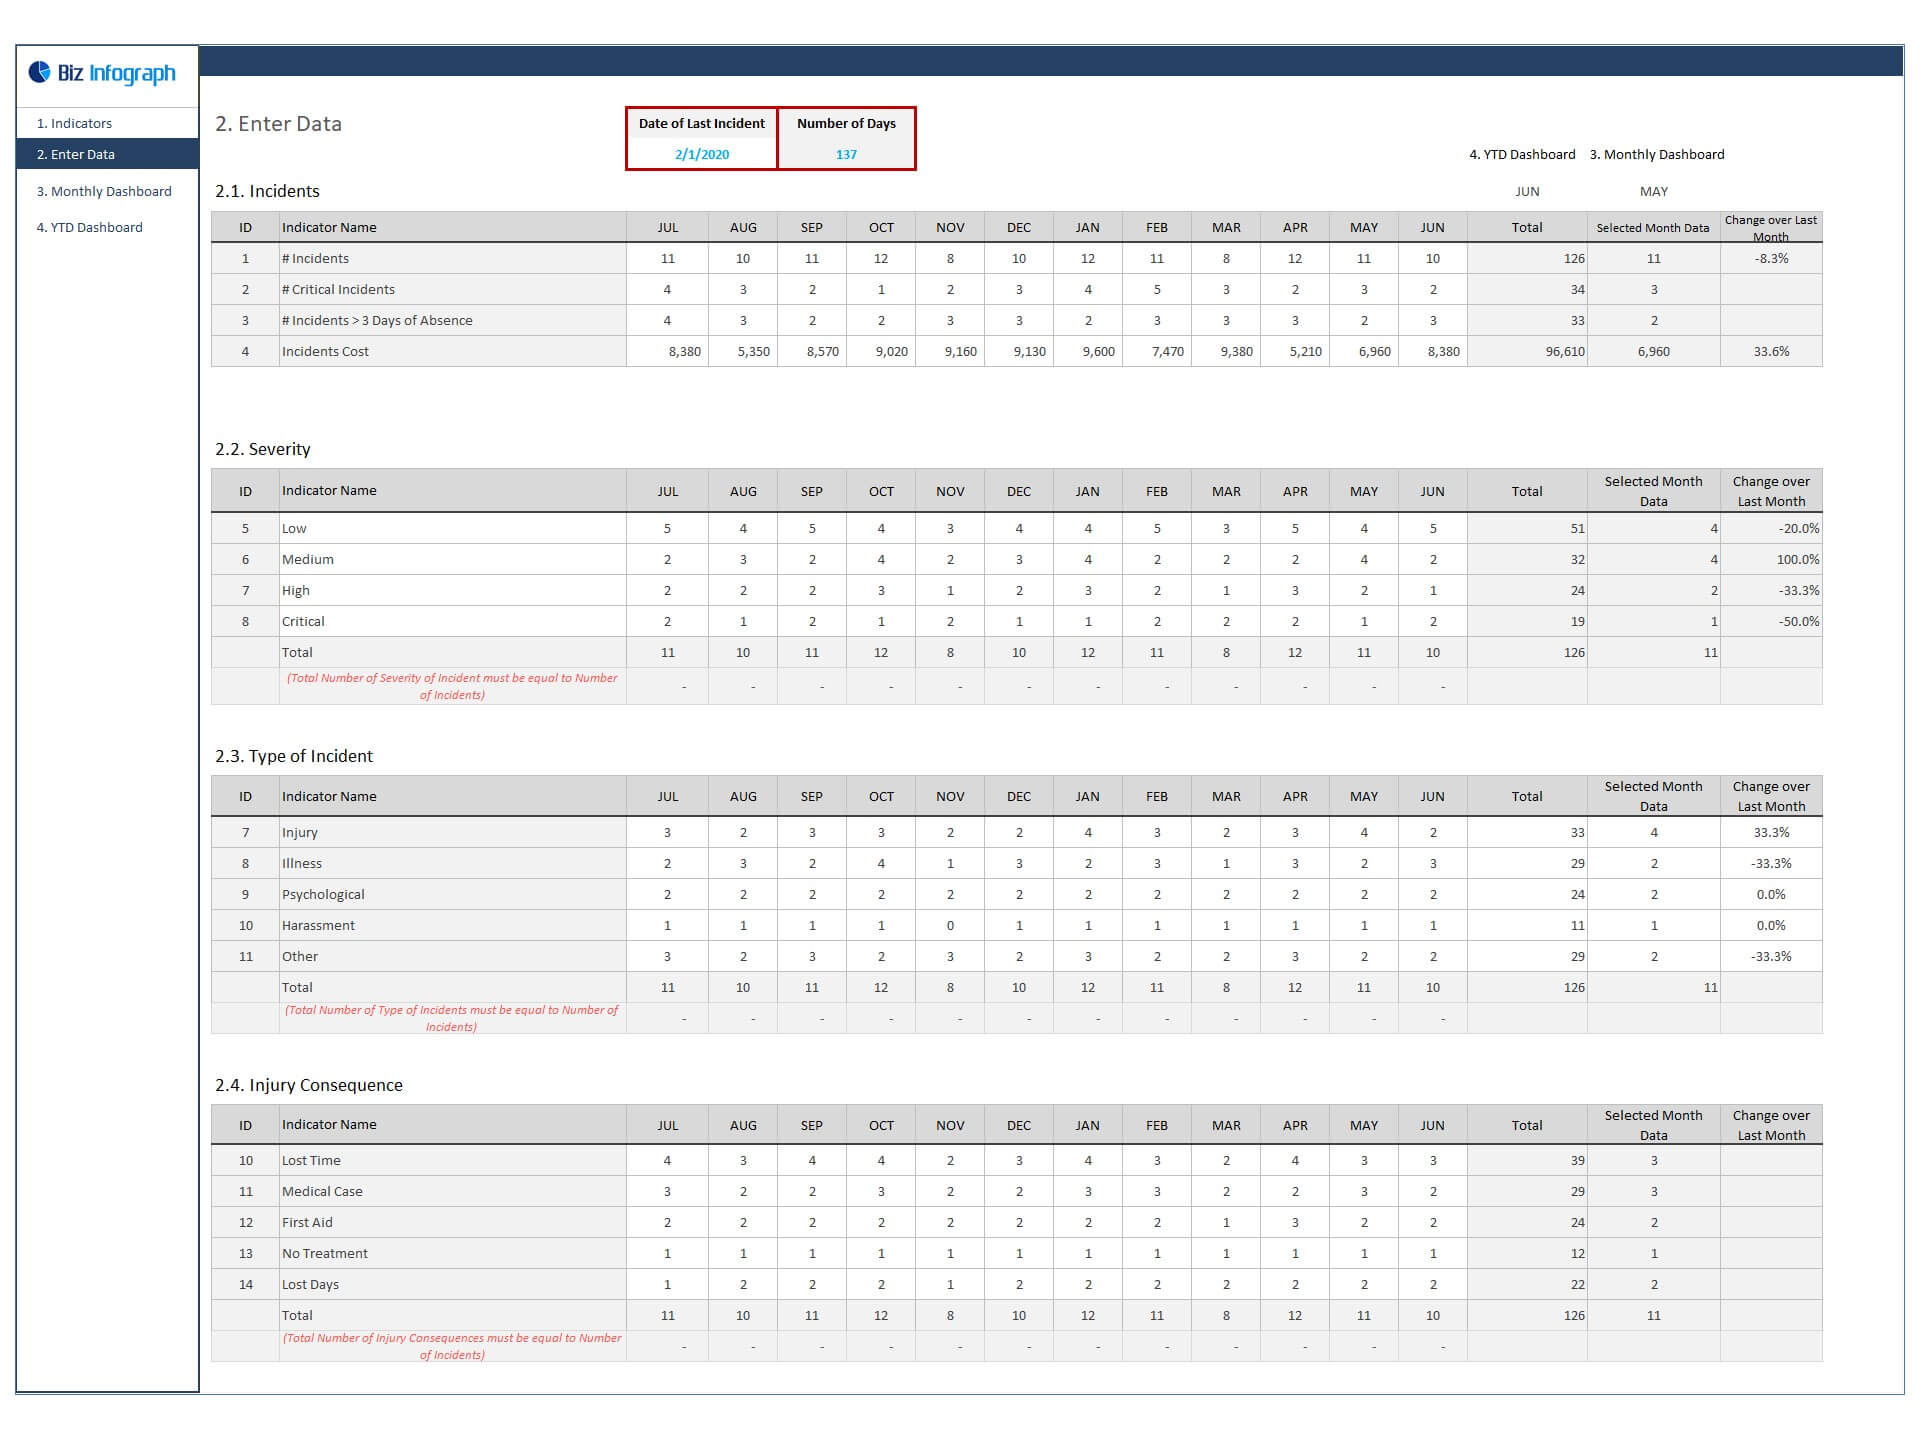
- Go to the ‘Enter Data’ menu – remove the sample data and give your actual data in the respective cells. Formula cells are locked, and you cannot edit it without a password.
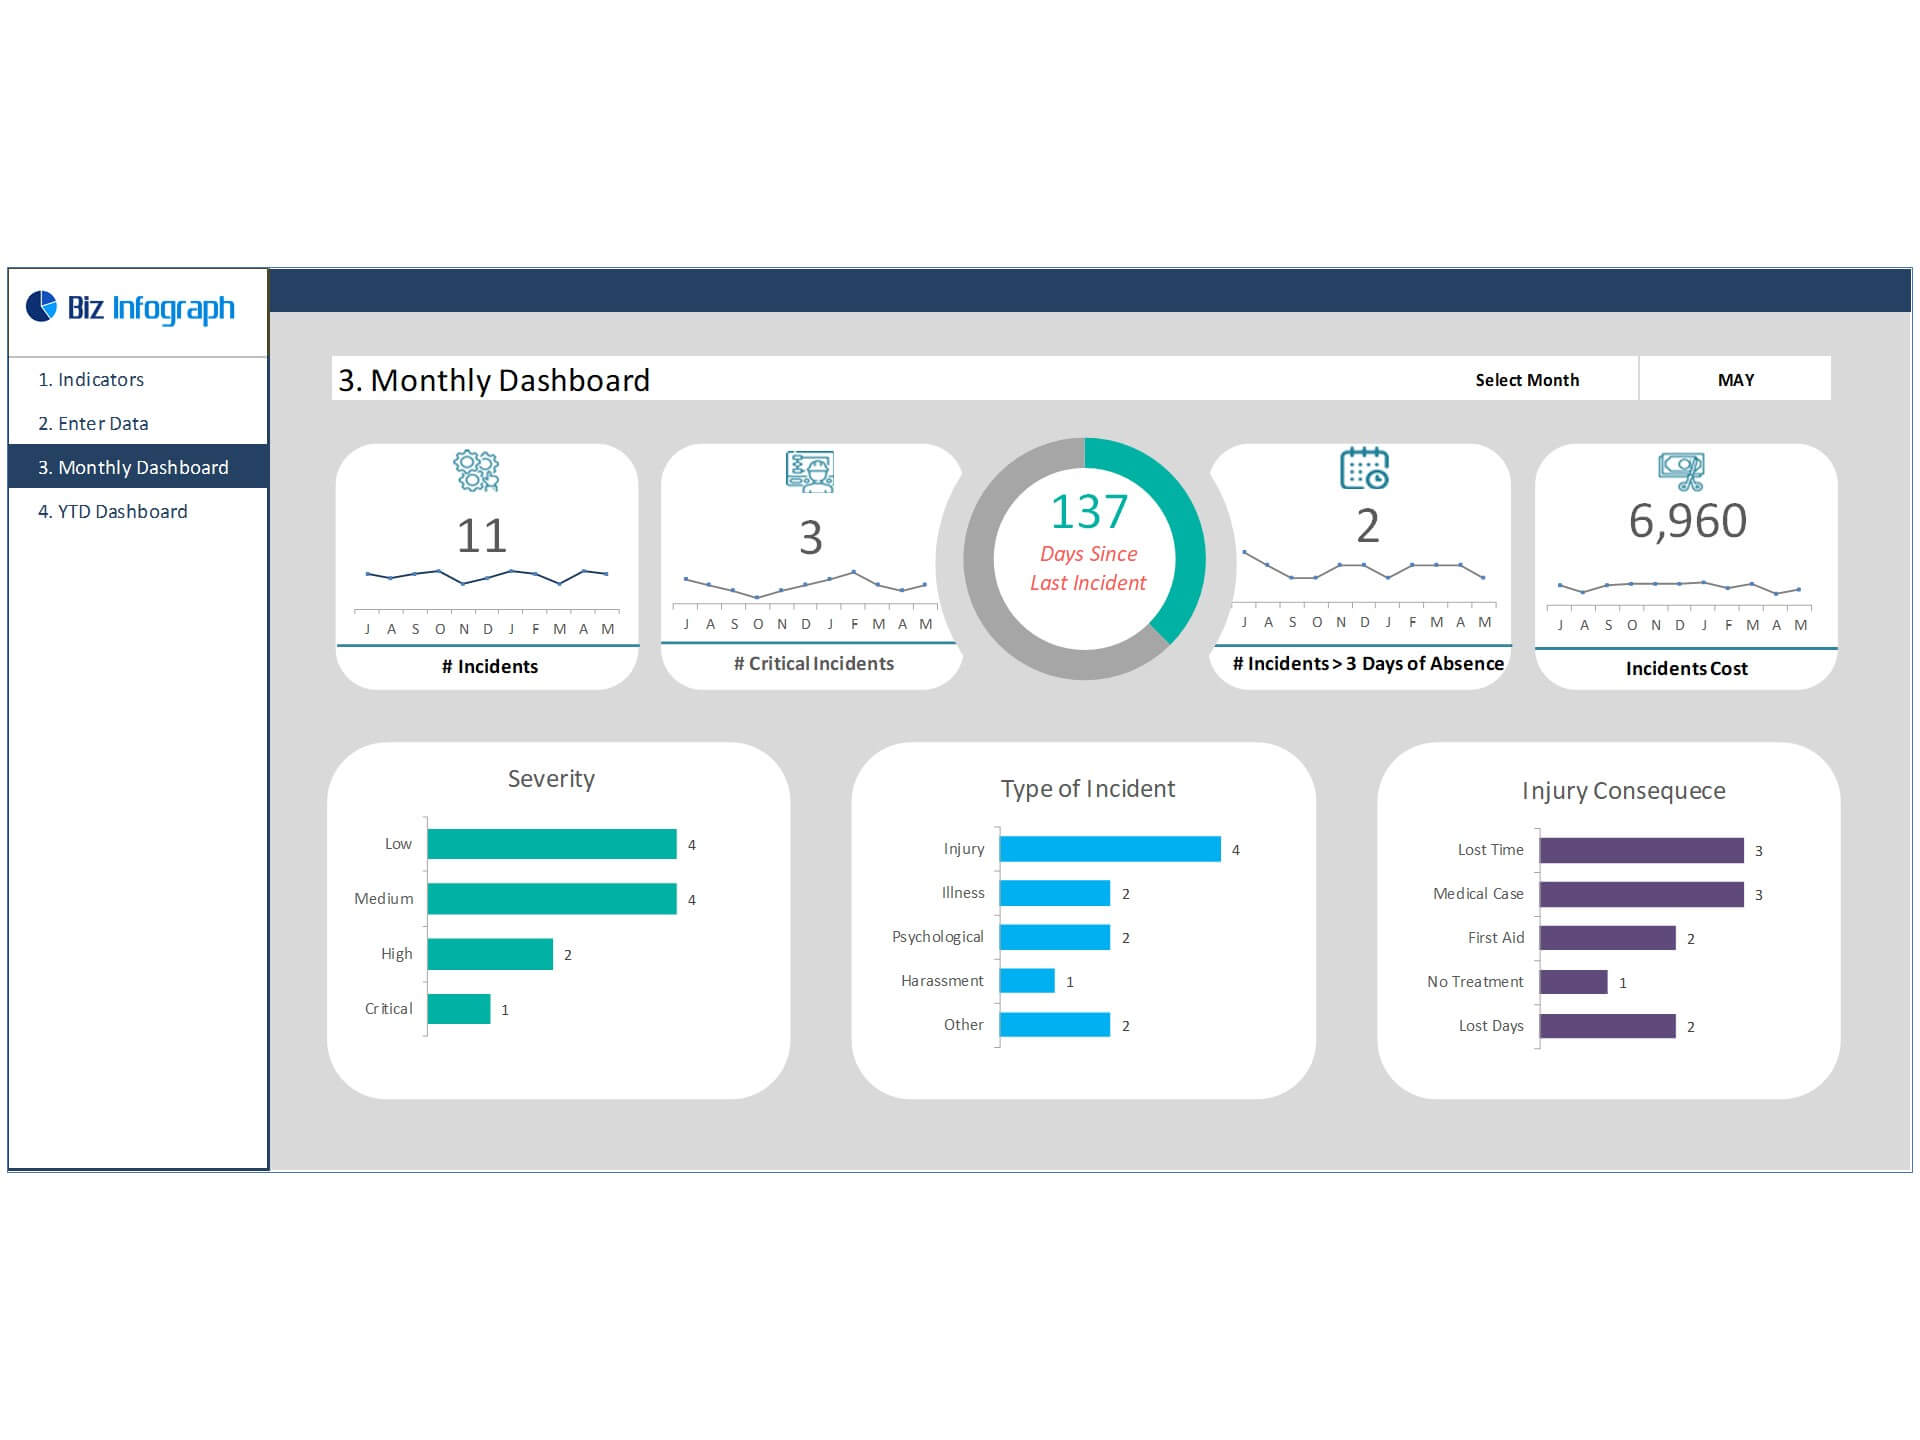
- Go to the ‘Monthly Dashboard’ menu – select the month name from the drop-down to see the monthly picture of performance indicators
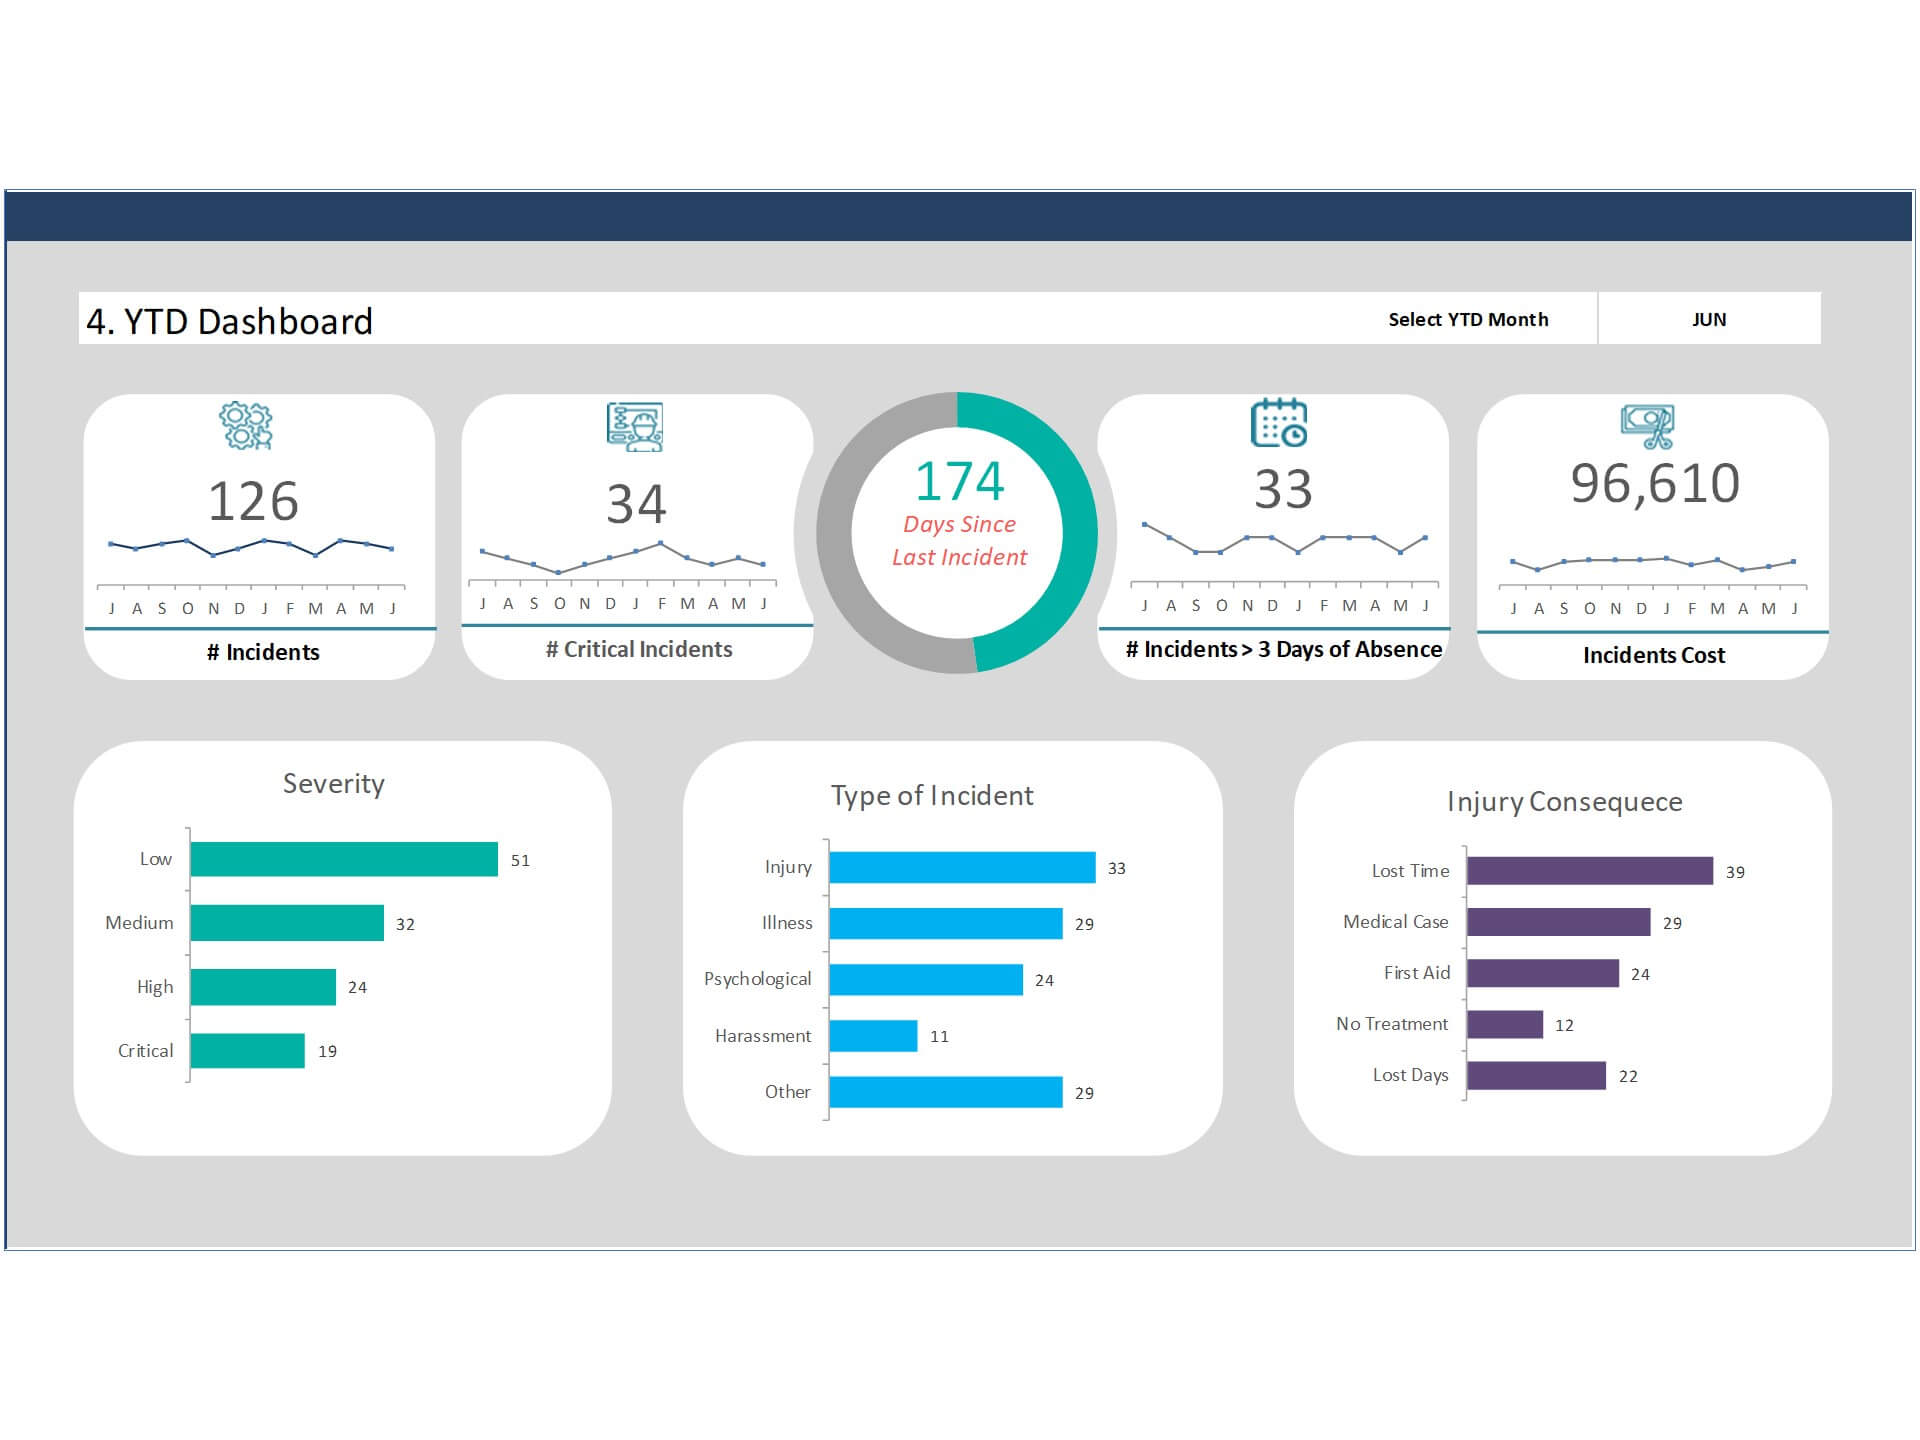
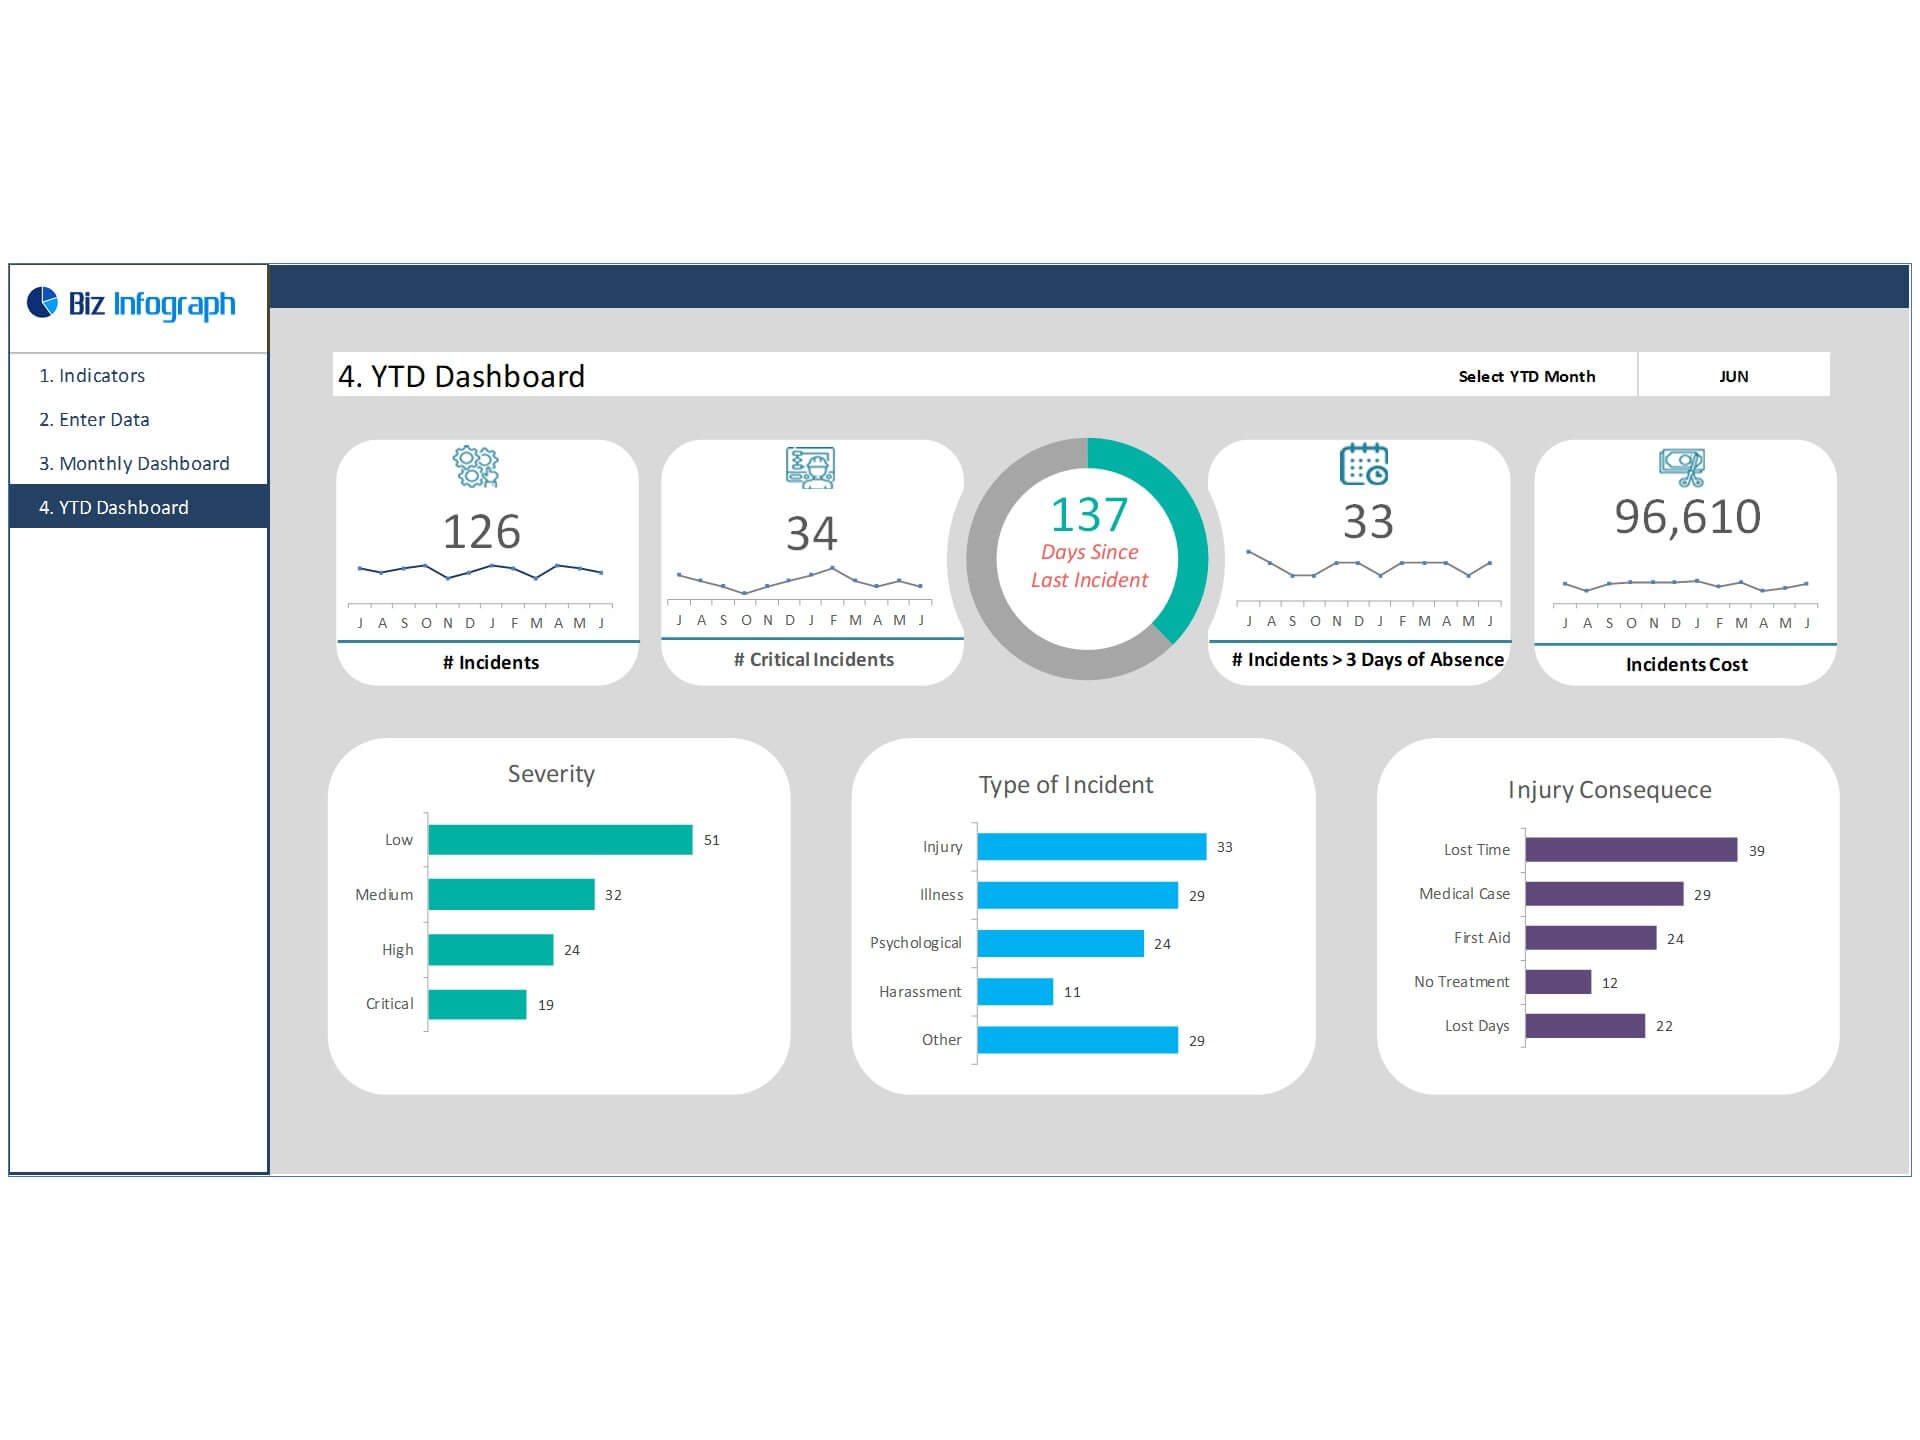
- Go to ‘YTD Dashboard’ menu - select month name from the drop-down to see the year-to-date picture of performance indicators
- Each page is ready for printing – just press CTRL+P
This Excel dashboard template is password-protected to avoid mistakes, such as accidentally deleting formulas. When you completed the purchase, the password will be available.
For ready-to-use Dashboard Templates: