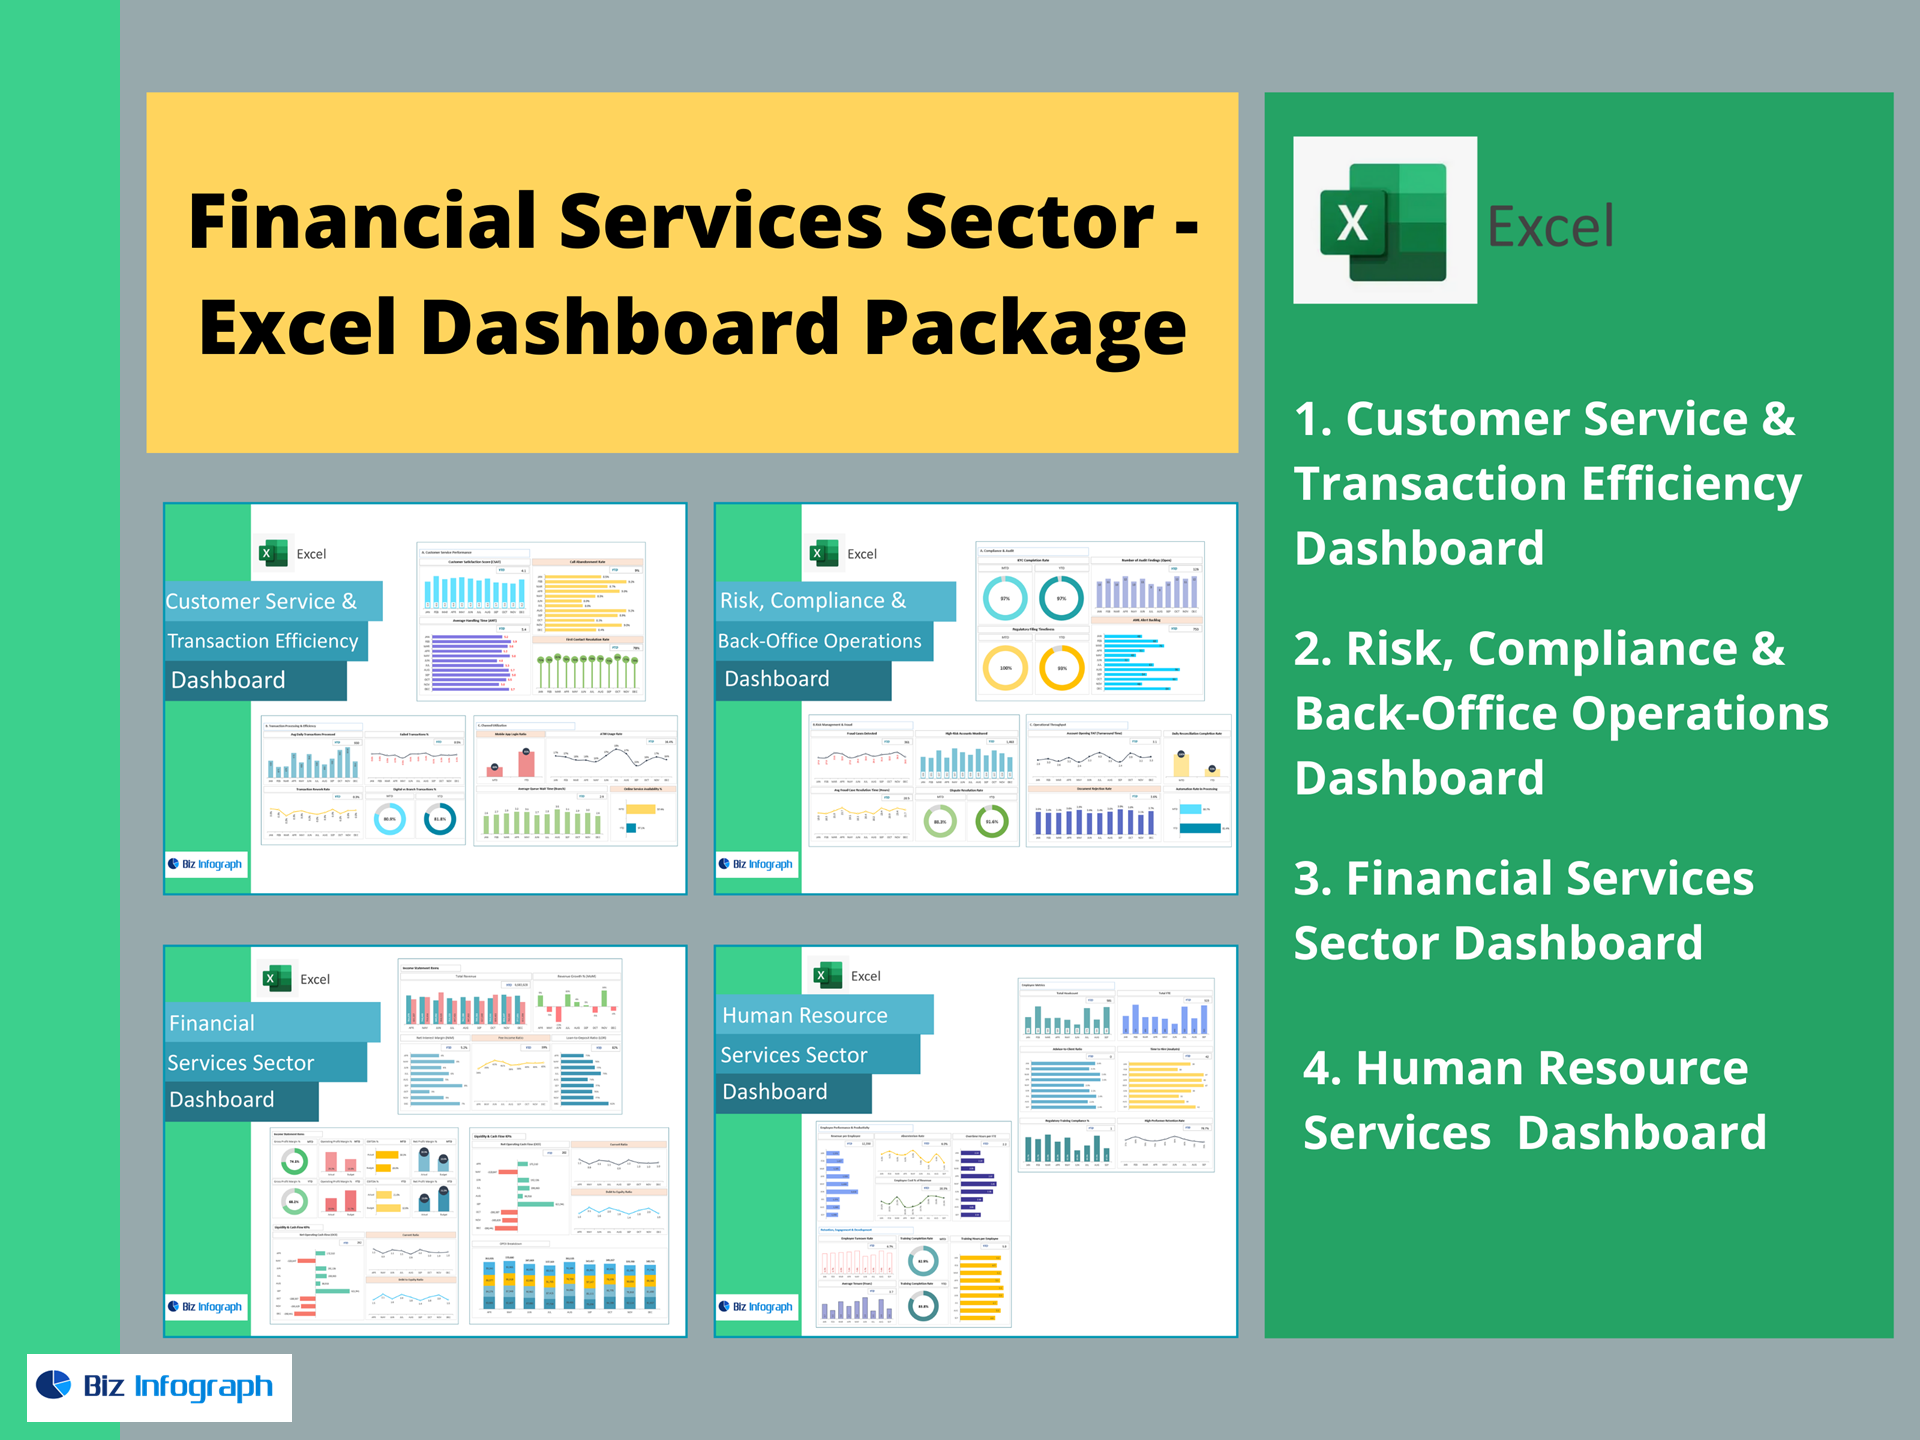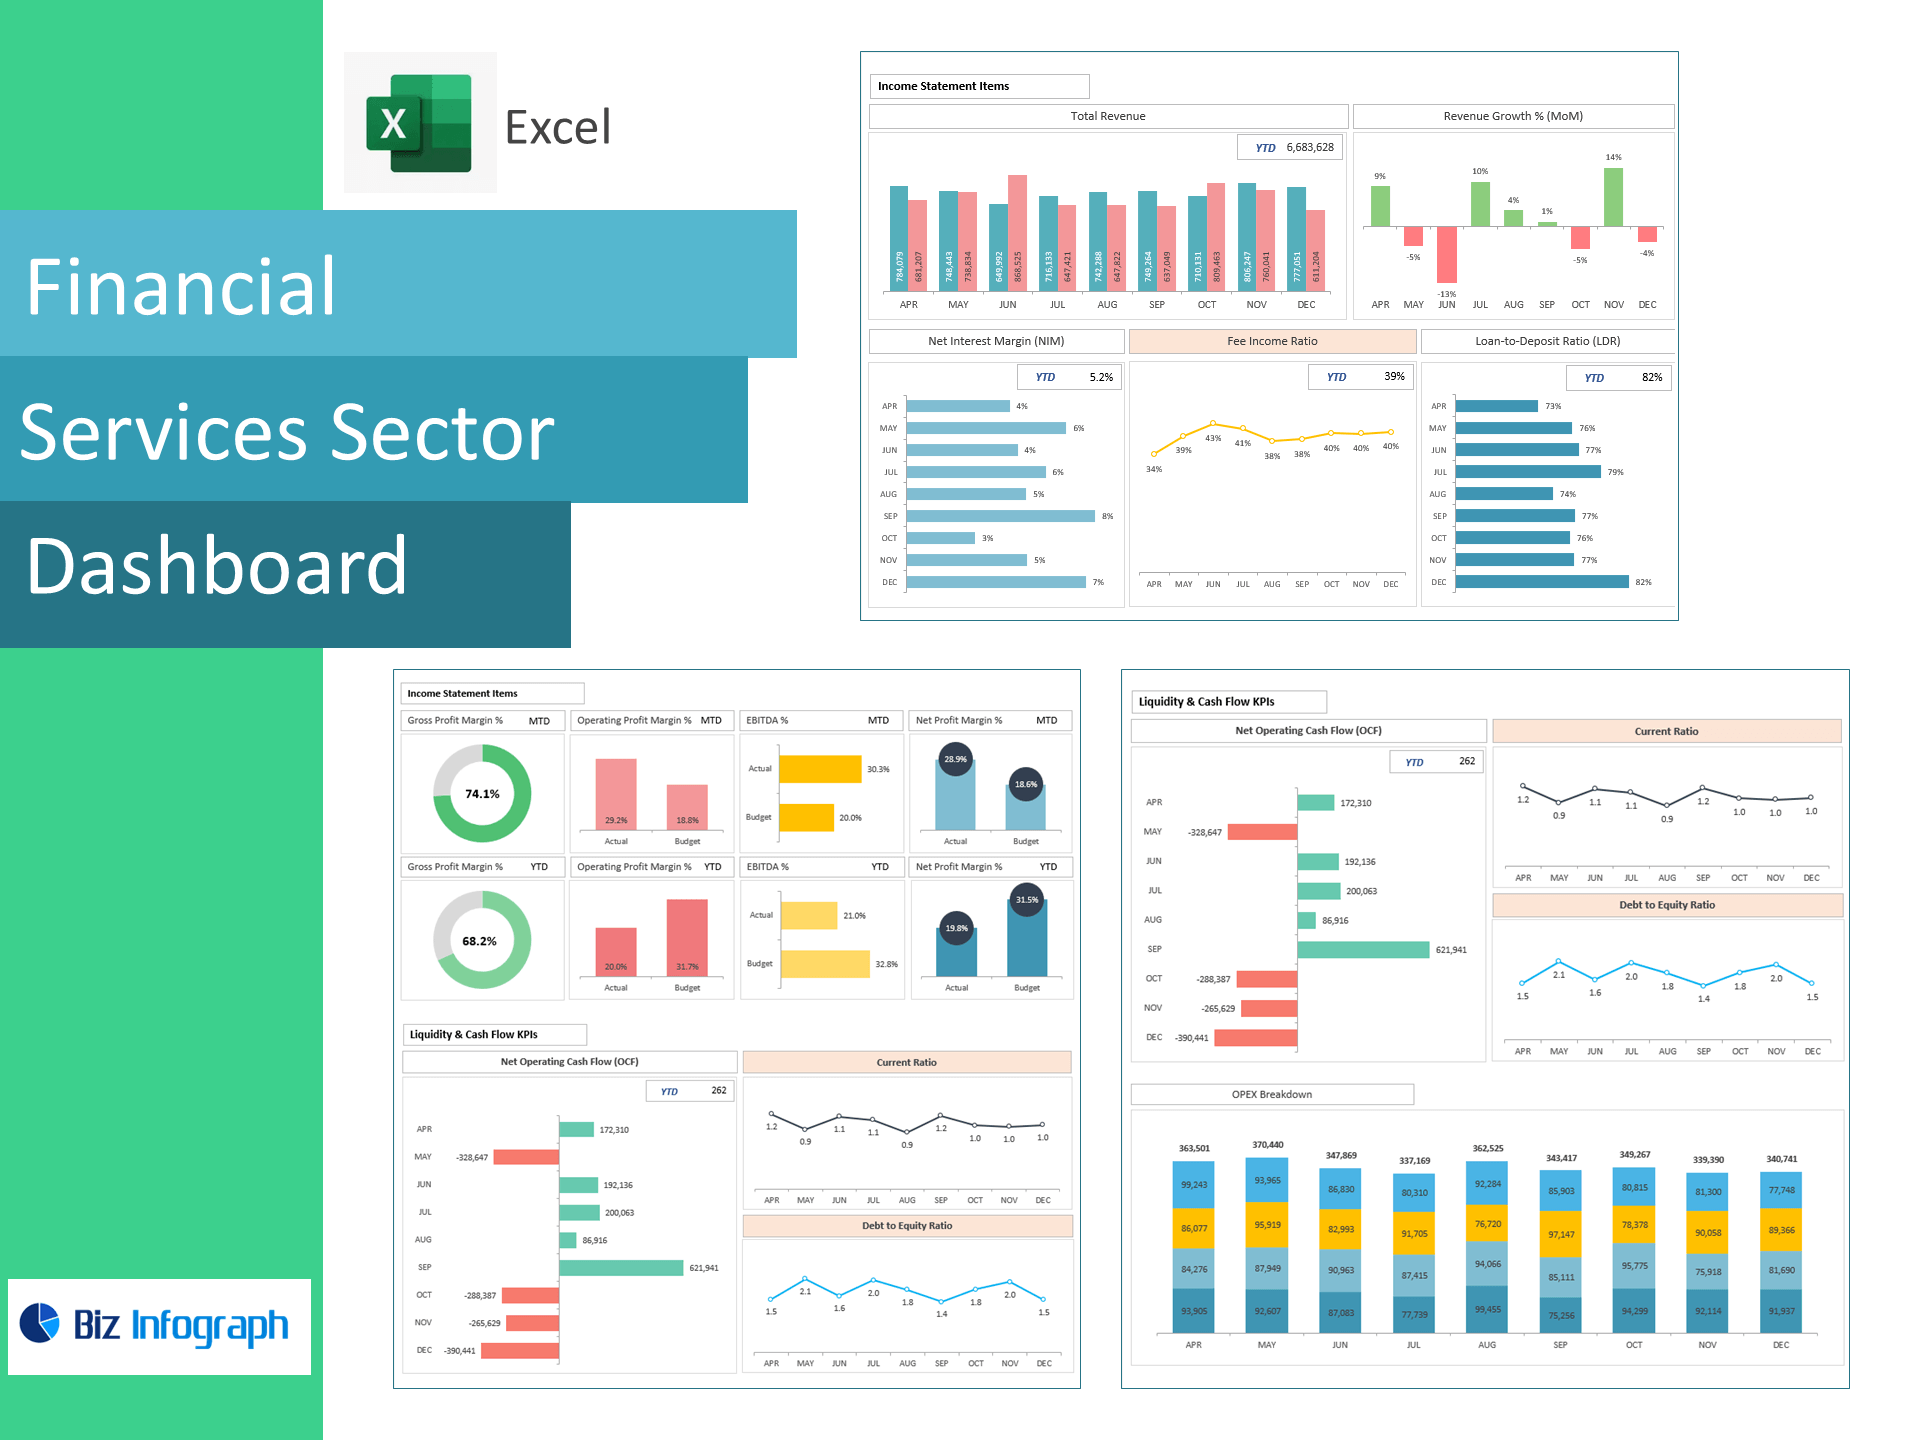
Financial Services Sector — Excel Template
Track margins, liquidity, and banking unit economics—right in Excel. Built for banks, credit unions, and fintech lenders, this template converts monthly financials into a board-ready dashboard showing Revenue Growth, GP/EBIT/EBITDA/Net Profit, OCF, Current Ratio, Debt-to-Equity, Net Interest Margin (NIM), Fee Income Ratio, and Loan-to-Deposit Ratio (LDR)—so you can protect capital and grow returns.
Why finance teams choose this template
-
All-in-one view: Income statement, cash flow, balance-sheet health, and core banking KPIs in one workbook.
-
Actionable margin control: See how OPEX and funding costs impact EBIT/EBITDA and NIM.
-
Capital discipline: Monitor LDR and D/E to balance growth with liquidity and risk.
-
Excel-native: Paste your data and go—no add-ins or BI setup required.
KPIs included (ready-made formulas)
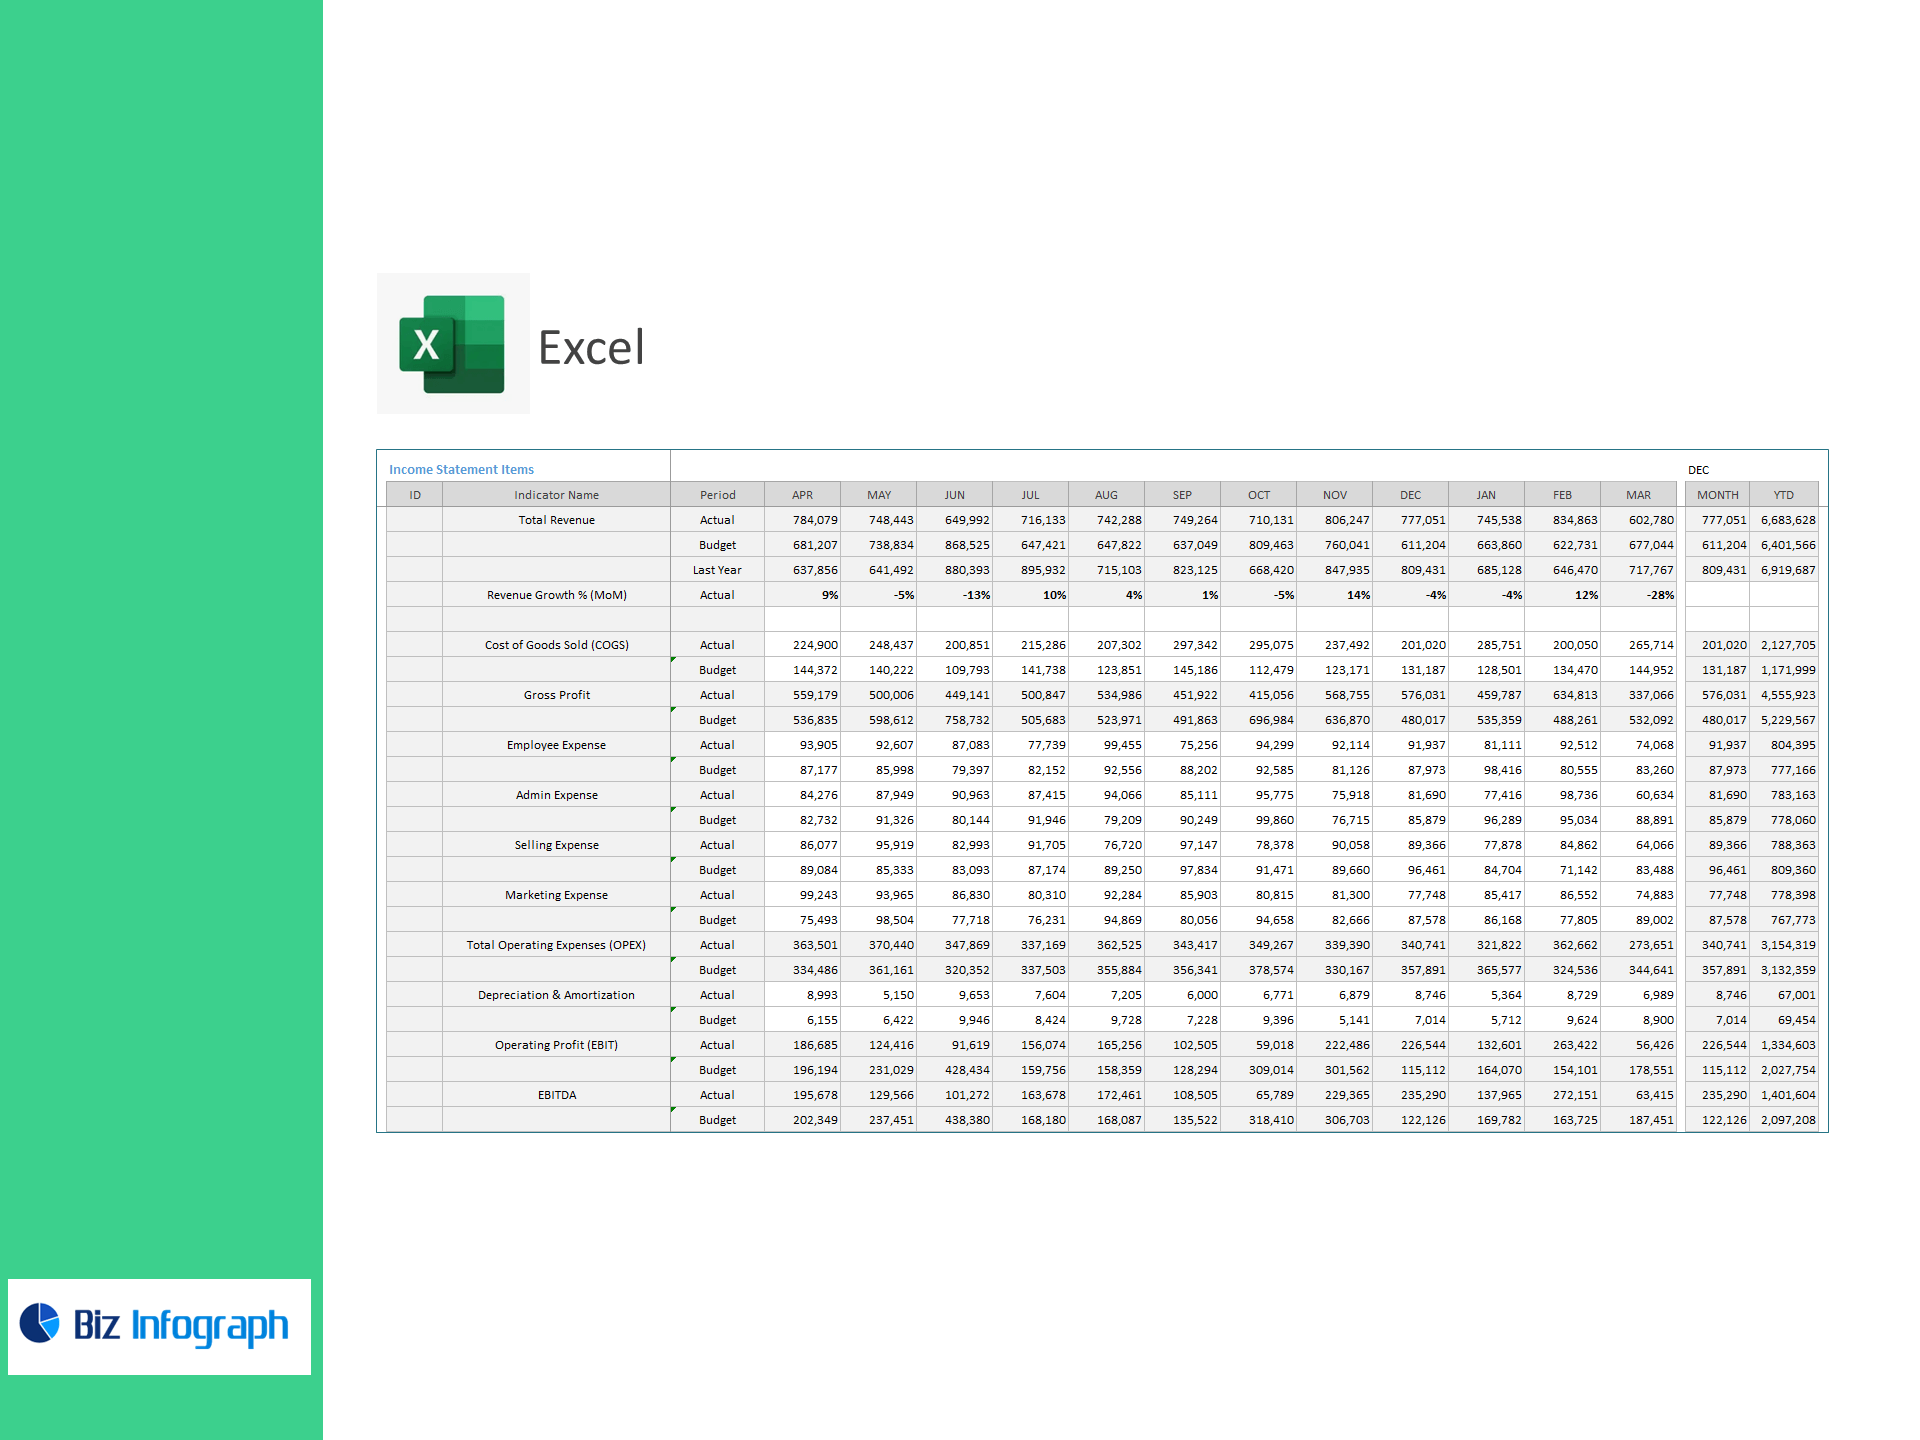
Income Statement & Profitability
-
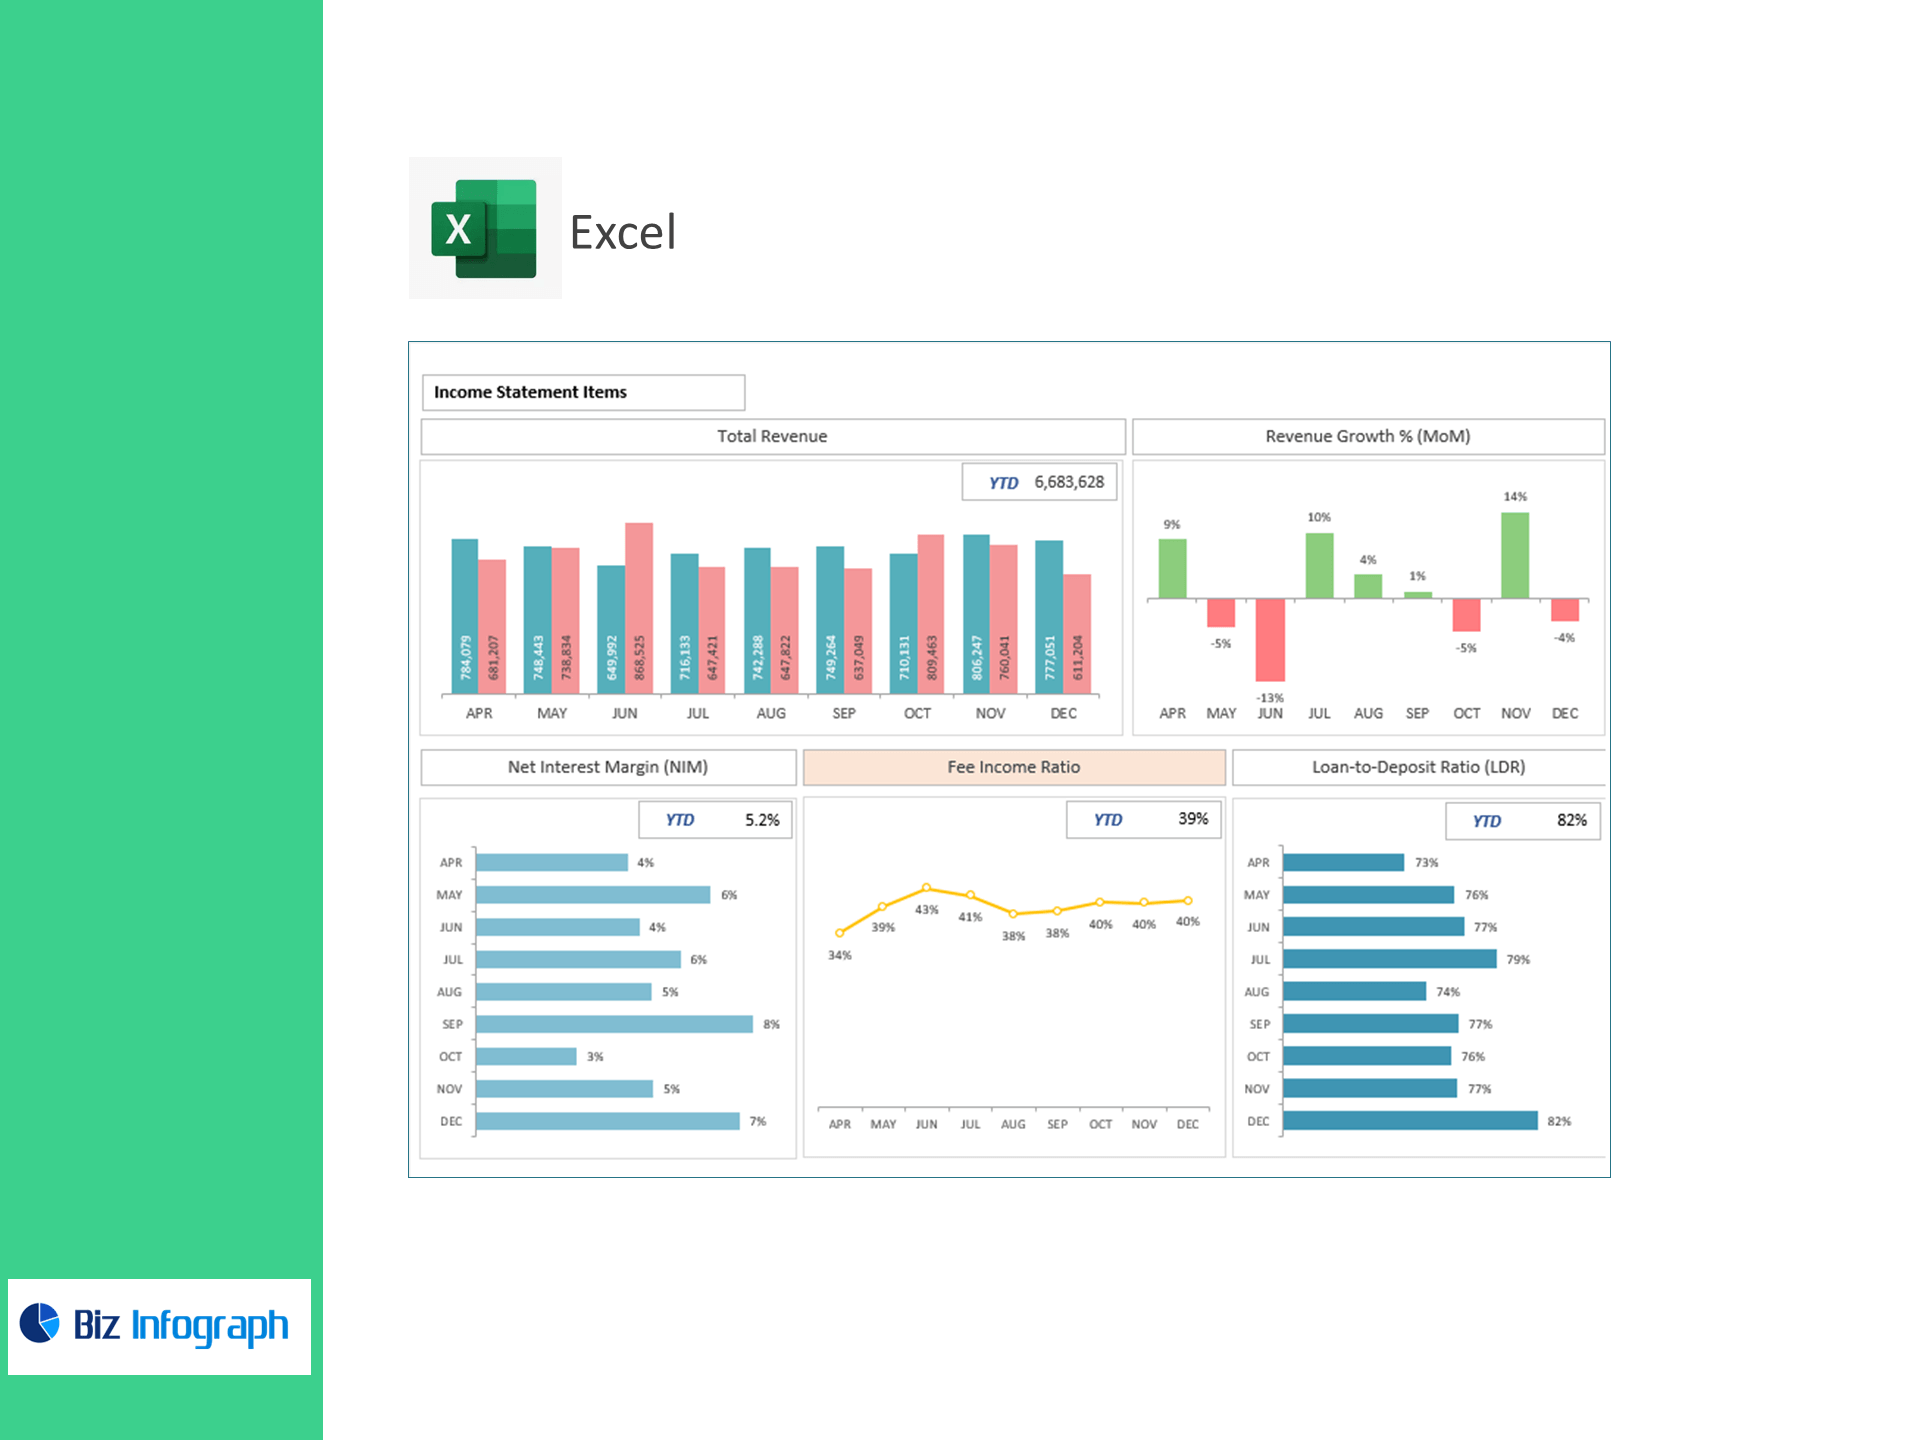
Total Revenue; Revenue Growth % (MoM)
-
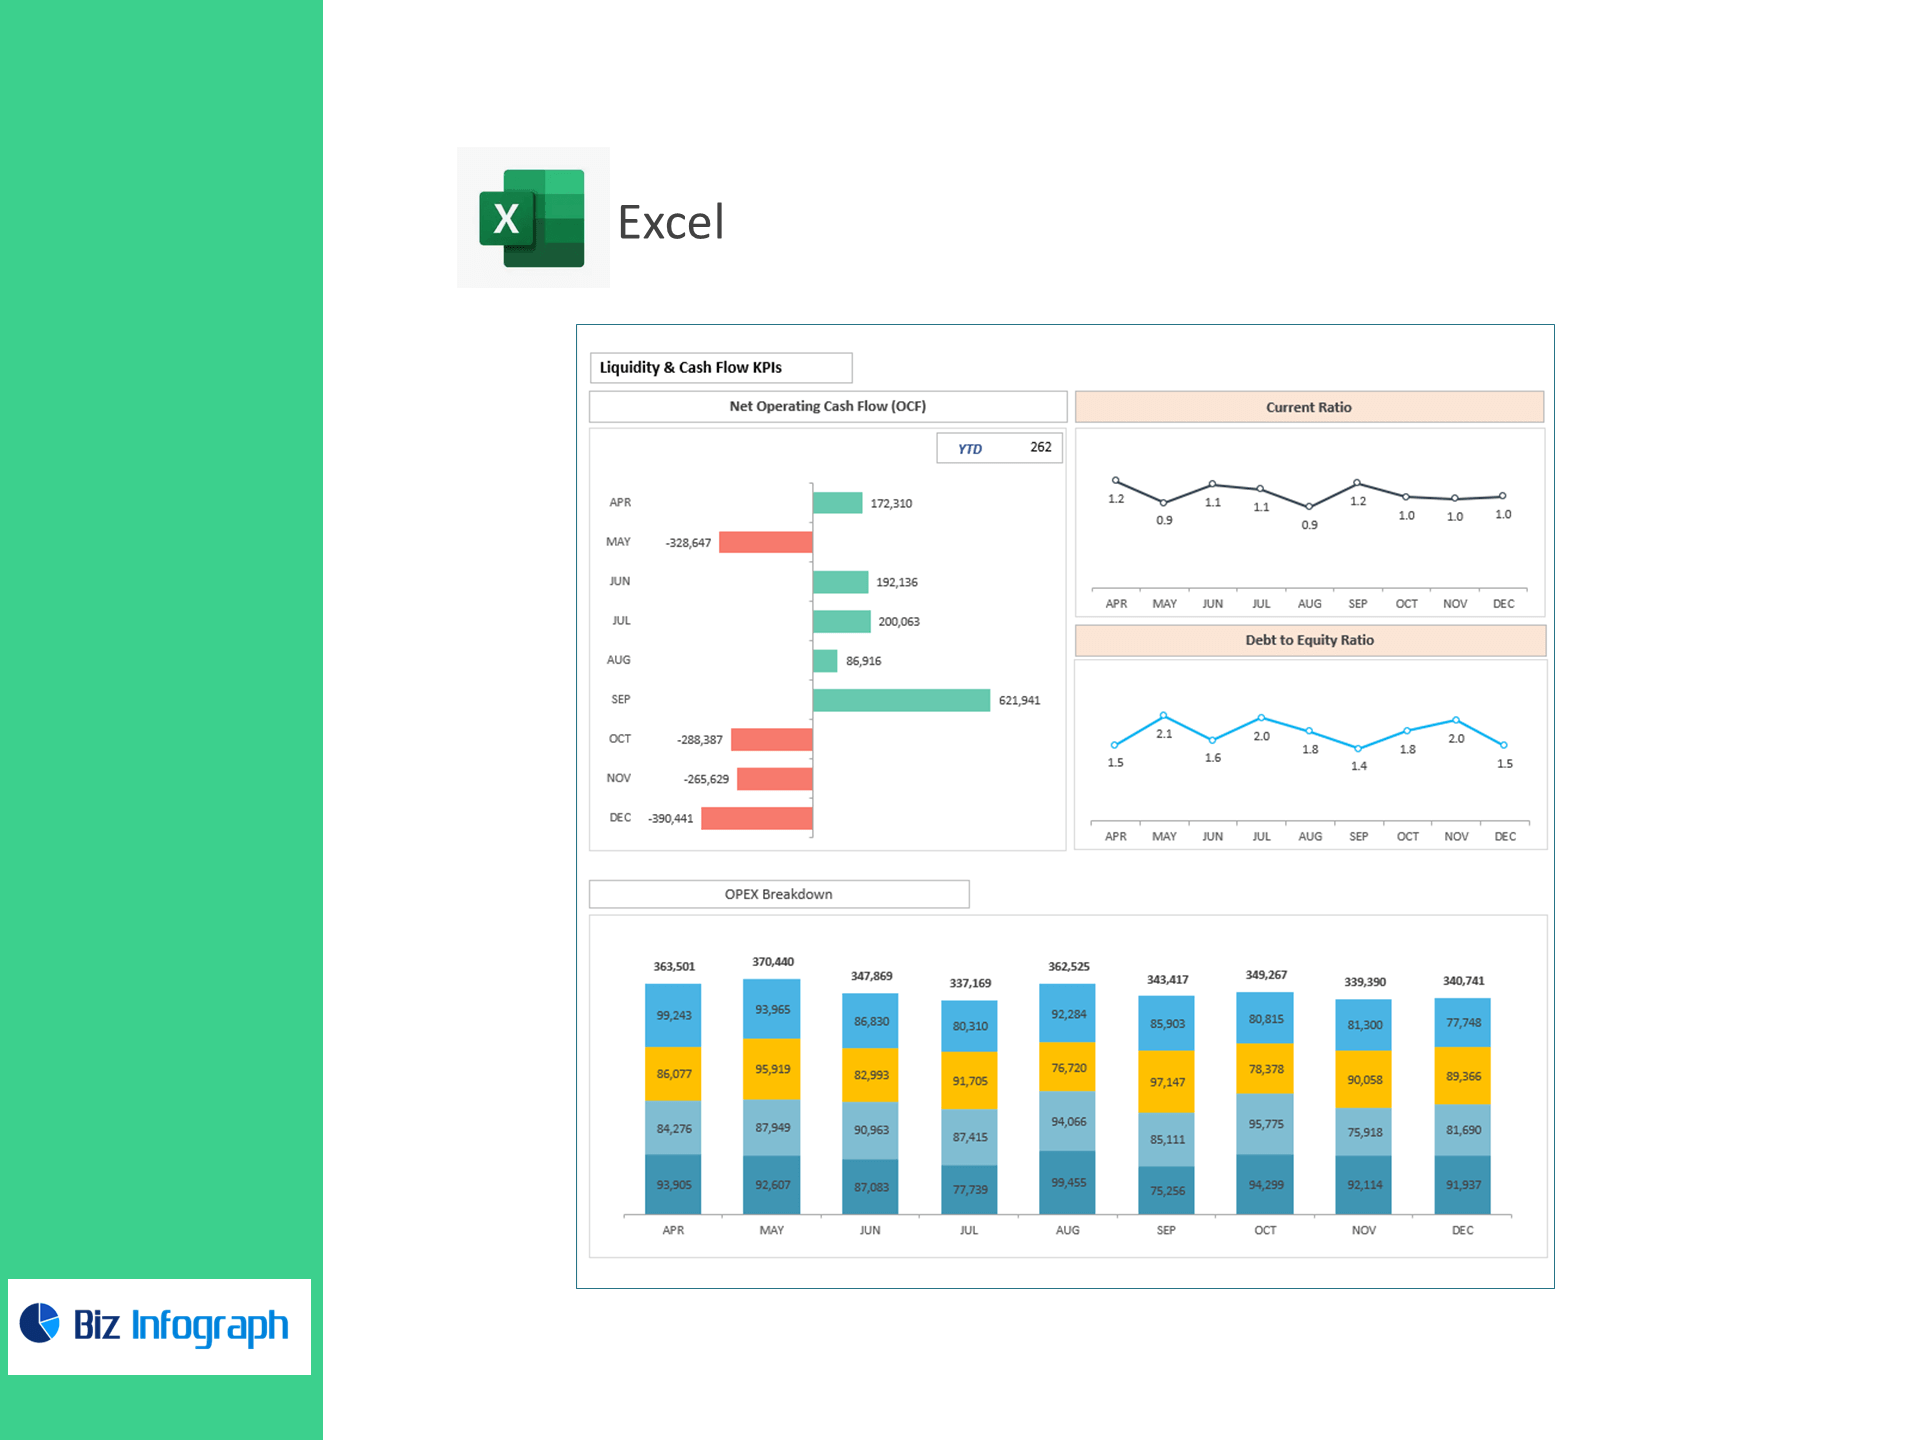
COGS, Gross Profit, Employee/Admin/Selling/Marketing → Total OPEX + OPEX Breakdown
-
Depreciation & Amortization, Operating Profit (EBIT), EBITDA, Interest Expense, Other Inc/(Exp), Taxes, Net Profit
-
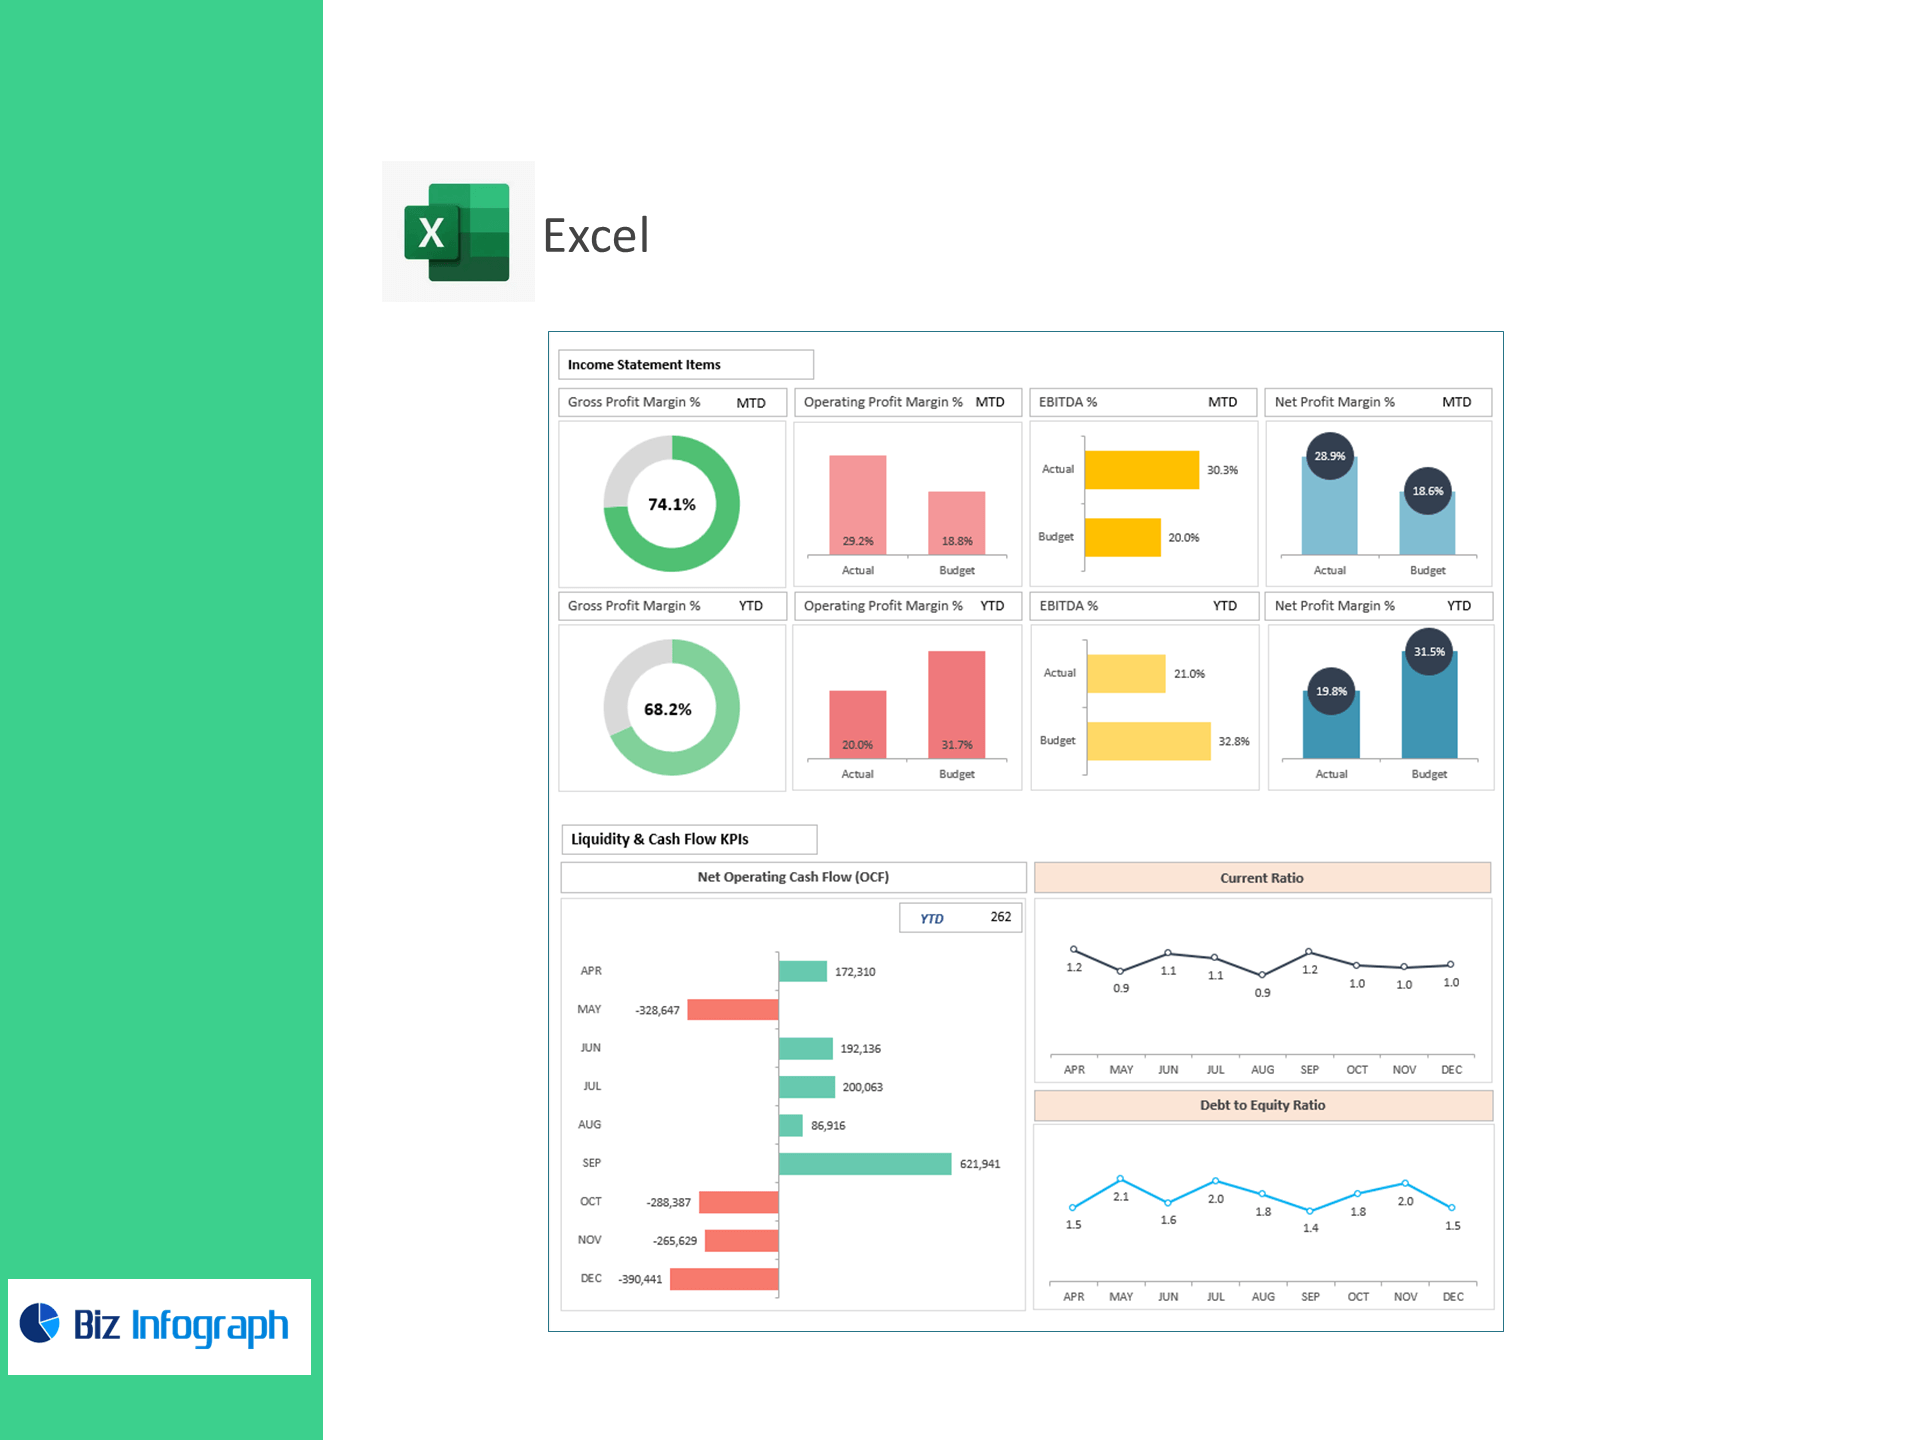
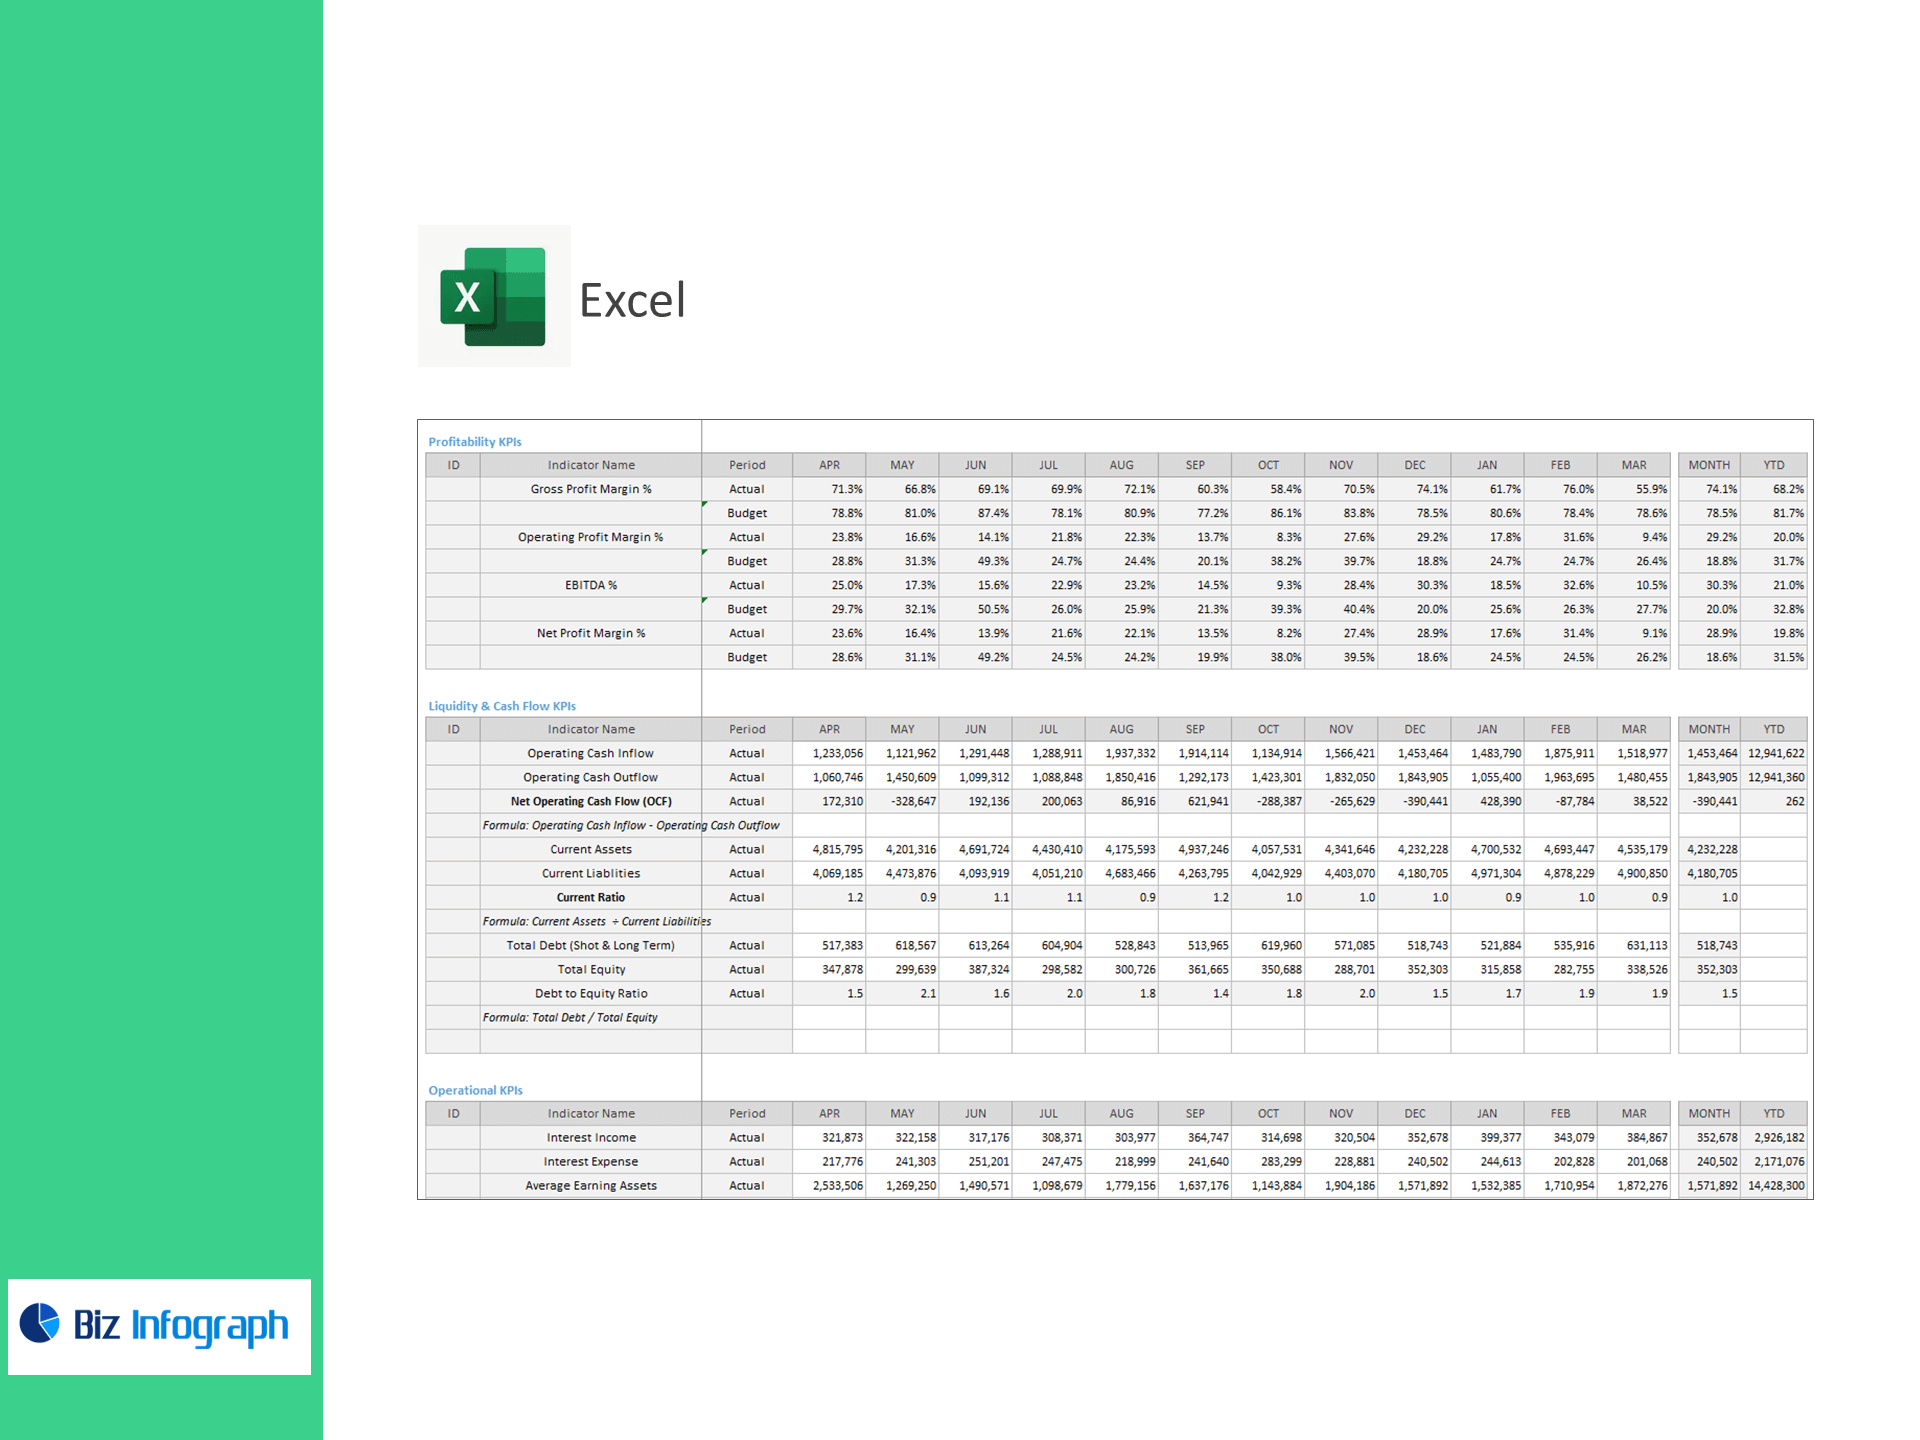
Gross Profit Margin %, Operating Profit Margin %, EBITDA %, Net Profit Margin %
Liquidity & Cash Flow
-
Operating Cash Inflow/Outflow → Net Operating Cash Flow (OCF) = Inflow − Outflow
-
Current Ratio = Current Assets ÷ Current Liabilities
-
Debt-to-Equity = Total Debt ÷ Total Equity
Operational (Banking)
-
Net Interest Margin (NIM) = (Interest Income − Interest Expense) ÷ Average Earning Assets
-
Fee Income Ratio (%) = Fee-Based Income ÷ Total Revenue × 100
-
Loan-to-Deposit Ratio (LDR %) = Total Loans ÷ Total Deposits × 100
What’s inside
-
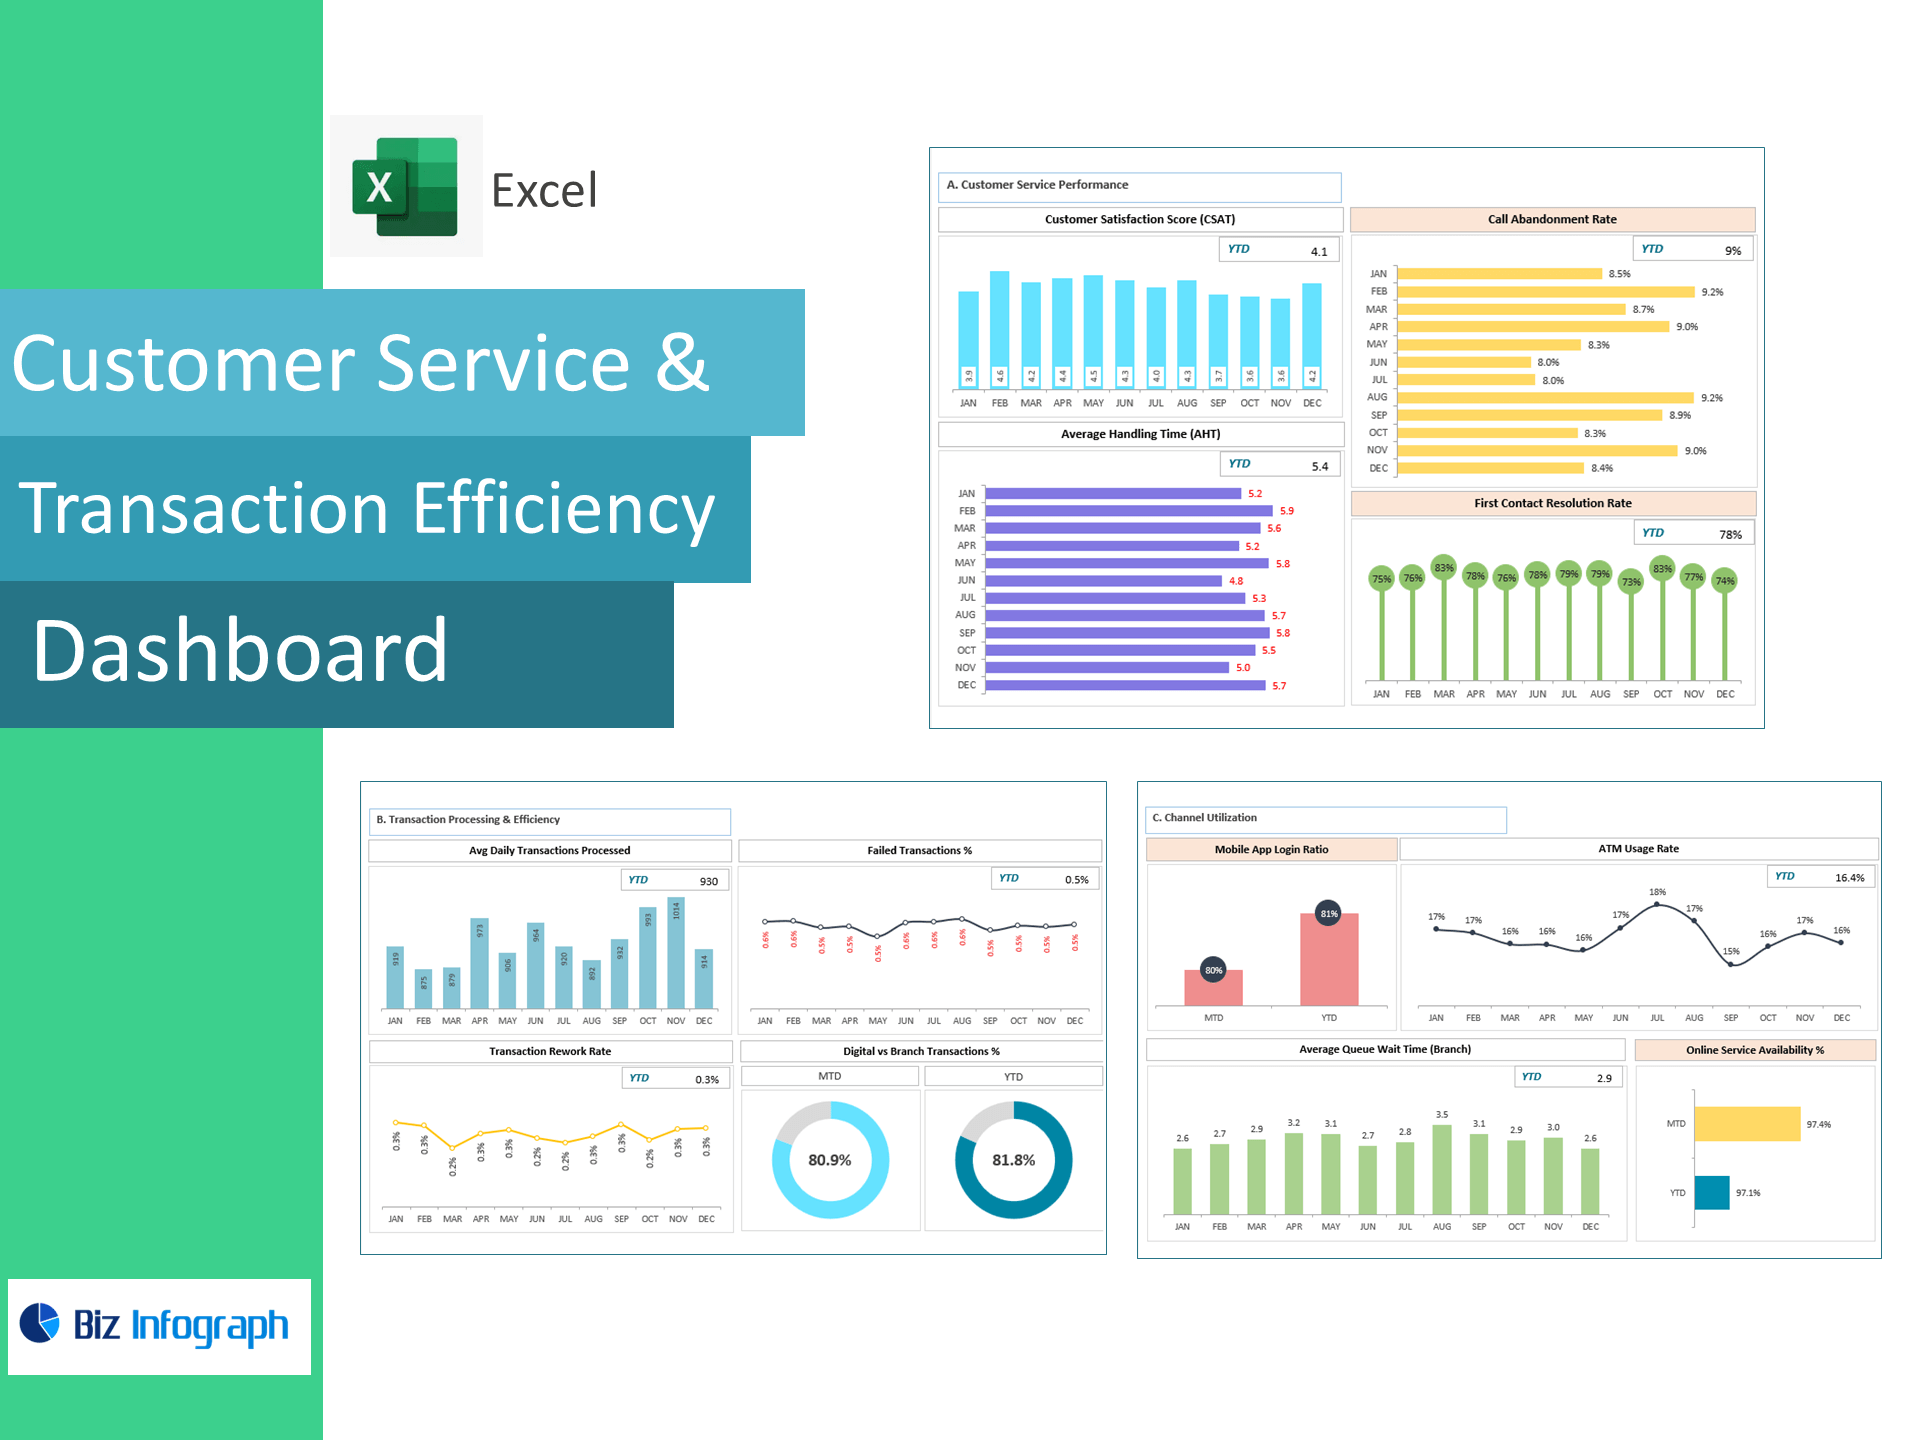
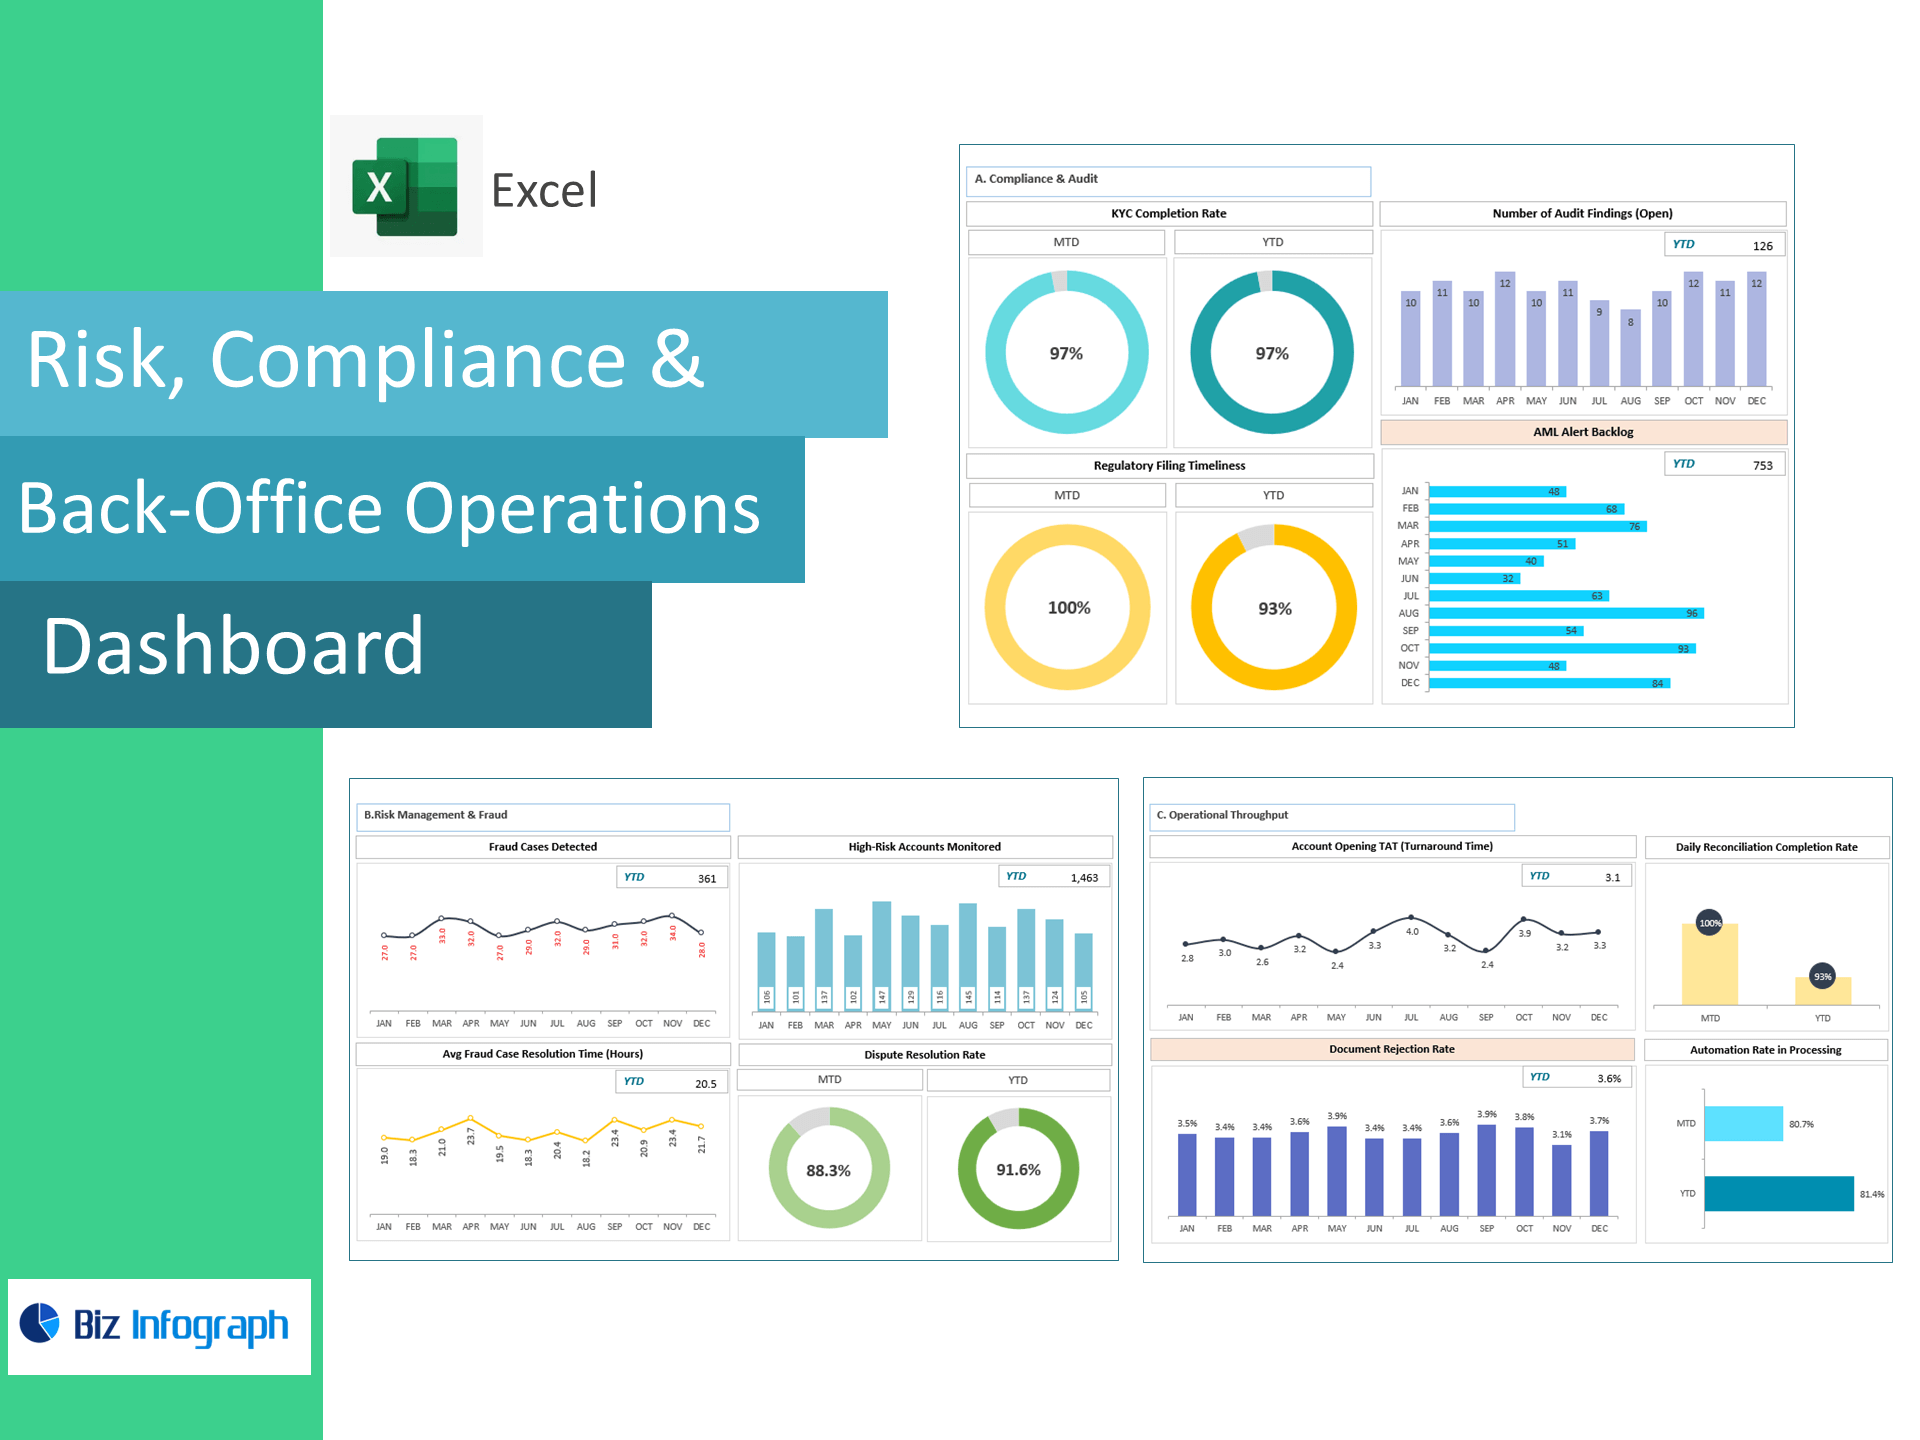
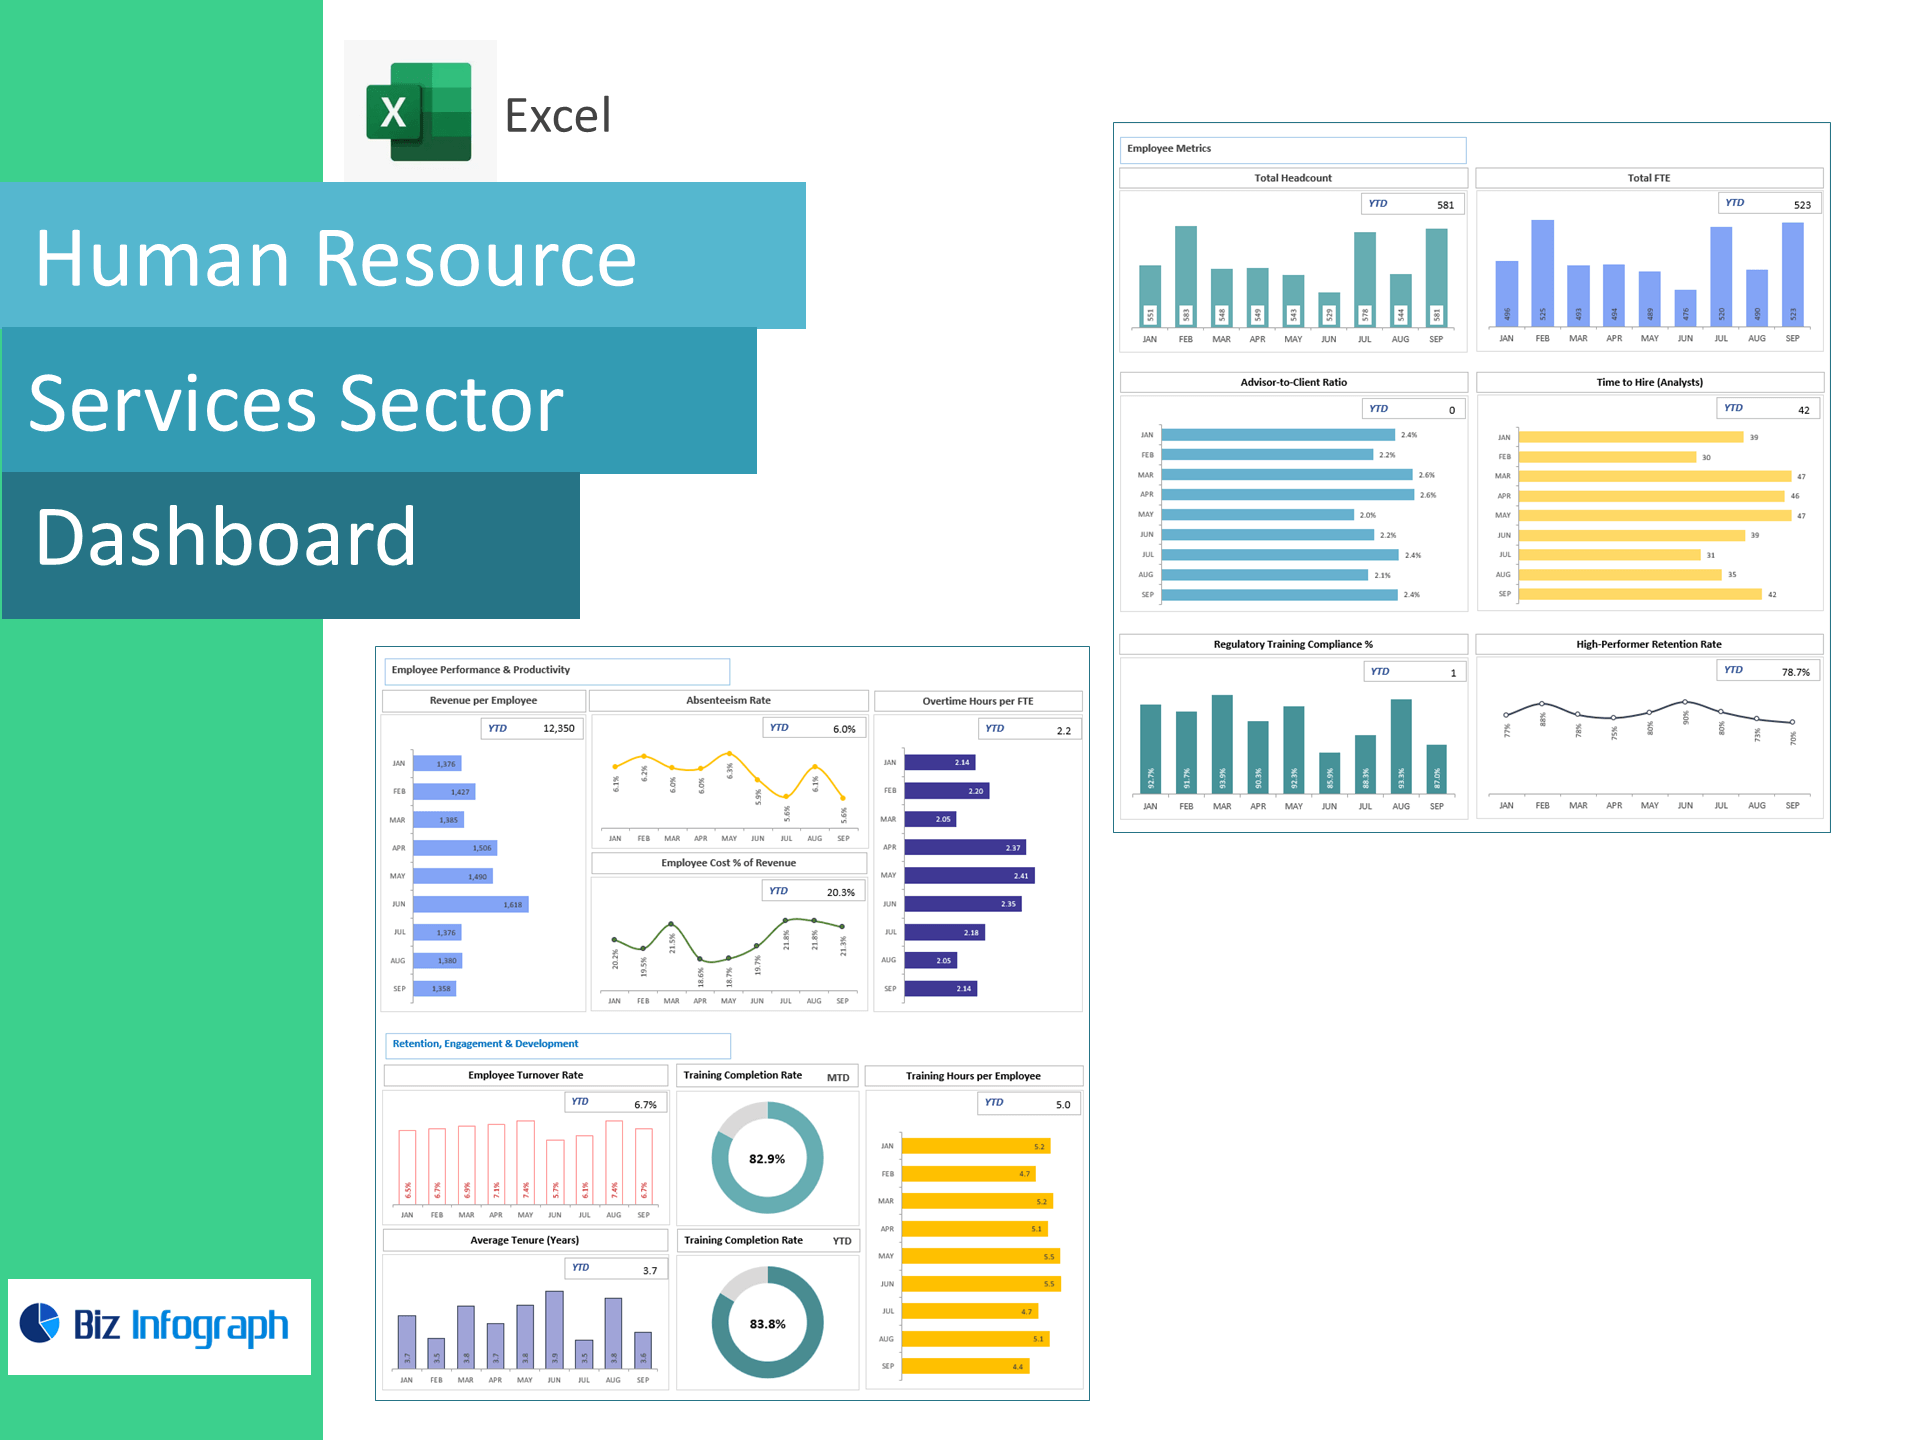
Executive Dashboard: Tiles for Revenue Growth, GP/EBIT/EBITDA/Net Profit, OCF, Current Ratio, D/E, NIM, Fee Ratio, and LDR with trend & variance to target.
-
OPEX & Funding Analyzer: Drill into operating costs and interest expense drivers.
-
Balance-Sheet Panel: Loans, deposits, liquidity, and leverage at a glance.
-
Targets & Assumptions: Enter KPI targets; automatic Above/Below Target highlighting.
-
Clean Data Sheets: Import-ready tables for IS, Cash Flow, Balance Sheet, Interest Income/Expense, Fees, Loans & Deposits.
How it works
-
Paste monthly actuals (or CSV exports) into the provided tables.
-
Set margin, liquidity, and capital targets.
-
Review visuals to optimize pricing, costs, and balance-sheet mix.
Benefits
-
Protect margins & cash: Monitor EBITDA %, NIM, and OCF in real time.
-
Strengthen the balance sheet: Track Current Ratio and D/E for resilience.
-
Grow sensibly: Use LDR and Fee Ratio to guide product and funding strategy.
-
Decide faster: Investor-ready visuals with transparent formulas.
For ready-to-use Dashboard Templates: