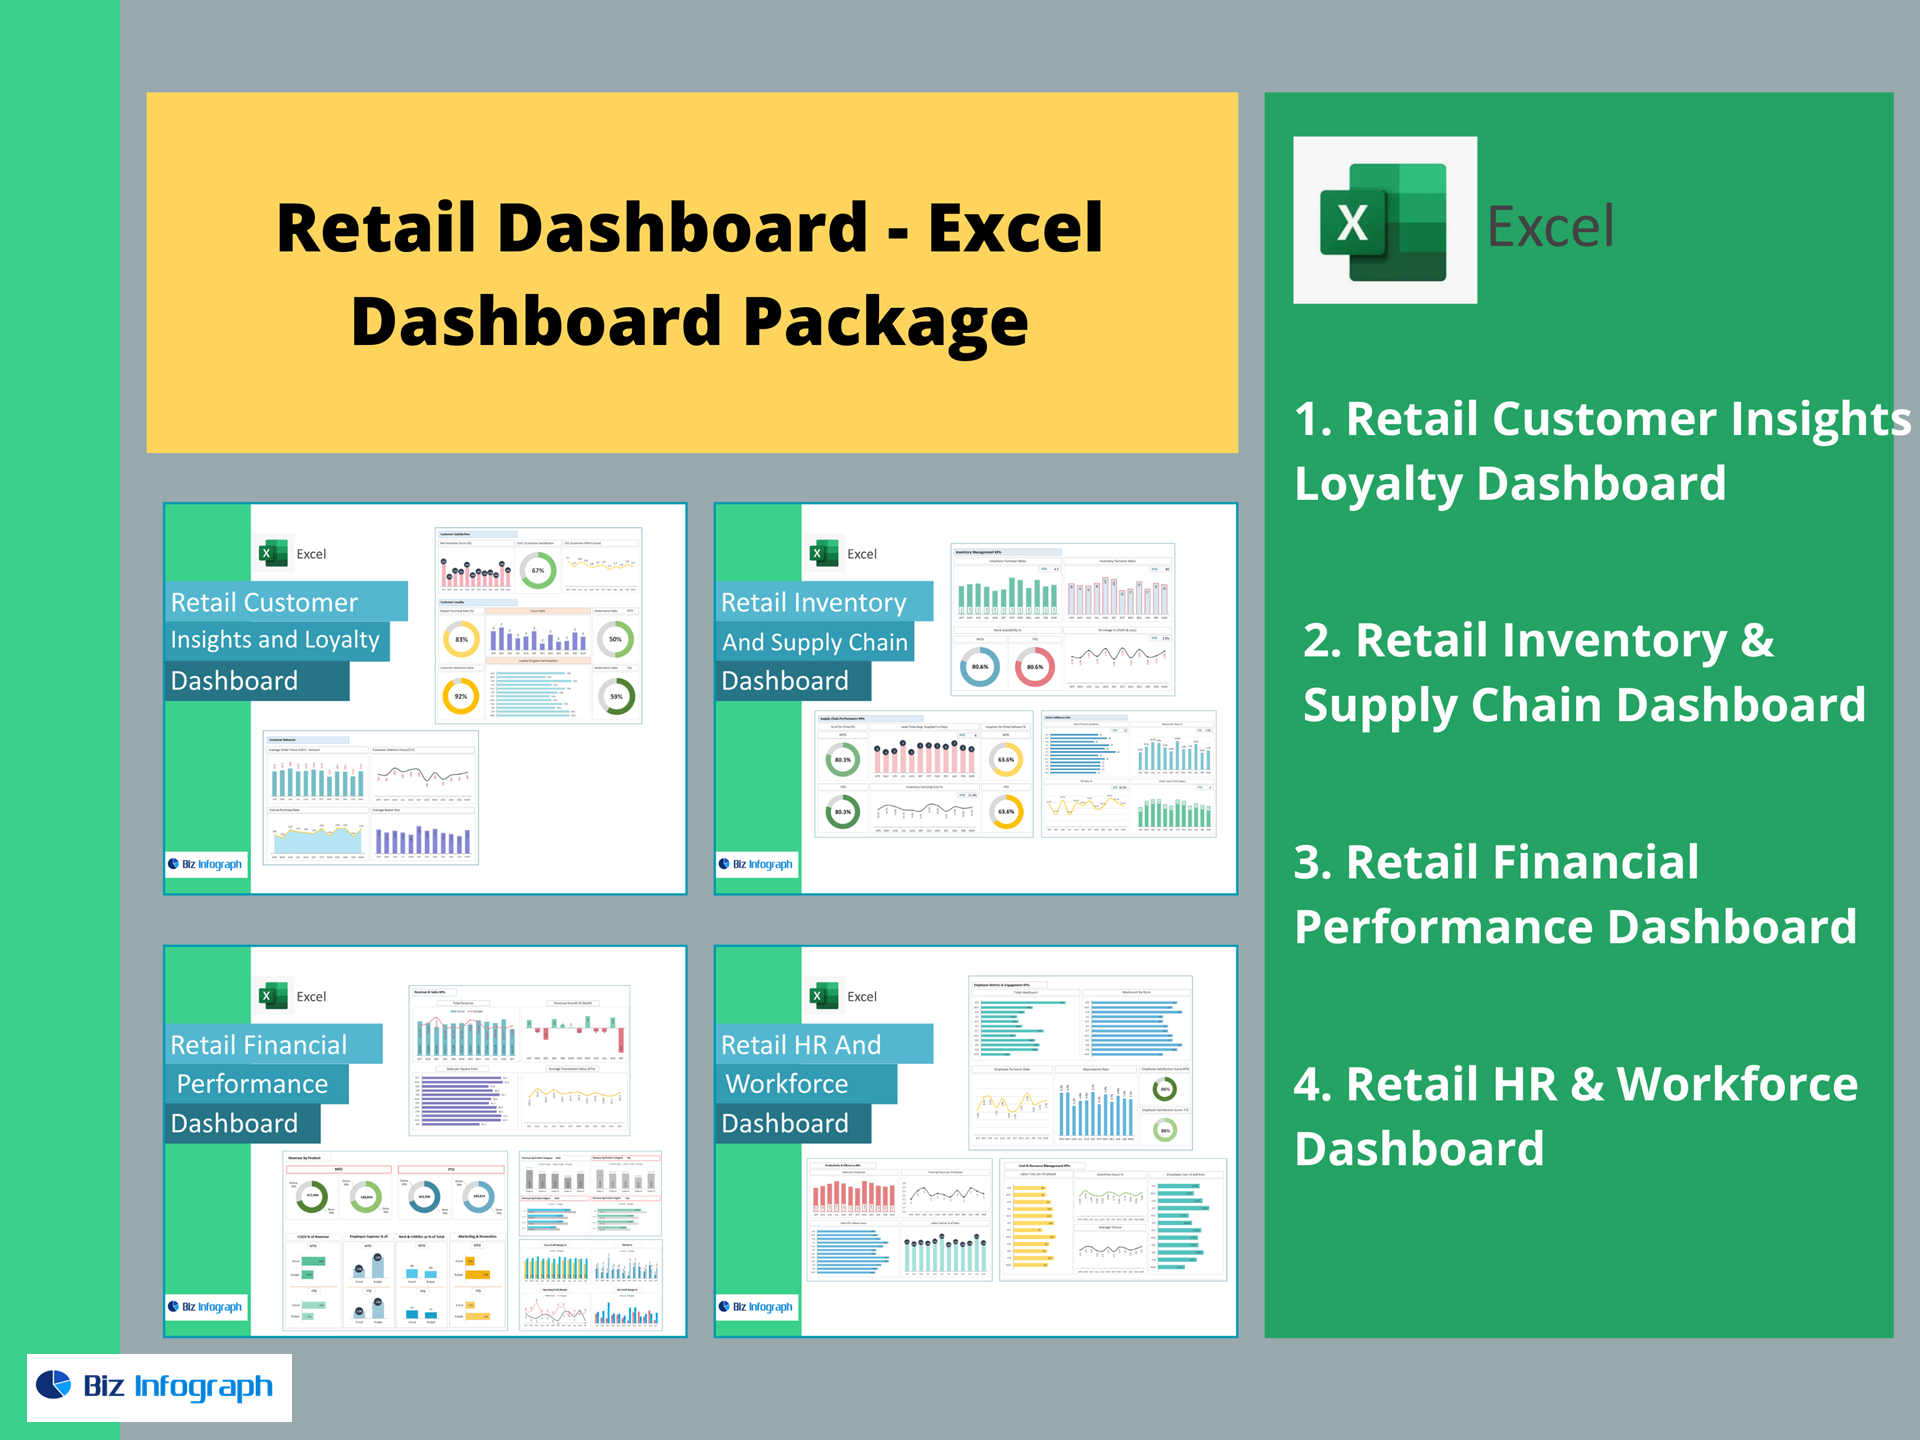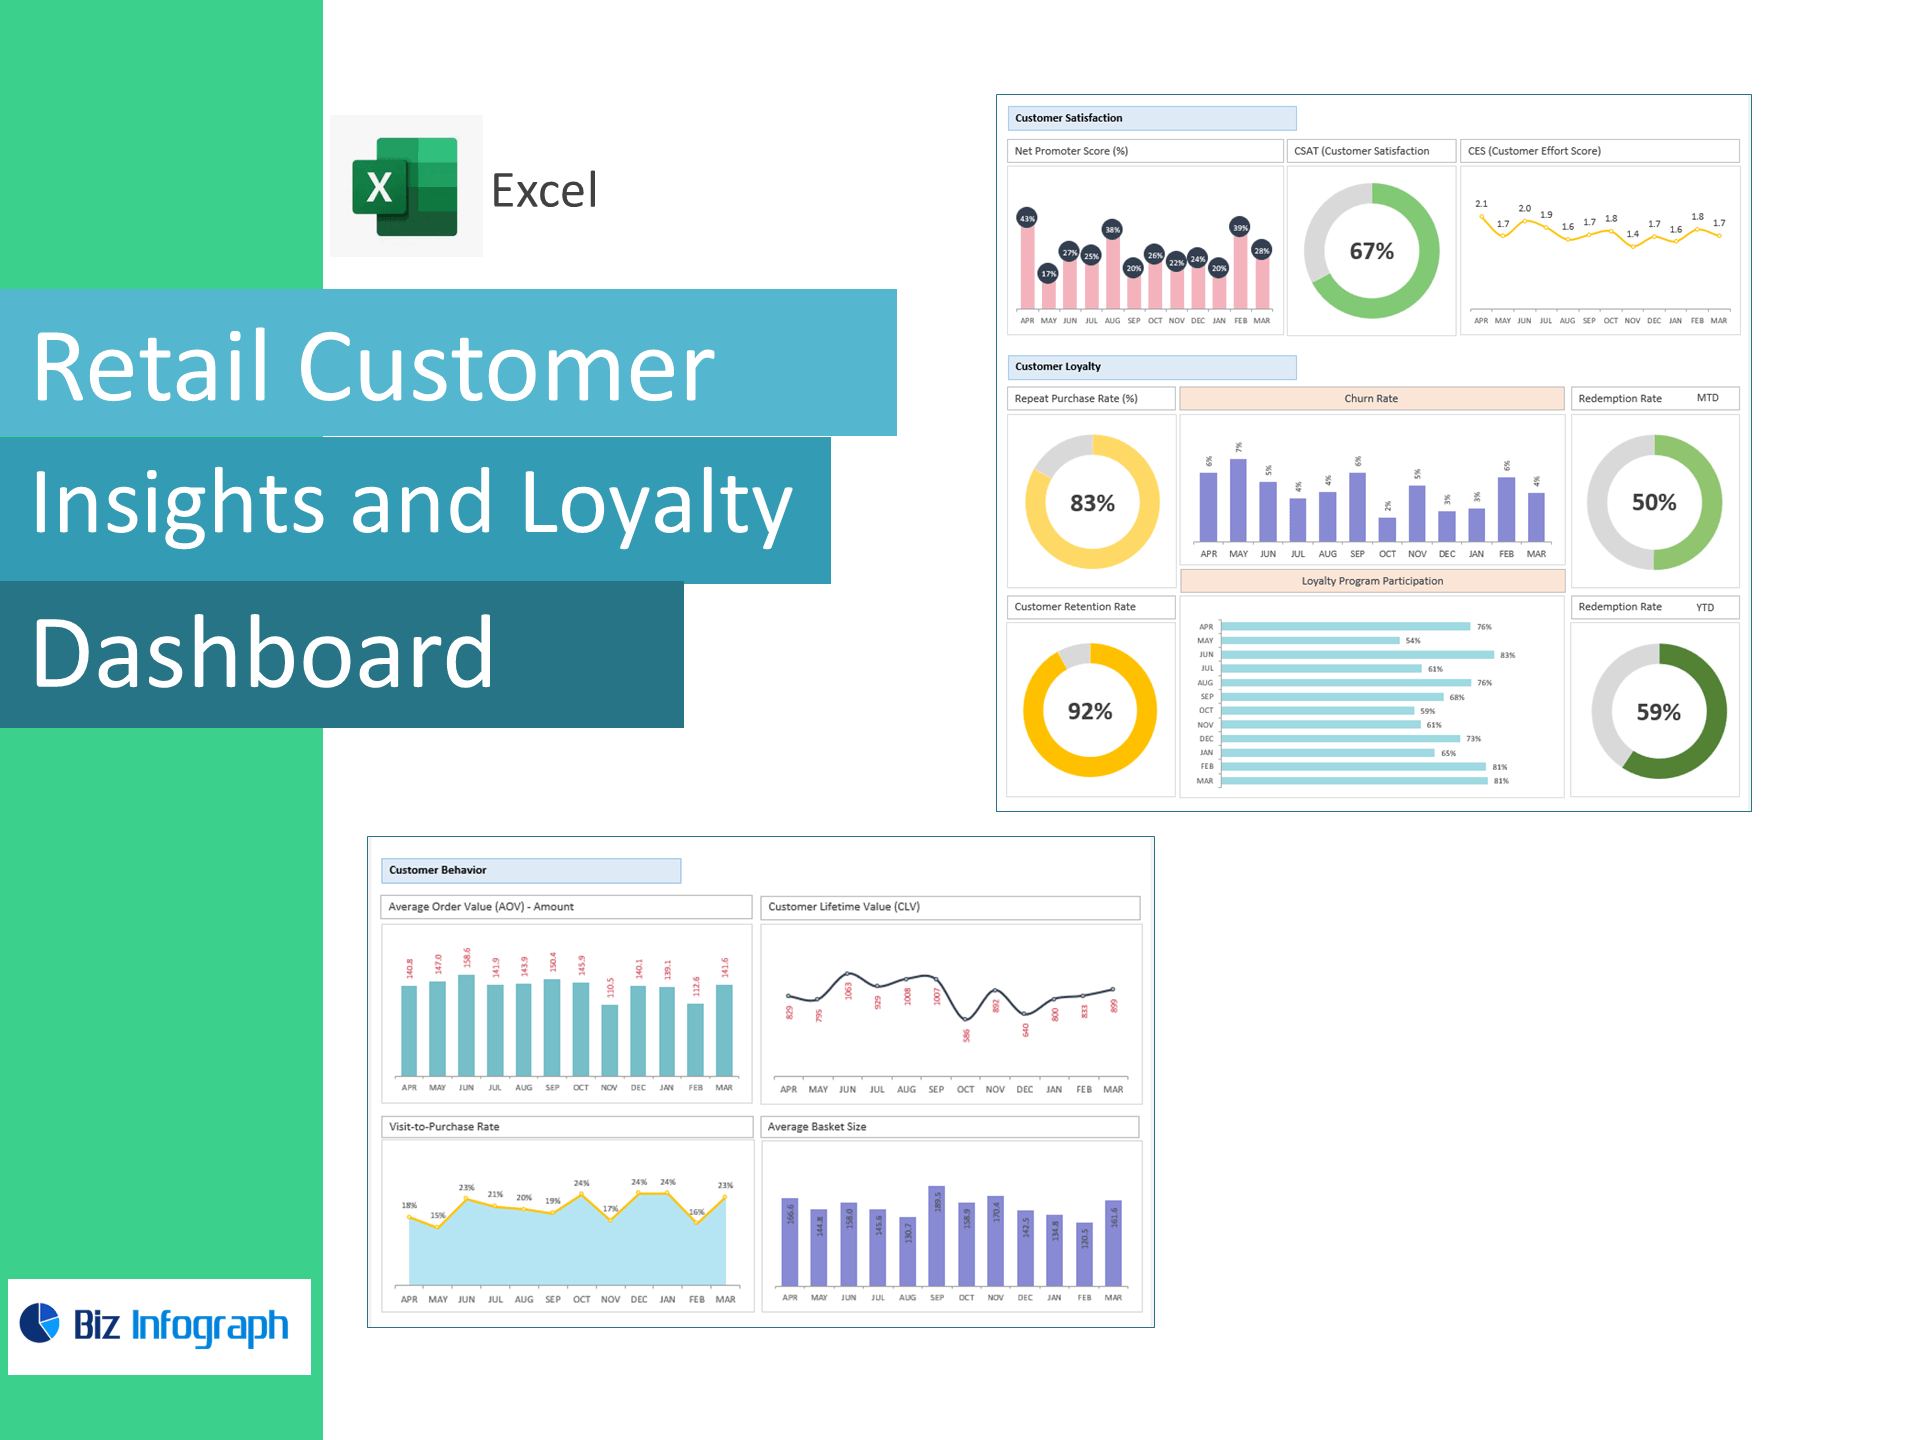
Retail Customer Insights & Loyalty Dashboard — Excel Template
Turn raw retail data into customer growth. This Excel template tracks the KPIs that matter—AOV, CLV, NPS, CSAT, CES, retention, churn, and loyalty redemption—so you can increase repeat purchases, improve satisfaction, and maximize lifetime value without a BI tool.
Why retailers choose this template
-
All-in-one customer analytics: Unify sales, visits, survey scores, and loyalty data in one dashboard.
-
Built for action: Identify quick wins to lift Average Order Value (AOV), Purchase Frequency, and Customer Lifetime Value (CLV).
-
Retention-first: Monitor Repeat Purchase Rate, Customer Retention Rate, and Churn to keep shoppers coming back.
-
Proof of loyalty ROI: Track Loyalty Program Participation and Reward Redemption Rate to optimize campaigns.
KPIs included (with ready-to-use formulas)
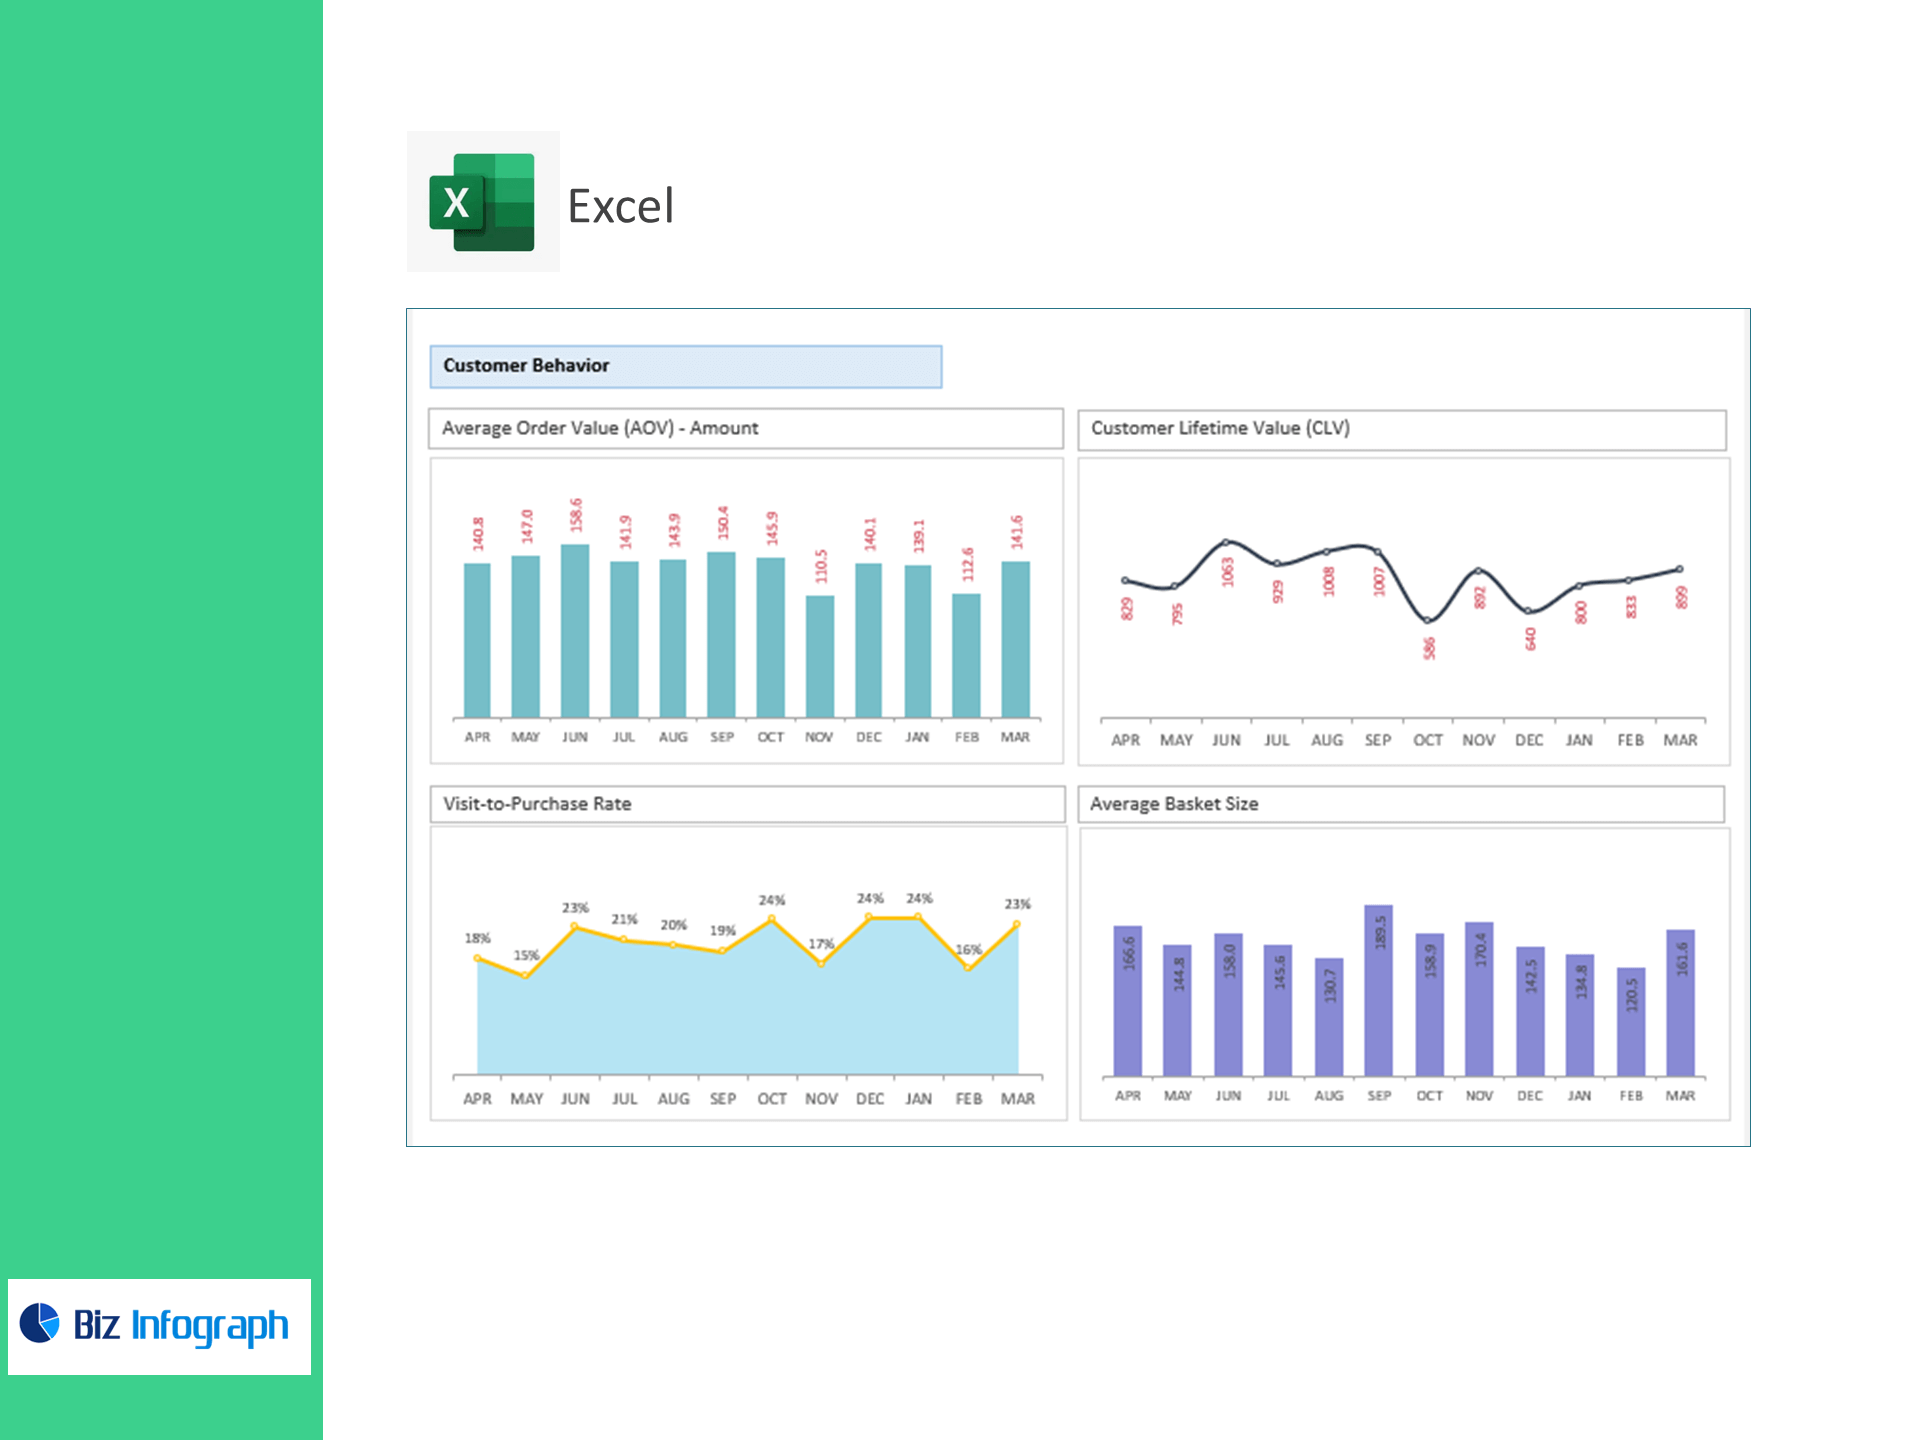
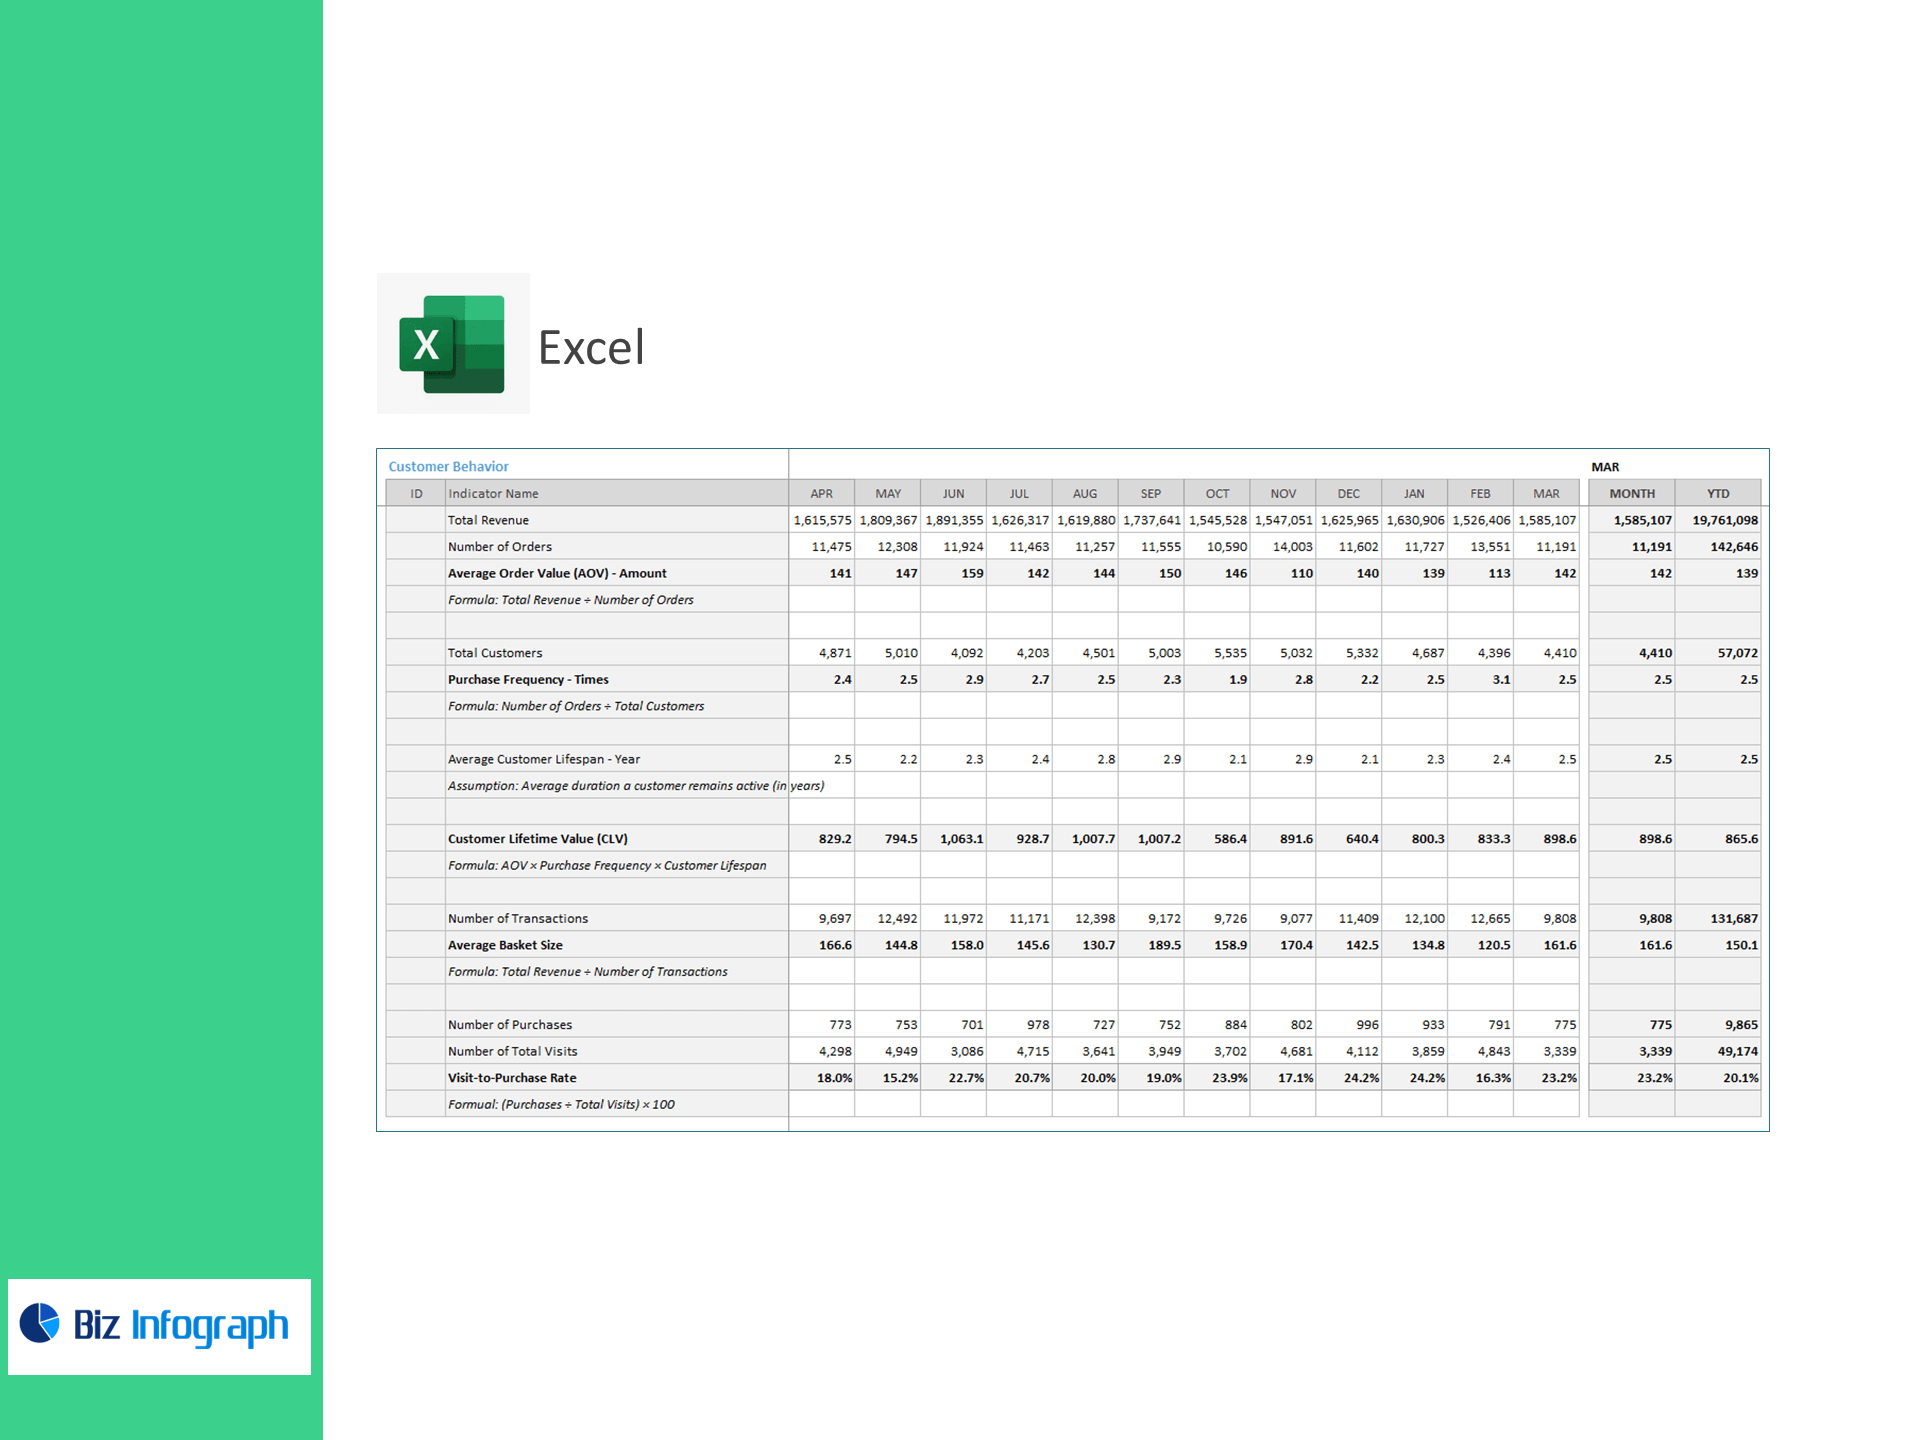
Customer Behavior
-
Total Revenue, Number of Orders
-
AOV = Total Revenue ÷ Number of Orders
-
Total Customers
-
Purchase Frequency = Number of Orders ÷ Total Customers
-
Average Customer Lifespan (editable assumption, years)
-
CLV = AOV × Purchase Frequency × Customer Lifespan
-
Number of Transactions, Average Basket Size = Revenue ÷ Transactions
-
Purchases, Total Visits, Visit-to-Purchase Rate = (Purchases ÷ Visits) × 100
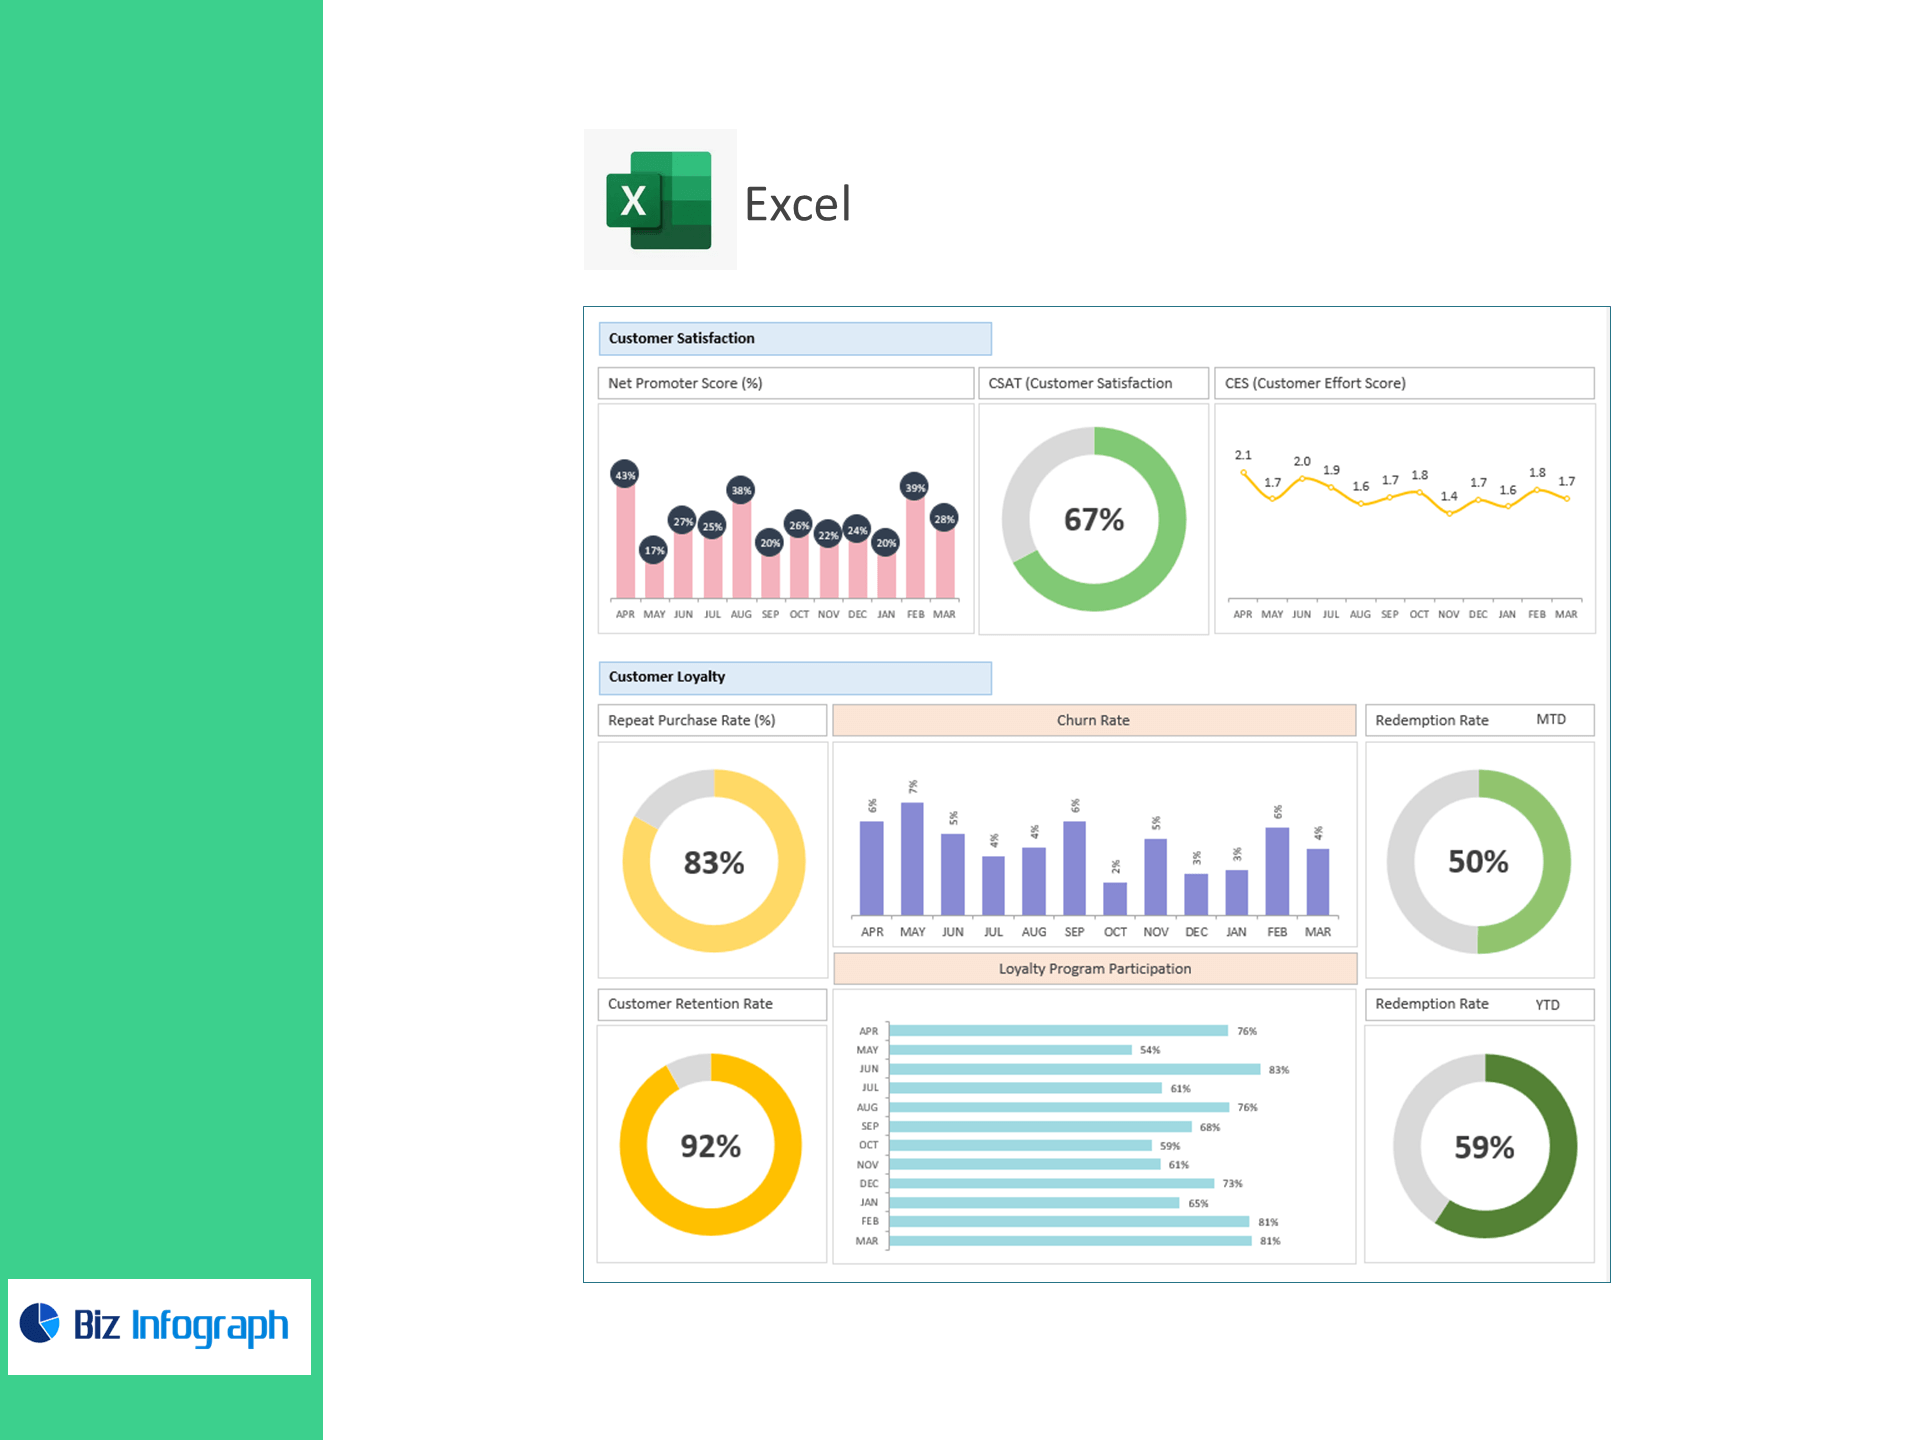
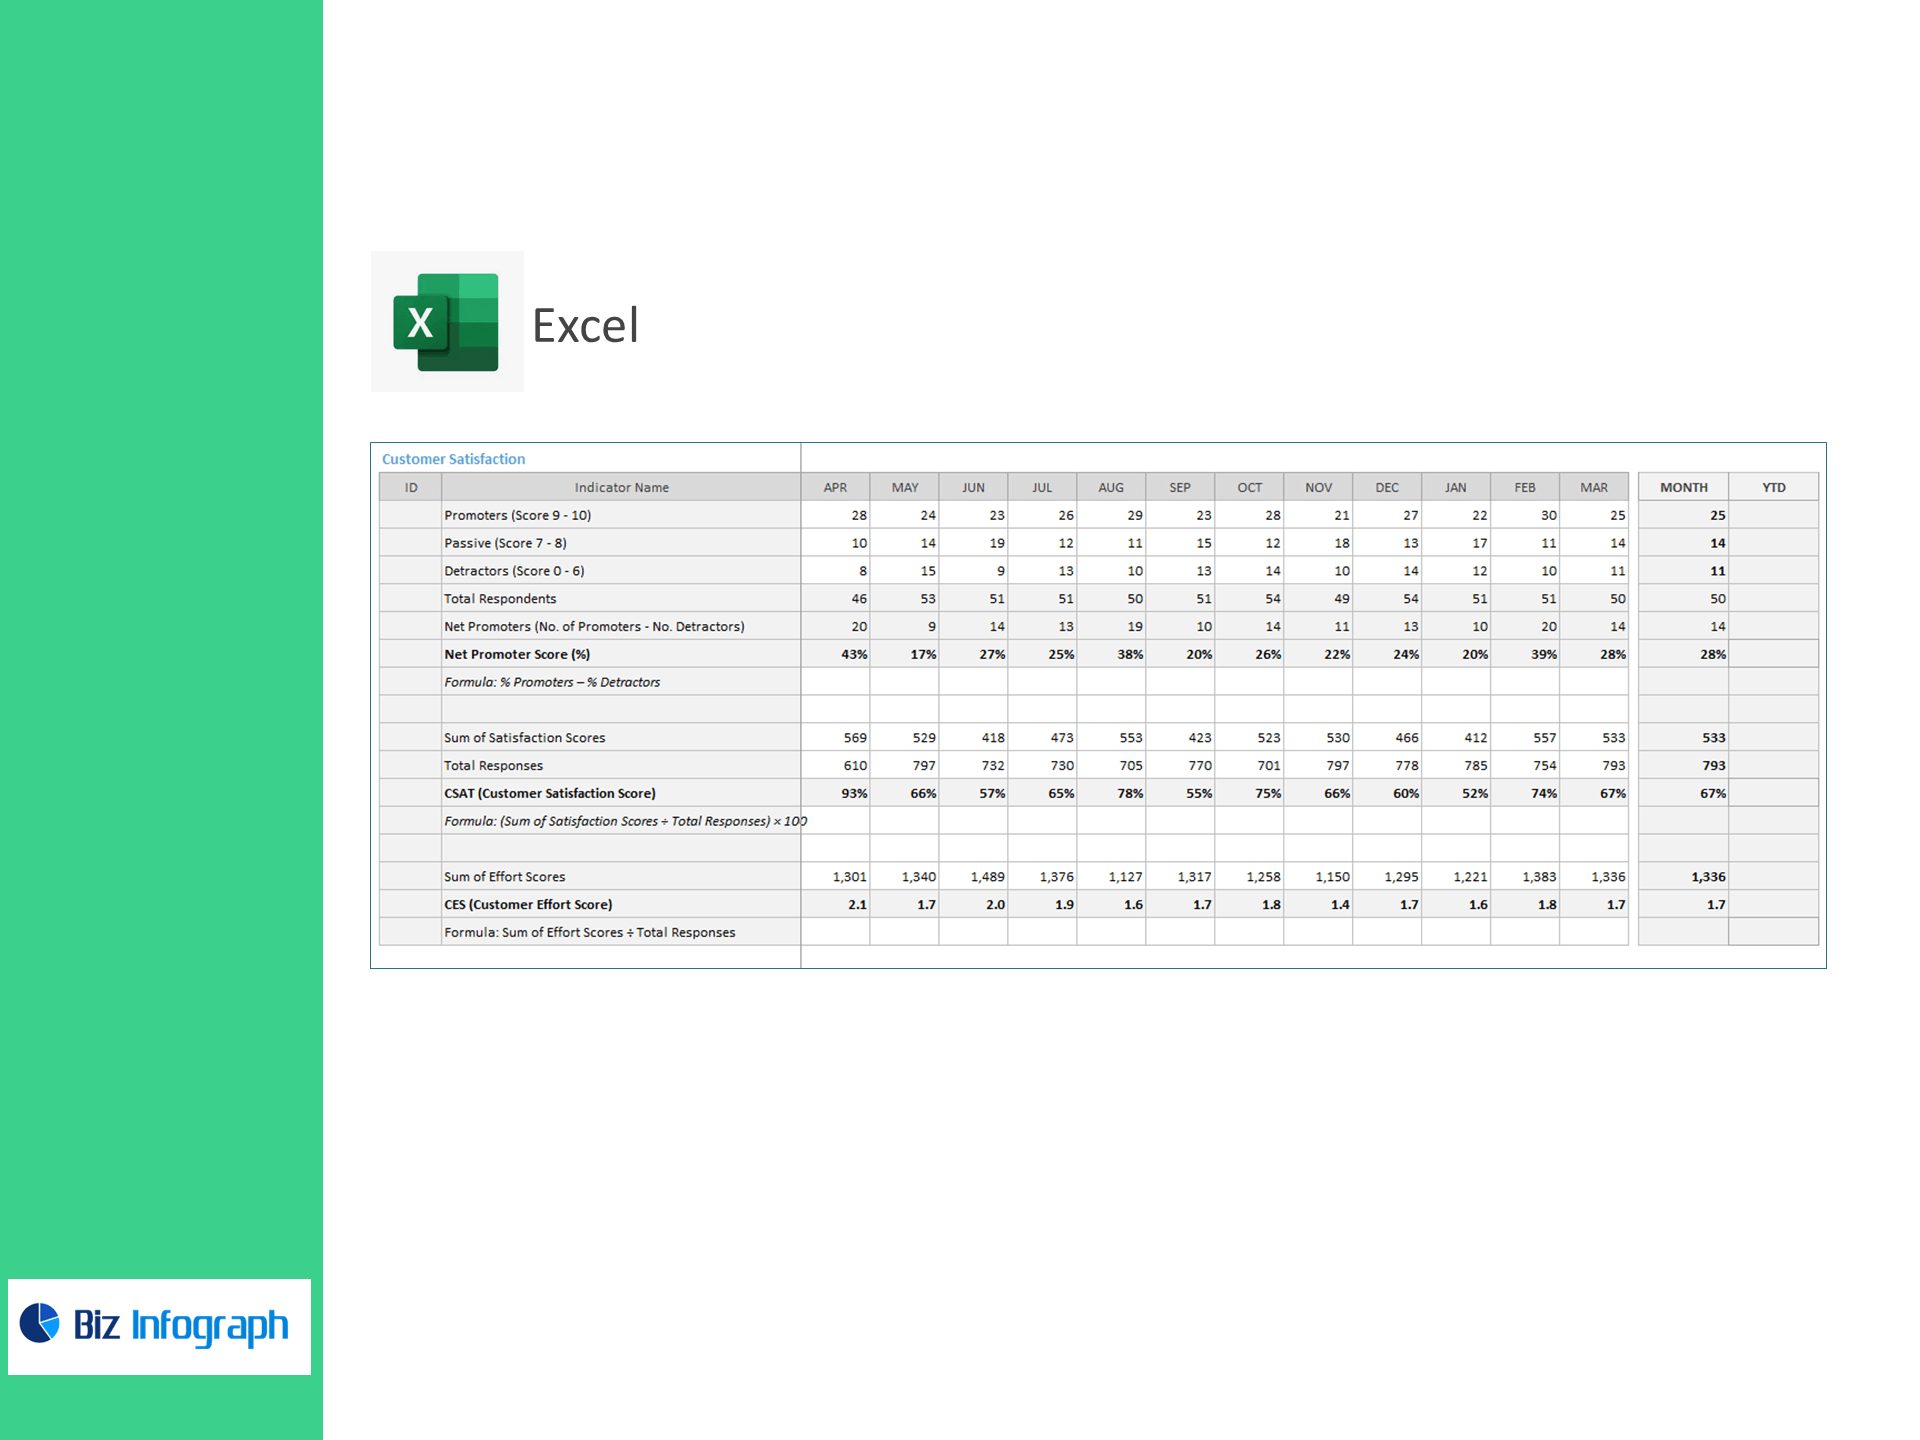
Customer Satisfaction
-
Promoters (9–10), Passives (7–8), Detractors (0–6), Total Respondents
-
Net Promoters = Promoters – Detractors
-
NPS (%) = % Promoters – % Detractors
-
Sum of Satisfaction Scores, CSAT (%) = (Sum of Satisfaction Scores ÷ Total Responses) × 100
-
Sum of Effort Scores, CES = (Sum of Effort Scores ÷ Total Responses)
Customer Loyalty
-
Repeat Customers (>1 purchase), Repeat Purchase Rate (%) = (Repeat Customers ÷ Total Customers) × 100
-
Customers at Start (CS), New Customers (CN), Customers at End (CE), Retention Rate (%) = [(CE – CN) ÷ CS] × 100
-
Lost Customers, Churn Rate (%) = (Lost Customers ÷ Starting Customers) × 100
-
Loyalty Members, Program Participation (%) = (Members ÷ Total Customers) × 100
-
Redeemed vs Issued Rewards, Redemption Rate (%) = (Redeemed ÷ Issued) × 100
What’s inside
-
Executive Dashboard: AOV, CLV, NPS/CSAT/CES, Retention, Churn, Repeat Rate, Redemption with trend lines and target variances.
-
Behavior Analytics: Drivers of AOV, basket size, purchase frequency, and visit-to-purchase conversion.
-
Satisfaction Hub: NPS distribution and CSAT/CES diagnostics tied to response counts.
-
Loyalty Tracker: Member growth, participation, and reward redemption performance.
-
Assumptions & Targets: Set goals and customer lifespan; all visuals update instantly.
-
Clean Data Tables: Import-ready sheets for Transactions, Visits, Surveys, and Loyalty.
How it works
-
Paste your CSV/Excel data into the provided tables.
-
Set the reporting period, targets, and customer lifespan assumption.
-
Review interactive visuals and take action on the biggest revenue levers.
Perfect for
-
Retail & DTC brands (eCommerce and brick-and-mortar)
-
Marketing, CX, and Loyalty teams
-
Store owners who want customer insights in Excel—fast, accurate, and affordable
Benefits you’ll see
-
Grow revenue per customer: Pinpoint tactics to increase AOV and frequency.
-
Reduce churn: Catch risk early with retention and repeat-purchase tracking.
-
Boost loyalty ROI: Improve participation and redemption with data-led offers.
-
Elevate CX: Link satisfaction (NPS/CSAT/CES) to purchase behavior and repeat rate.
For ready-to-use Dashboard Templates: