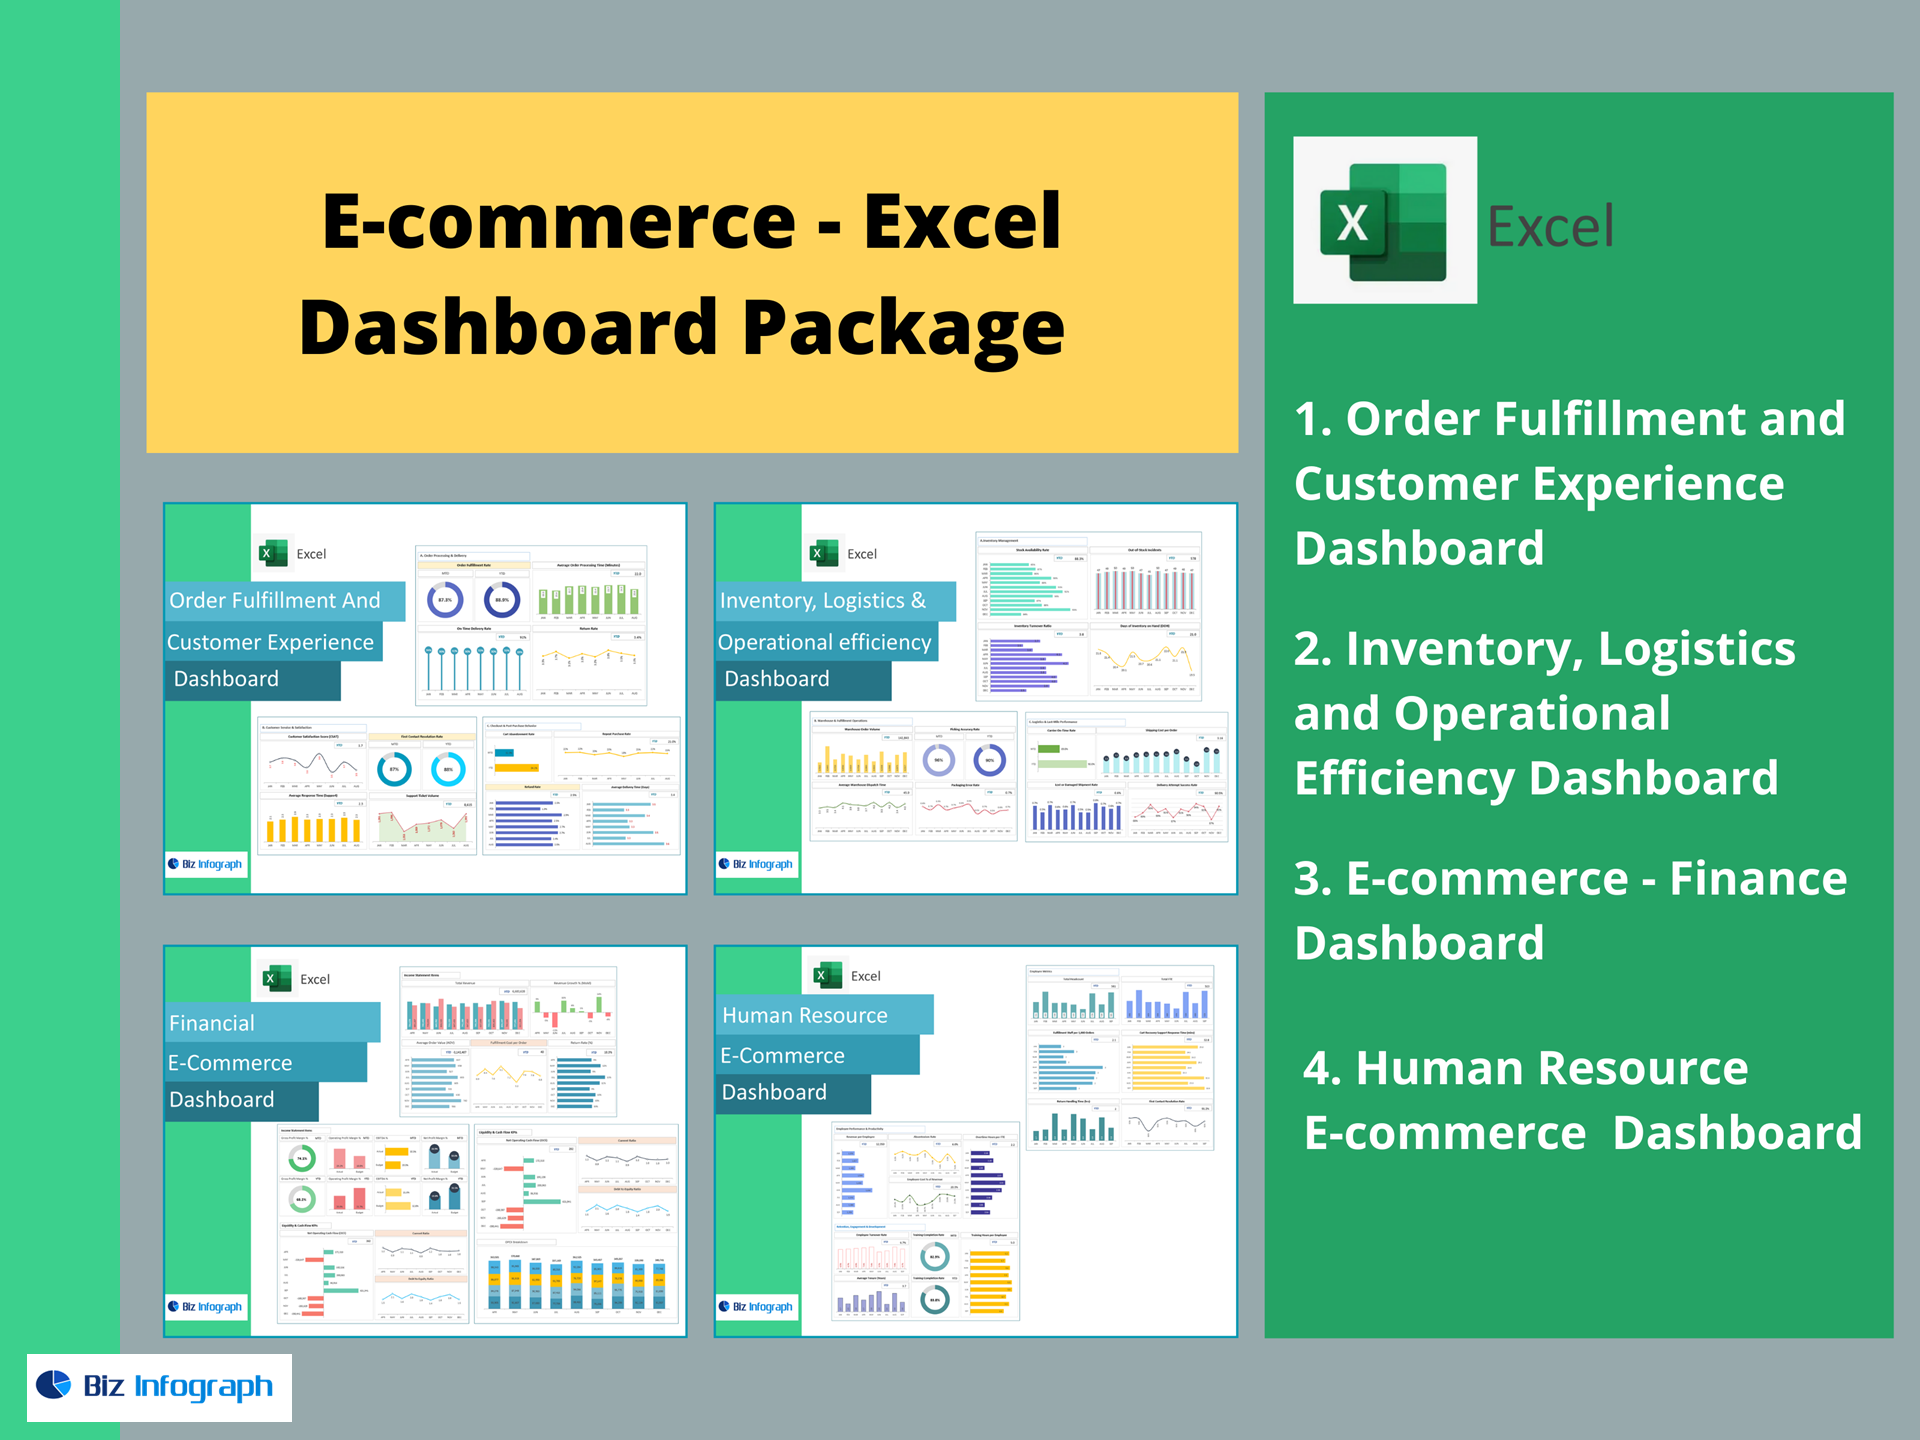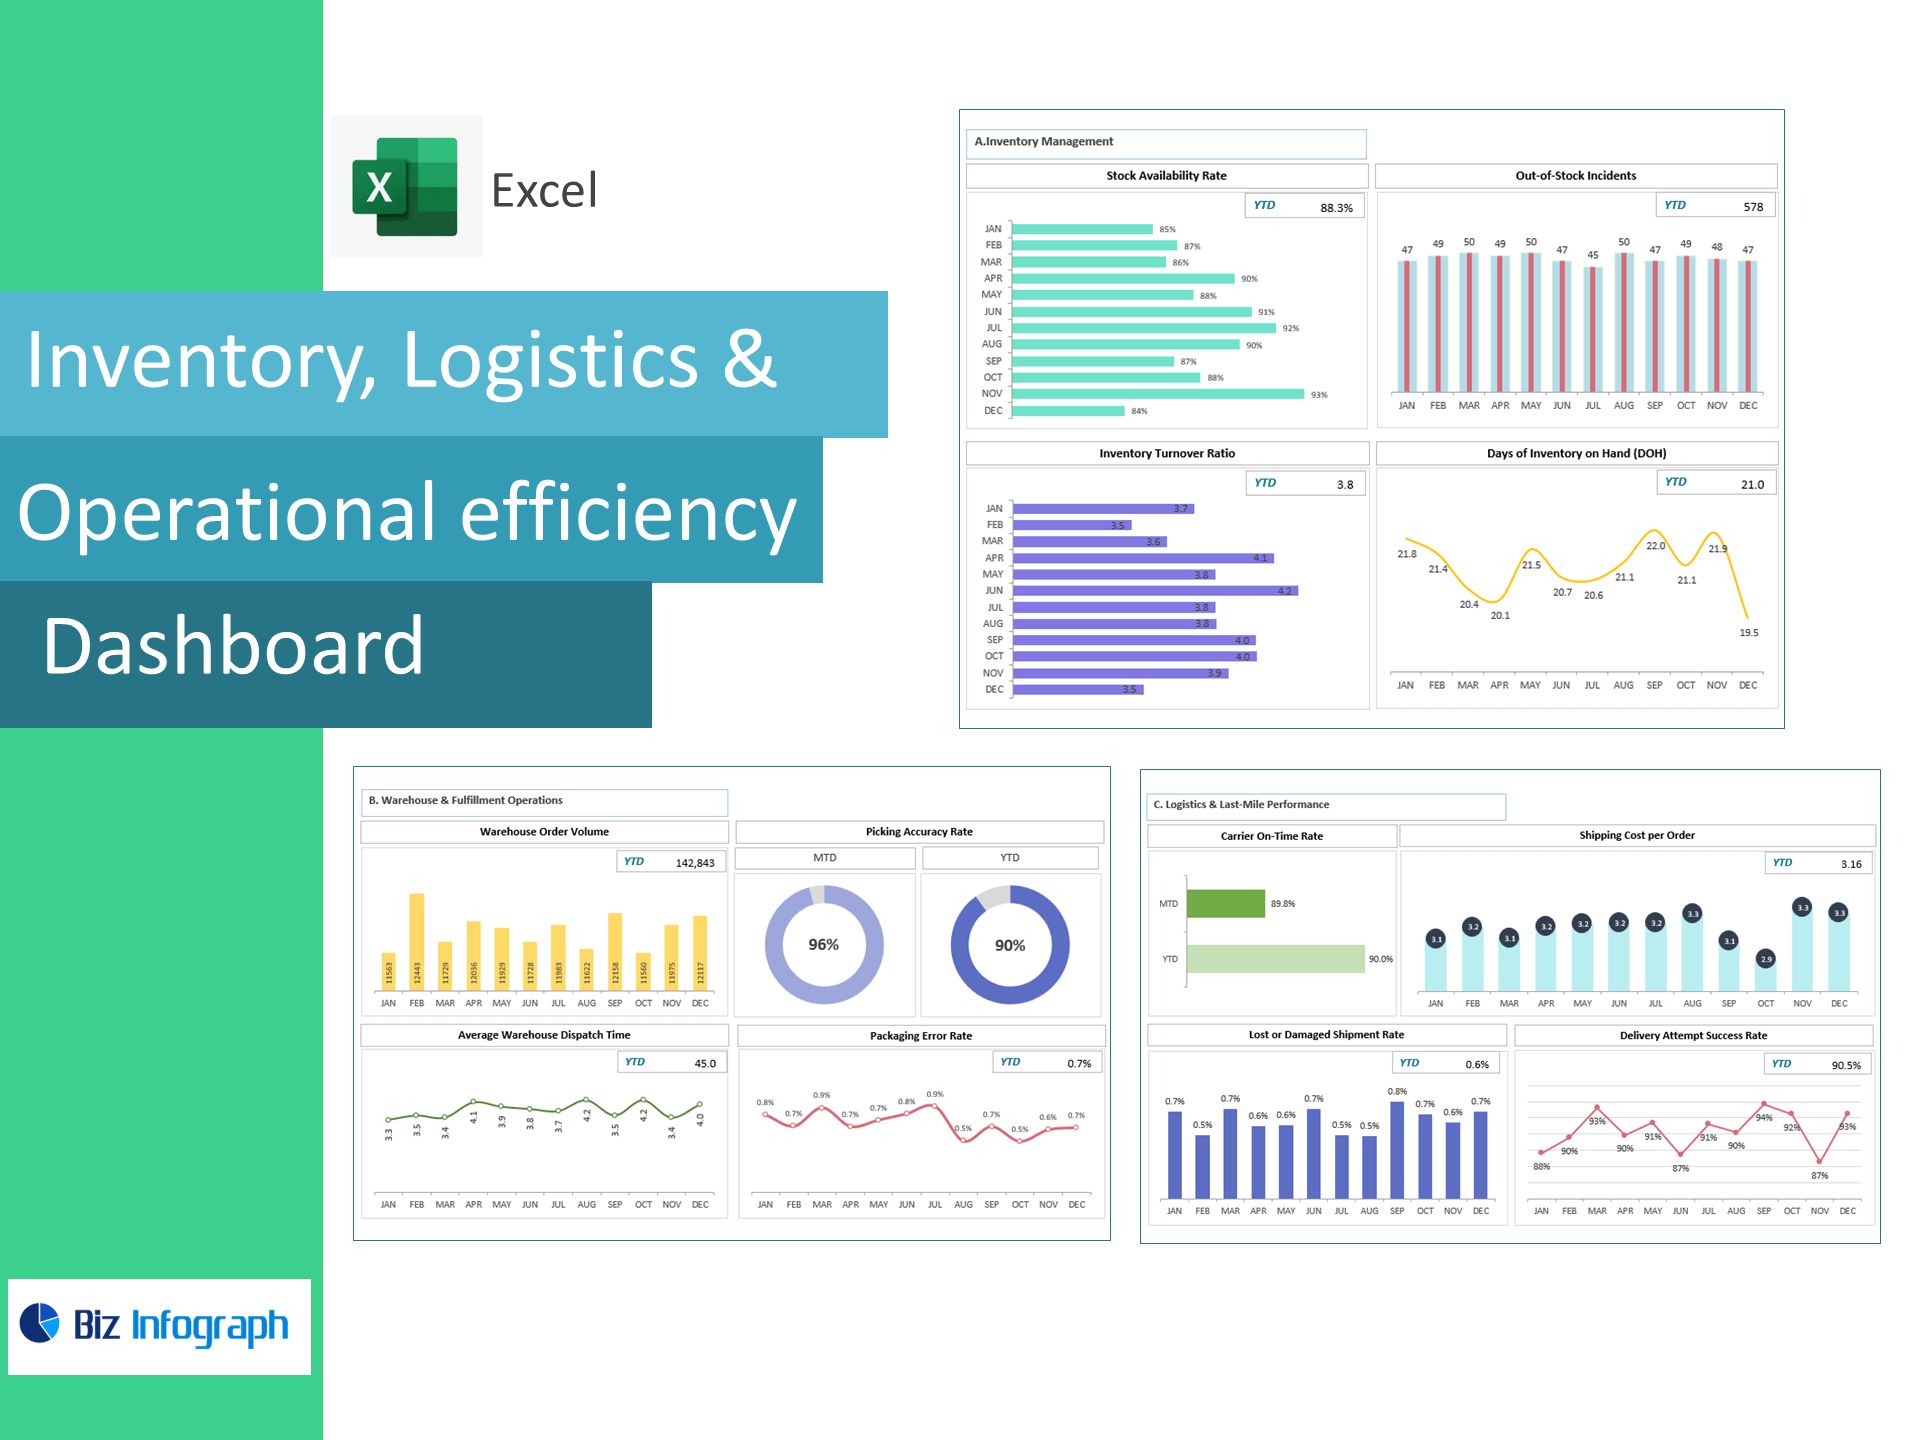
Inventory, Logistics and Operational Efficiency Dashboard — Excel Template
A plug-and-play Excel dashboard that gives operations, supply-chain, and eCommerce teams real-time visibility across inventory health, warehouse throughput, and last-mile delivery performance. Fully editable, no macros, built for Excel 365/2021 (Win & Mac).
KPIs prebuilt (ready on day one)
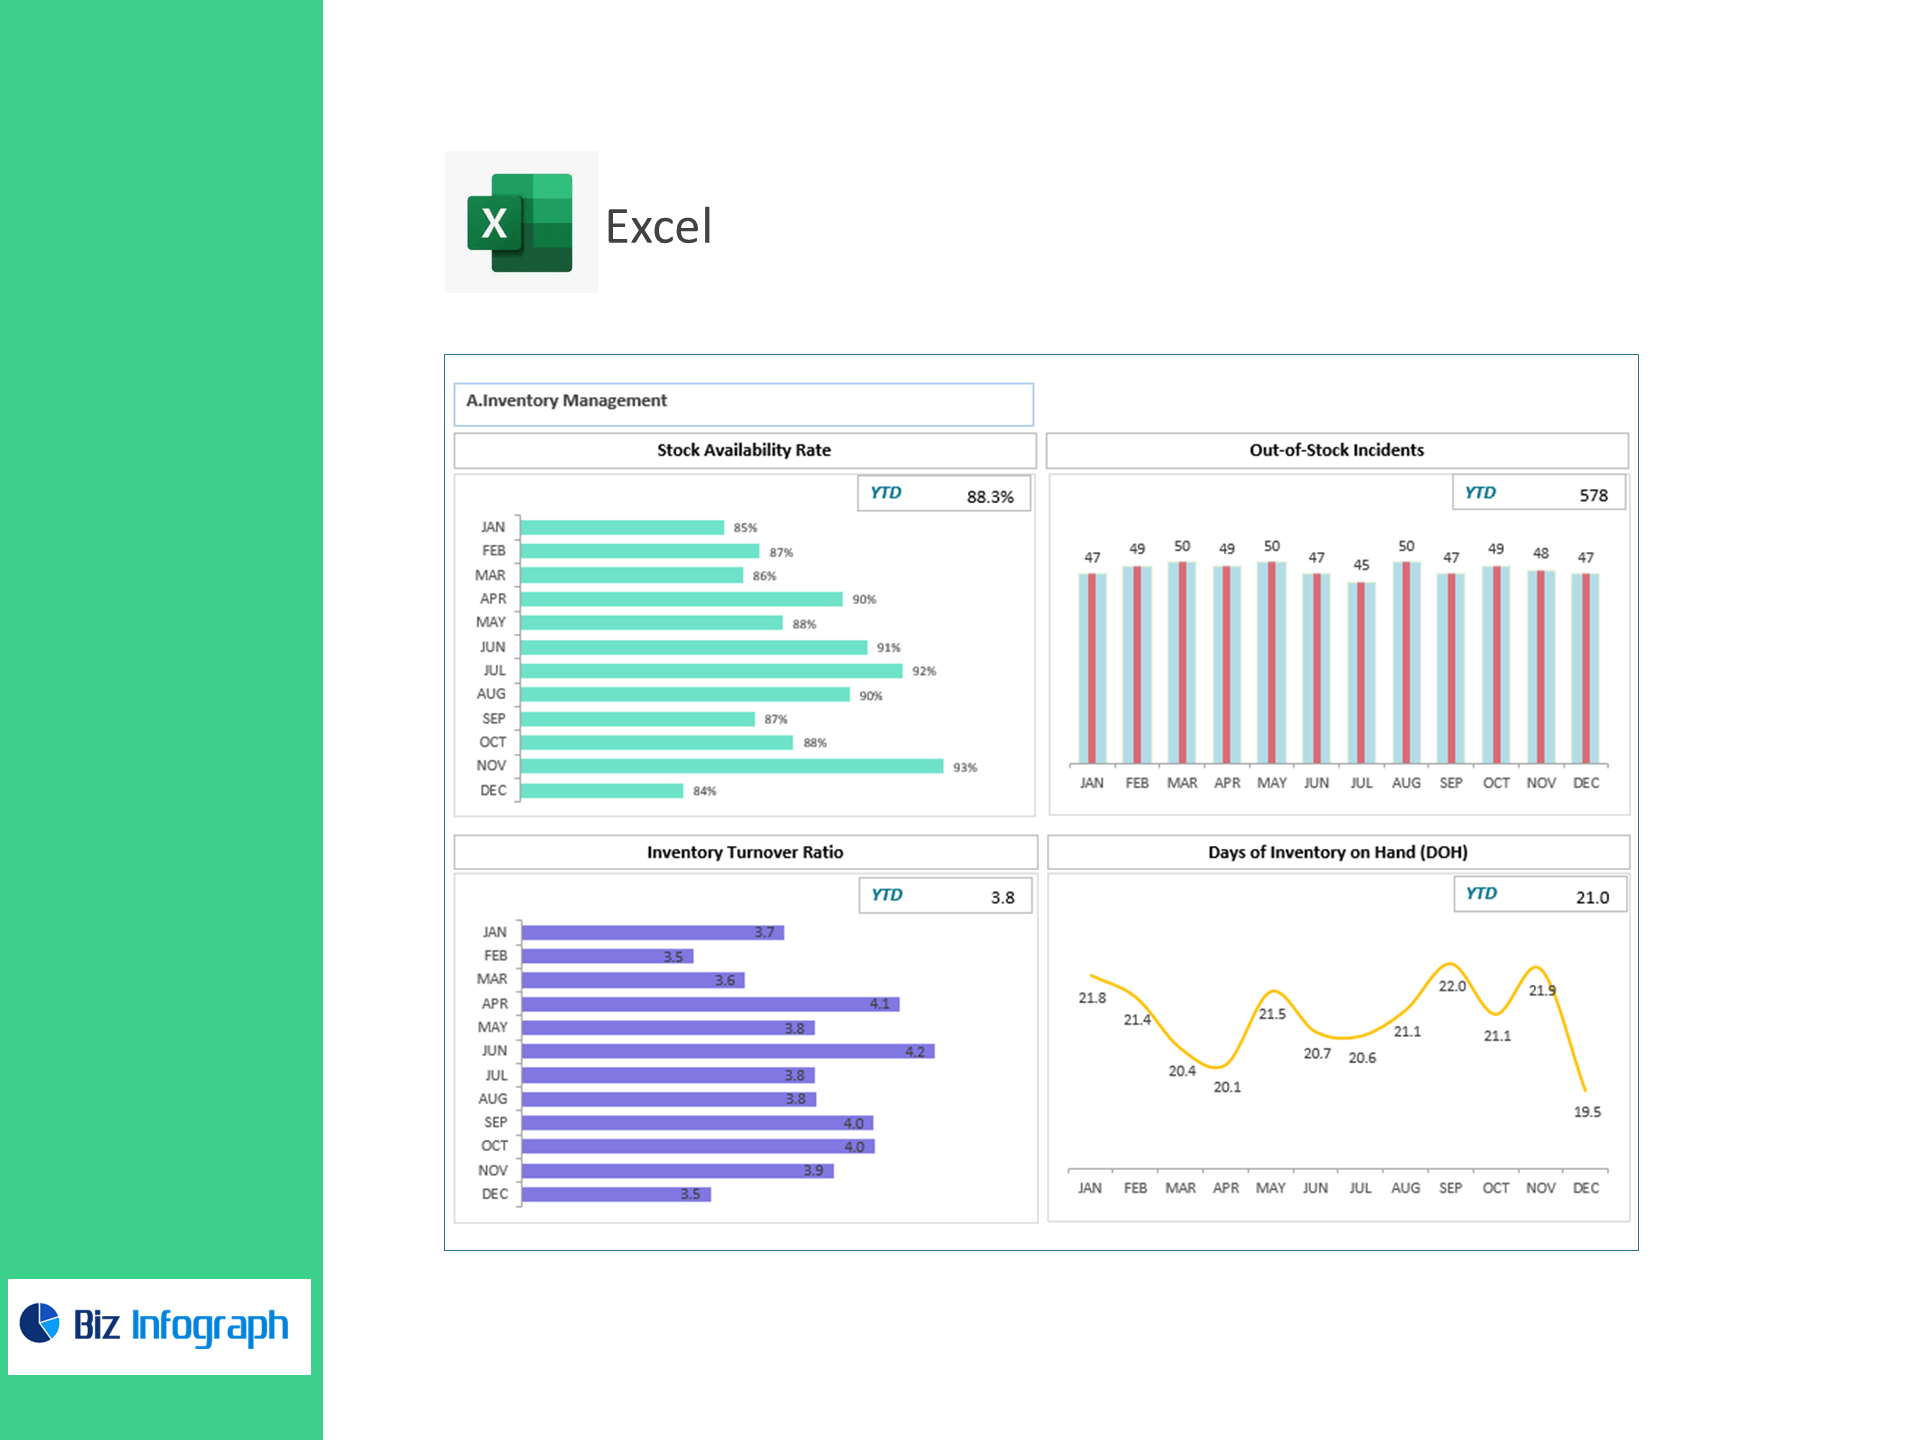
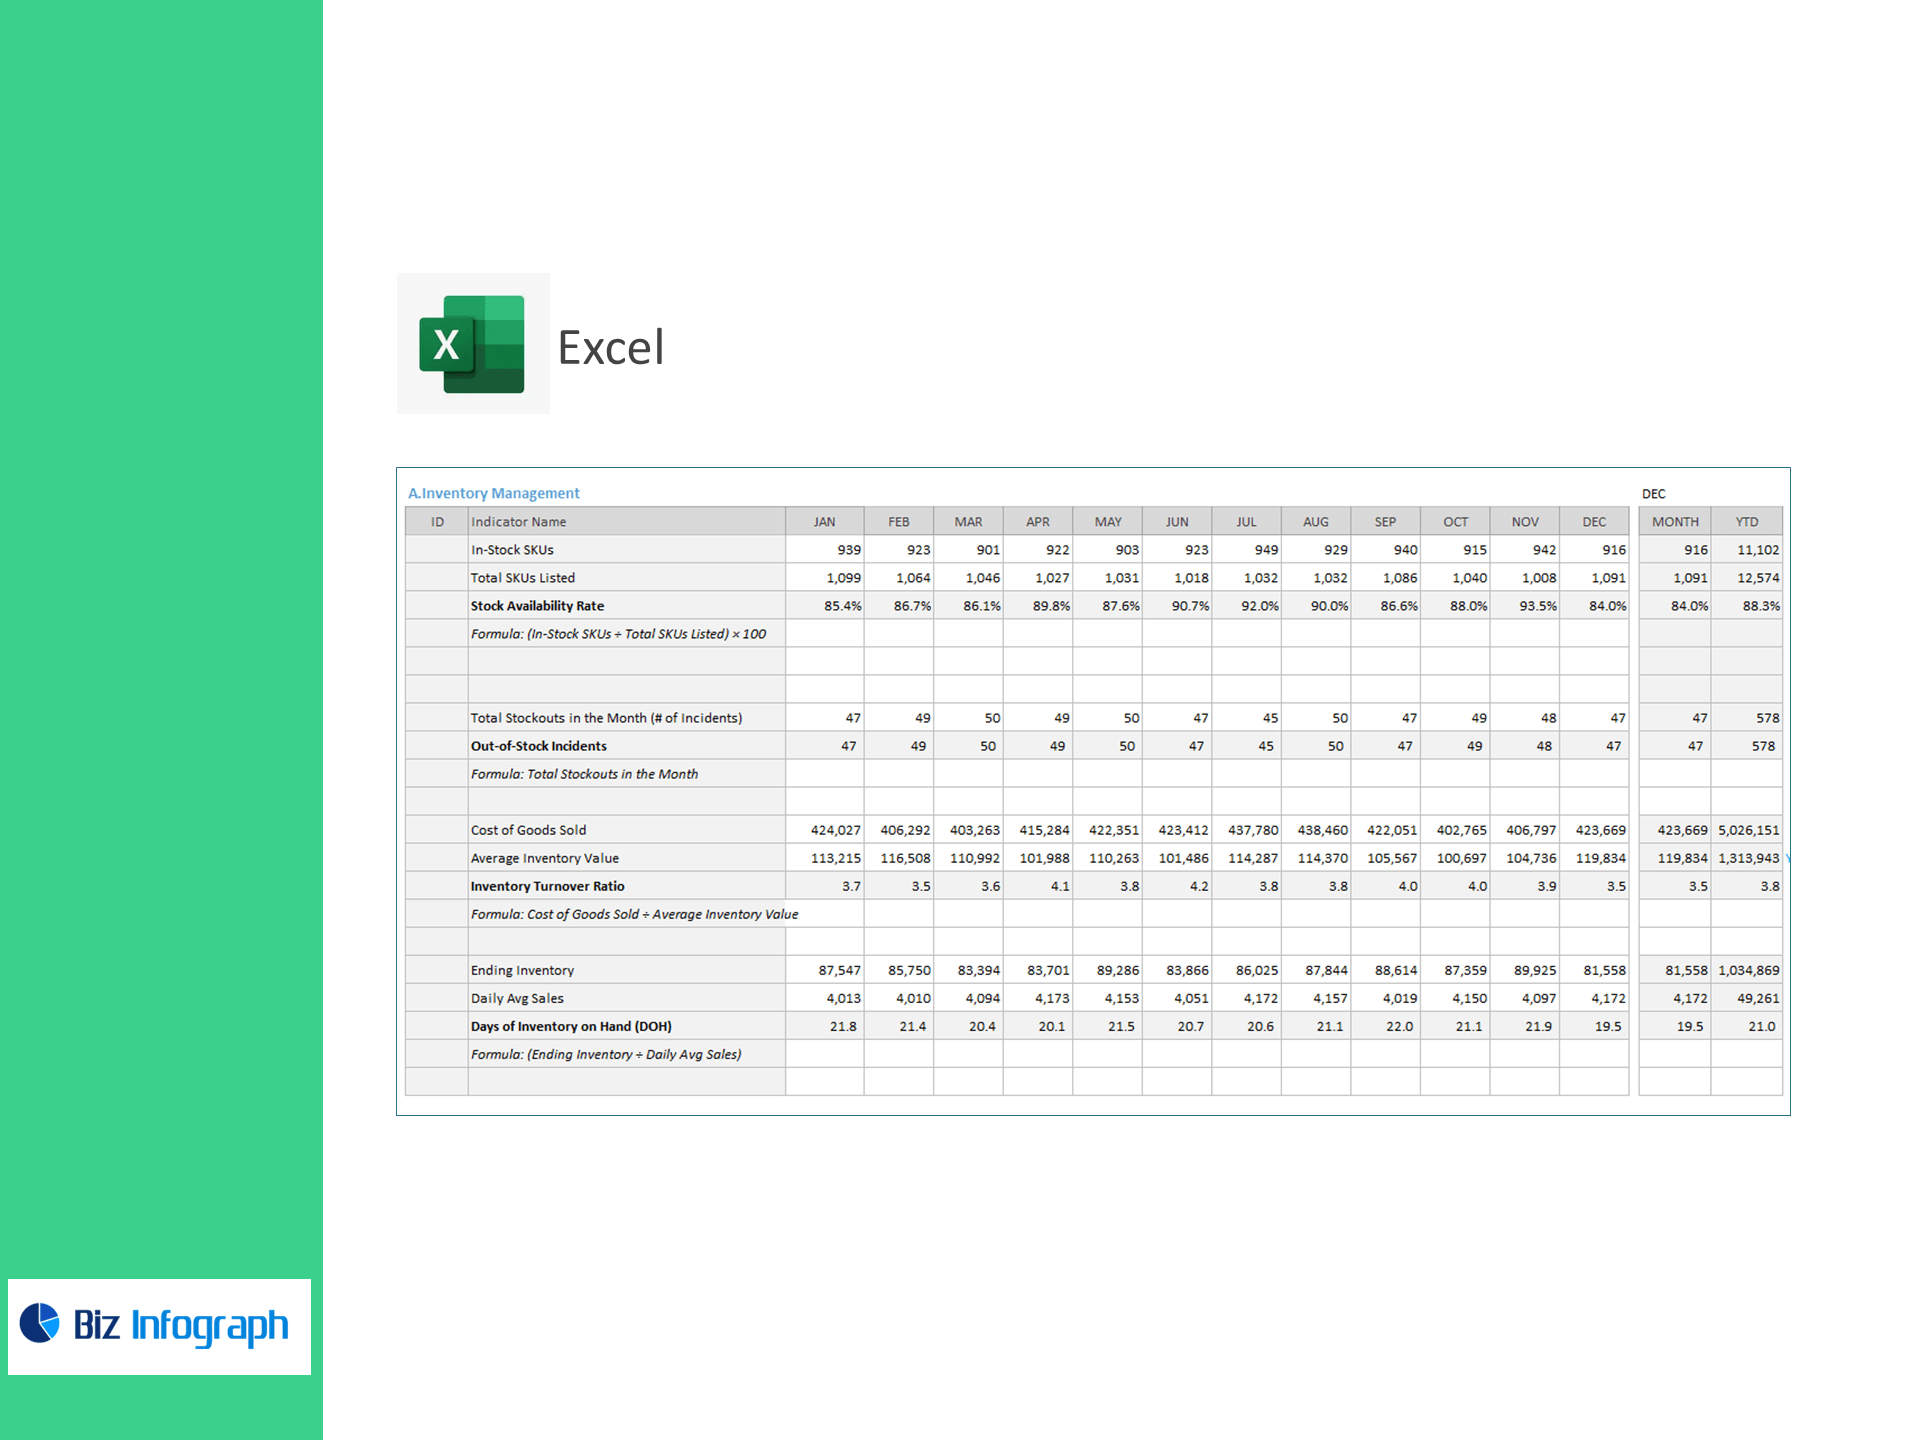
Inventory Management
-
Stock Availability Rate
-
Out-of-Stock Incidents
-
Inventory Turnover Ratio
-
Days of Inventory on Hand (DOH)
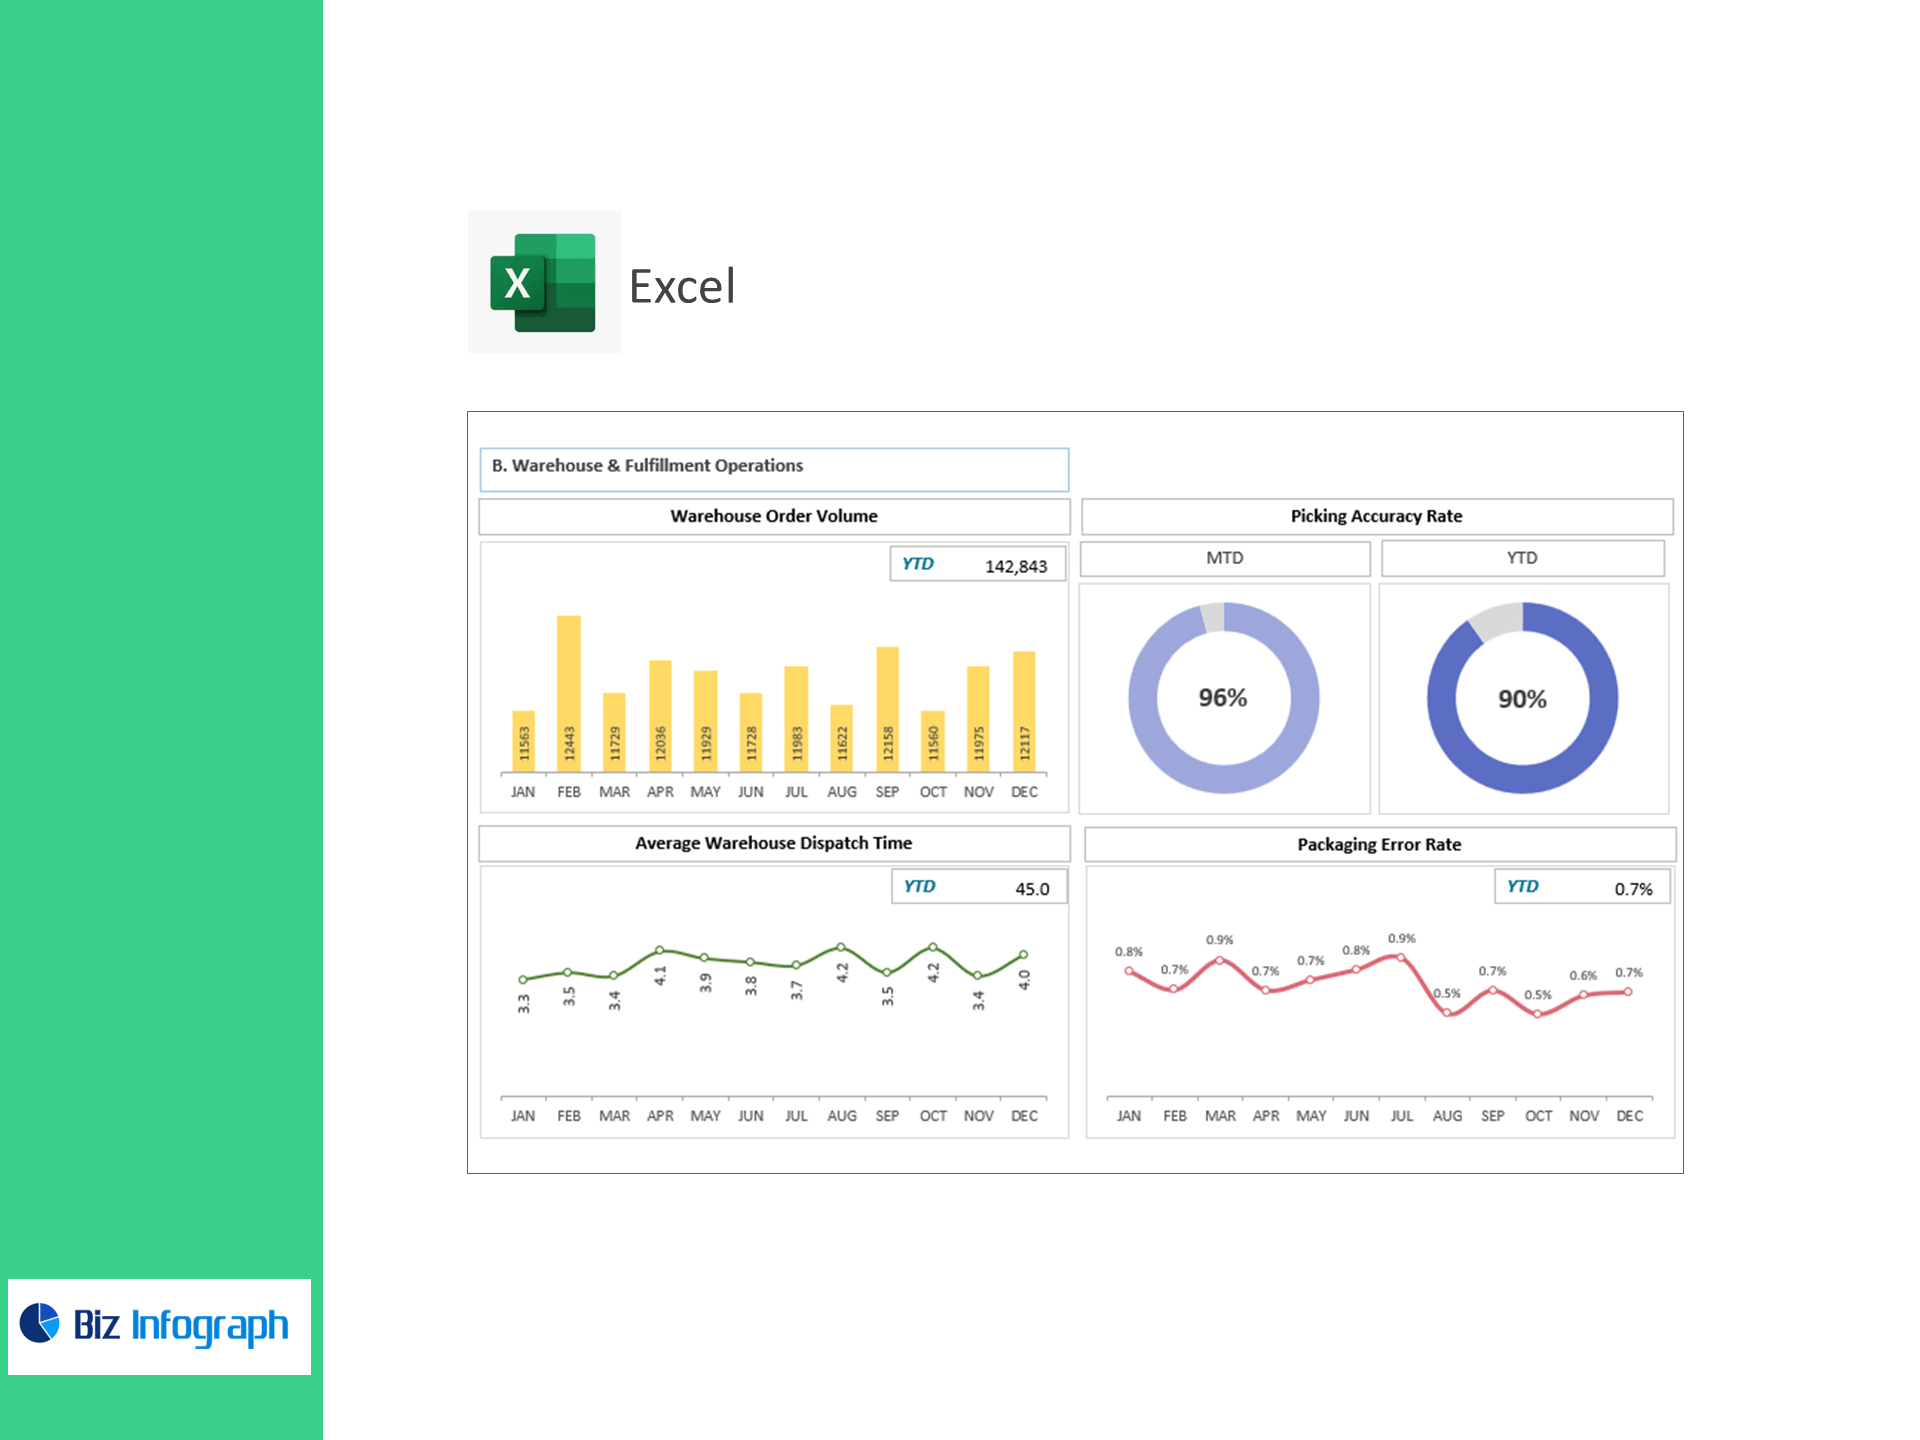
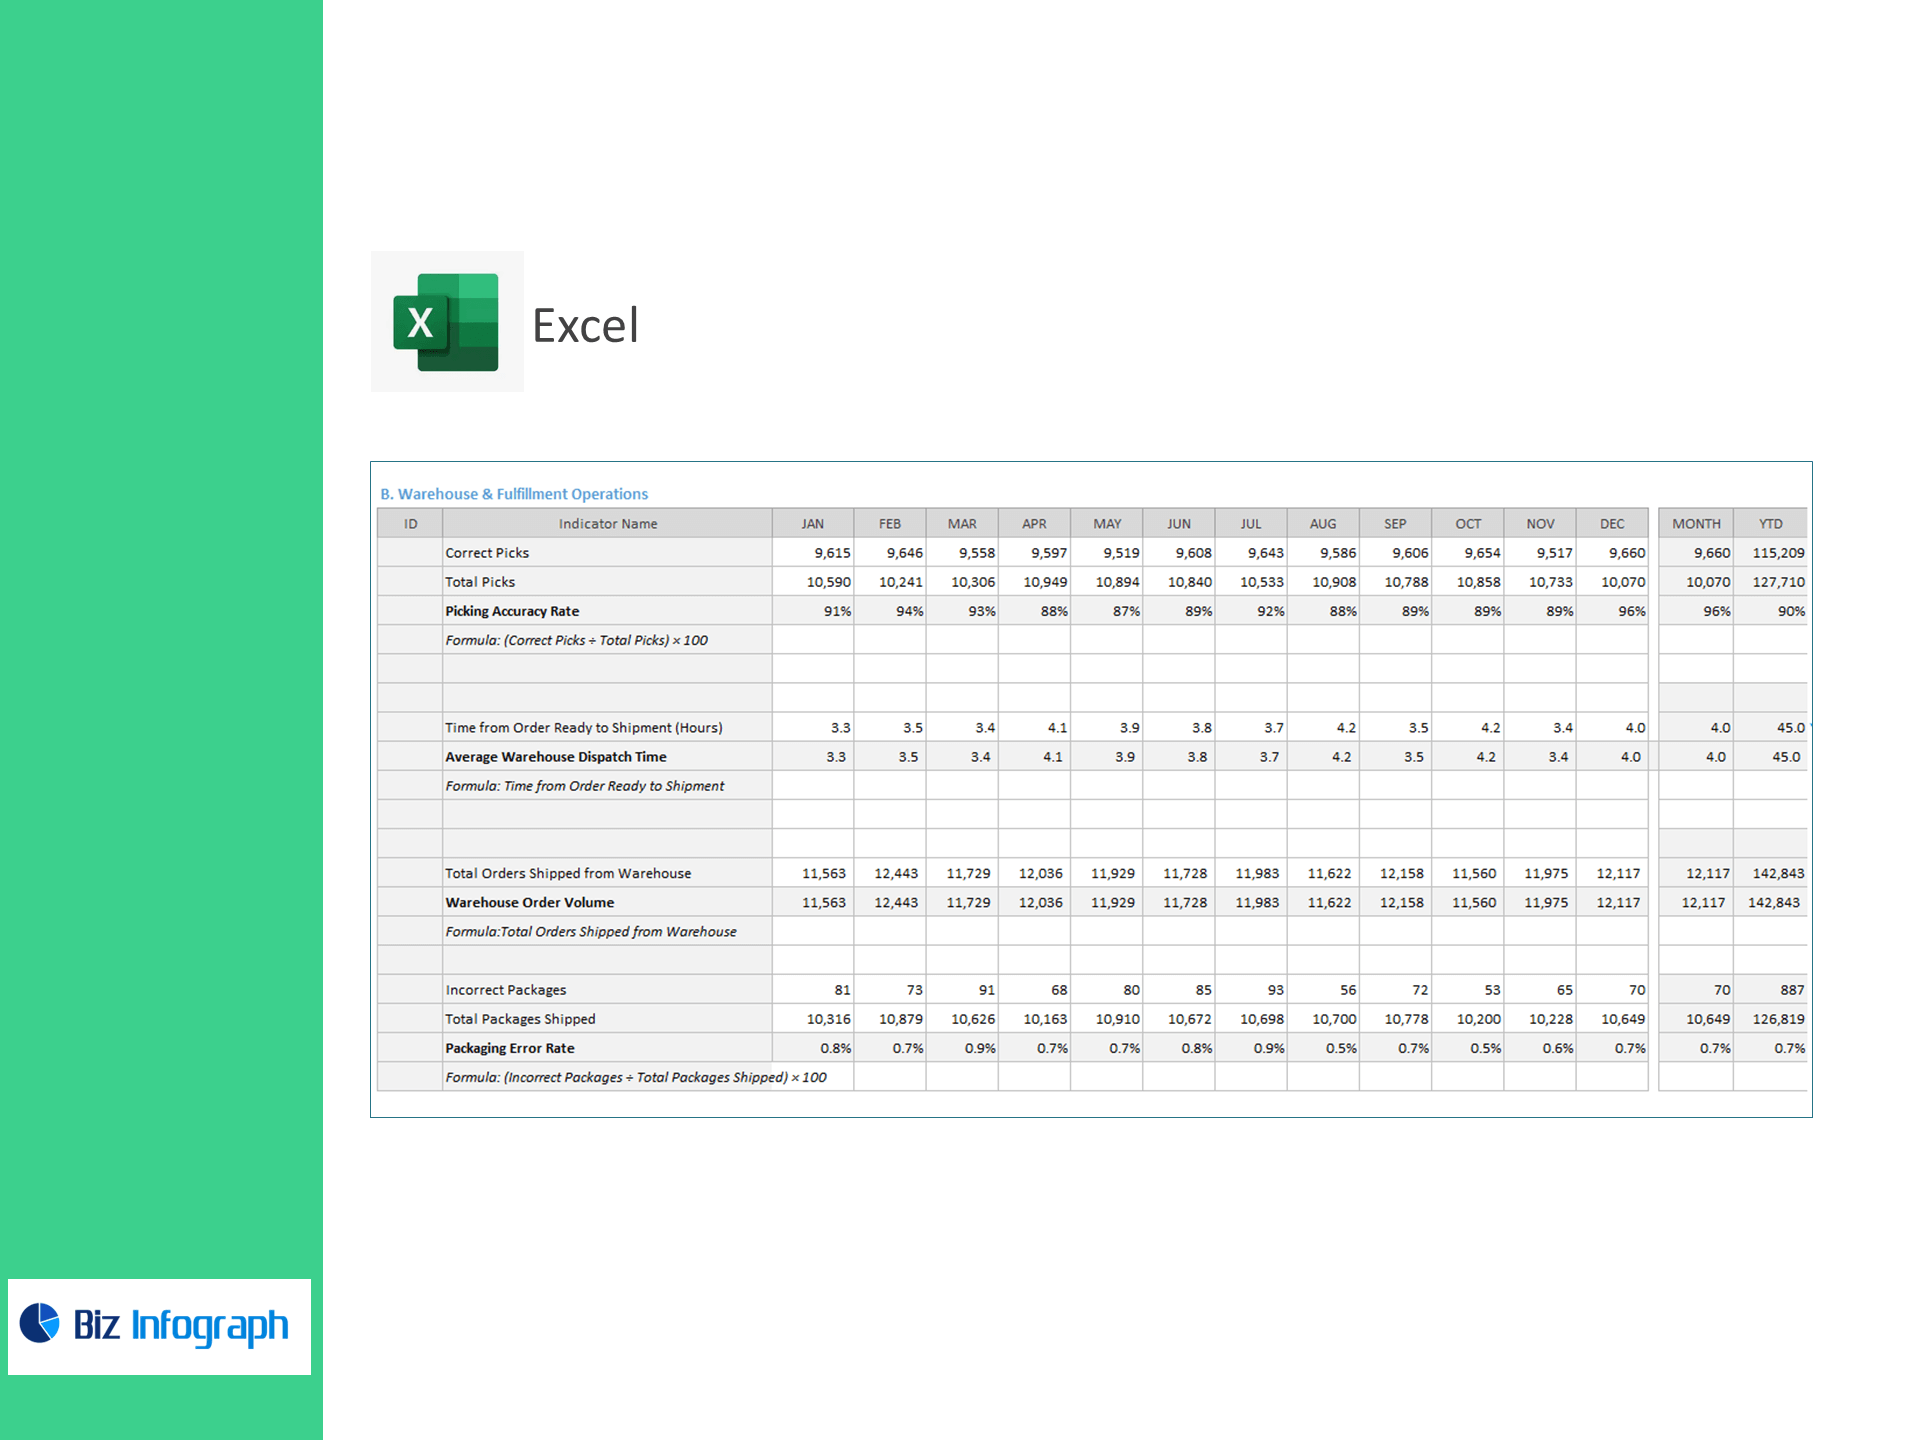
Warehouse & Fulfillment
-
Picking Accuracy Rate
-
Average Warehouse Dispatch Time
-
Warehouse Order Volume
-
Packaging Error Rate
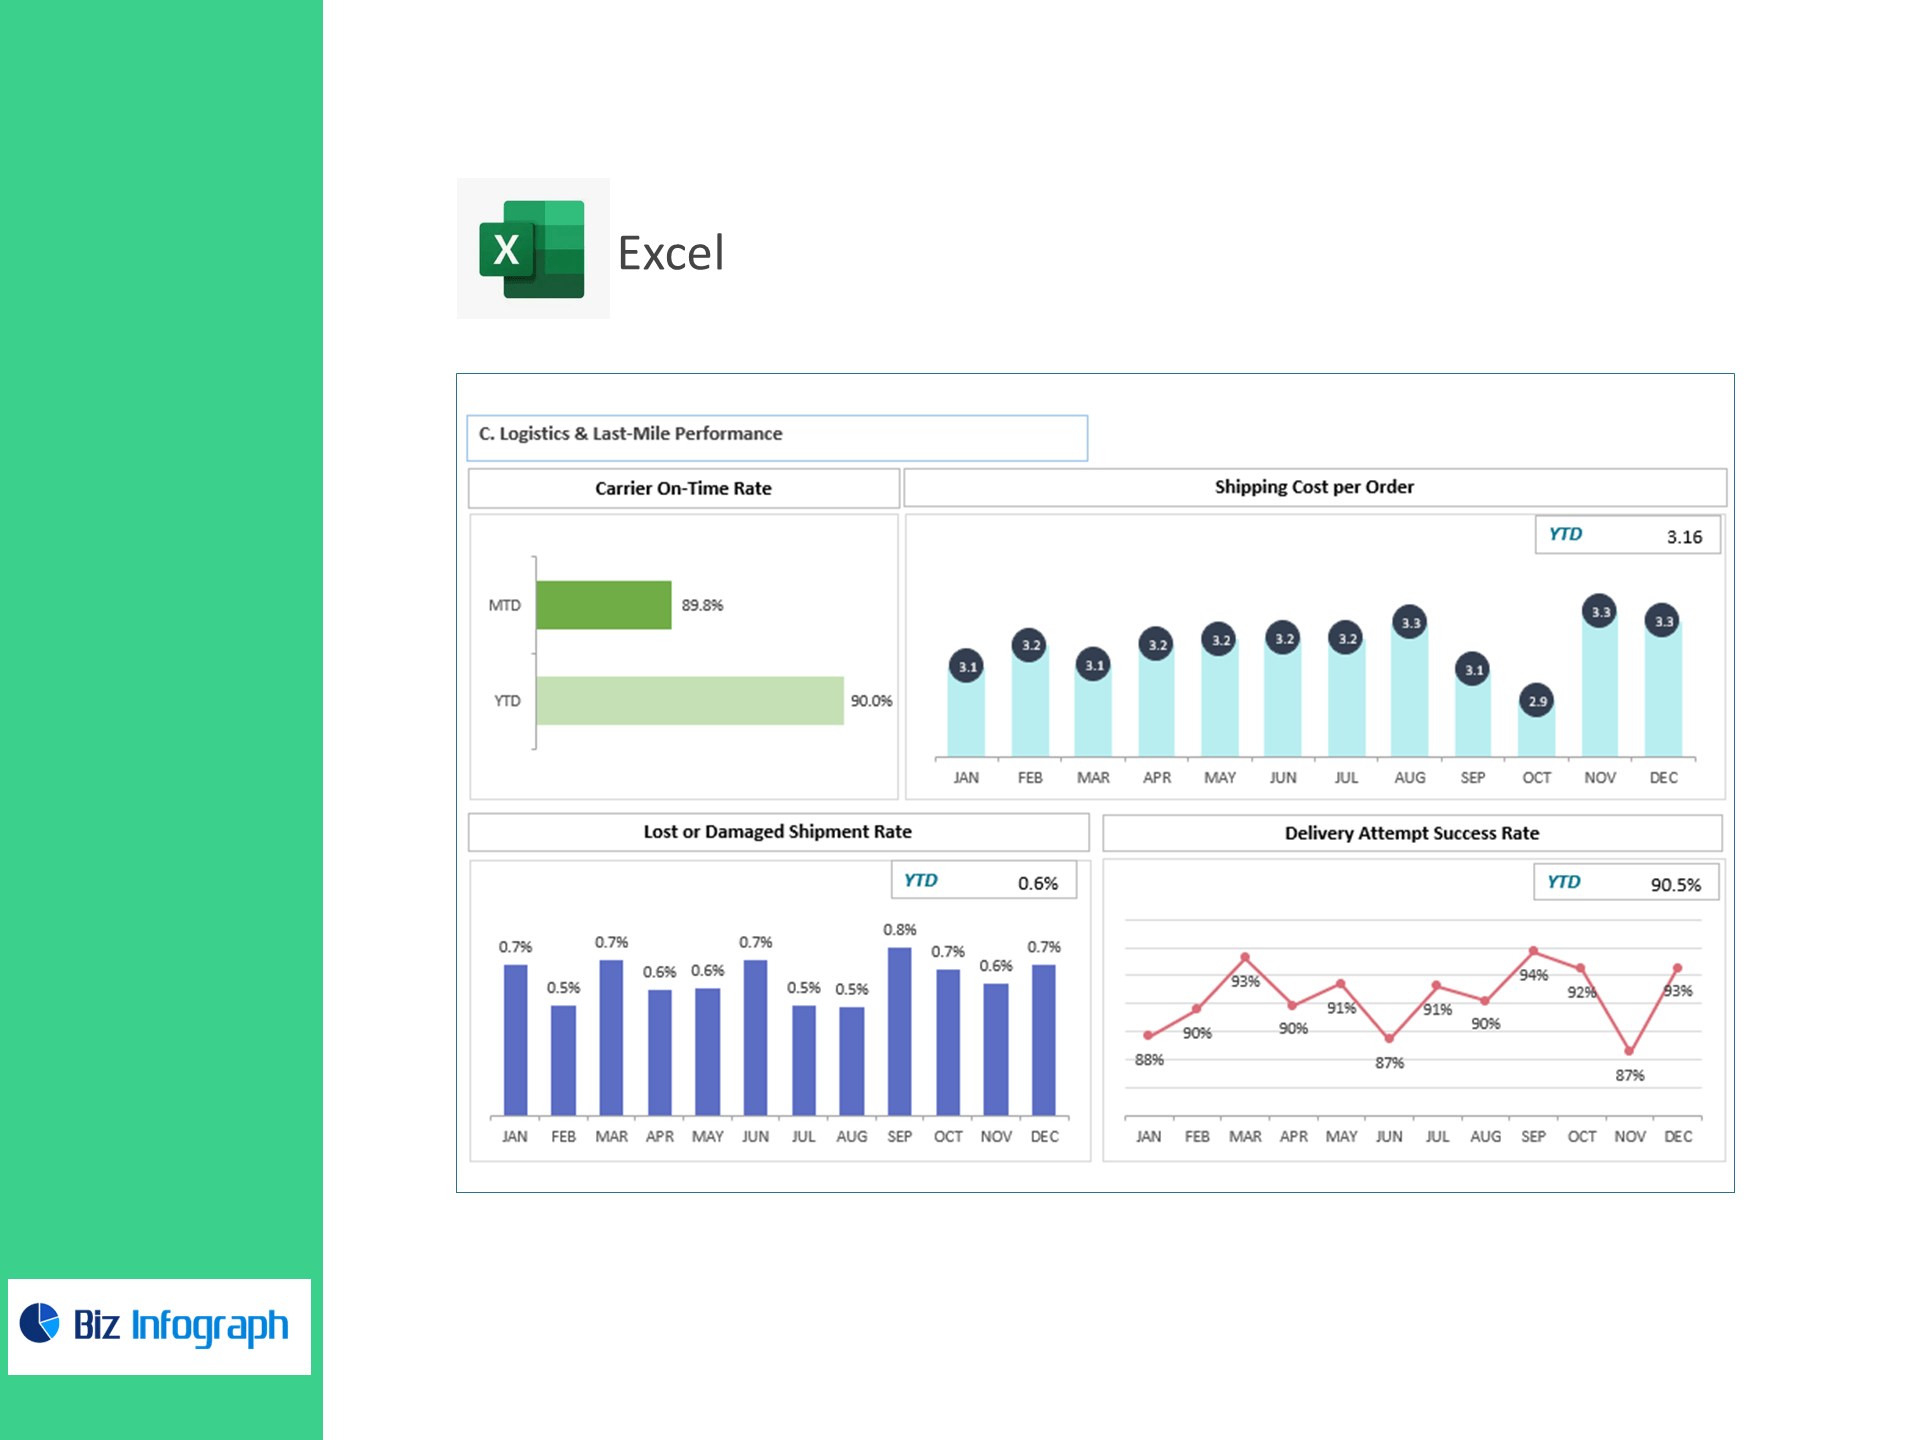
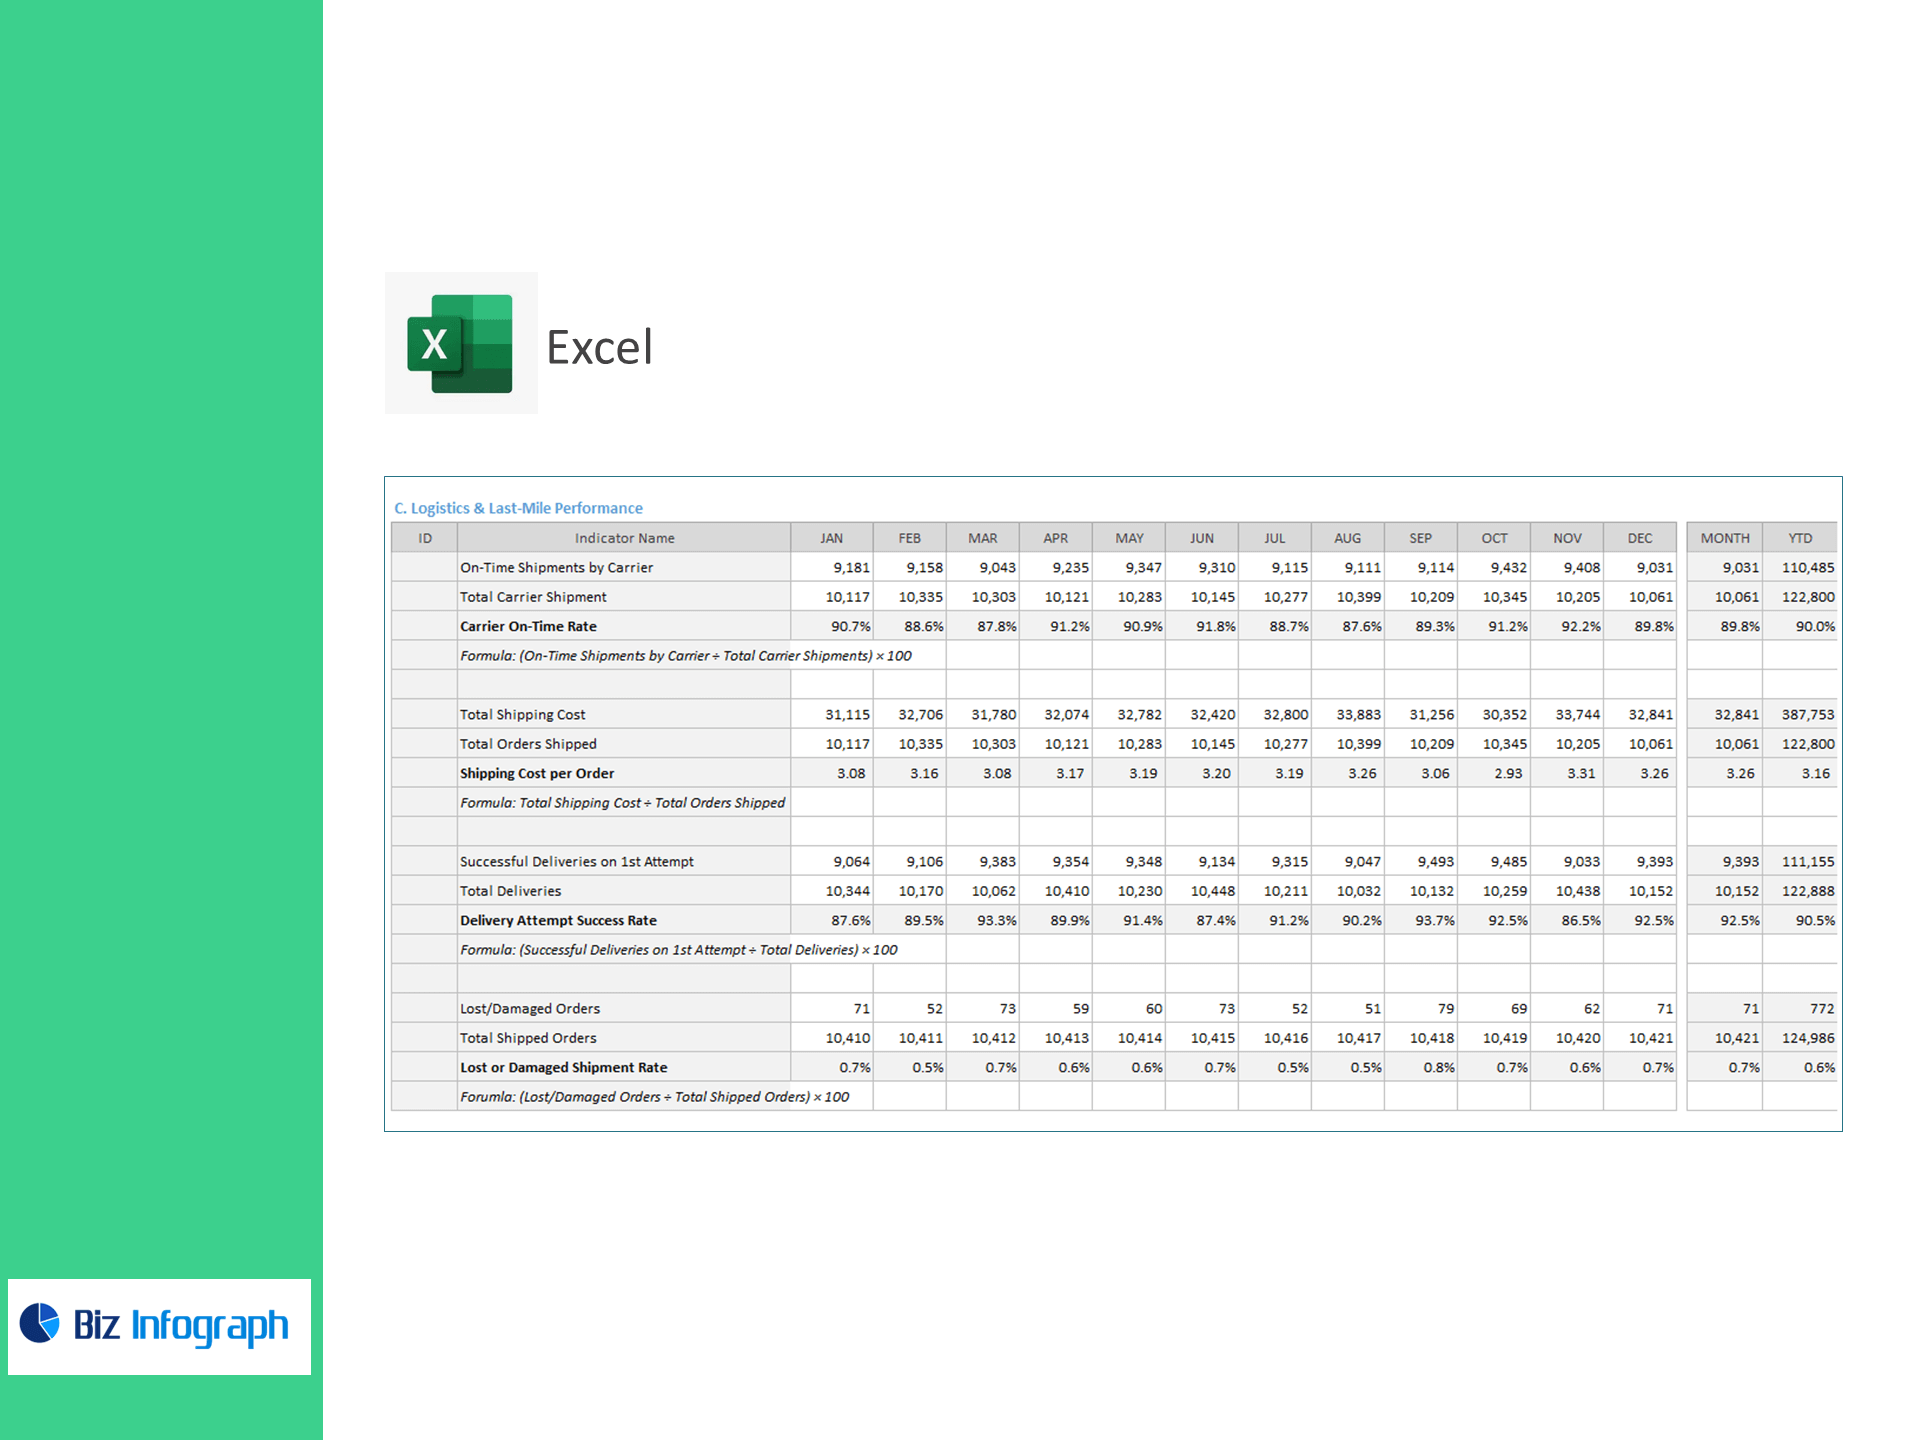
Logistics & Last-Mile
-
Carrier On-Time Rate
-
Shipping Cost per Order
-
Delivery Attempt Success Rate (1st attempt)
-
Lost or Damaged Shipment Rate
What you get
-
Executive KPI tiles + trend charts with targets/variance
-
Drill-downs by SKU, warehouse, carrier, region, and date
-
ABC/SKU performance, stockout heatmap, and DOH tracker
-
Cost analytics (per order, per shipment) and accuracy/quality scorecards
-
Clean data tables, sample data, and refresh instructions
-
Slicers for channel, fulfillment node, carrier, month
Why teams choose this template
-
Reduce stockouts and holding costs with Turnover & DOH in one view
-
Shorten dock-to-ship time using dispatch and picking accuracy insights
-
Lower last-mile spend via on-time vs. cost comparisons by carrier
-
Improve NPS with first-attempt delivery and damage/loss monitoring
Technical details
-
100% Excel—no add-ins; easily export to PDF/PowerPoint
-
Color-coded thresholds & goals you can change in seconds
-
Works for retail, D2C, B2B distribution, 3PL/4PL, manufacturing
For ready-to-use Dashboard Templates: