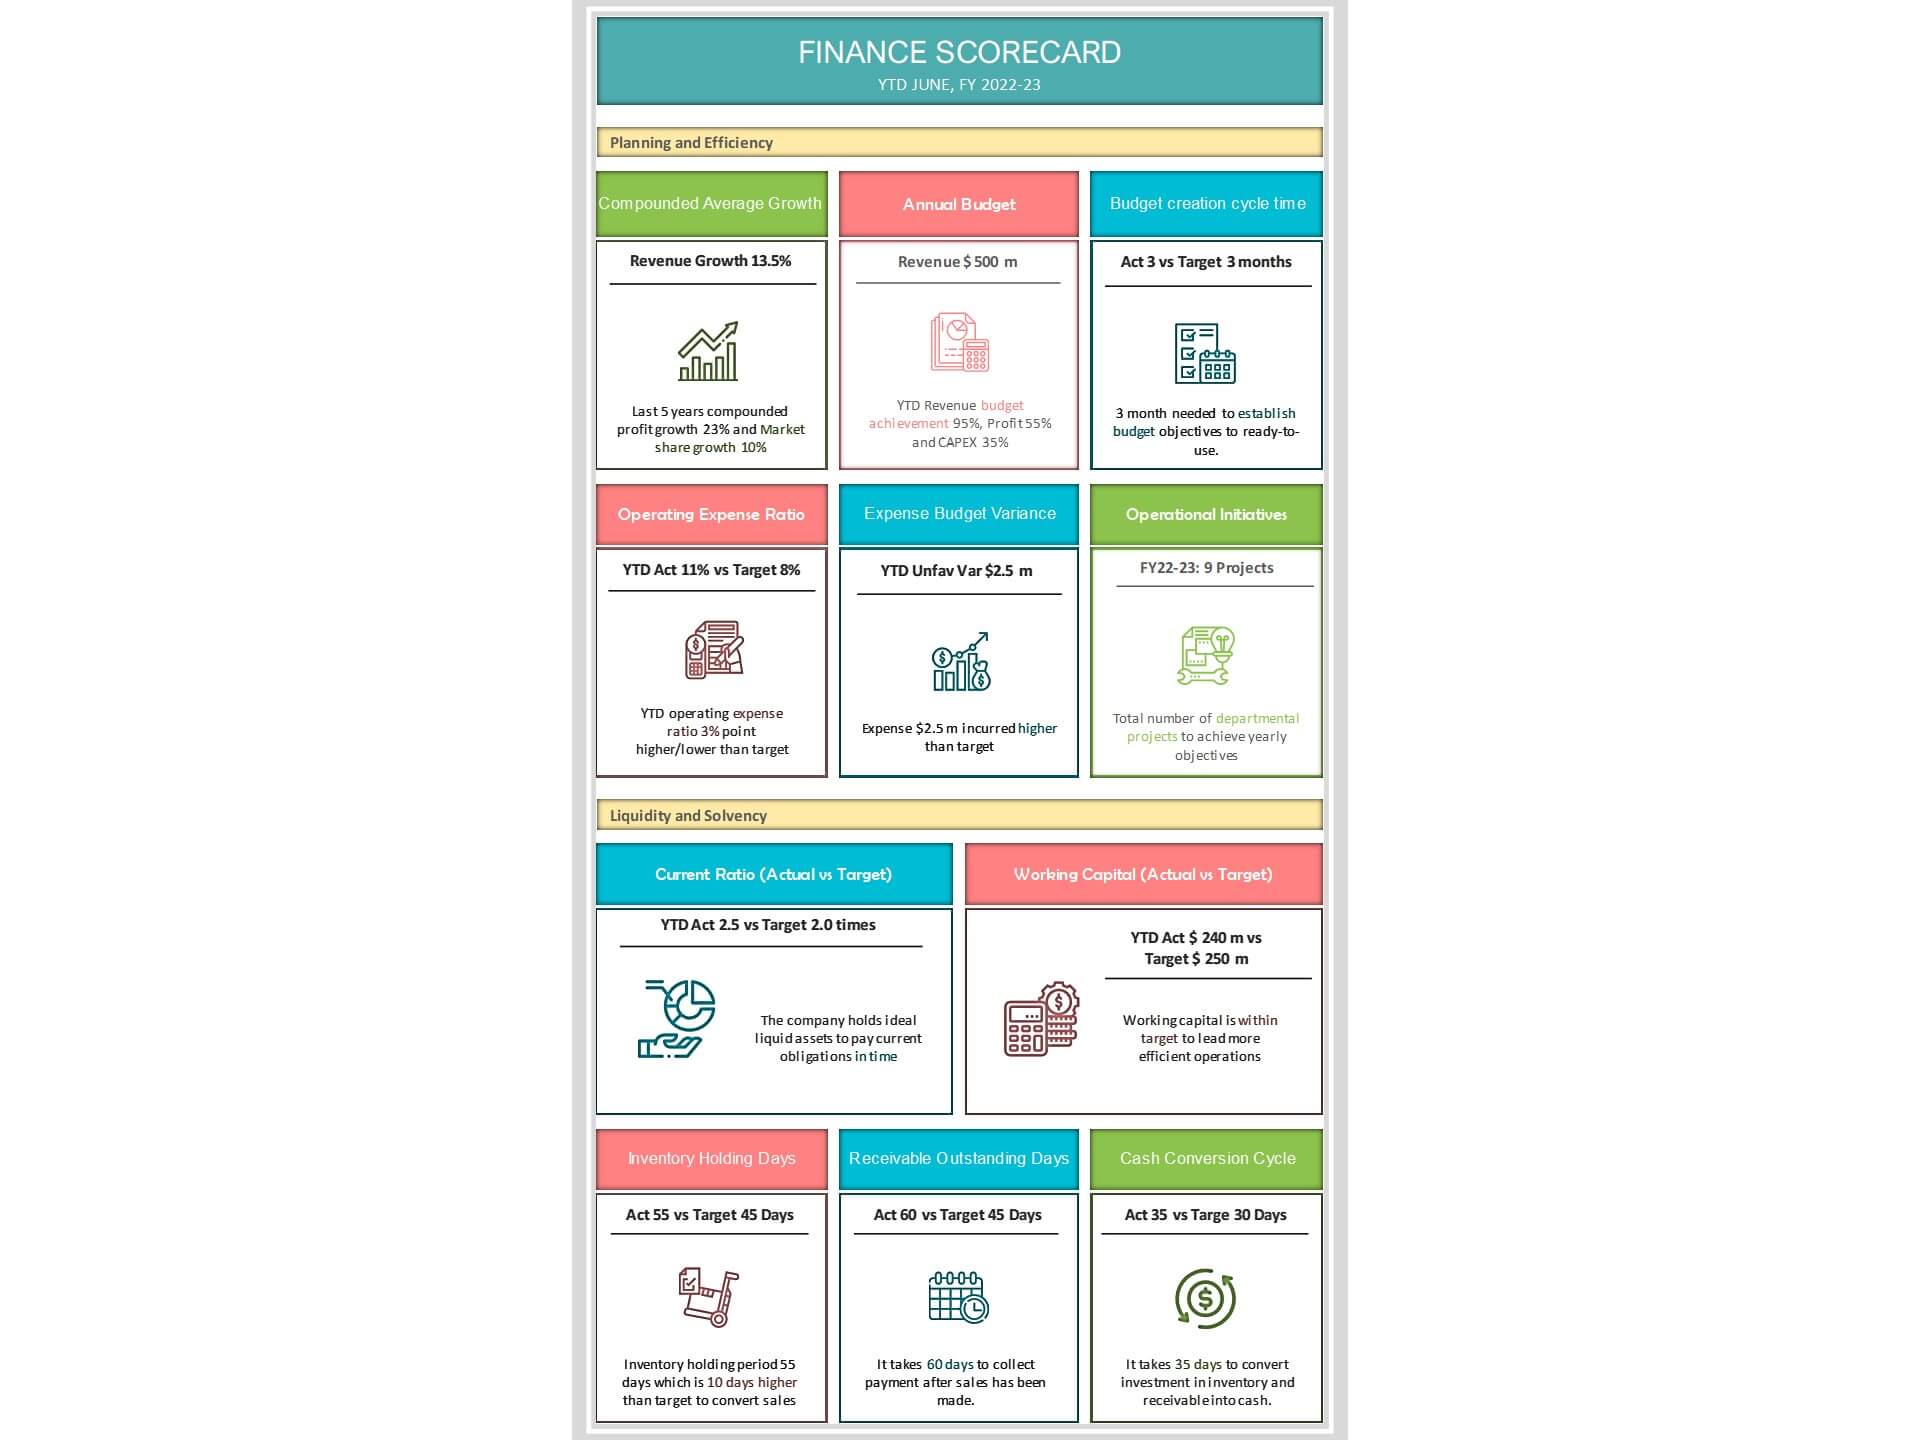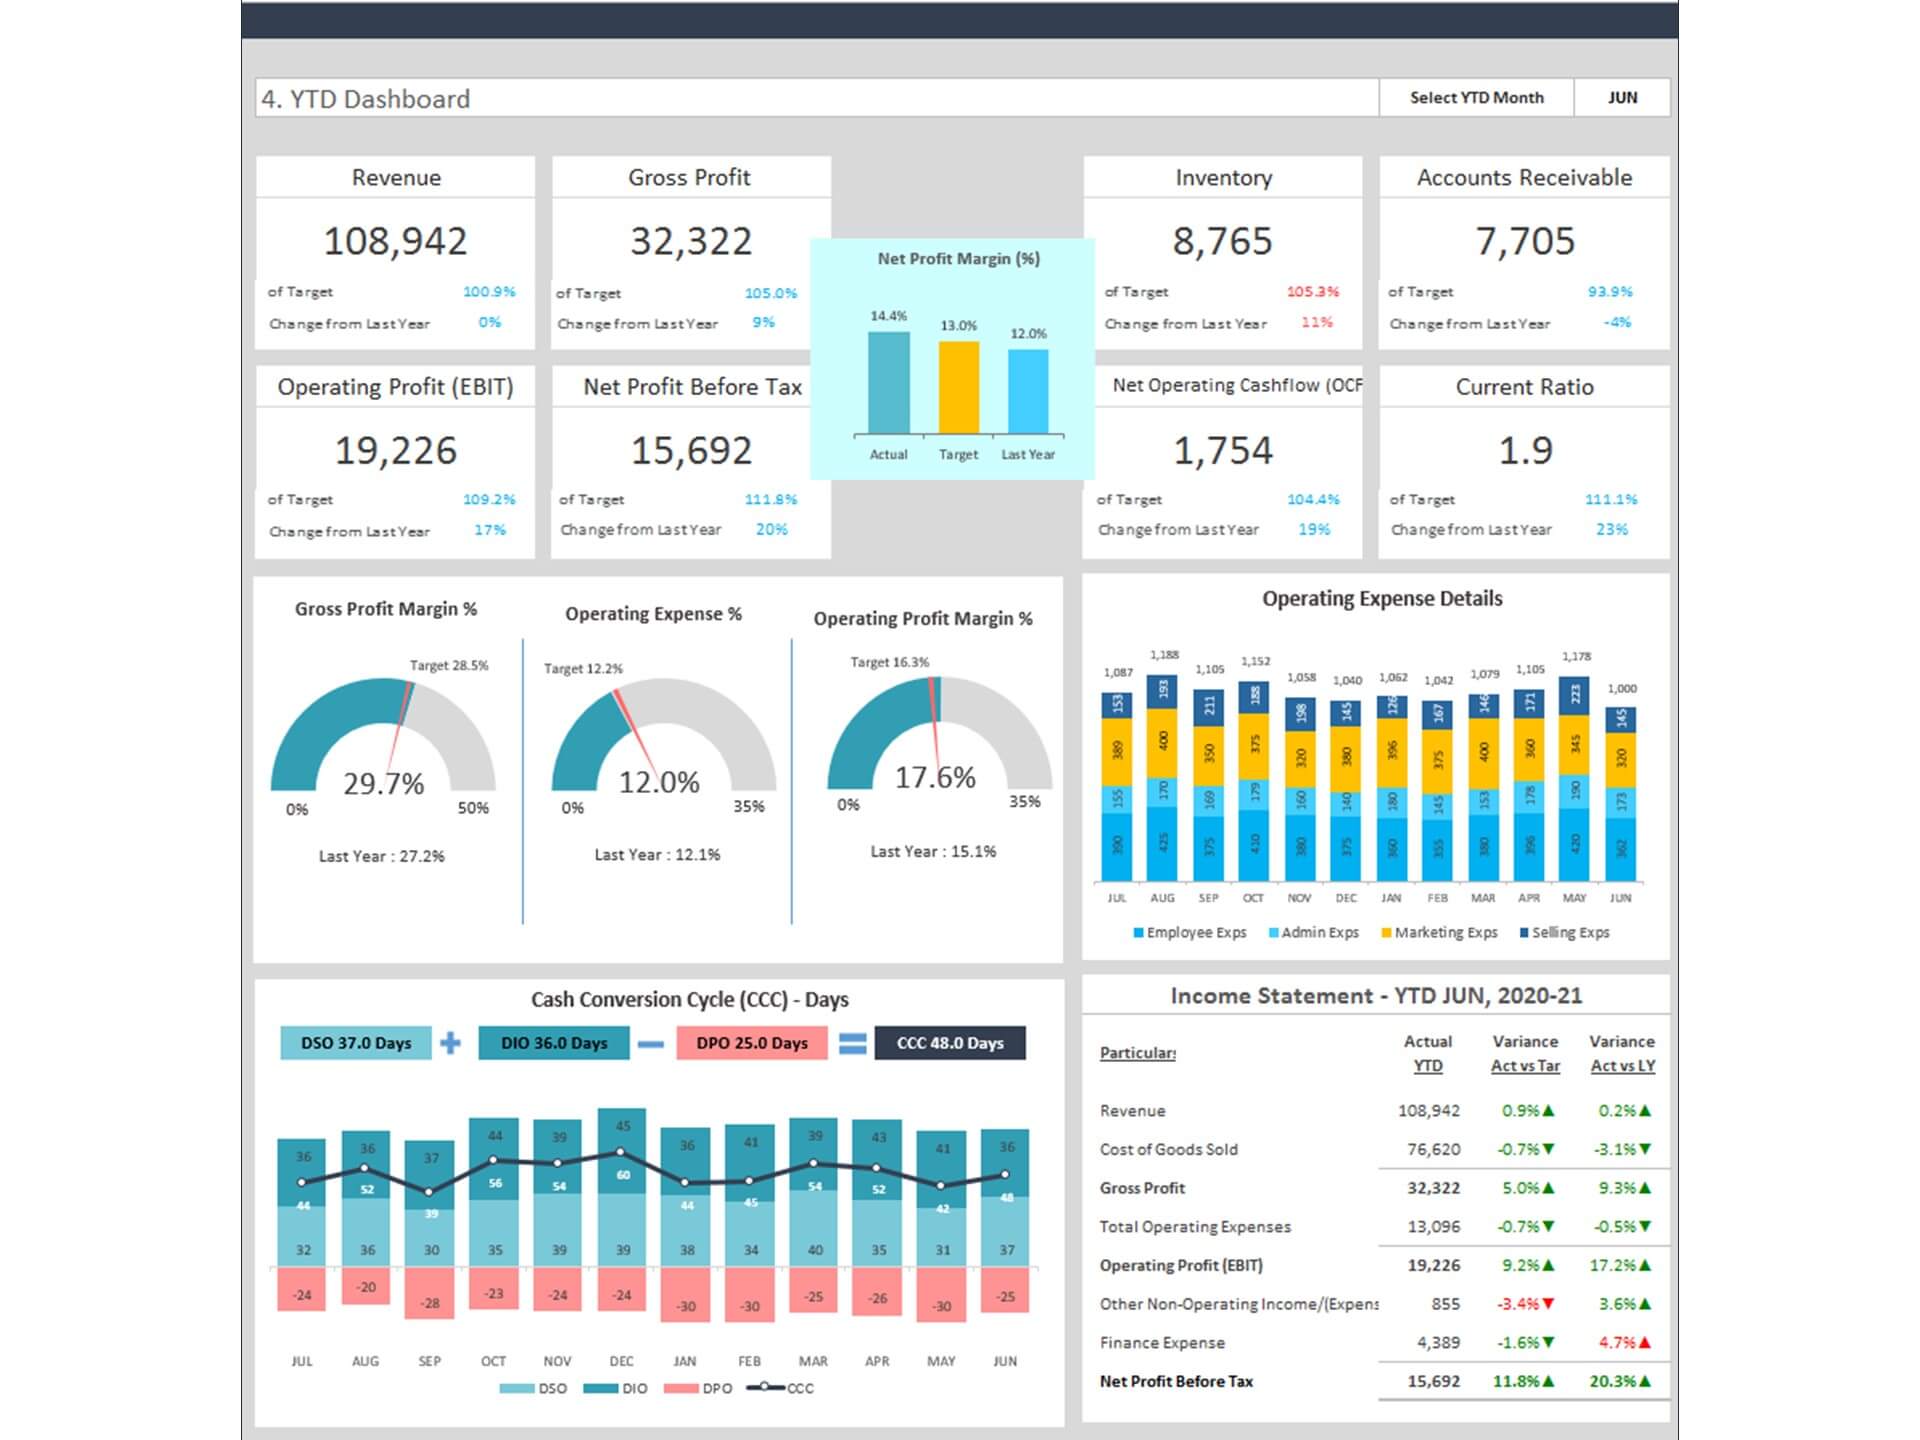
Sales and Profitability Dashboard is an Excel Template that will help you to visualize revenue and profitability indicators in one place and communicate the most important information to your team in a comprehensive and eye-catching way. The sales picture provides an at-a-glance window into the organization’s performance so you can take effective actions to achieve the targets. The profitability picture provides how much of every sales dollar the company is able to keep for-profit after paying all costs. This is the most commonly referenced measure of profitability.
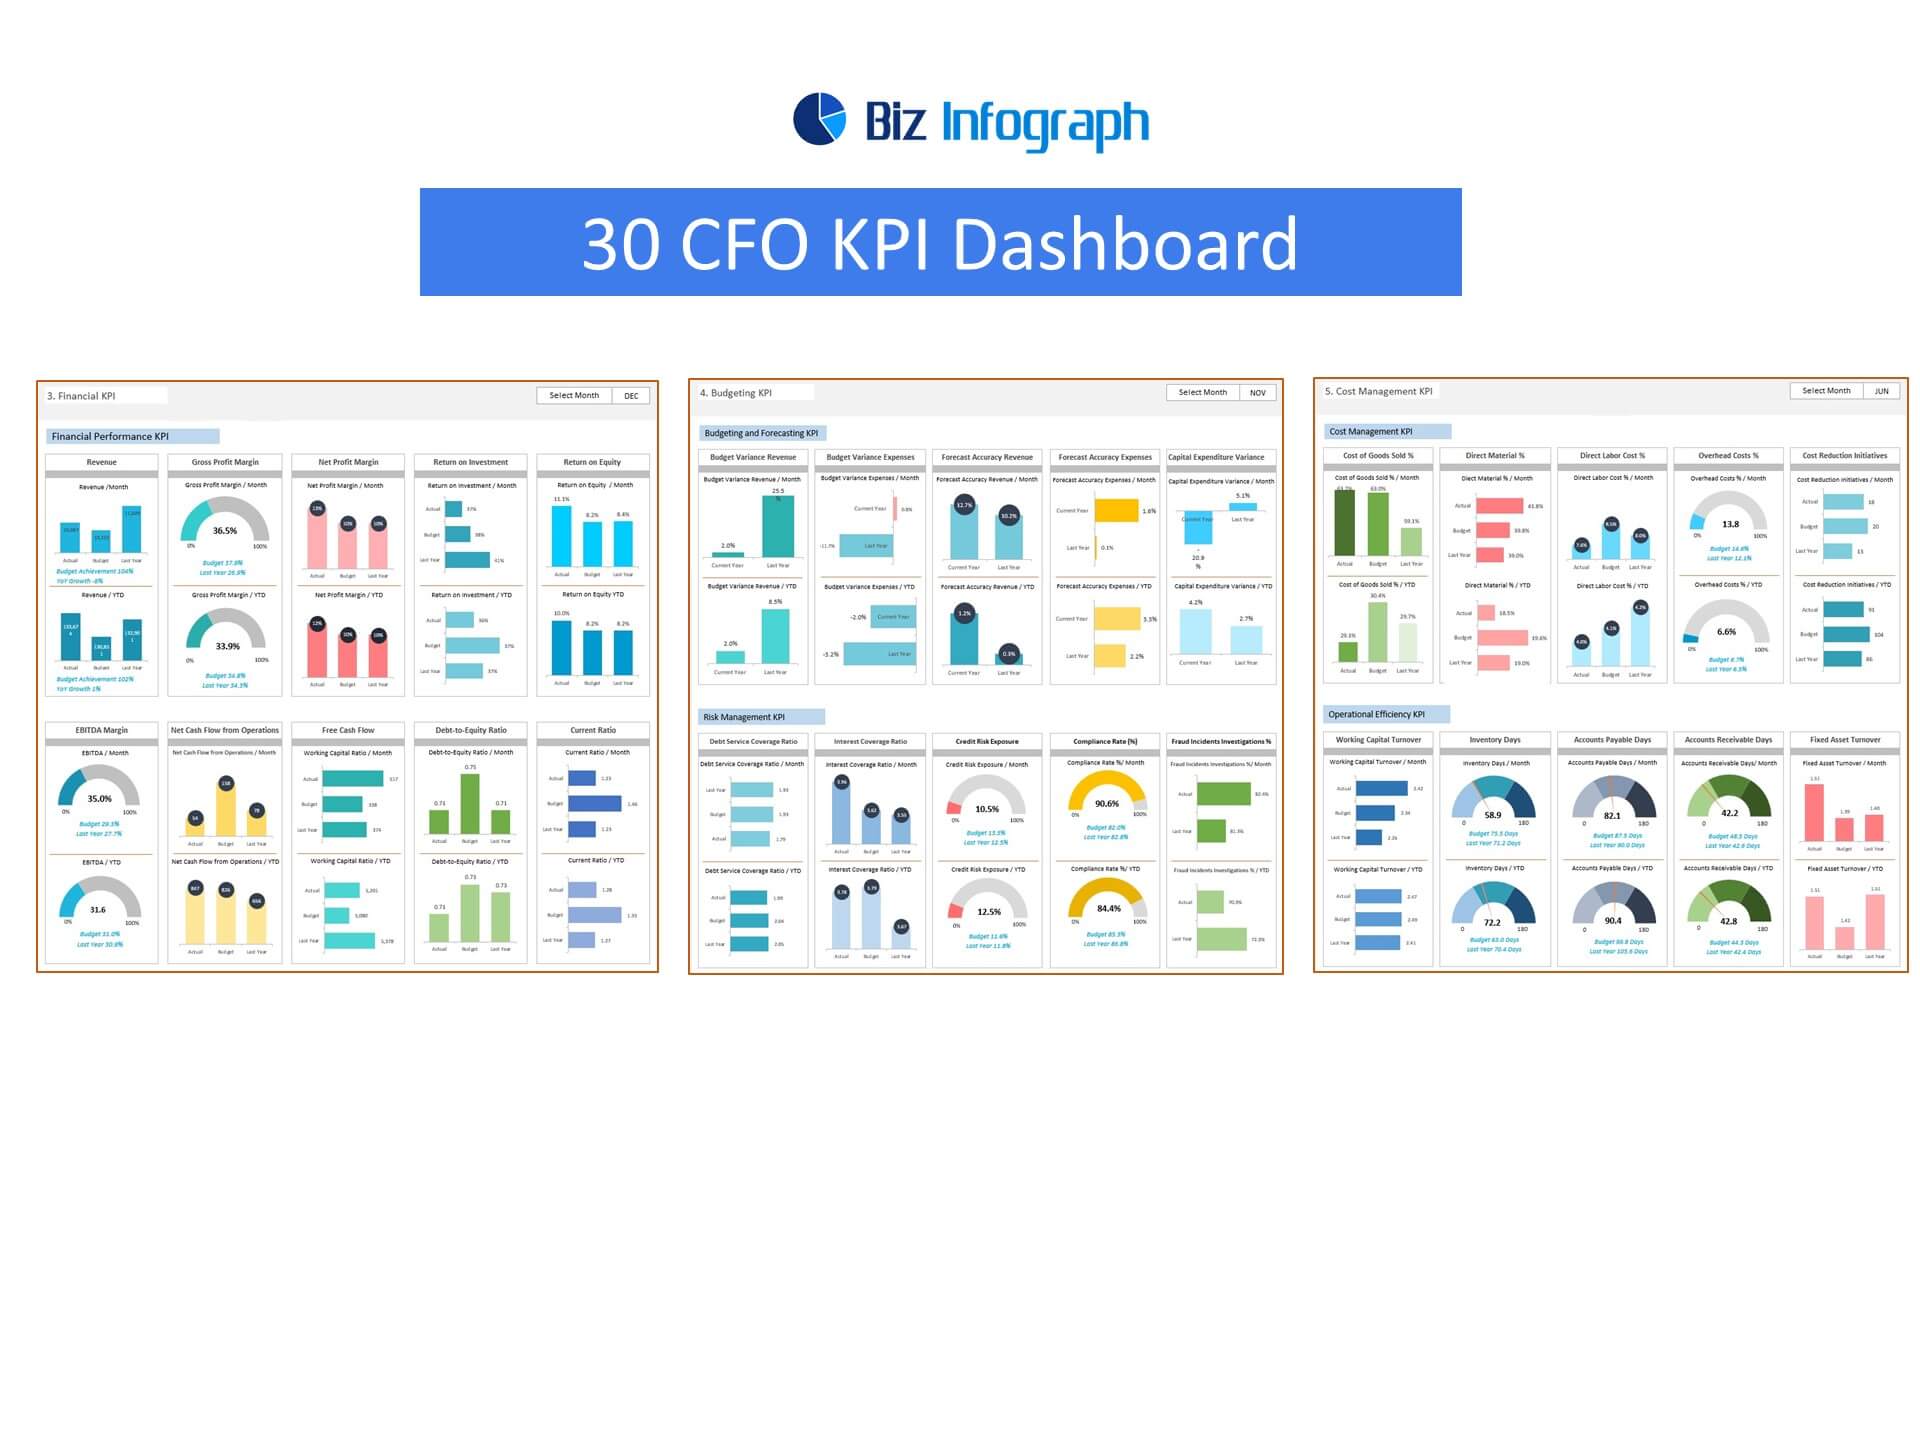
Sales and Profitability dashboard template Excel helps to enhance the analytical efforts related to major financial aspects of your organization. Major KPIs and metrics covered in sales and profitability dashboard are:
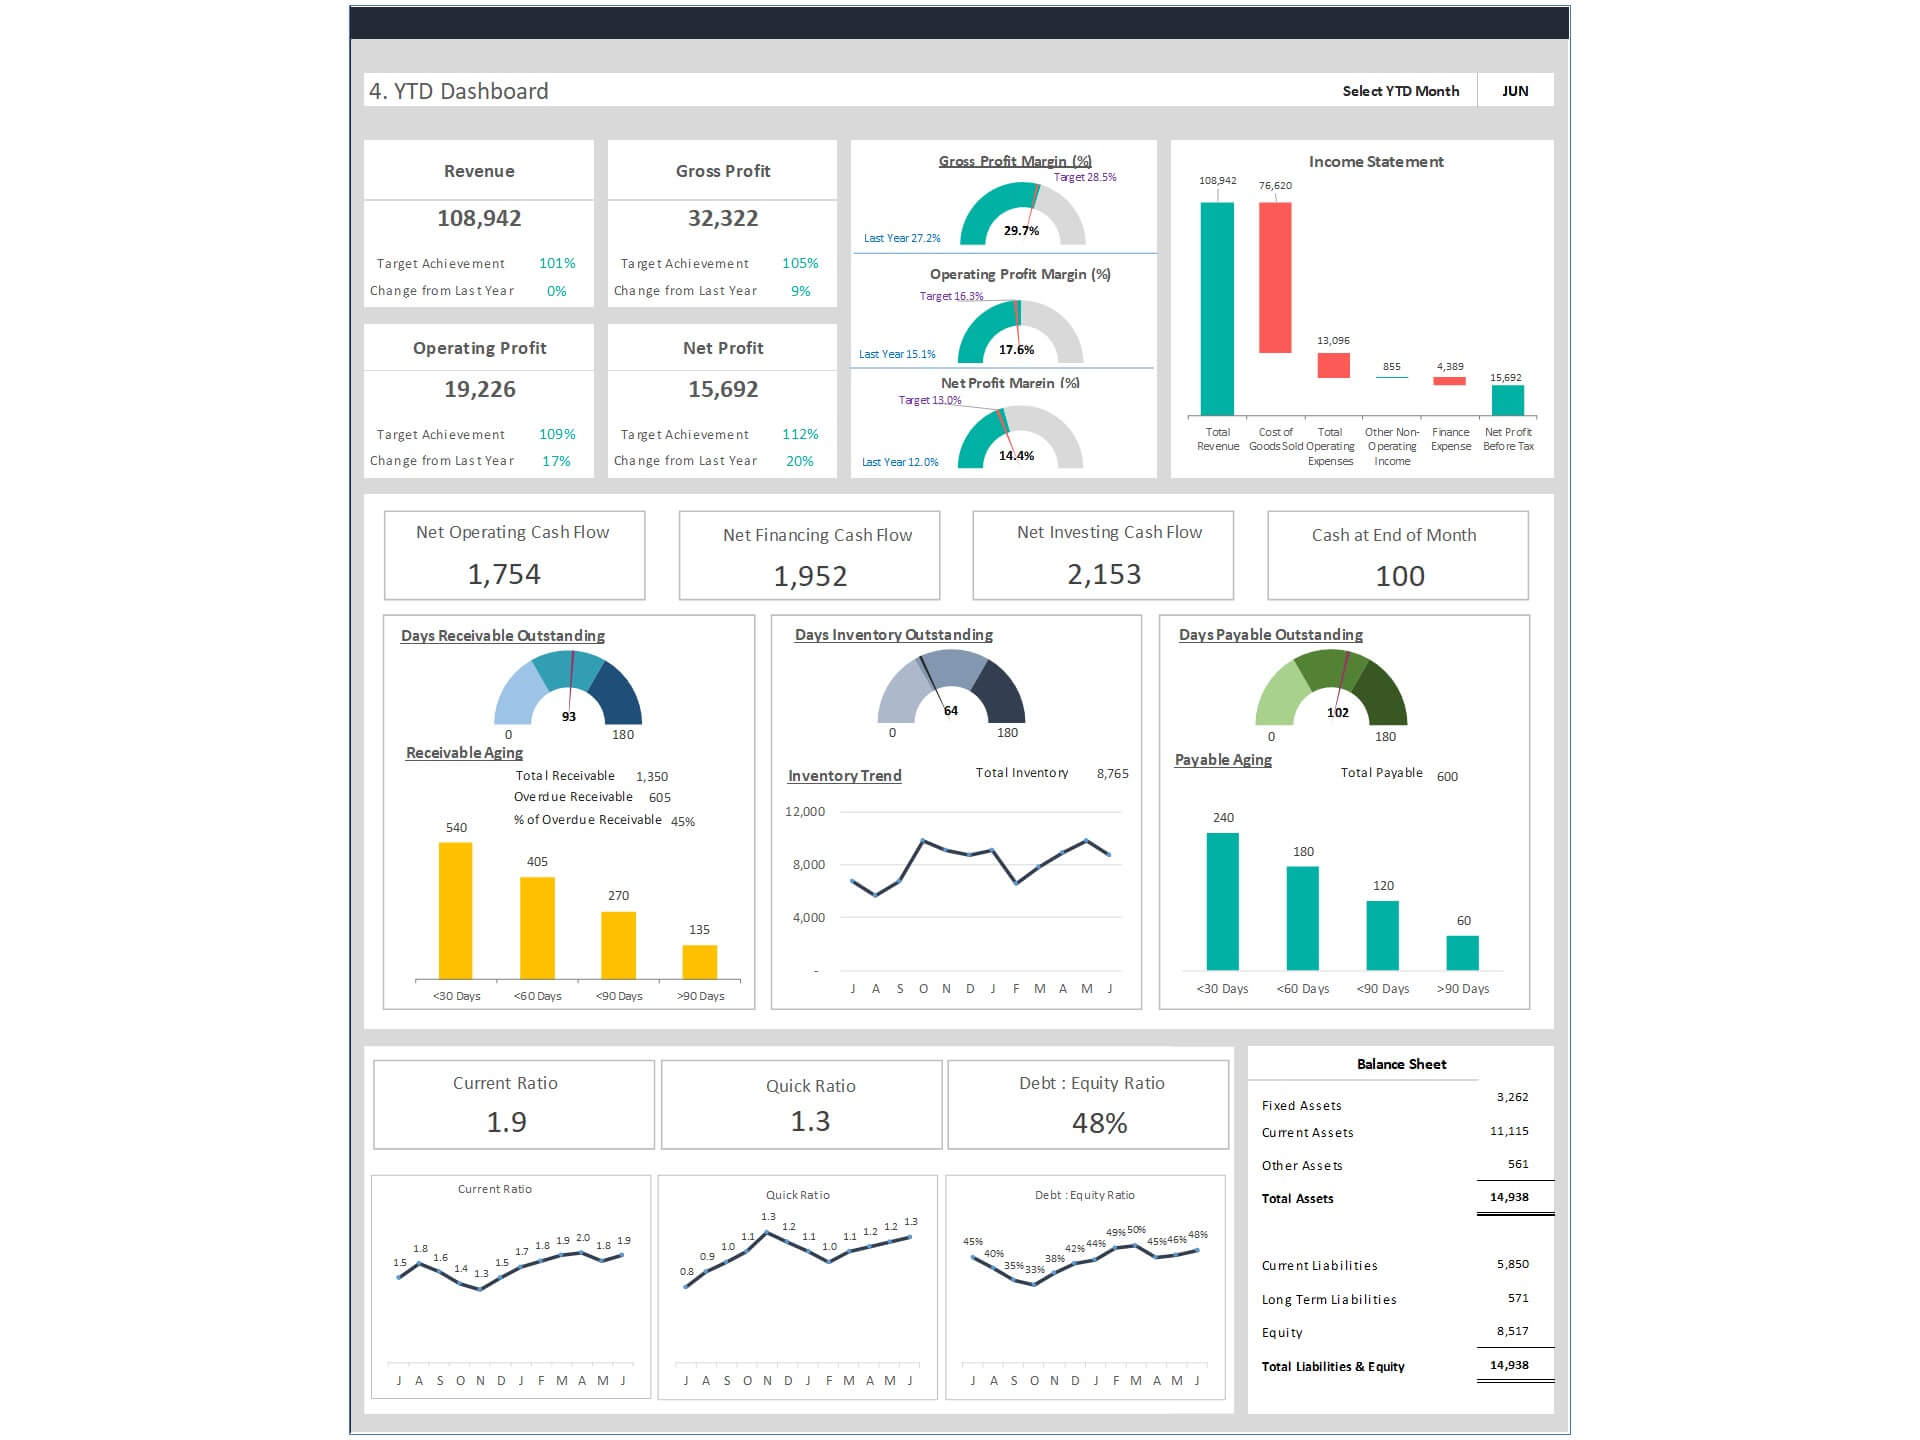
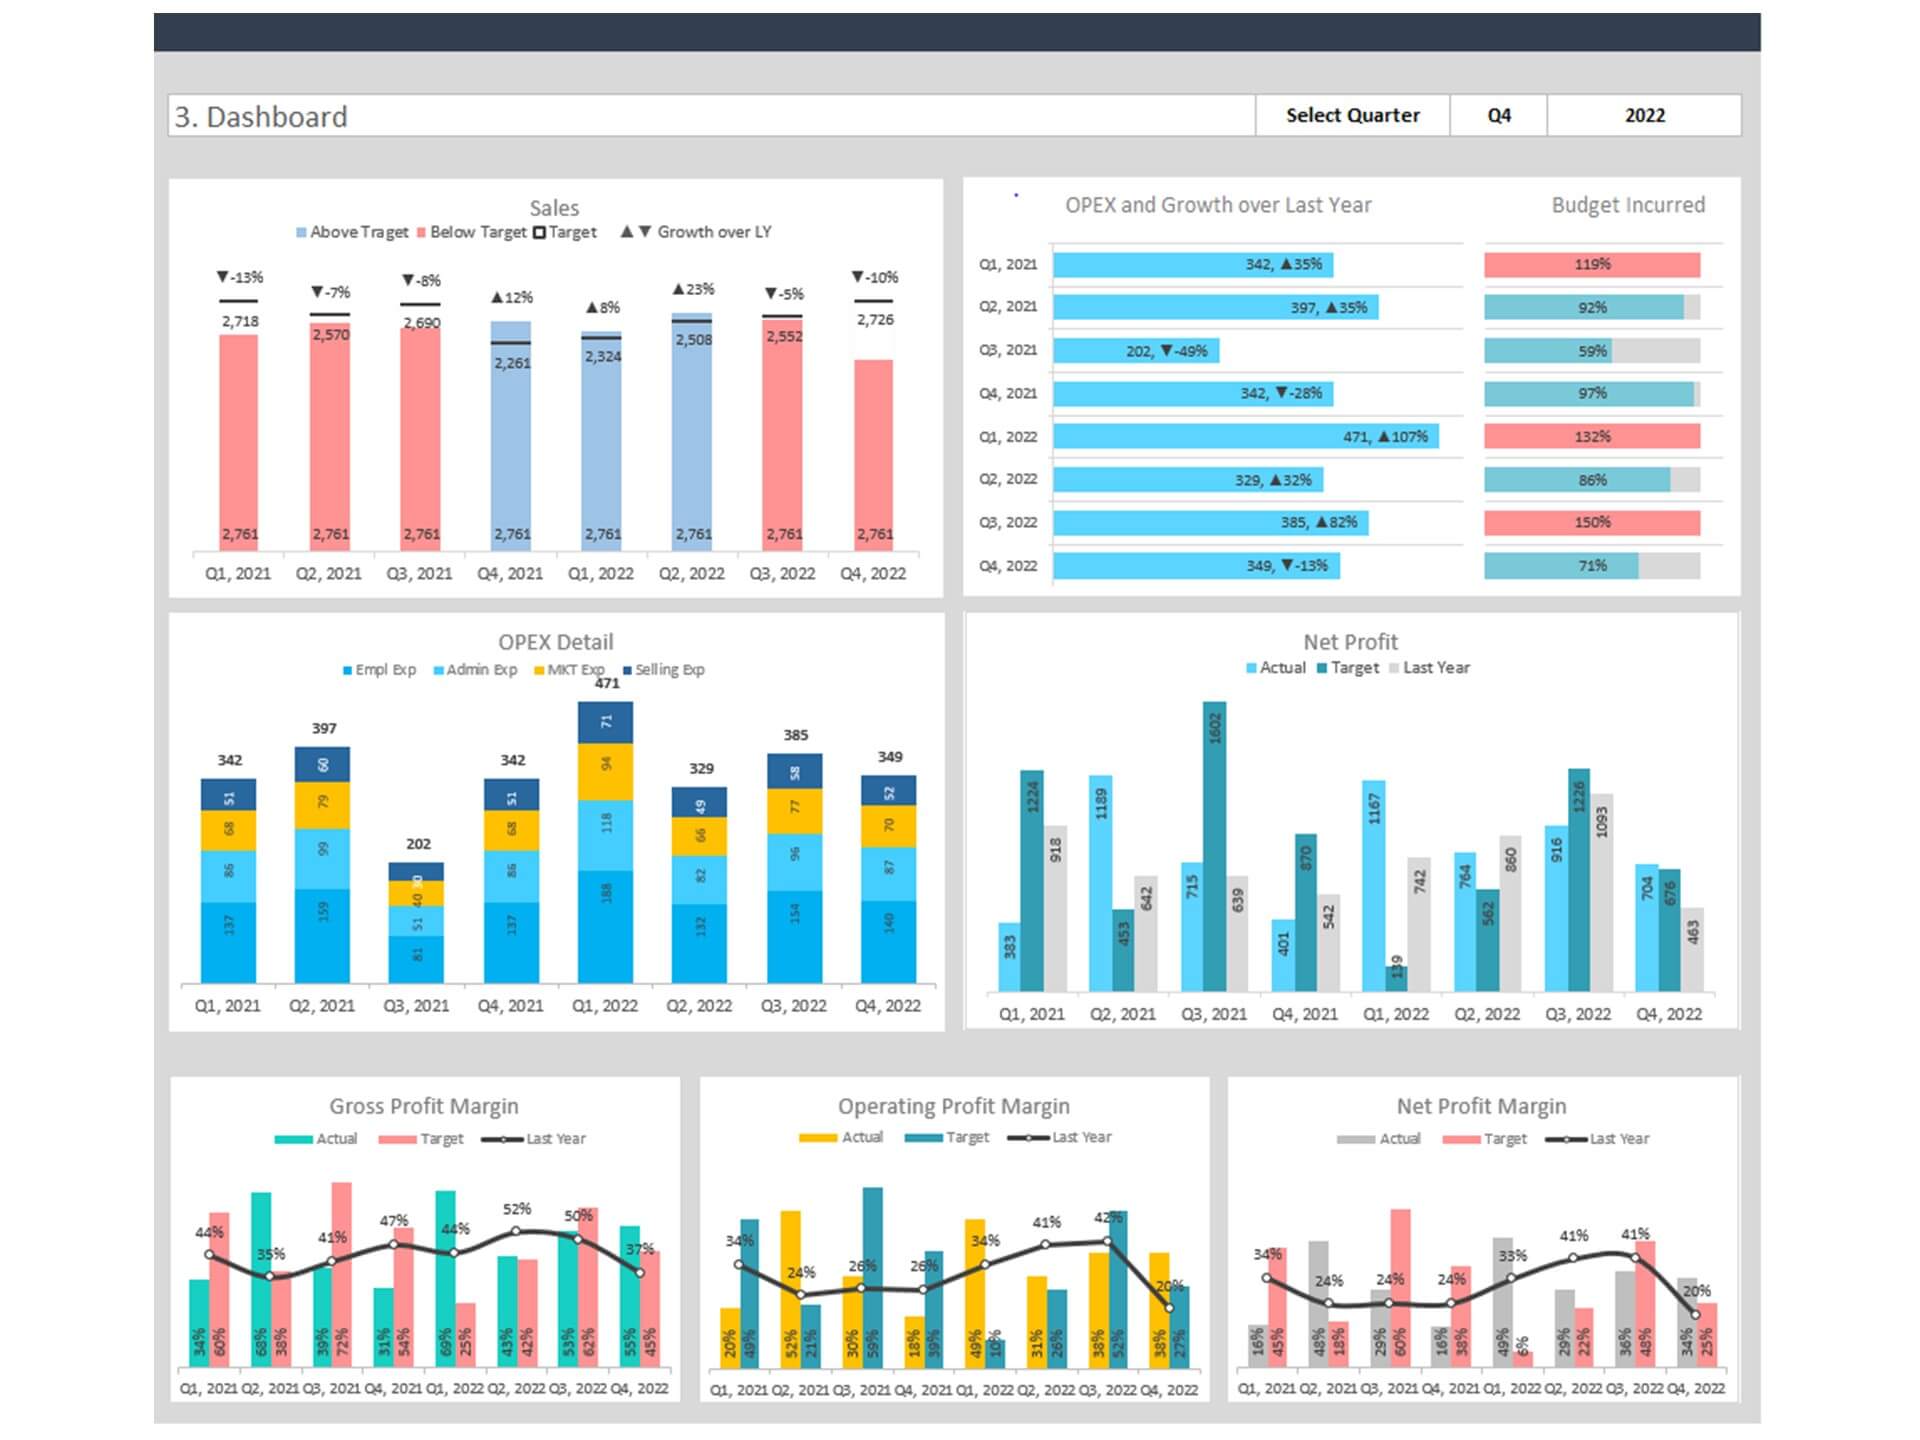
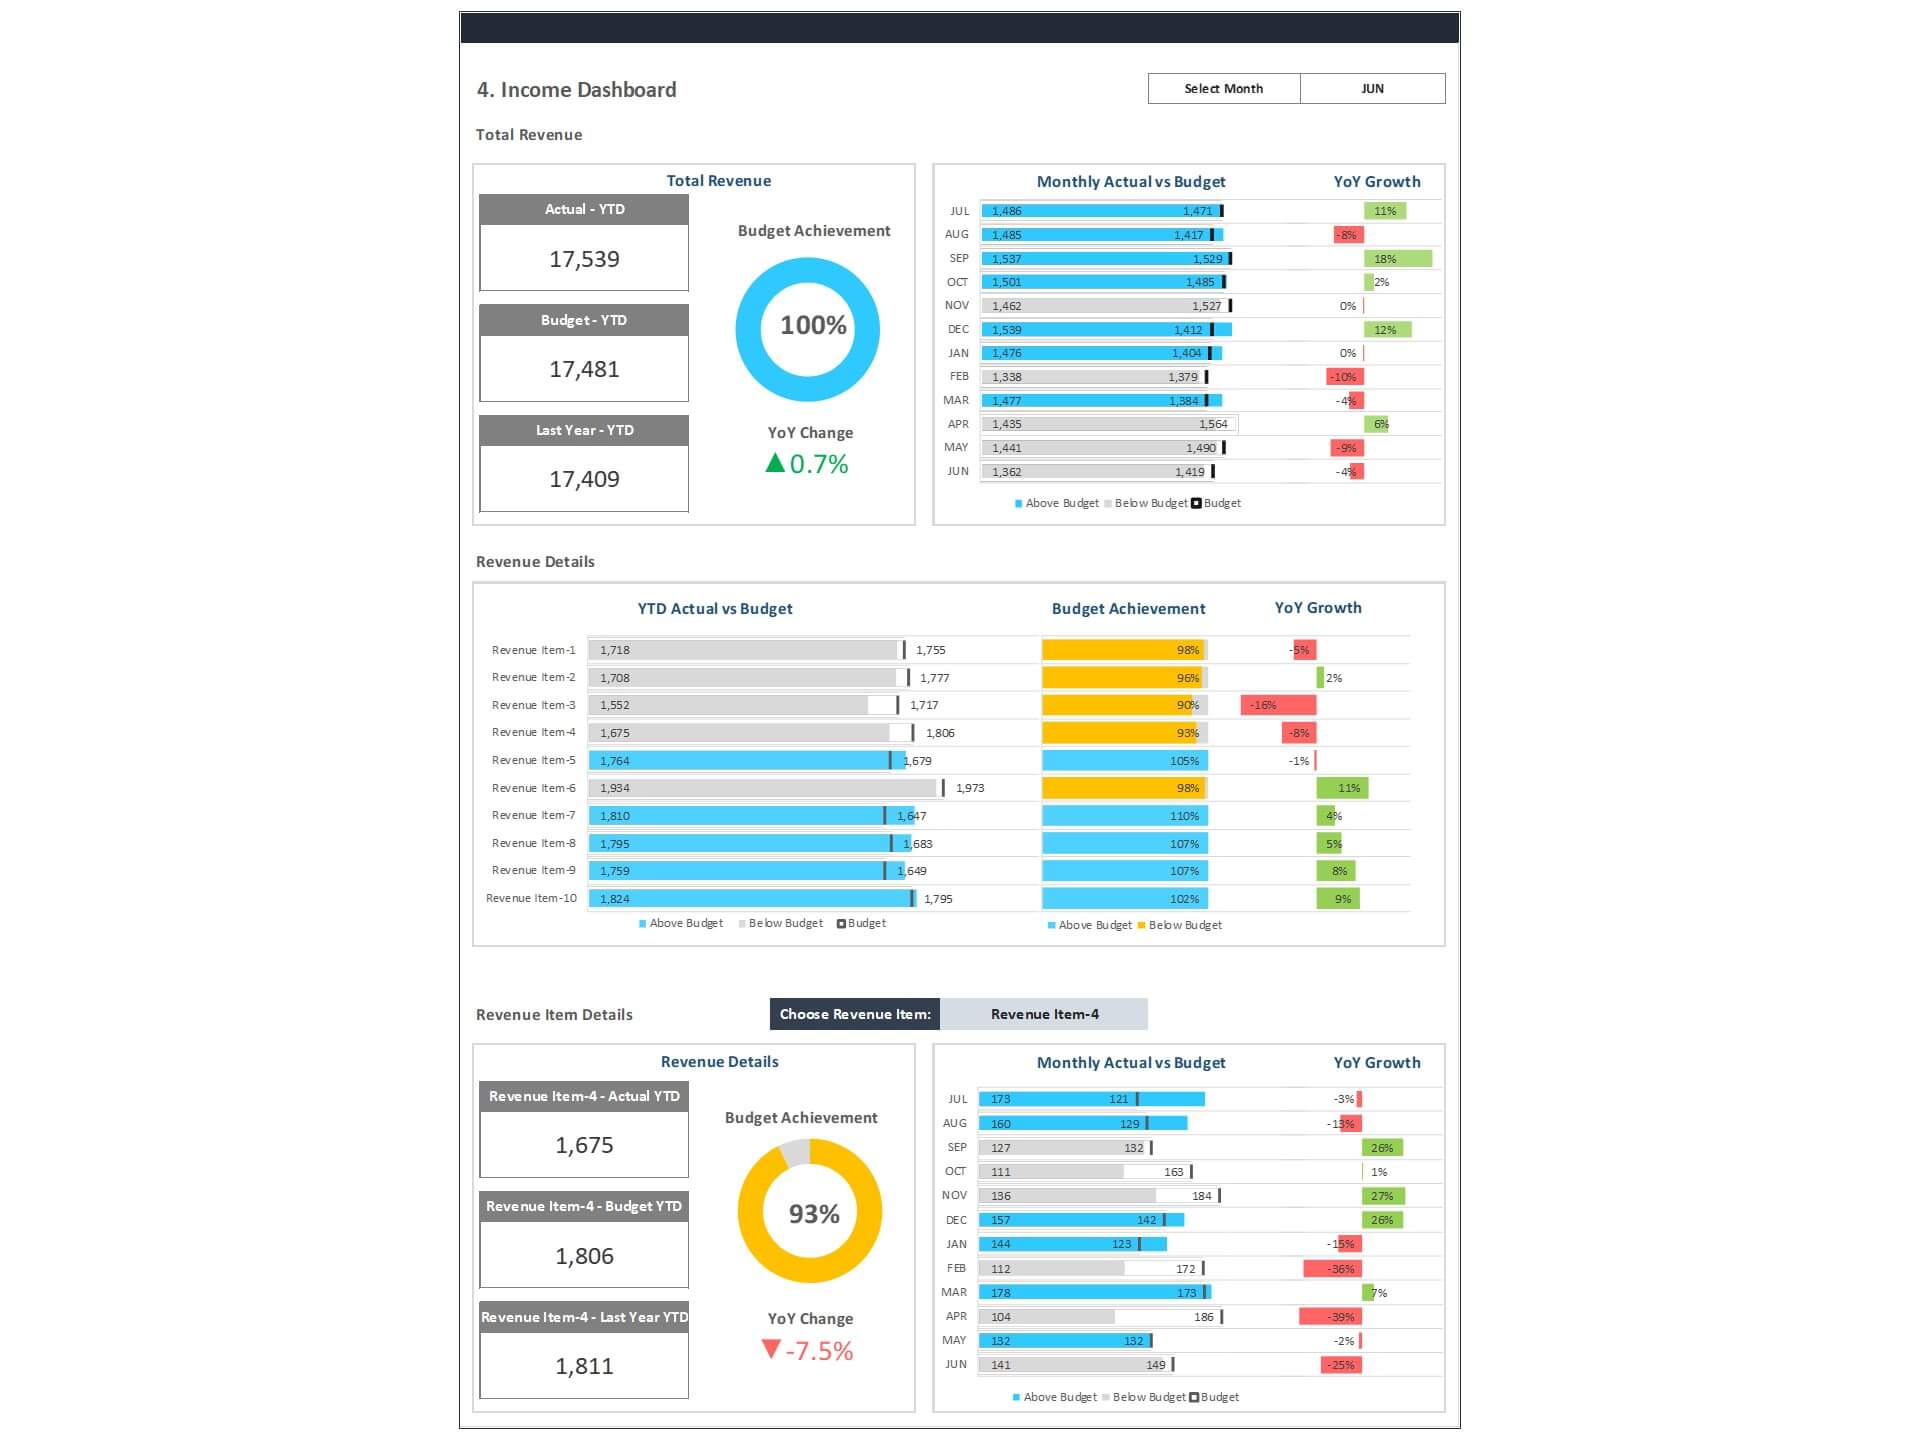
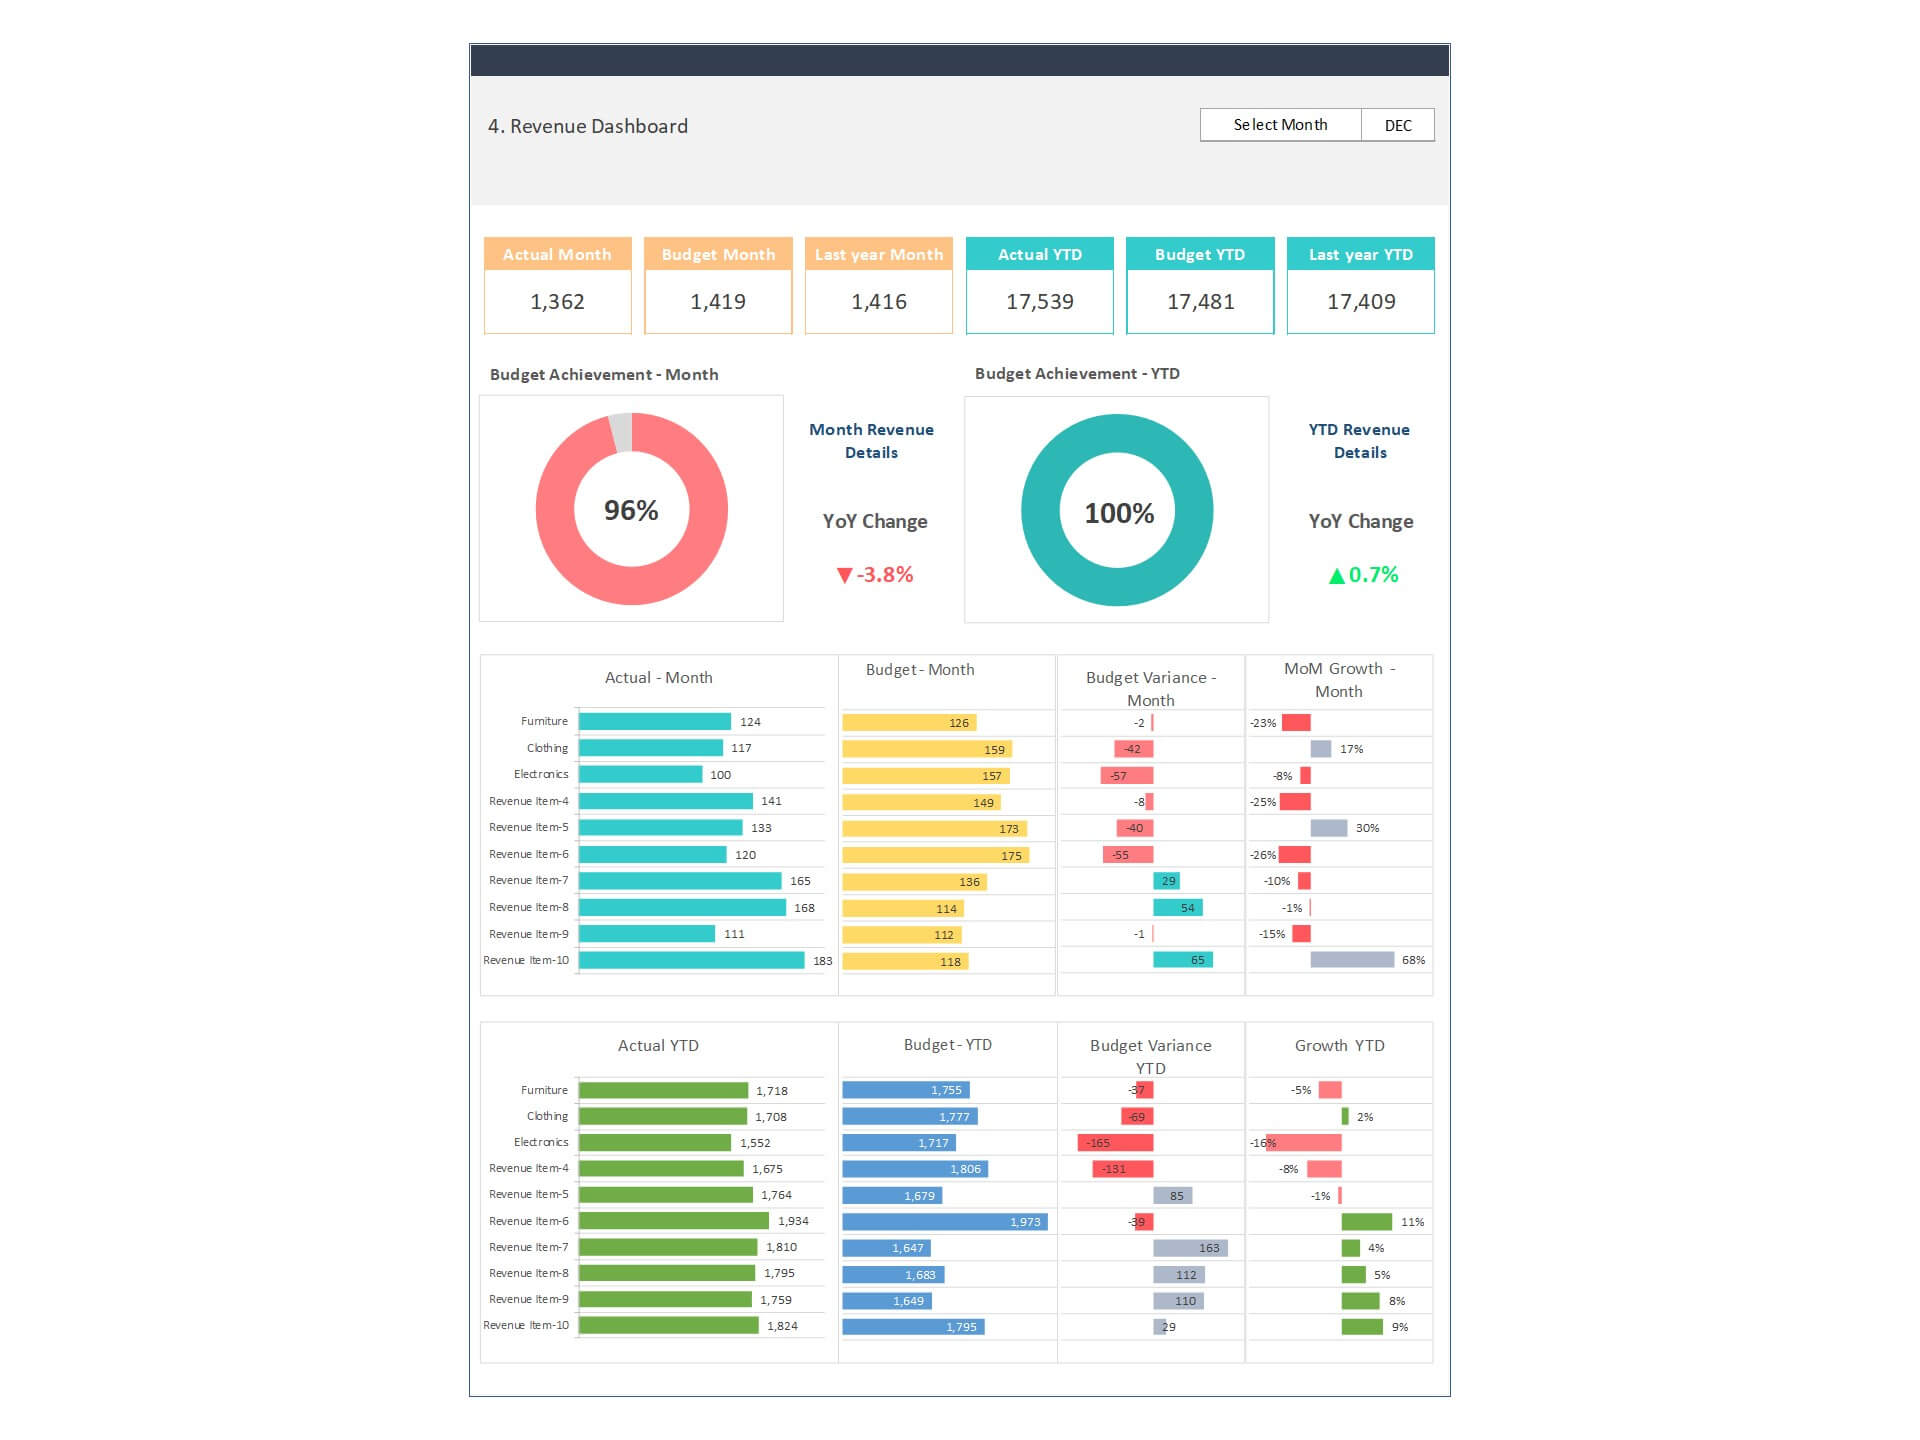
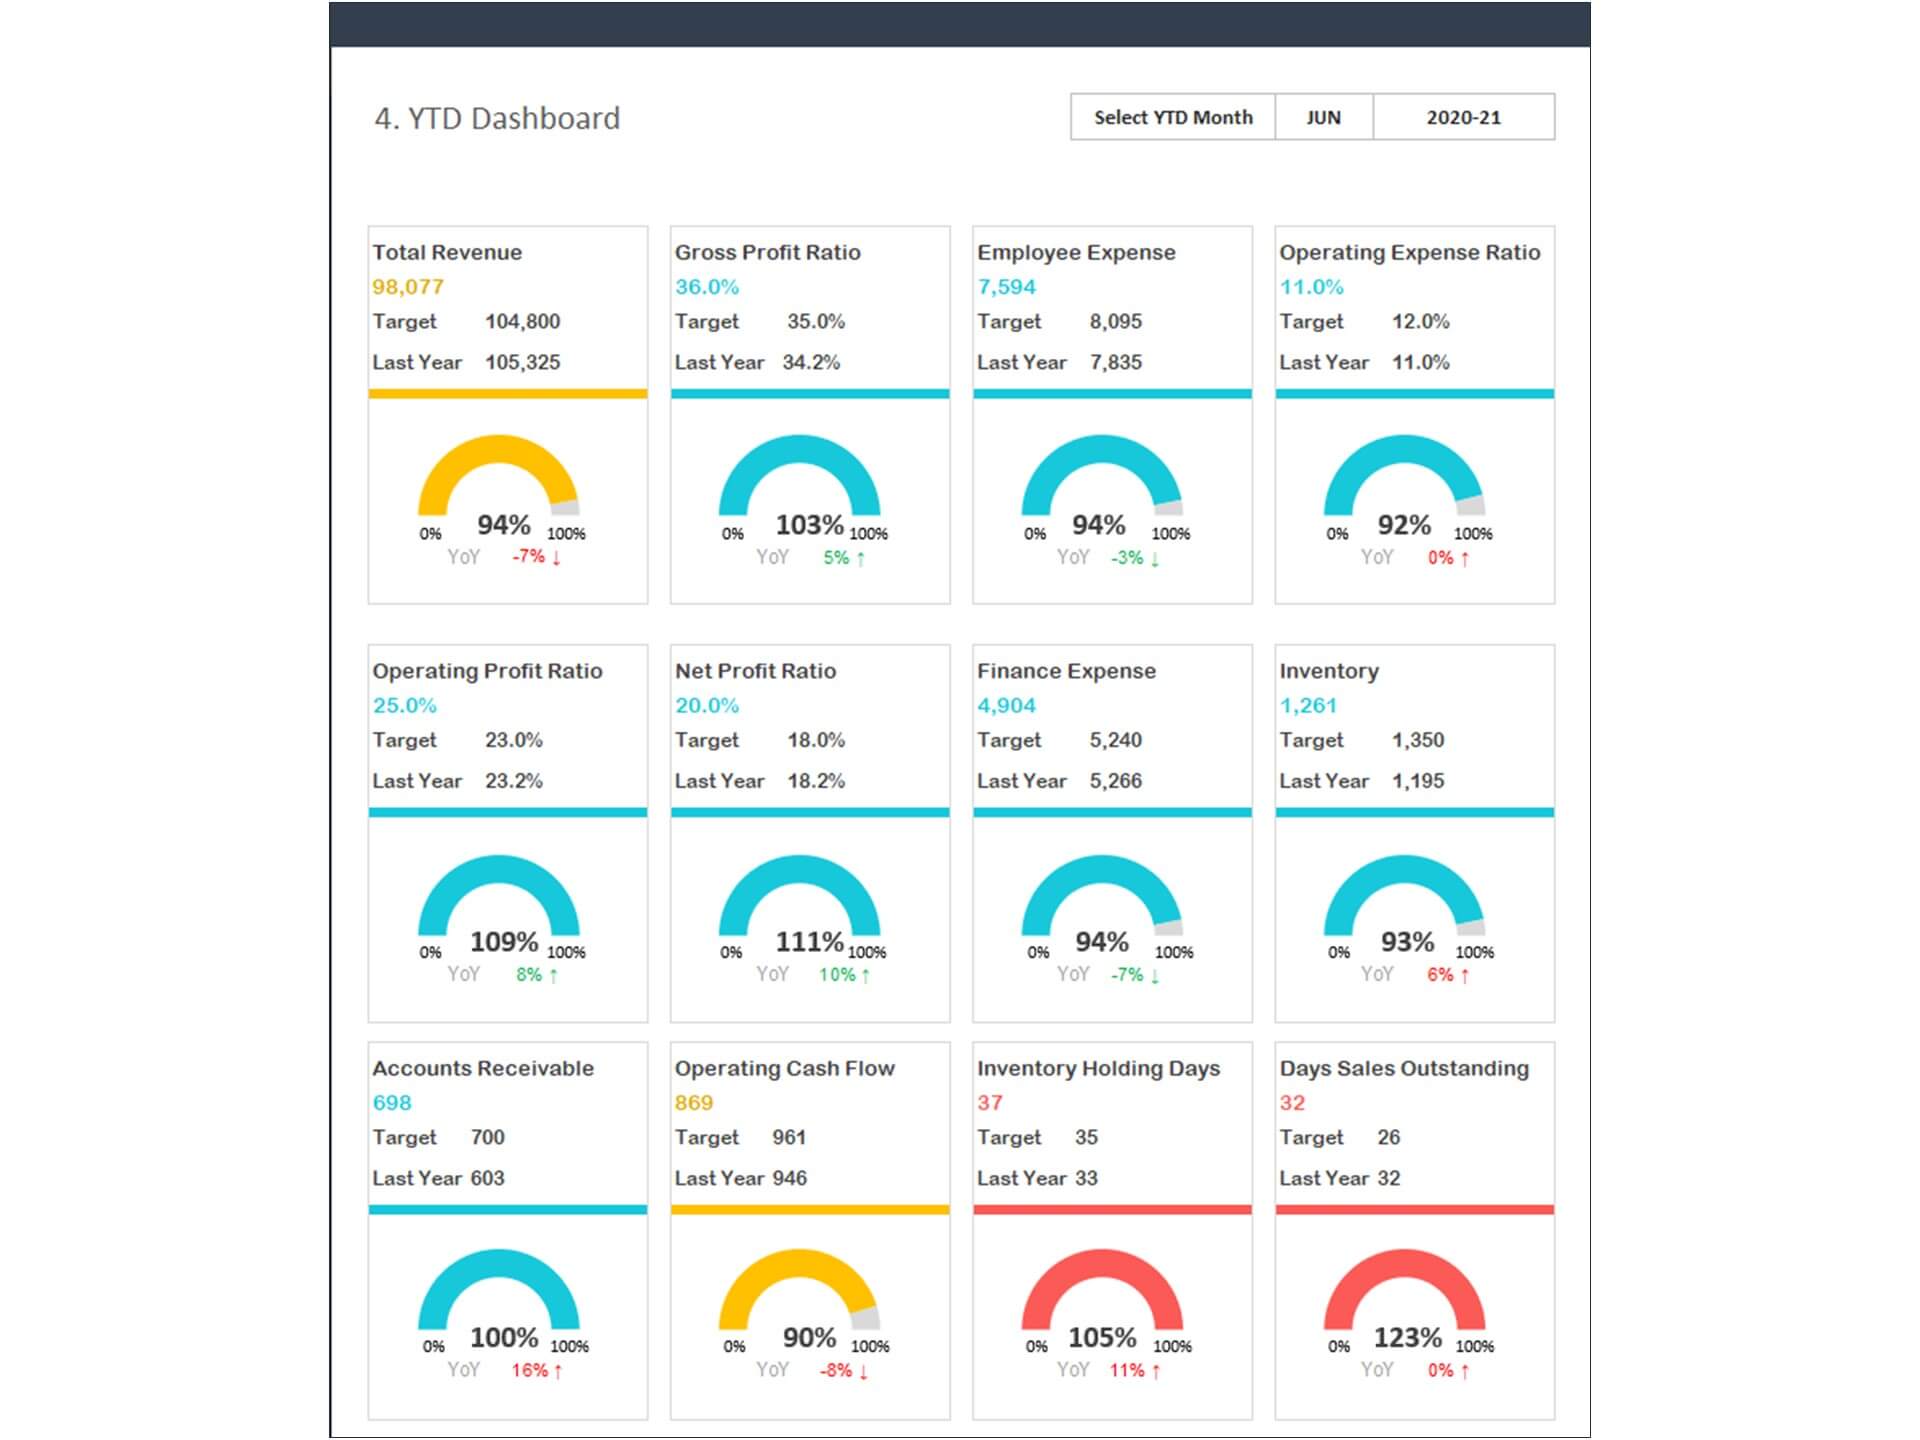
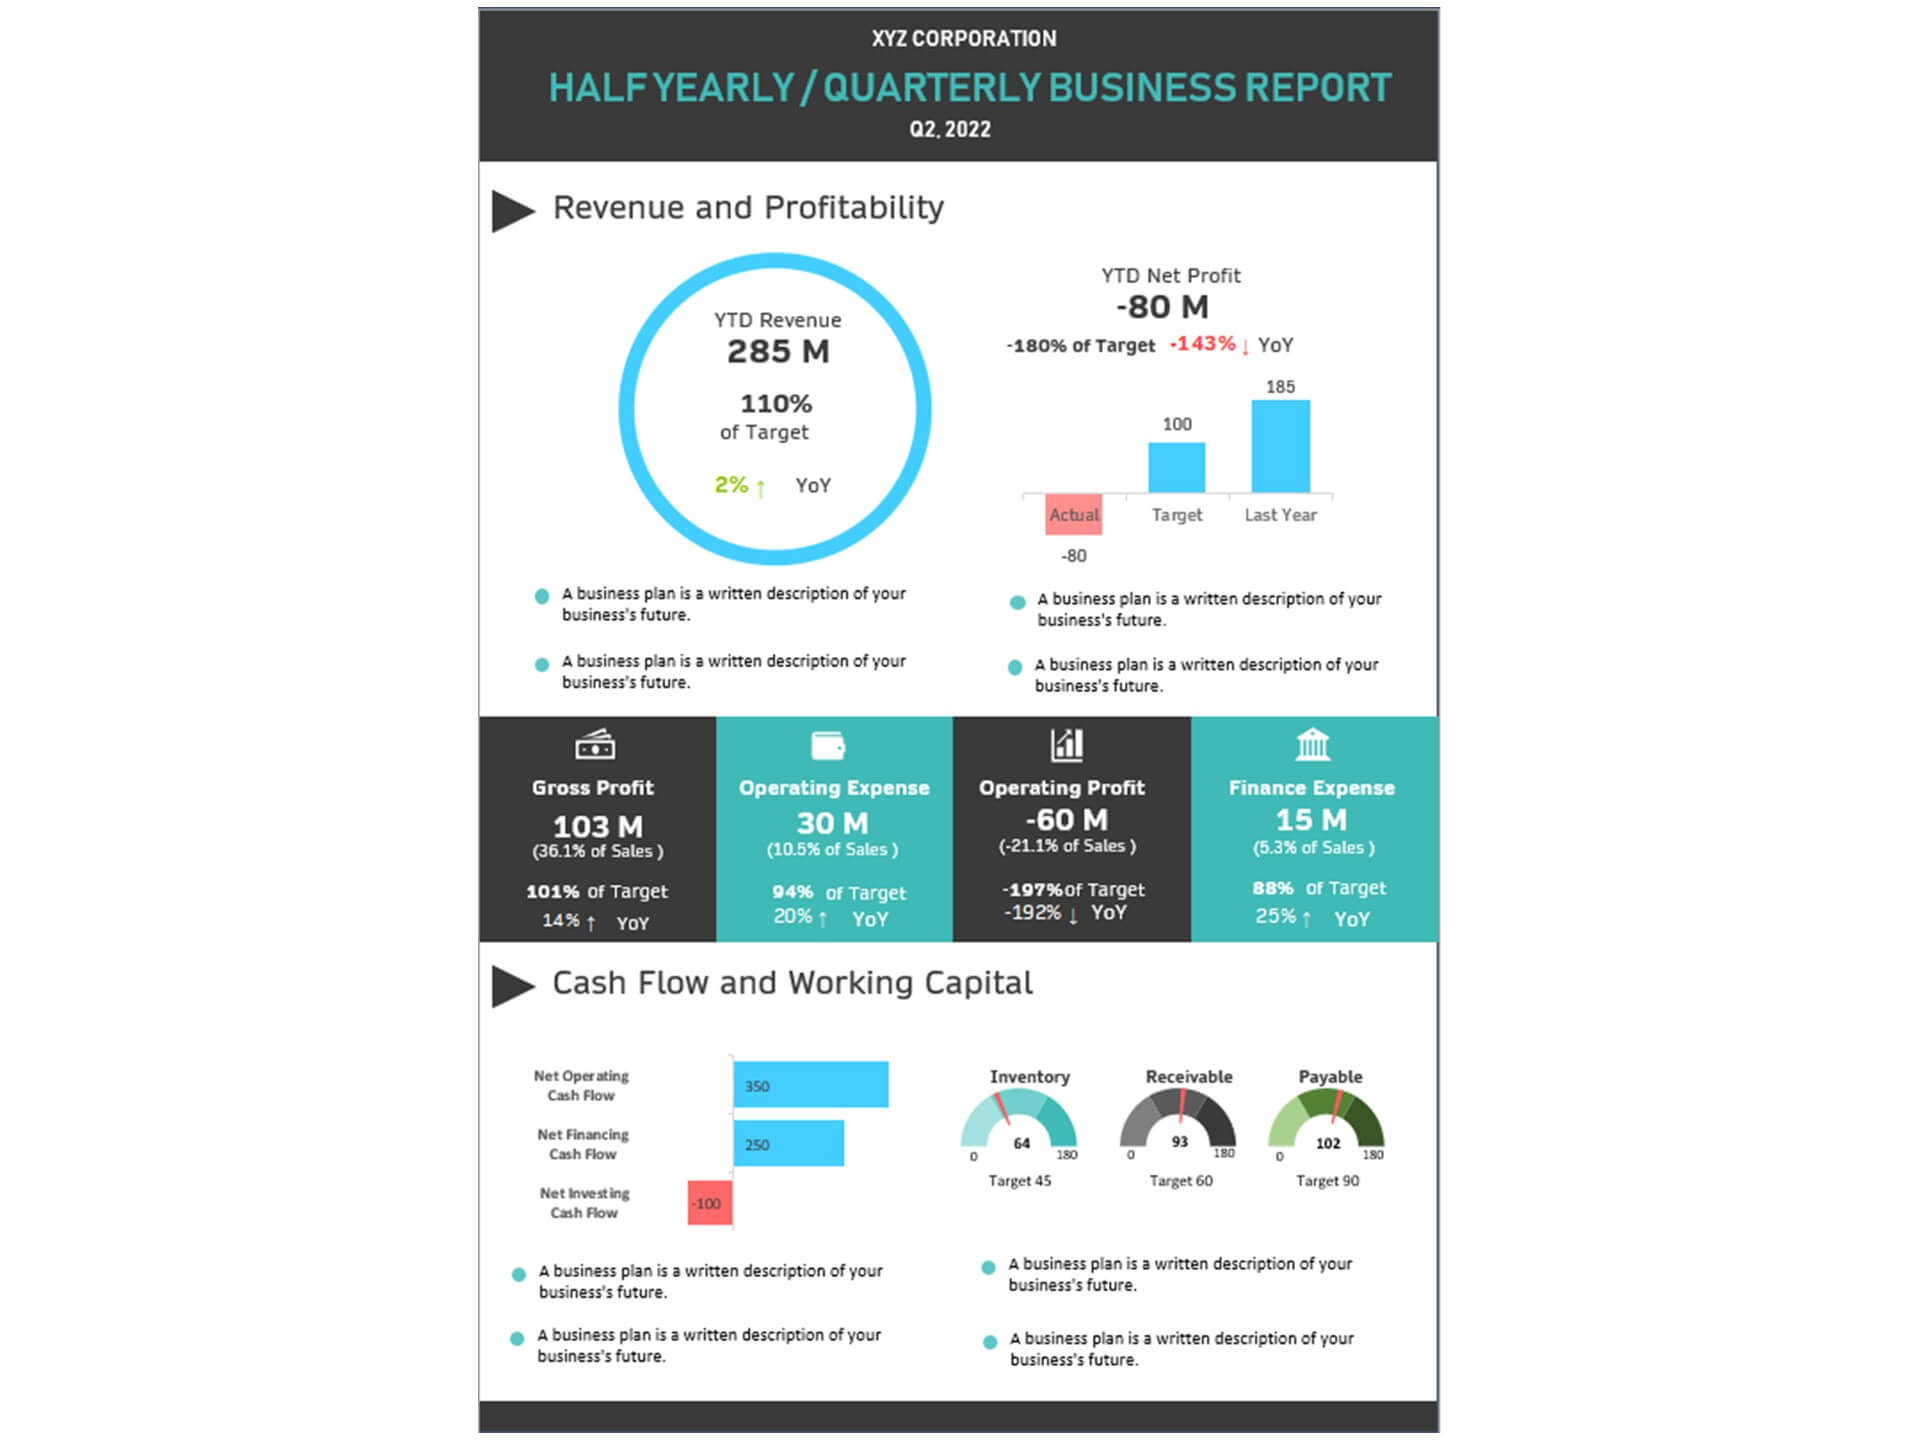
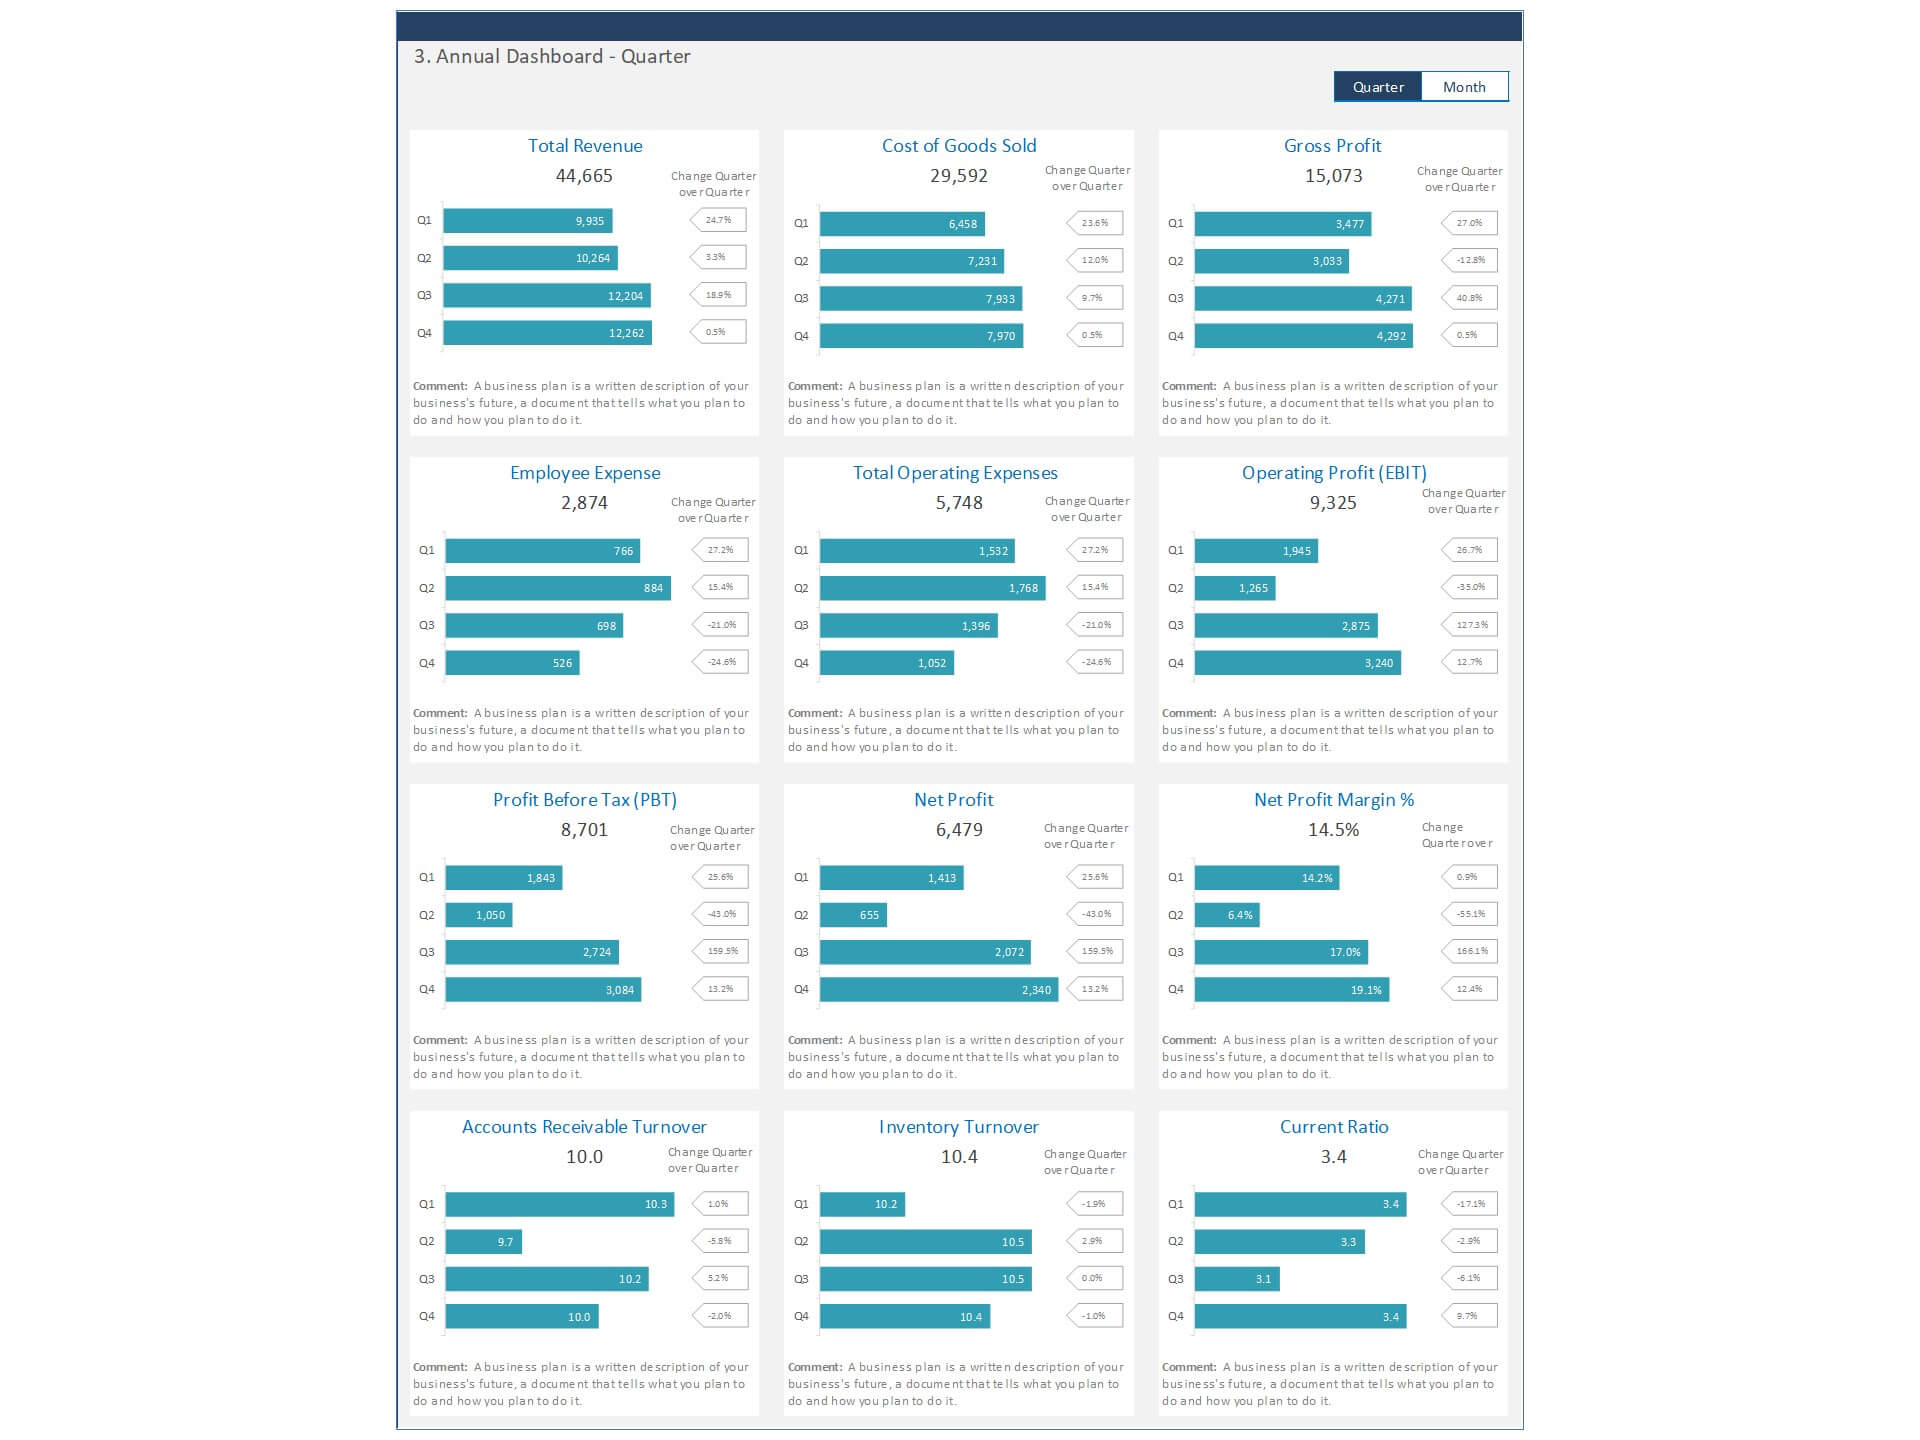
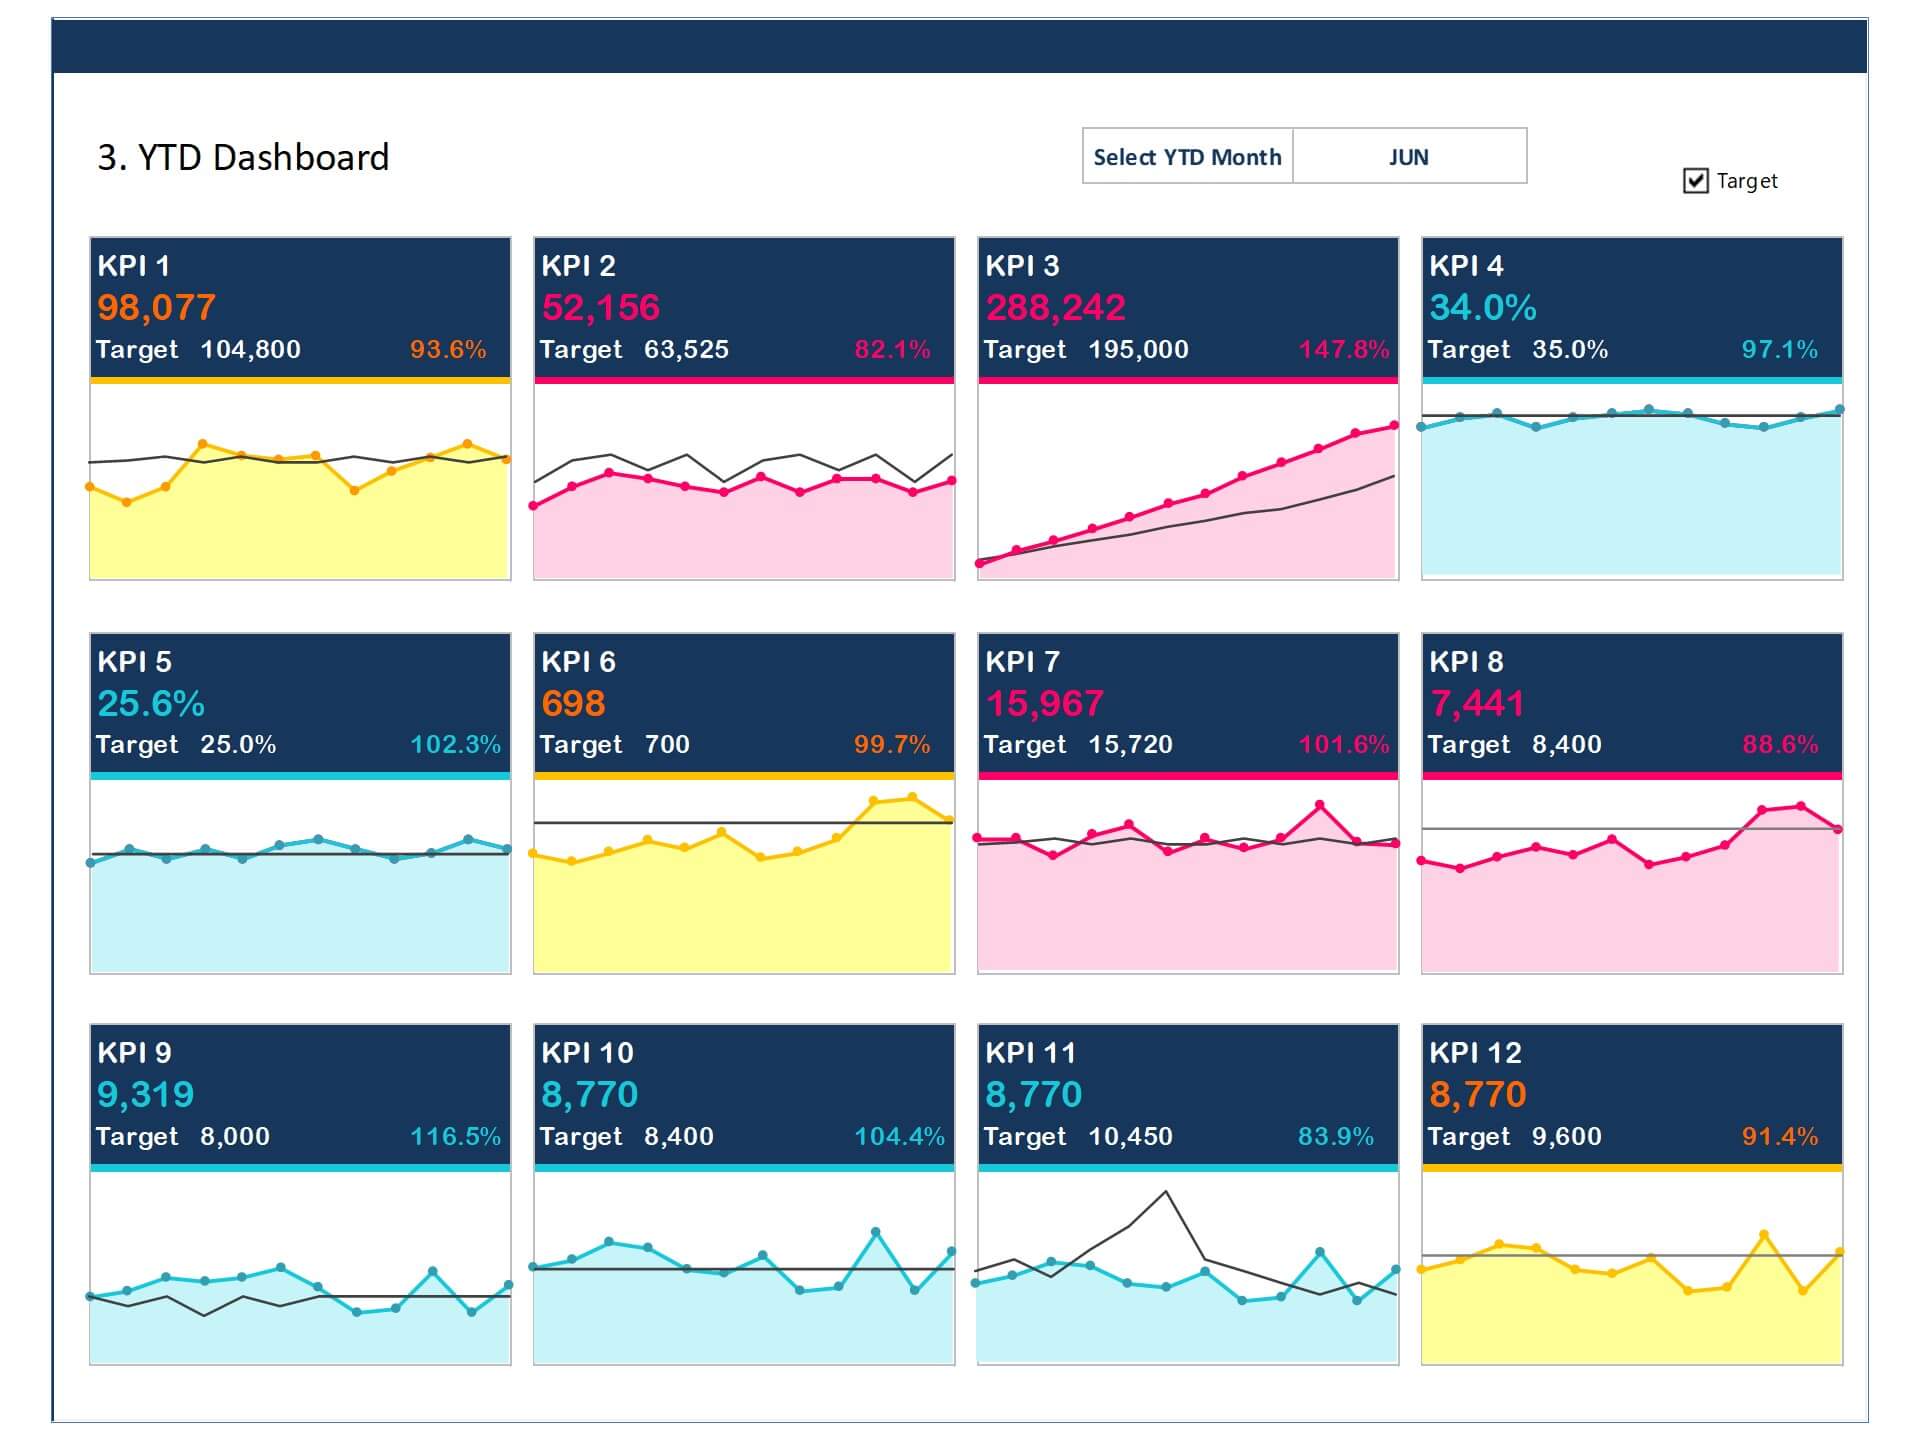
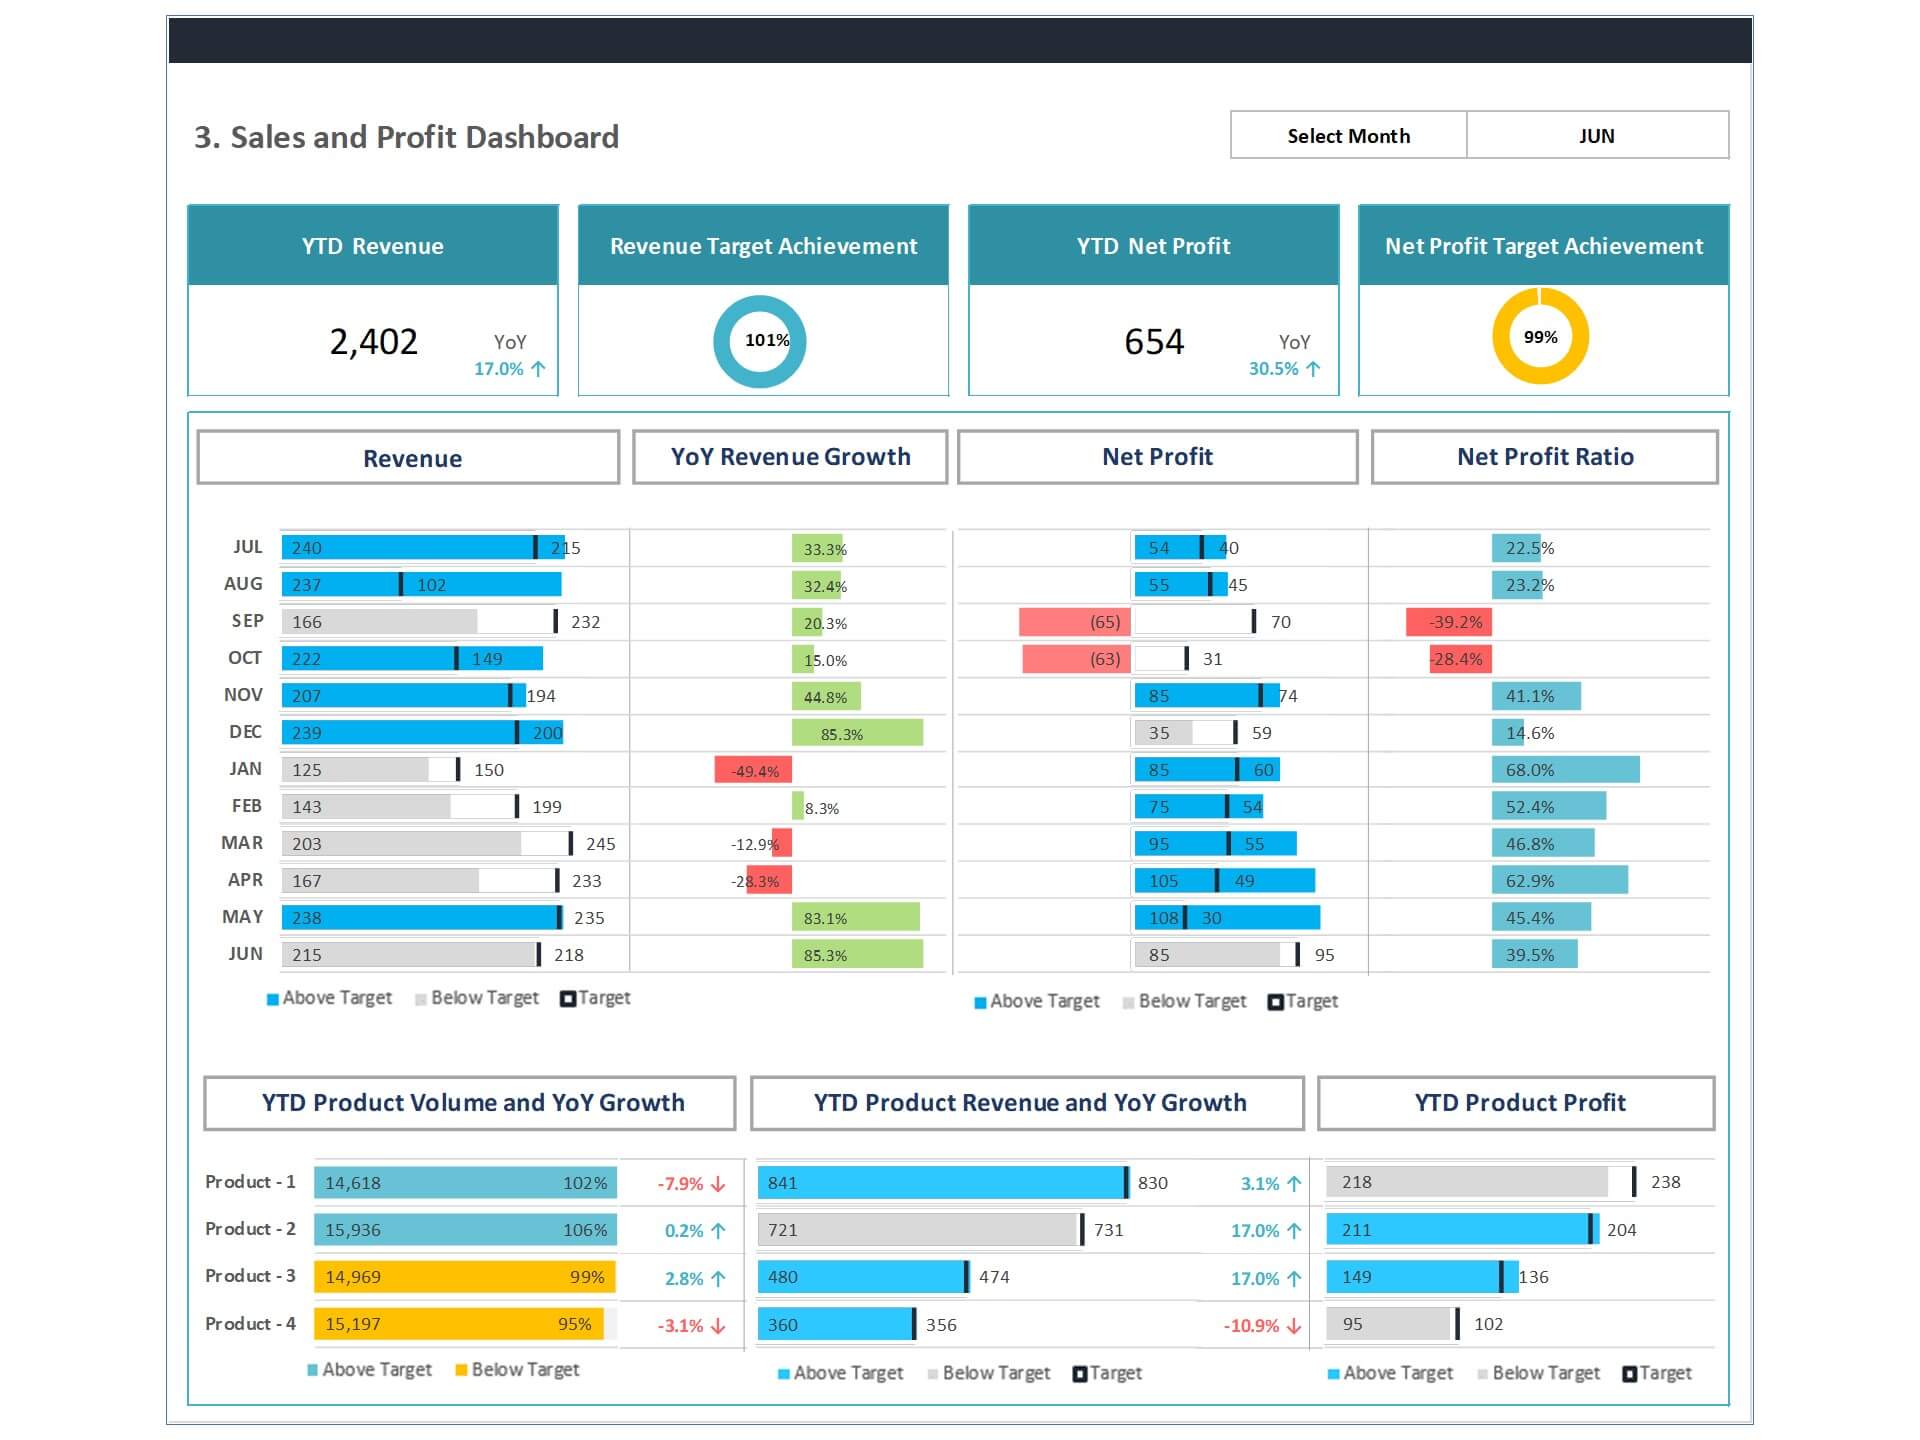
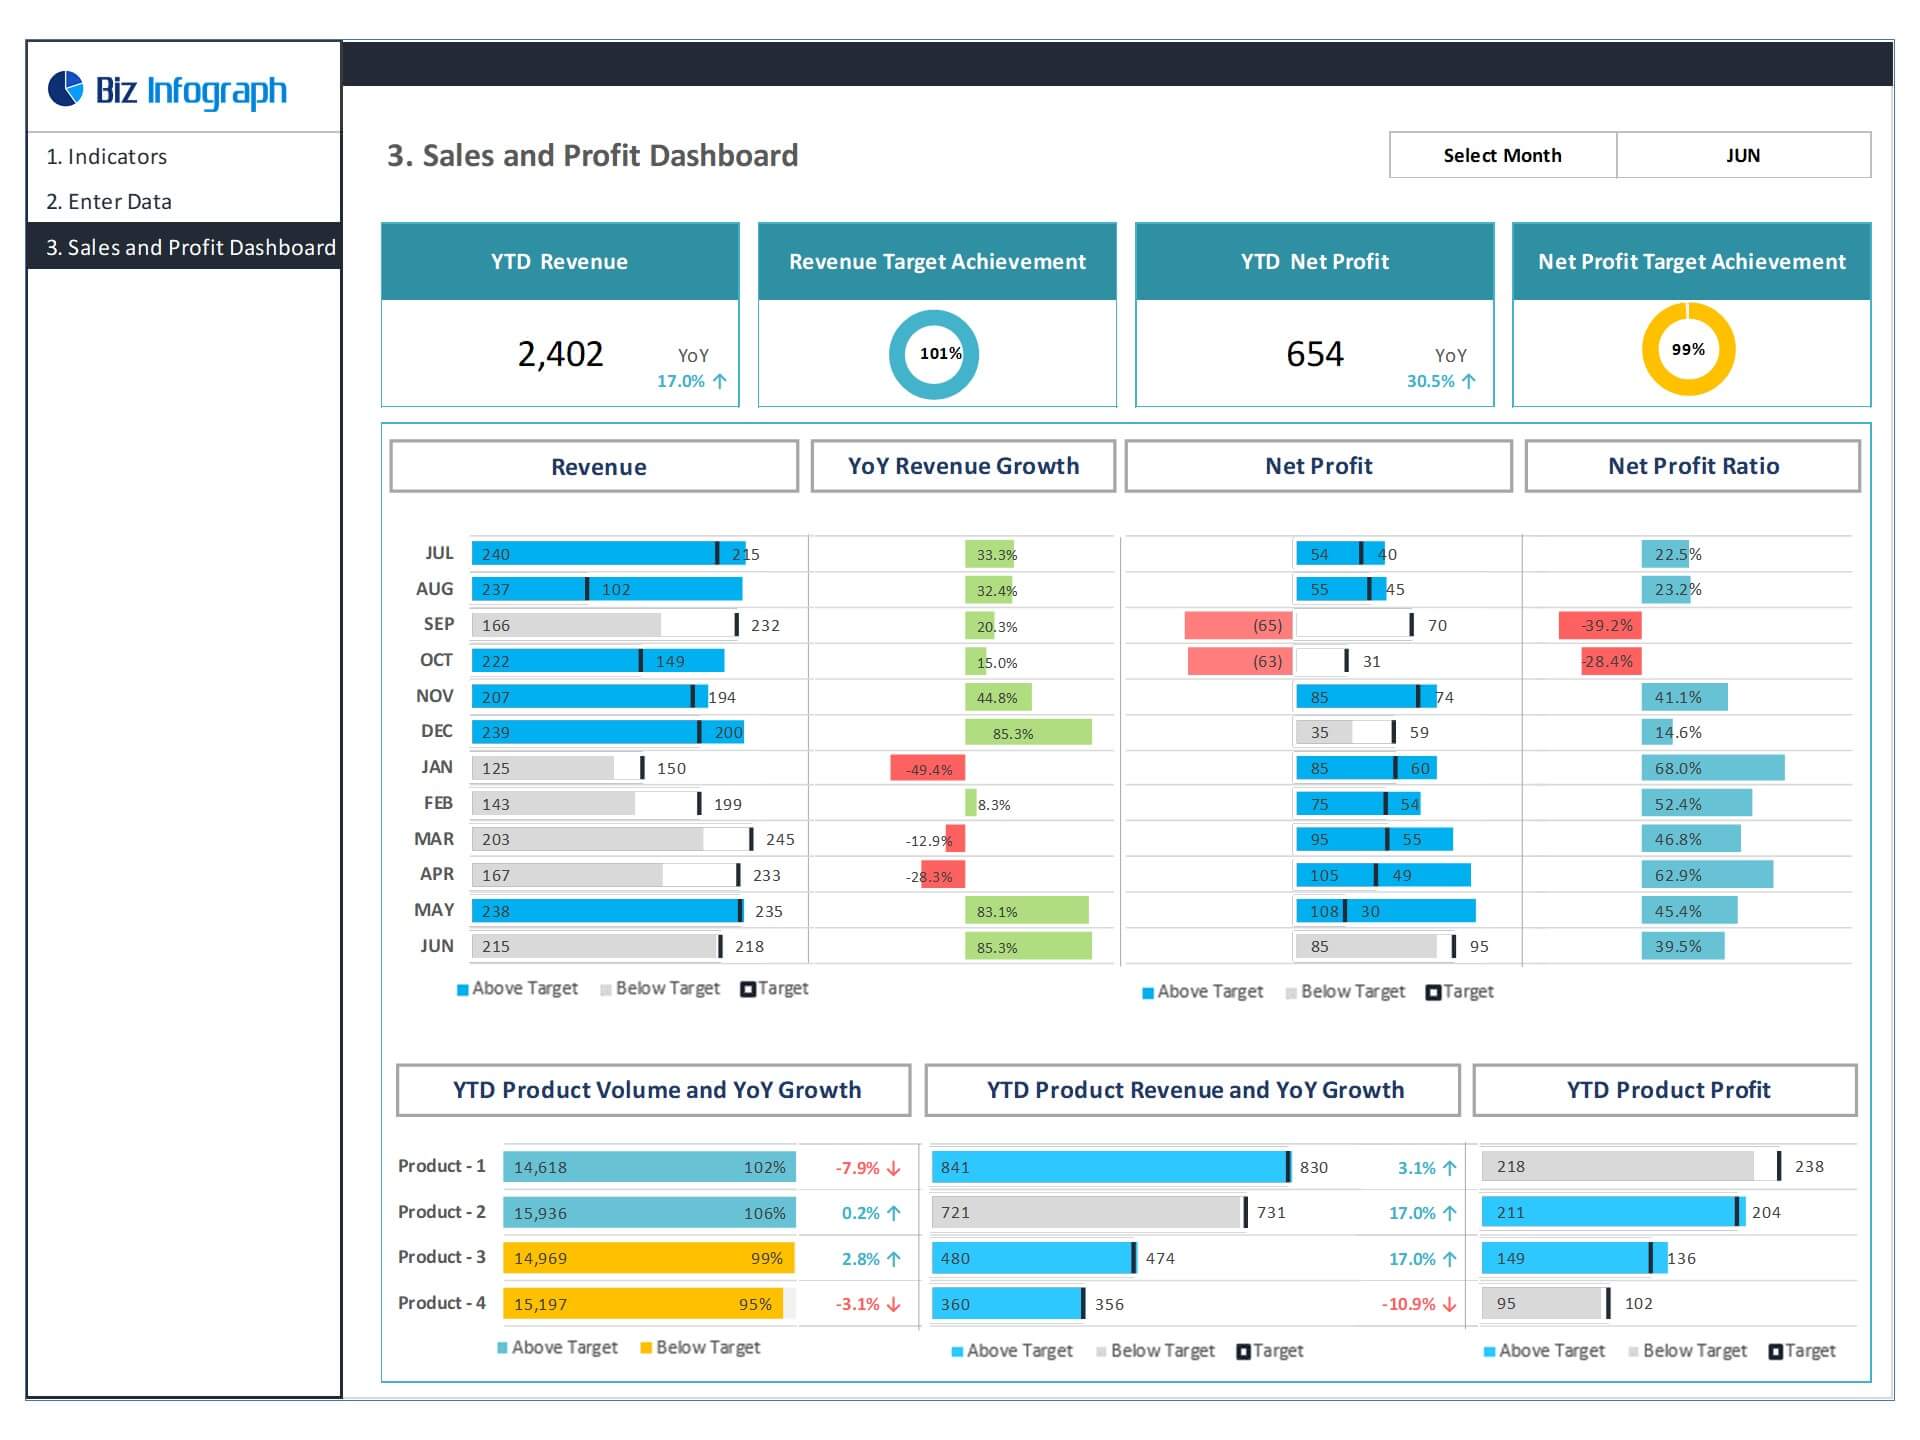
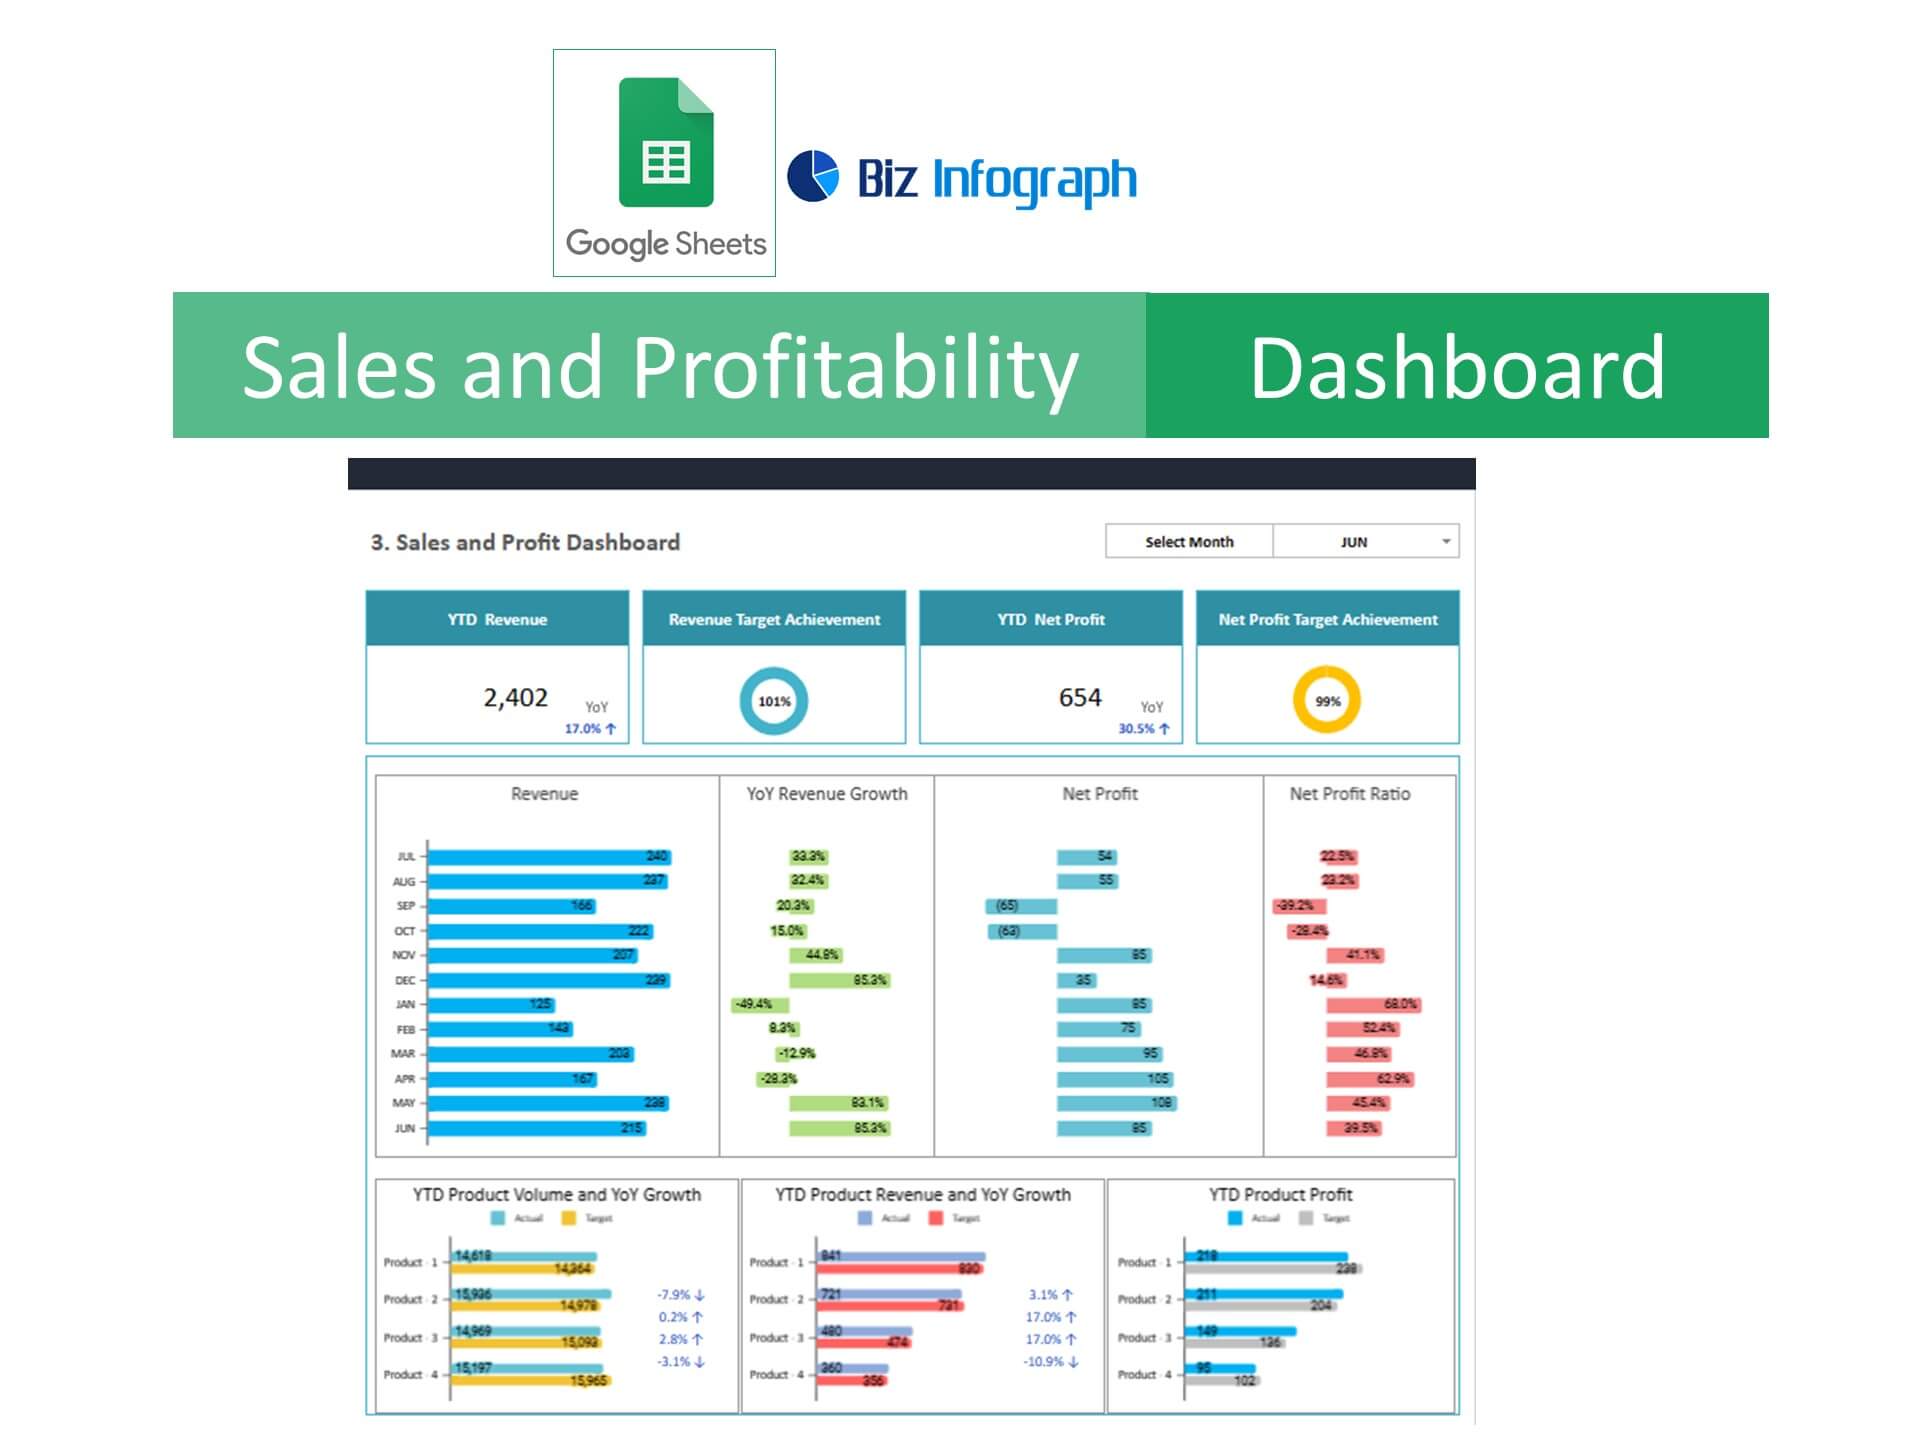
- Total Revenue: year-to-date total revenue in comparison with budget and last year, monthly actual revenue achievement vs budget and year-over-year growth
- Revenue detail: the actual achievement of revenue in each month against budget and year-over-year growth
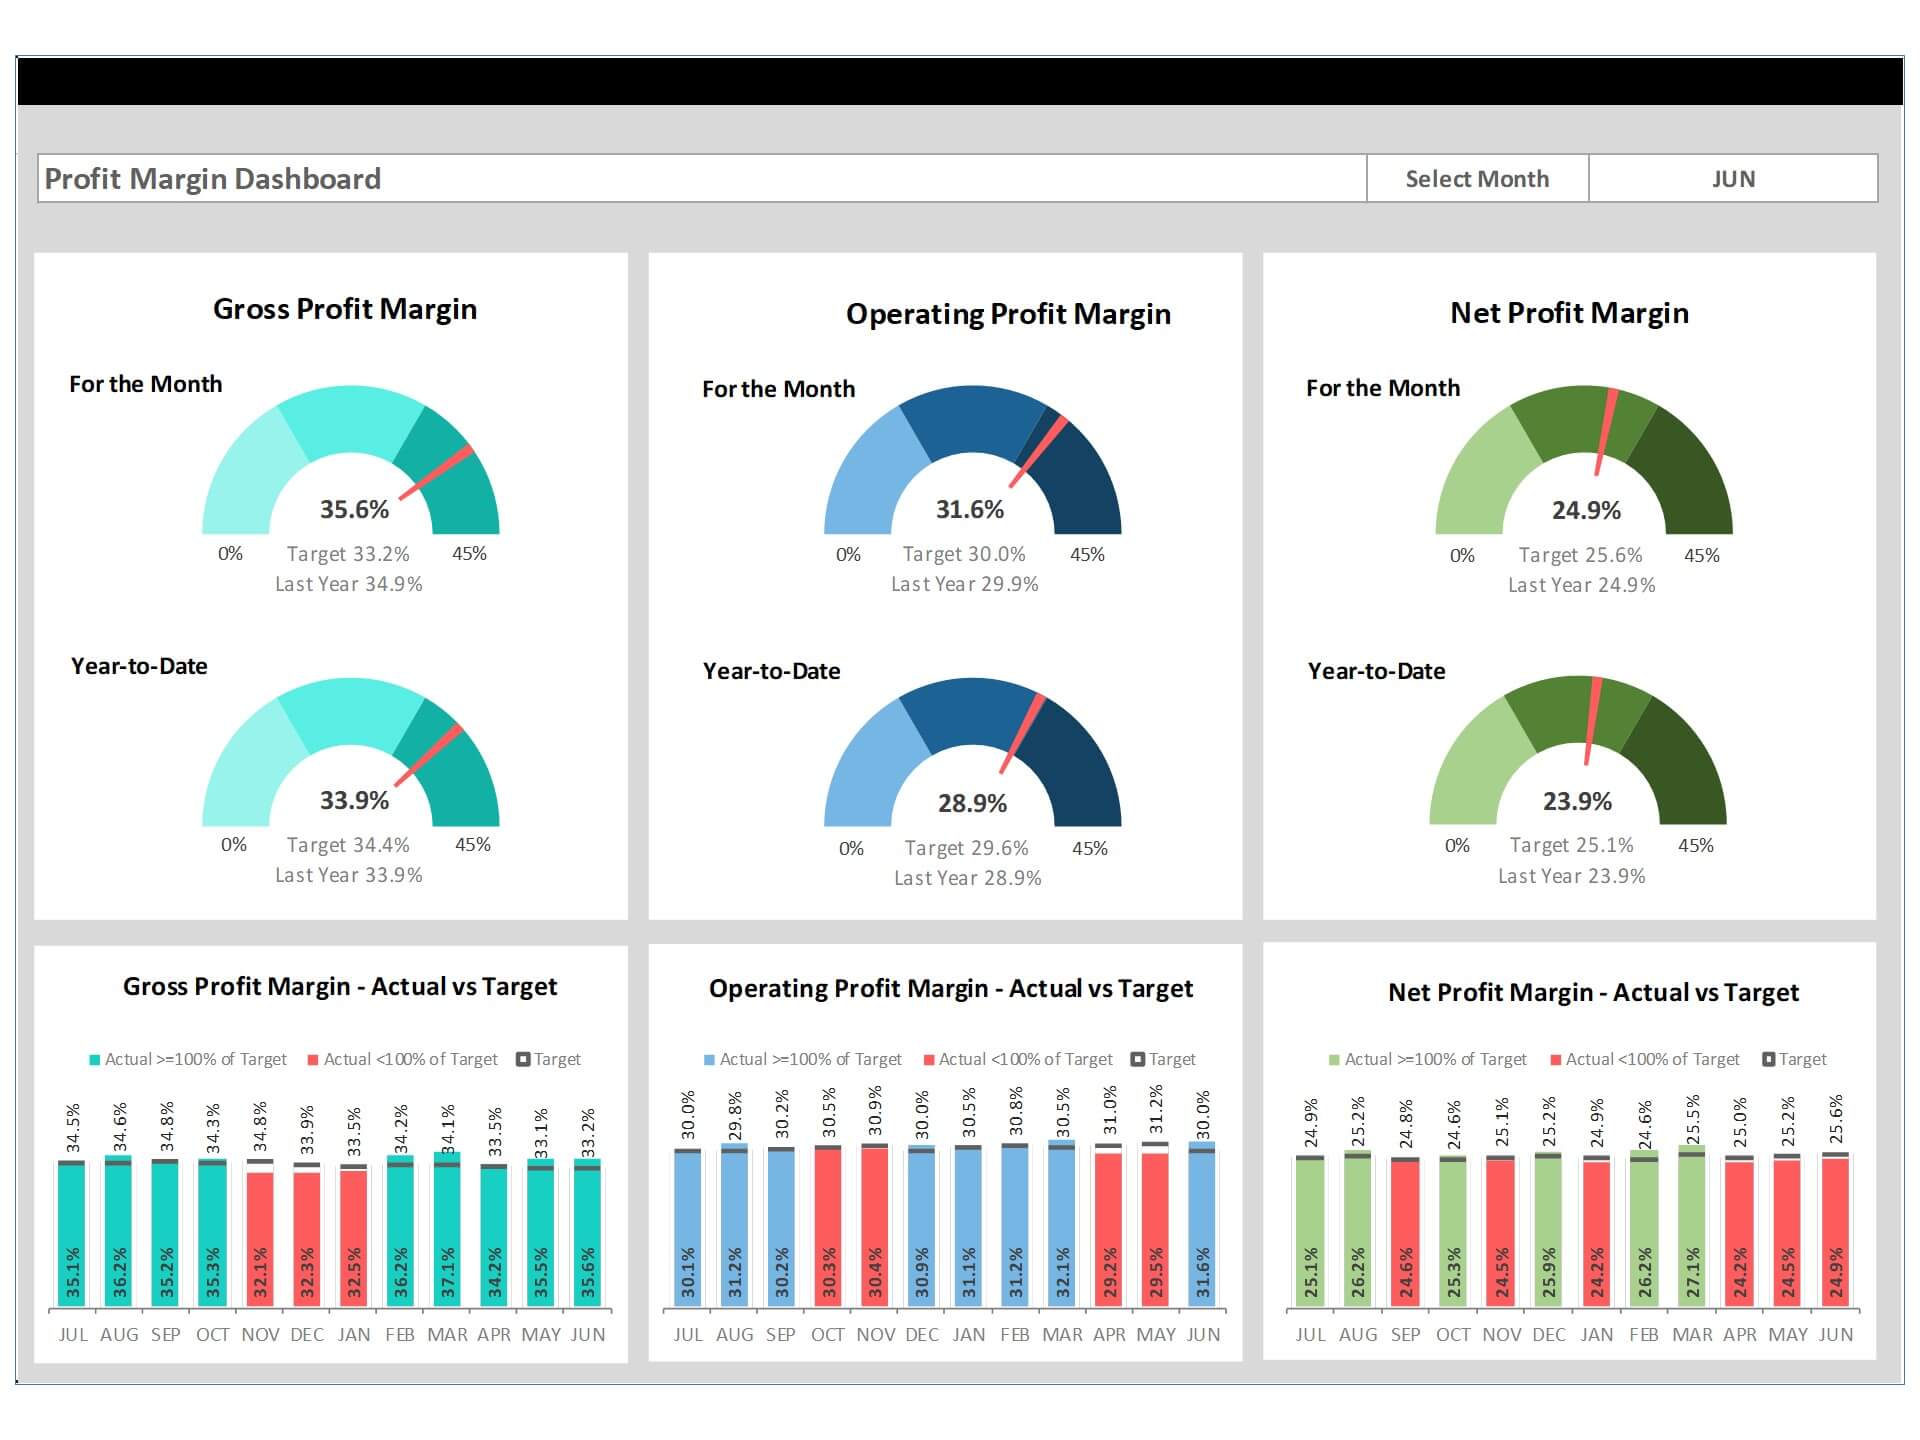
- Total Profit: year-to-date profit in comparison with budget and last year, monthly actual profit achievement vs budget and year-over-year growth
- Profit detail: the actual achievement of profit in each month against budget and year-over-year growth
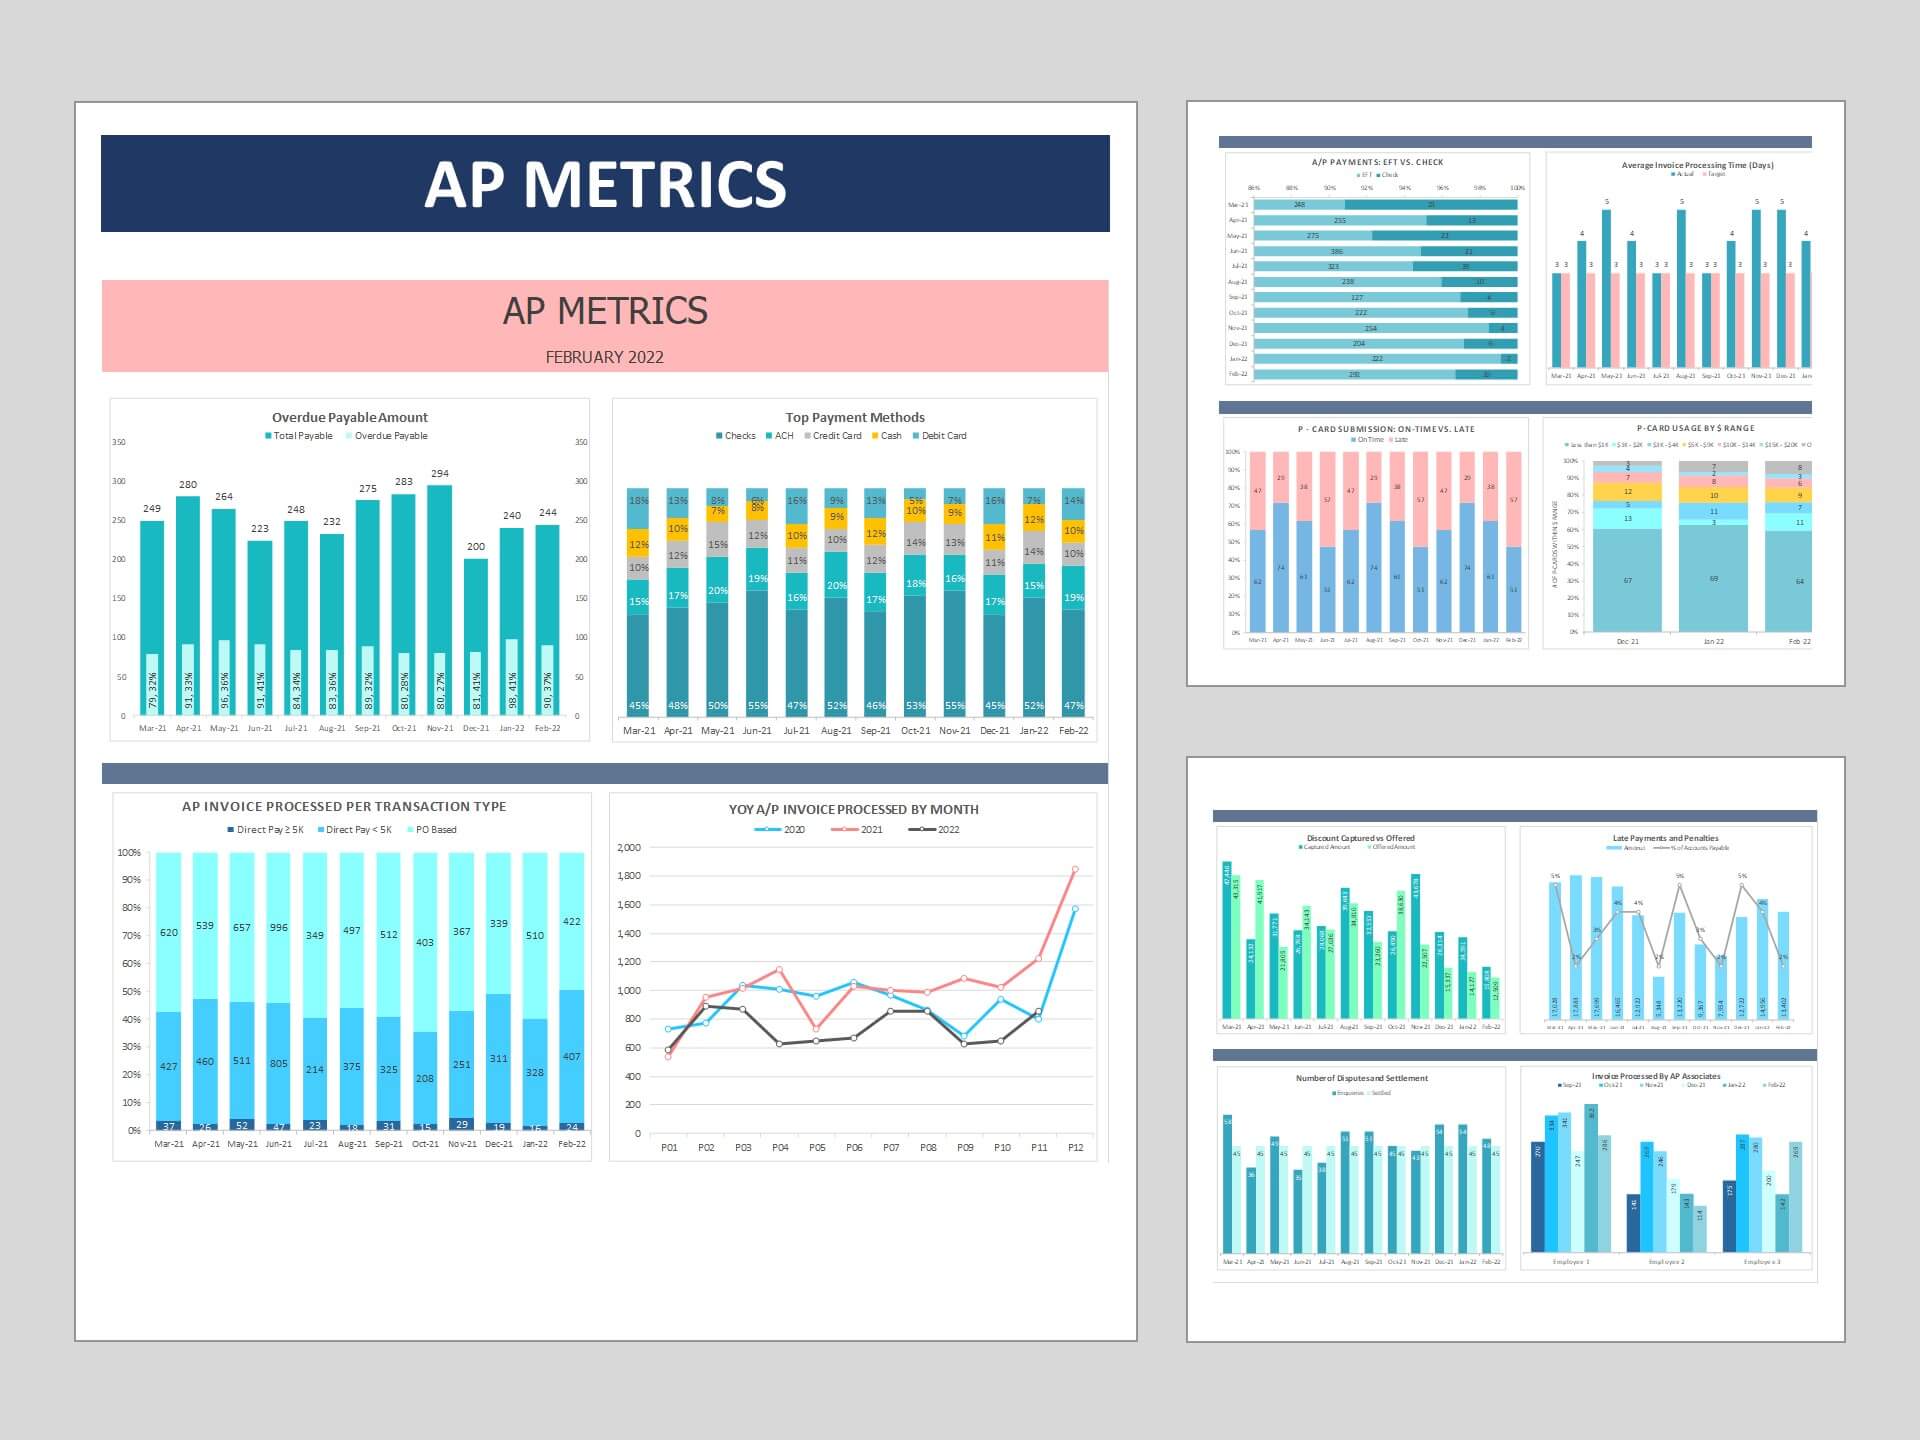
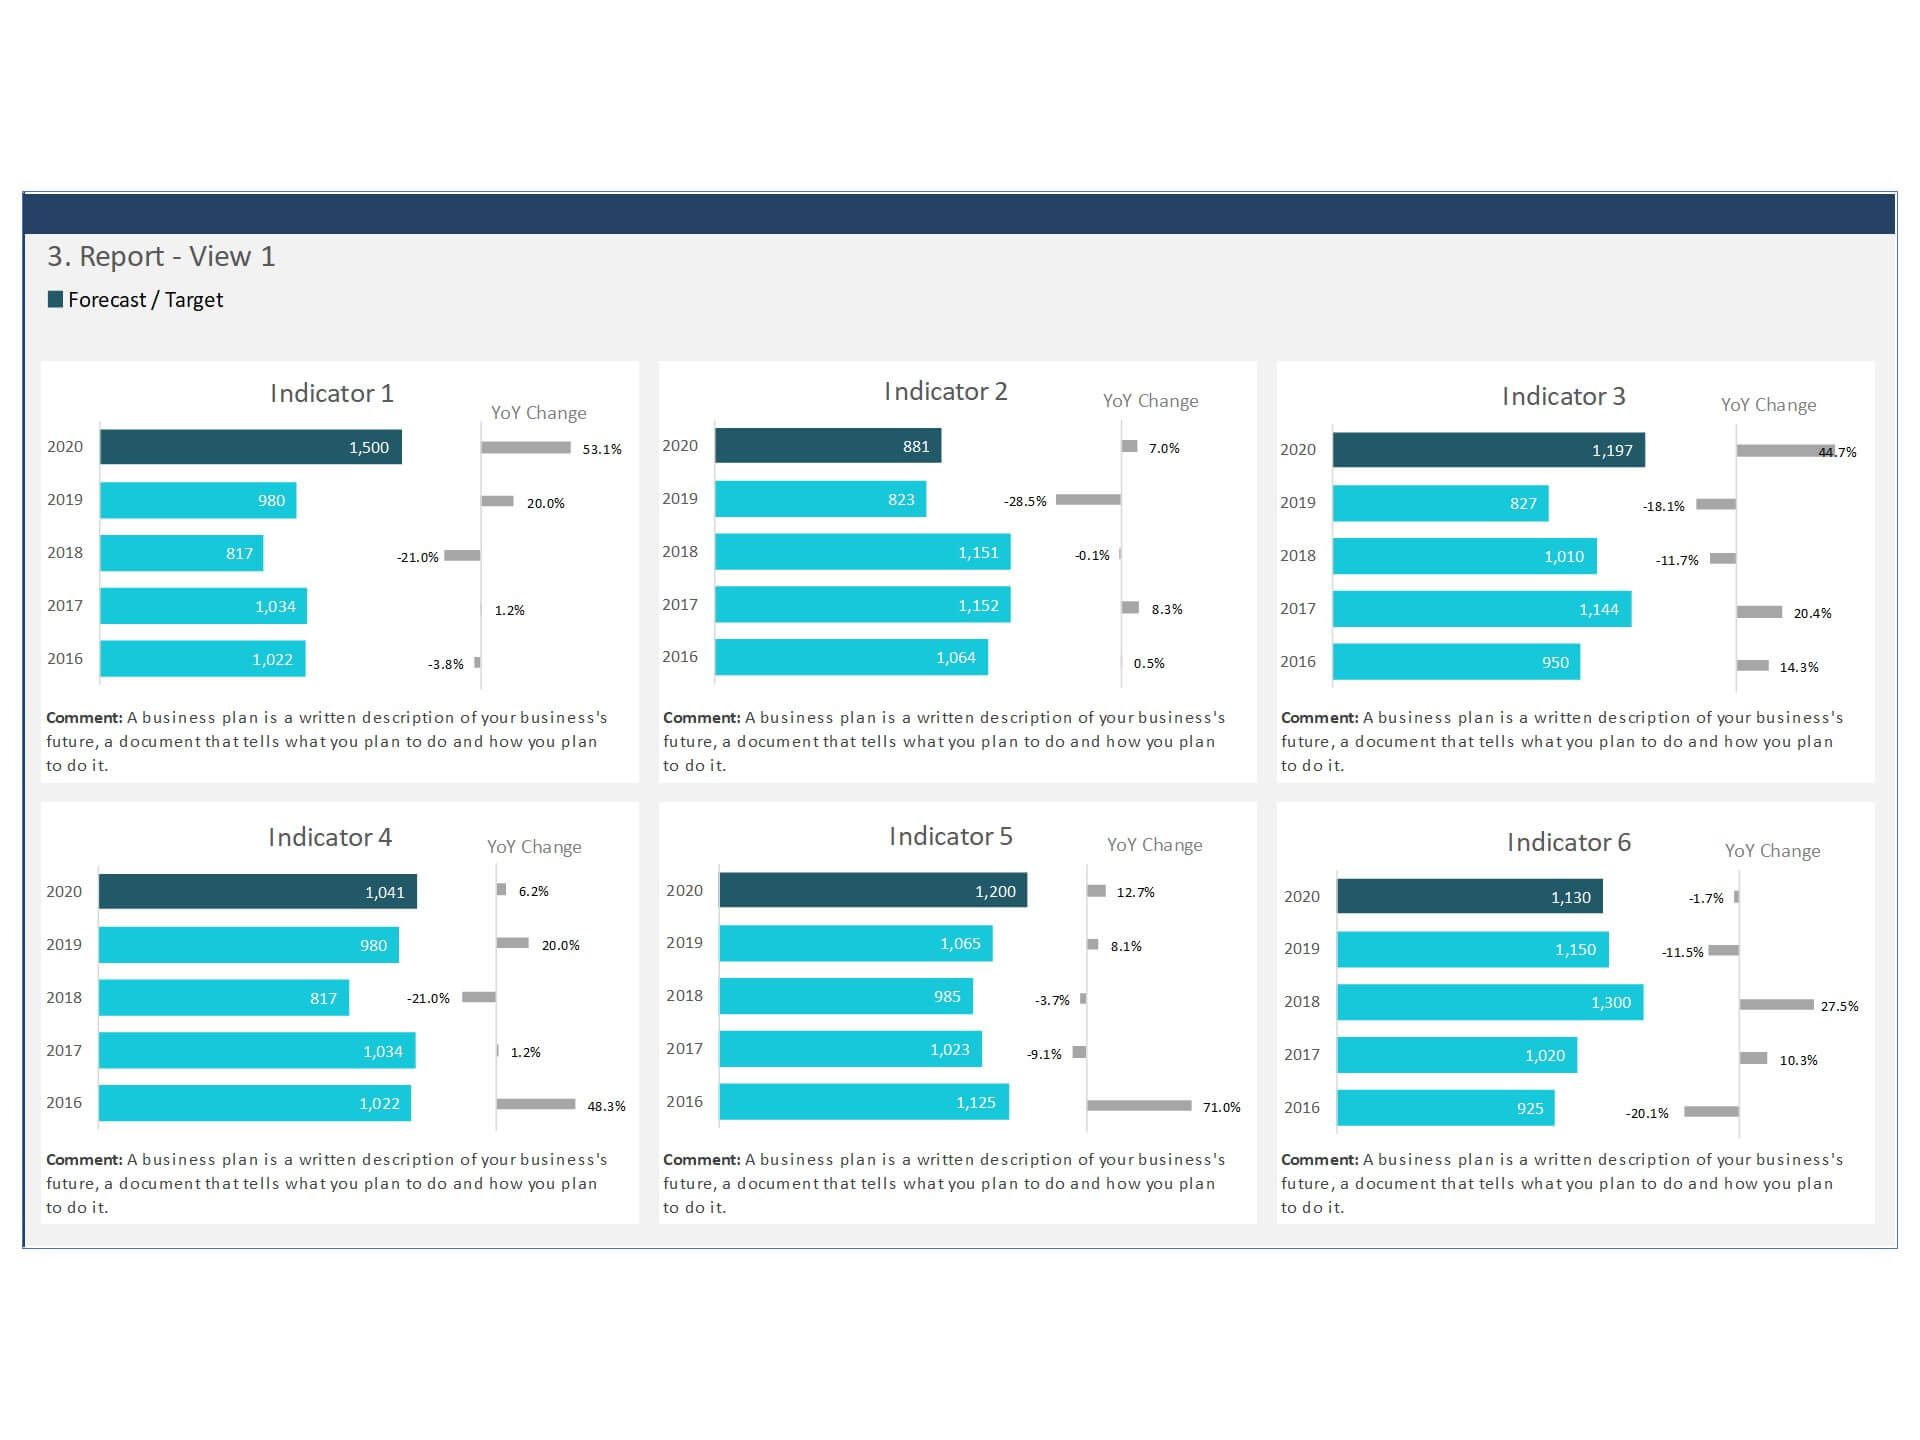
- Product volume, revenue, and profitability: detail of actual, budget, year-over-year growth of line item of each product
Key Features of Dashboard Template:
- Provides key financial insights for the CFO and finance team with details of product revenue, volume and profitability
- Fully editable, easy to use, template with sample data
- Eye-catching design and customizable
- Change the sample data with your data
- Spreadsheets ready for printing without Biz Infograph logo
- Consolidate key financial performance indicators in one dashboard
- No monthly fees
- Immediate download
- No VBA, no Macro
- No installation necessary
- Professionally designed
What is included in this dashboard template?
- Just plug your data, the dashboard will be ready instantly and start using.
- A text file which contains a password to view and edit the formula
- A guide to unlocking all the elements in the dashboard
Professional Support:
- Video tutorial guide on how to navigate and use Sales and Profitability Dashboard Template
- Professional service to customize dashboard template in excel as per business need
- Help and support in post-purchase
- Payment secured by Stripe and PayPal (no PayPal account needed)
A brief guide to using the dashboard template:
- Open the dashboard template
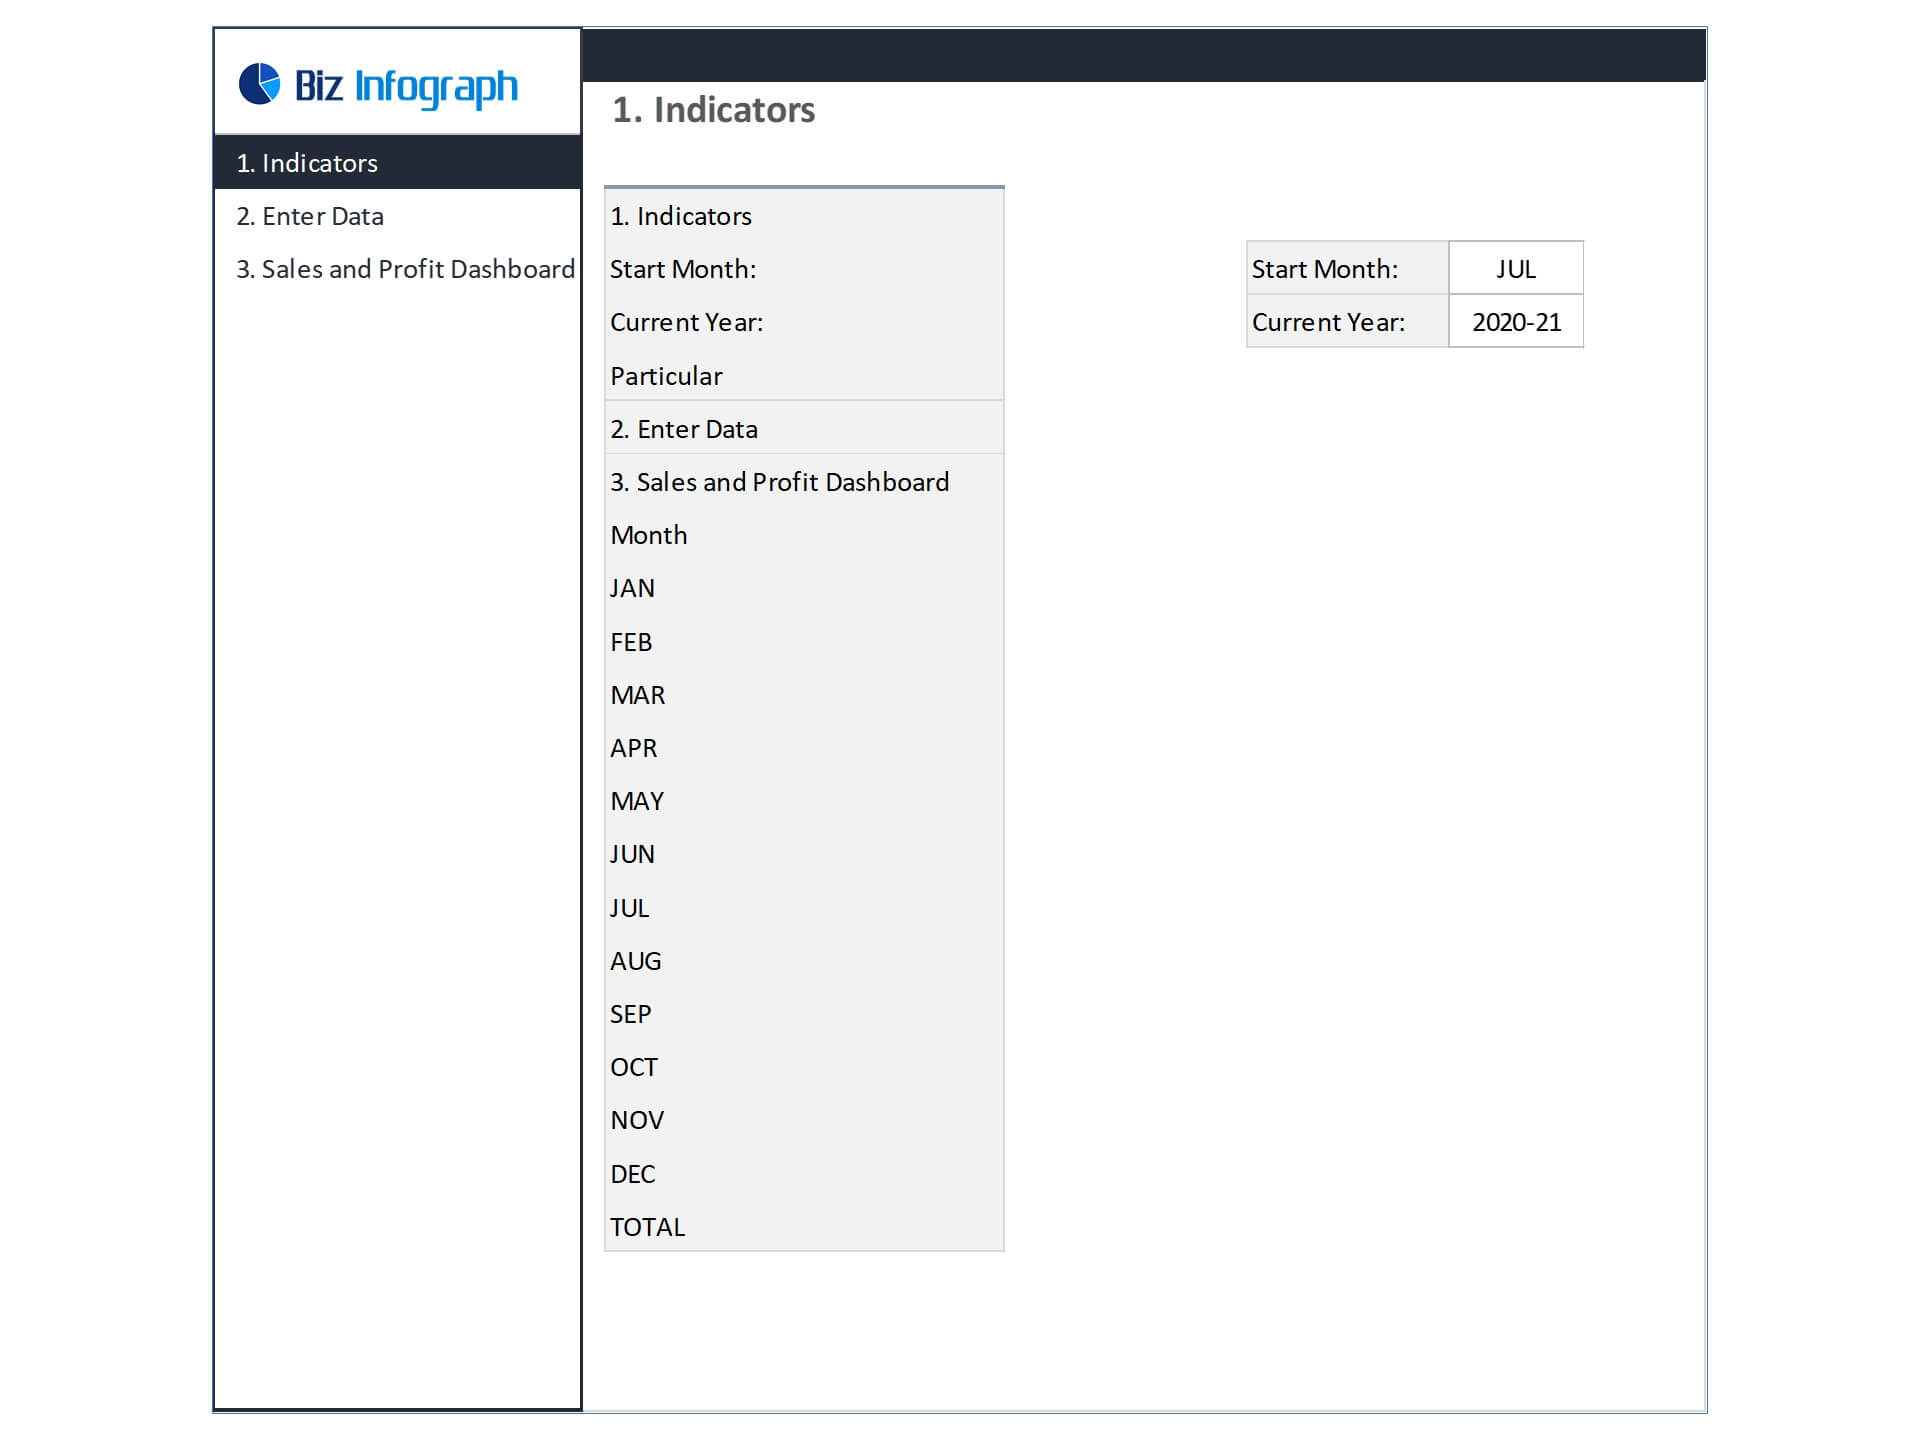
- Go to ‘Indicators’ menu – choose the start month of the fiscal year (i.e. Jan, Feb, Jul, etc.)
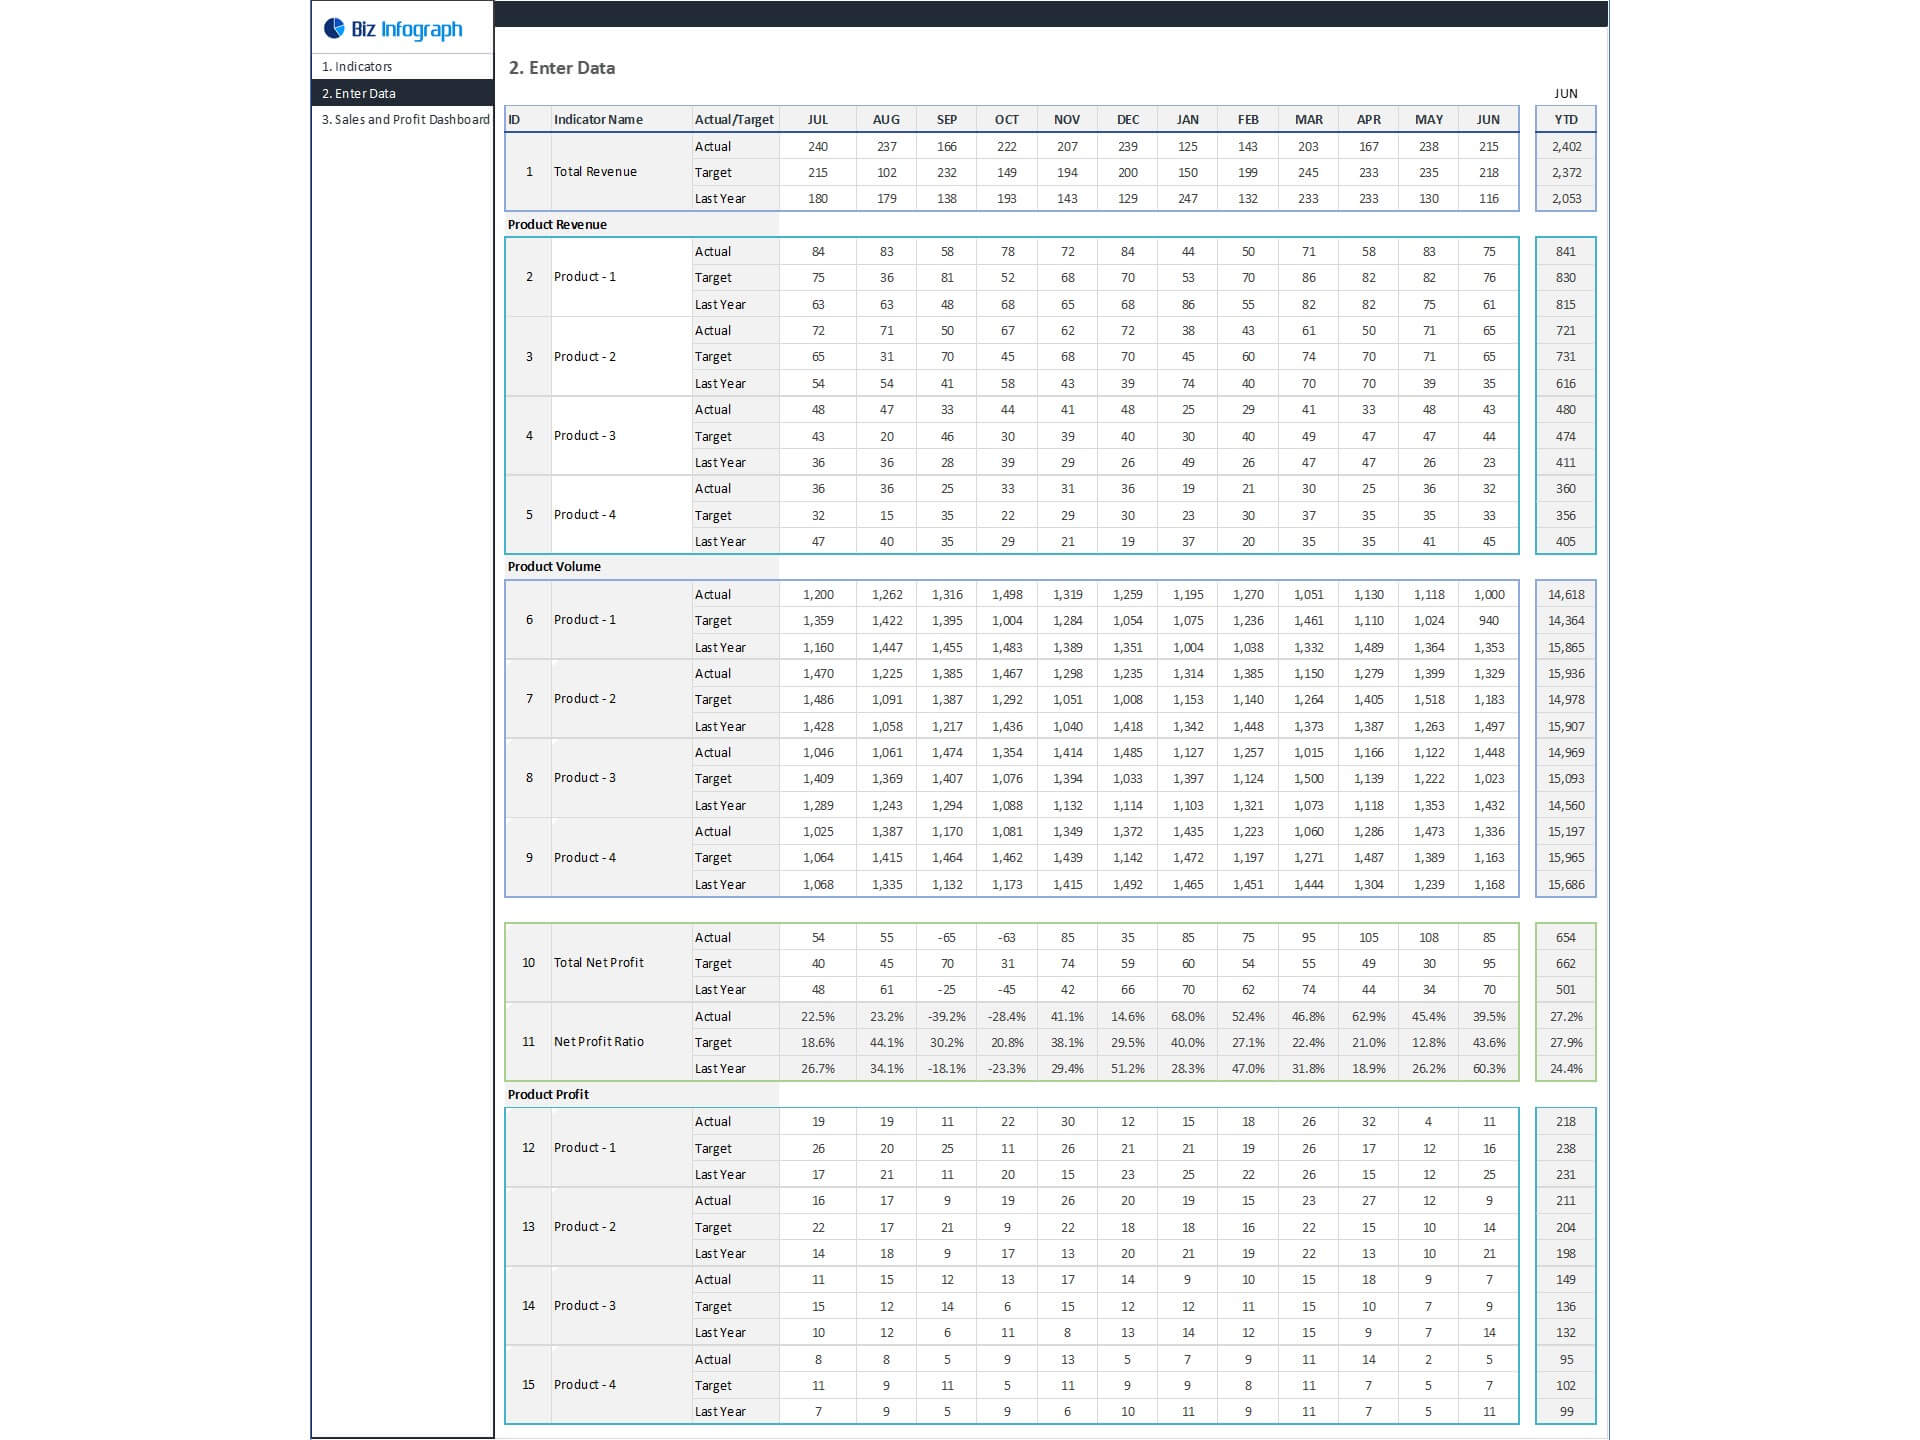
- Go to the ‘Enter Data’ menu – remove the sample data and give your actual data in the respective cells. Formula cells are locked, and you cannot edit it without a password.
- Go to the ‘Monthly Dashboard’ menu – select the month name from the drop-down to see the monthly picture of performance indicators
- Go to ‘YTD Dashboard’ menu - select month name from the drop-down to see the year-to-date picture of performance indicators
- Each page is ready for printing – just press CTRL+P
This Excel dashboard template is password-protected to avoid mistakes, such as accidentally deleting formulas. When you completed the purchase, the password will be available.