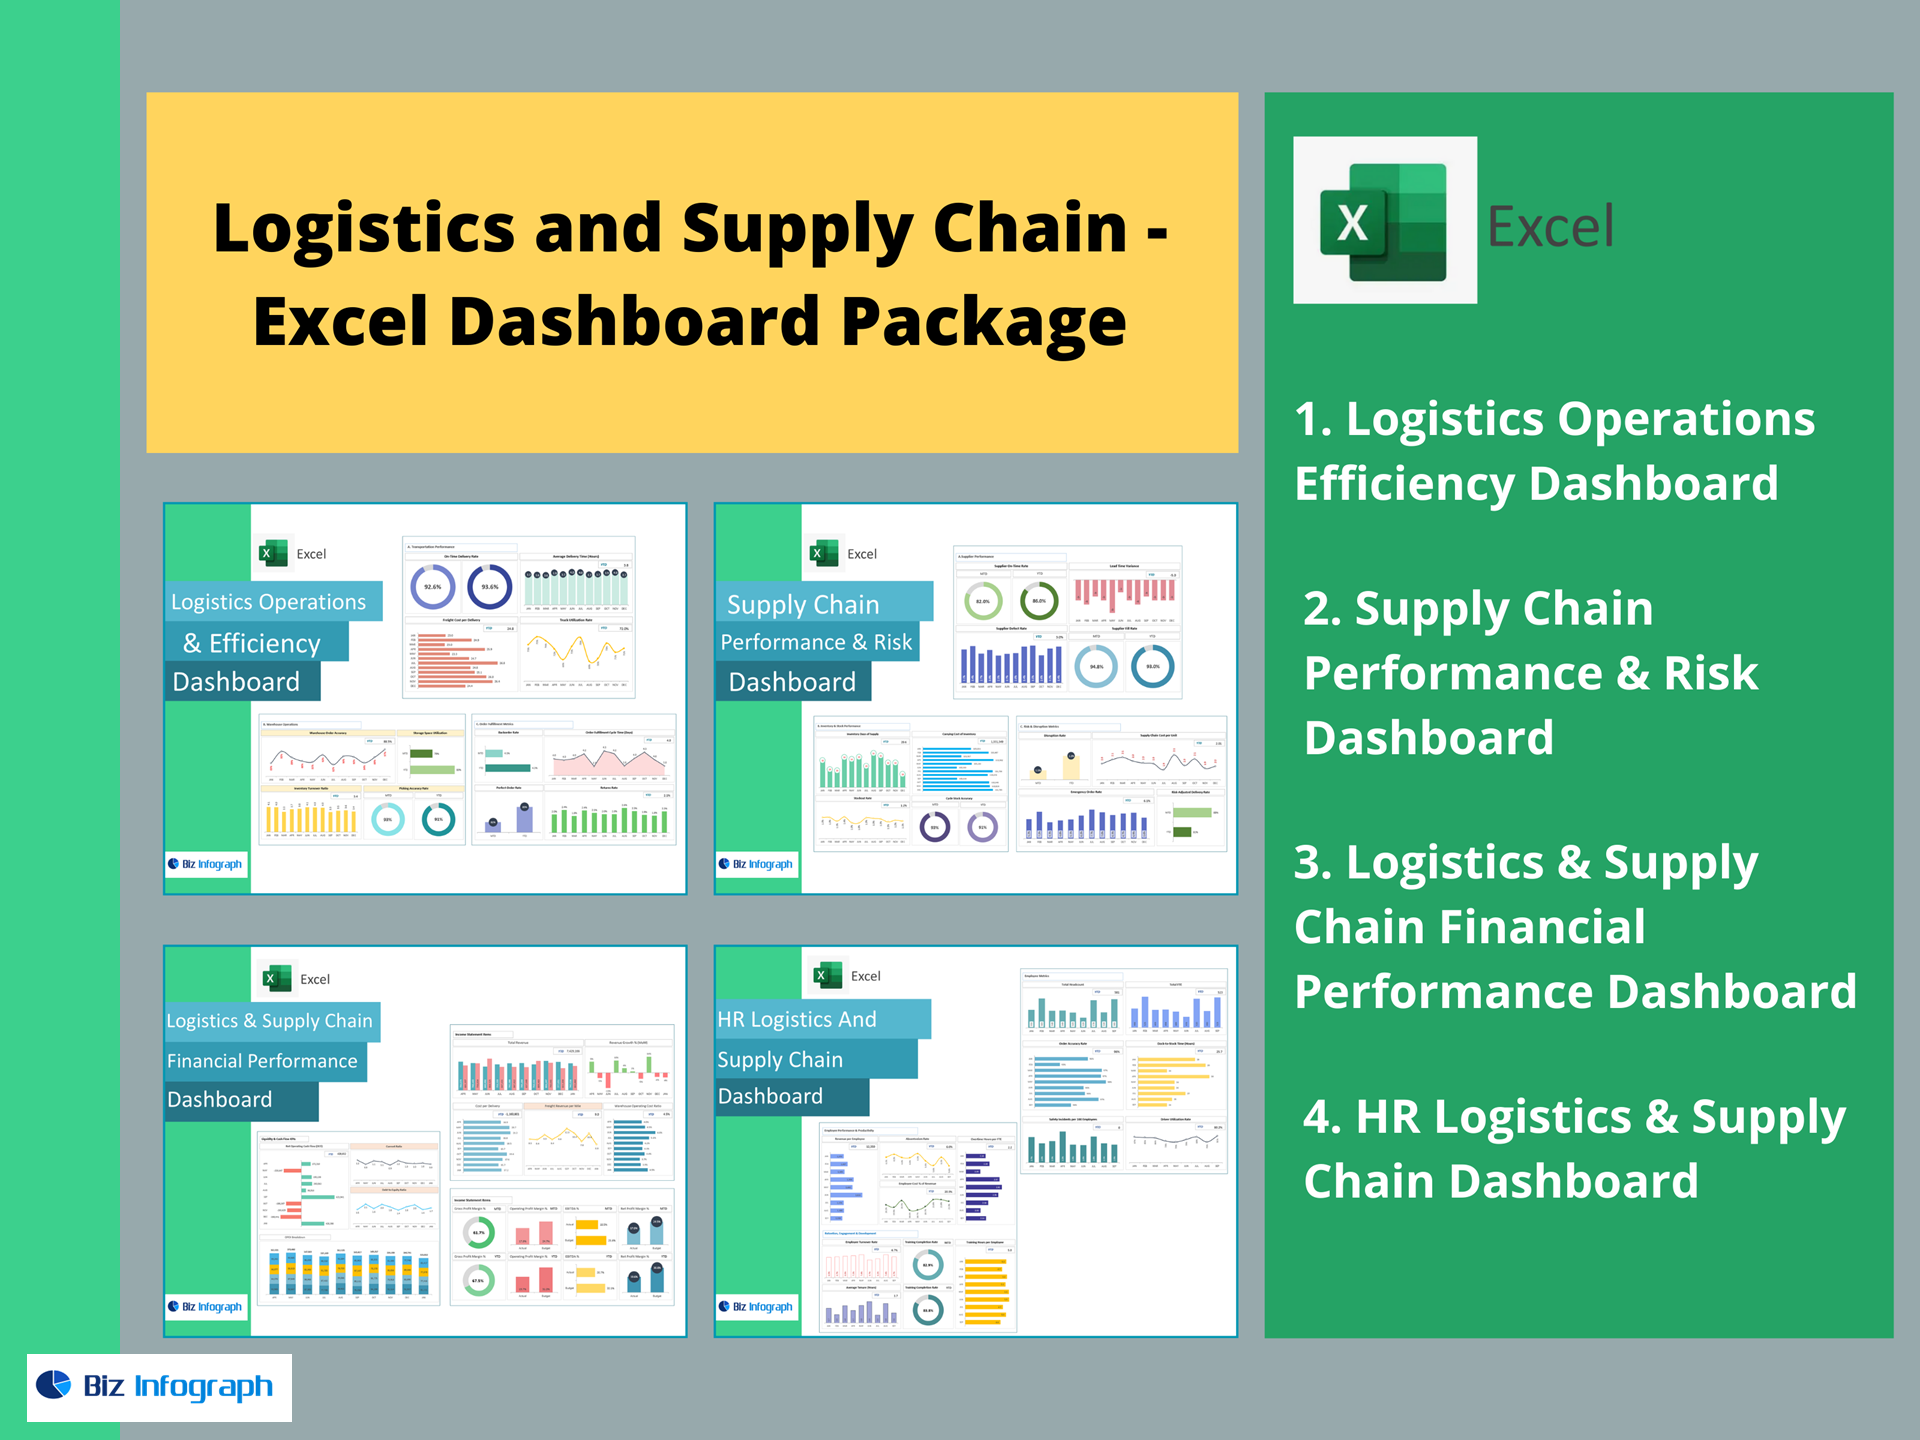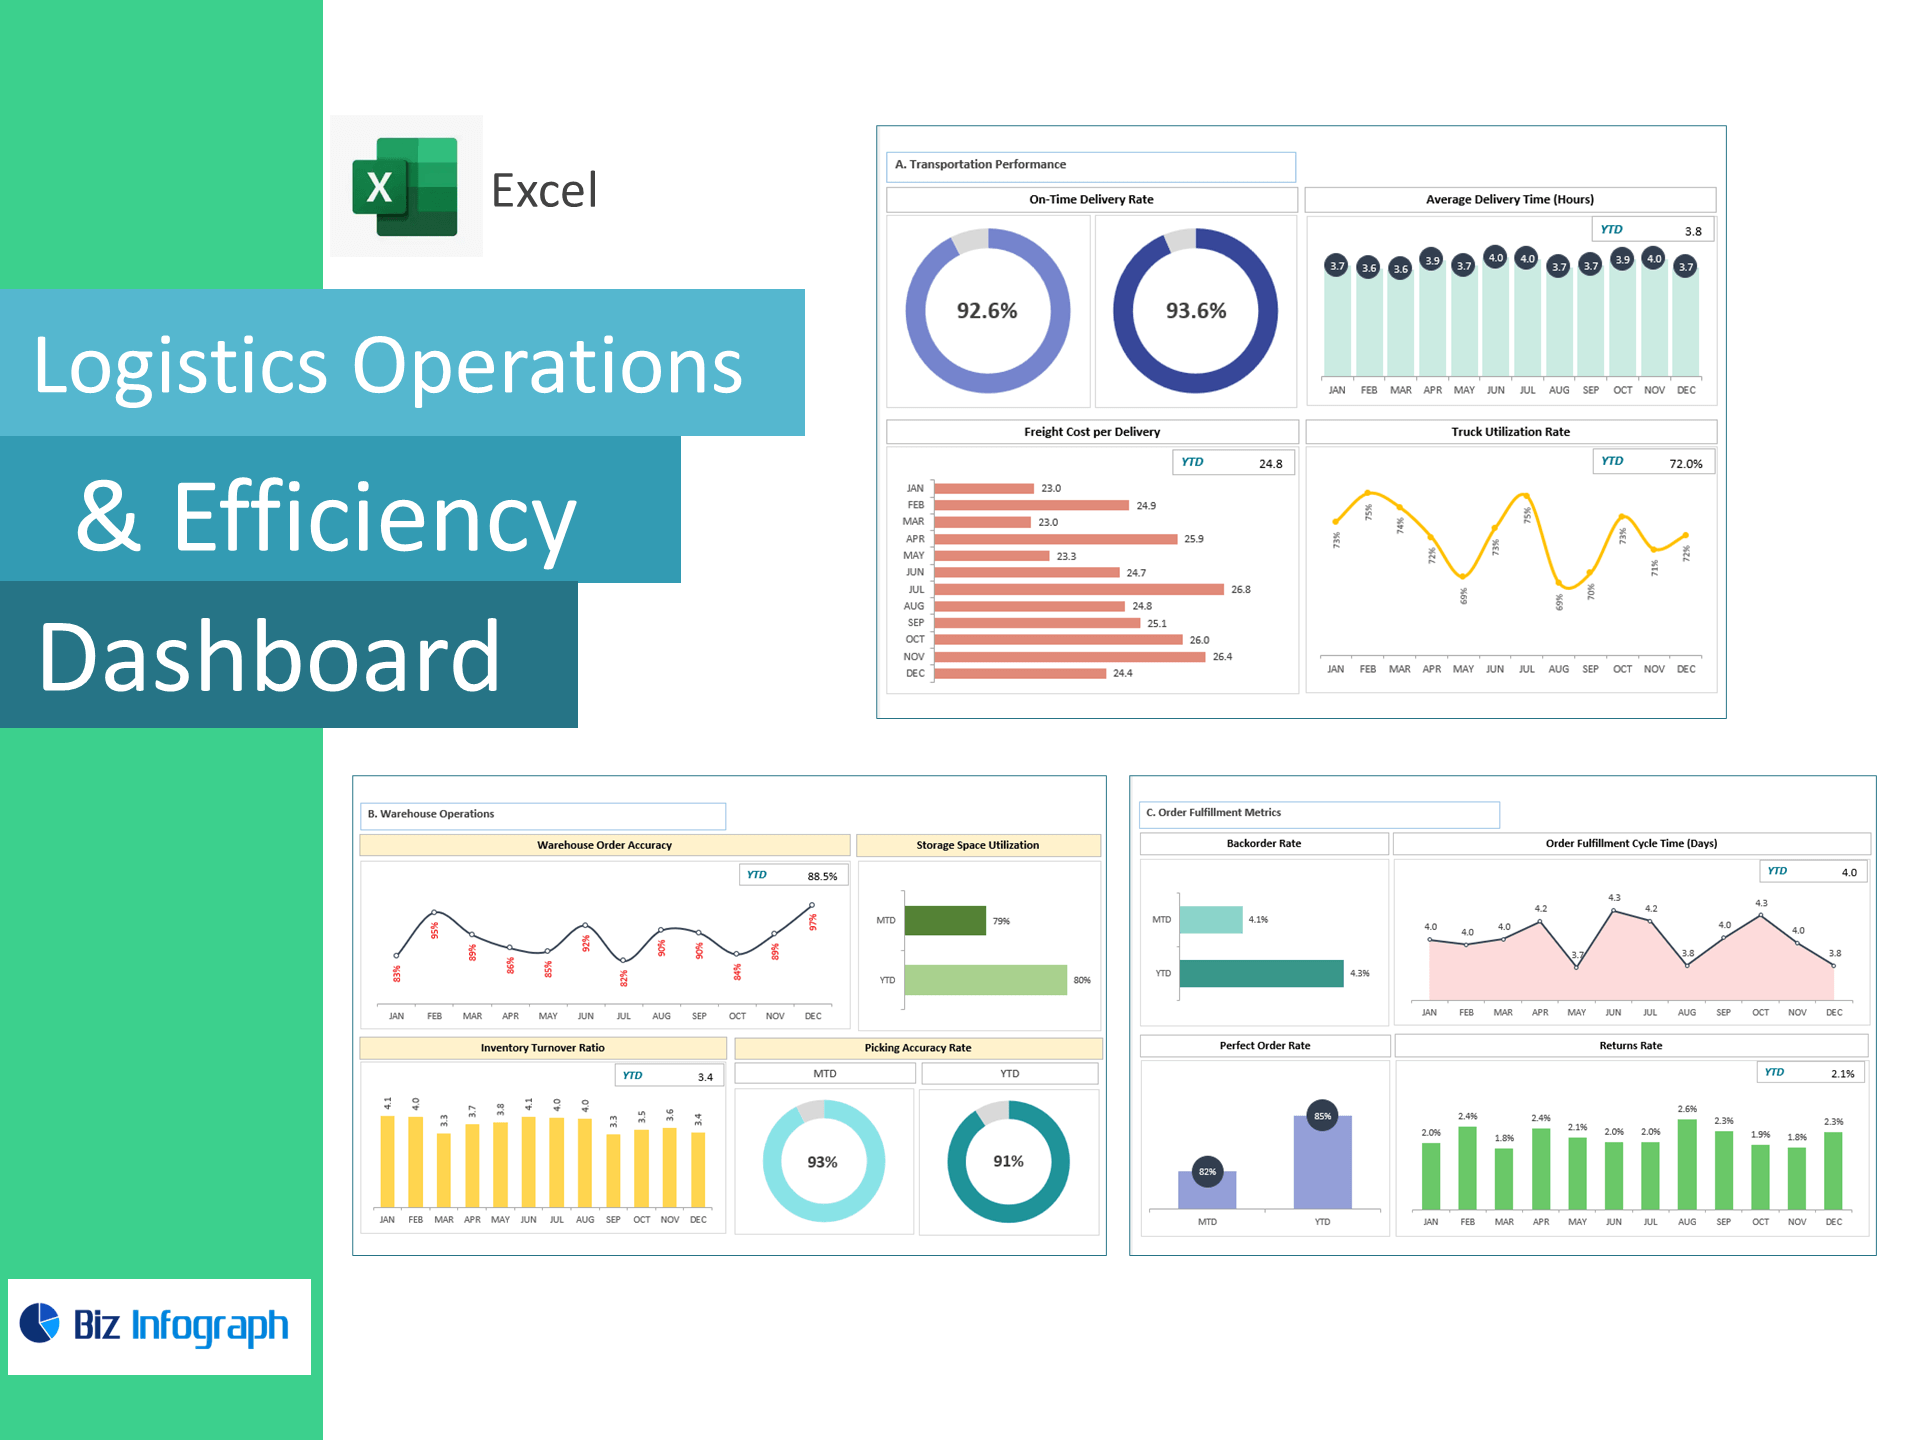
Logistics Operations Efficiency Dashboard (Excel Template)
The Logistics Operations Efficiency Dashboard in Excel is a complete, data-driven performance management tool designed to help logistics managers, warehouse supervisors, and supply chain analysts track and improve end-to-end operational efficiency. This Excel-based dashboard transforms your logistics data into interactive visual insights, measuring transportation, warehouse, and fulfillment performance with precision.
Key Features
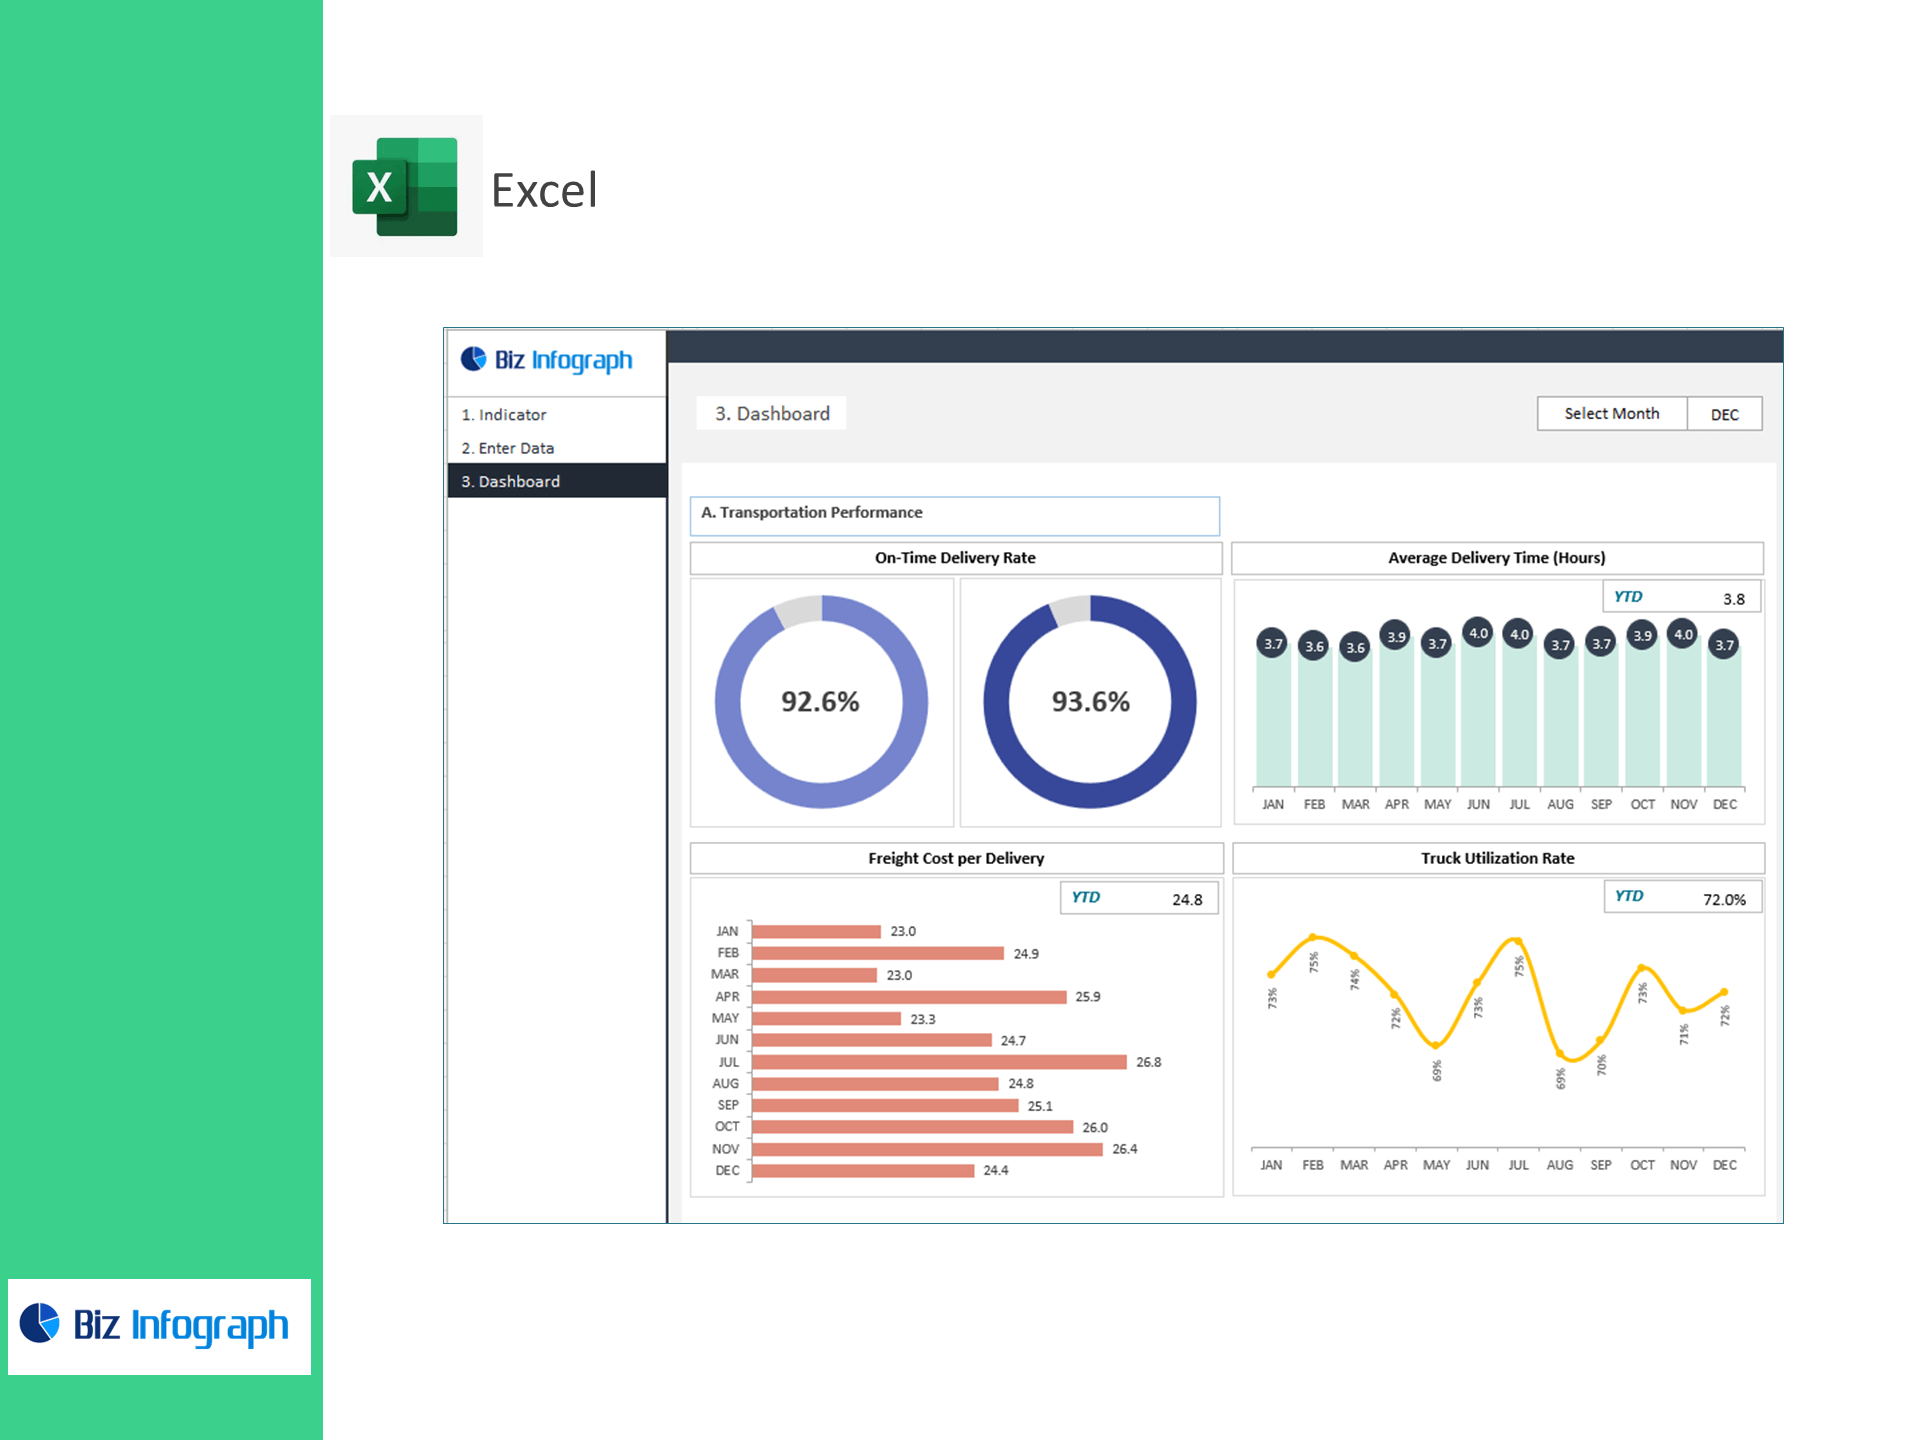
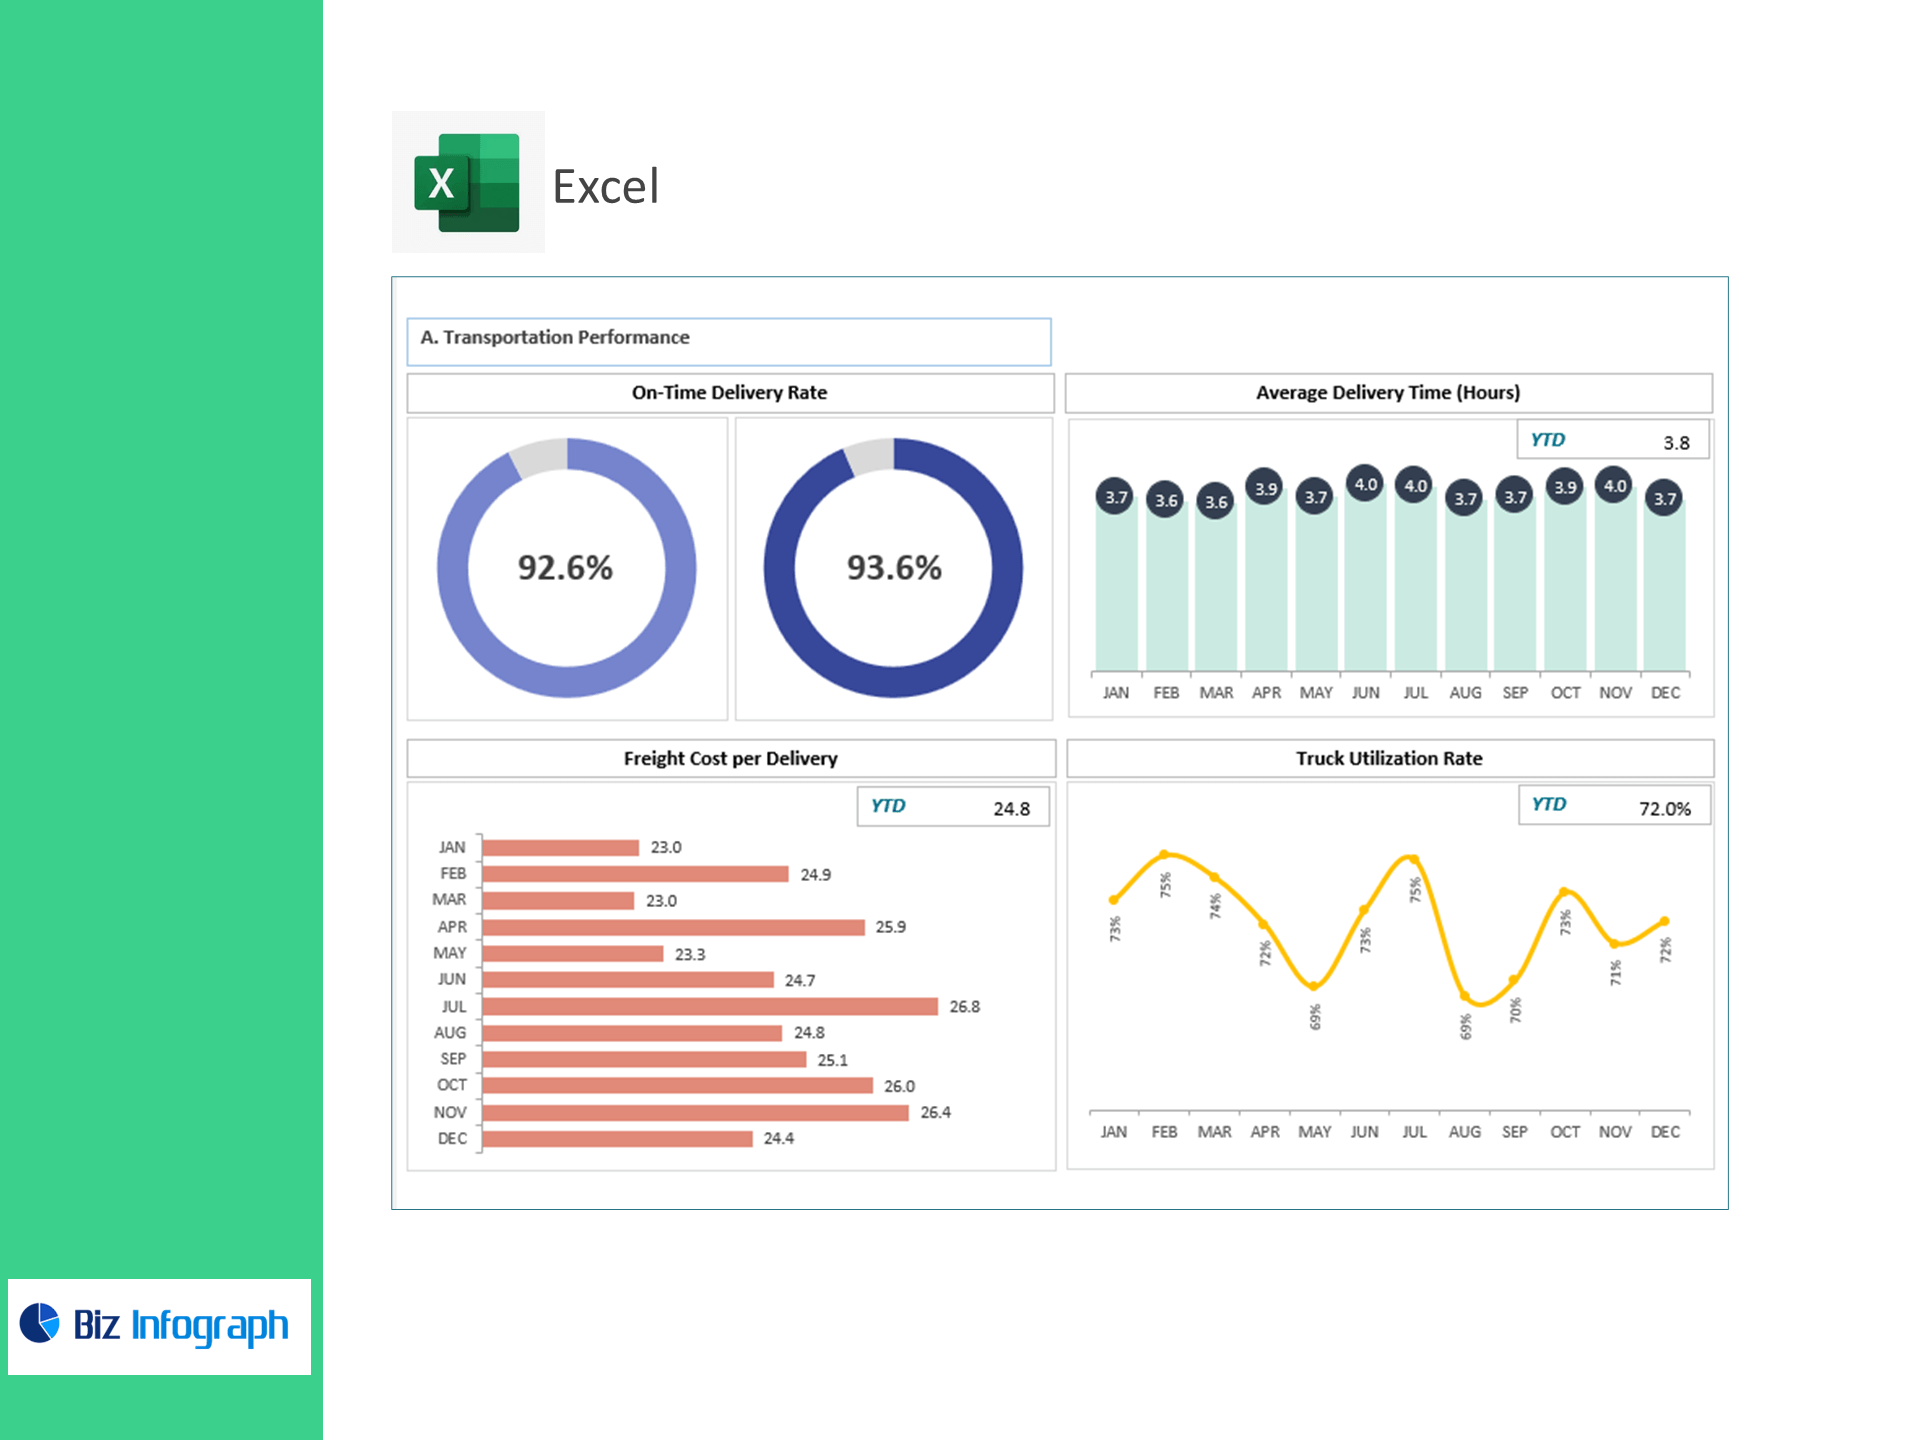
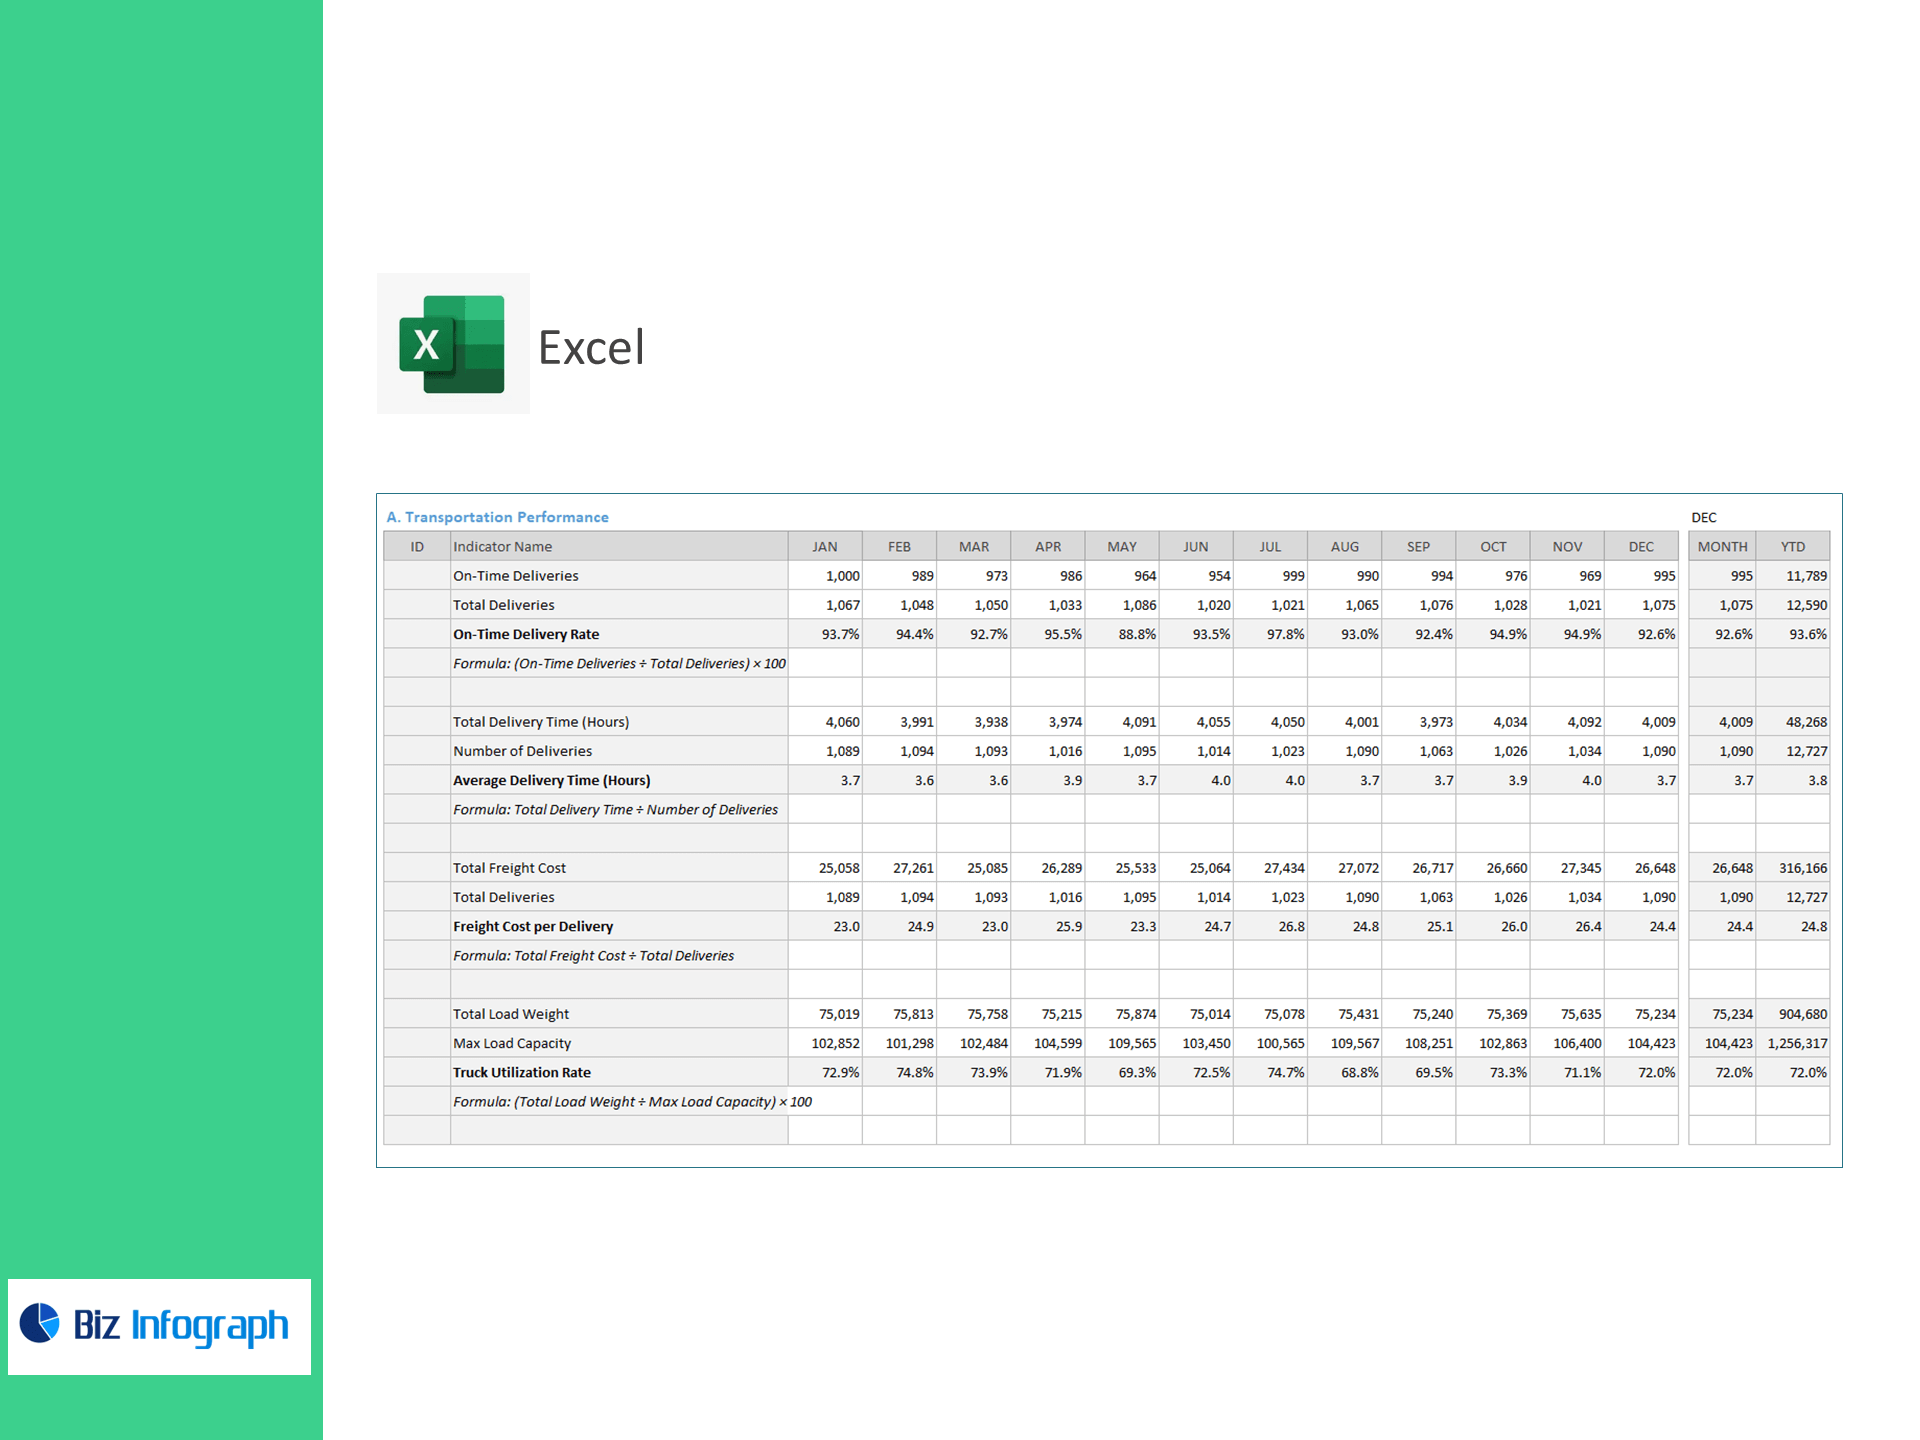
A. Transportation Performance
Monitor real-time delivery performance with key transportation KPIs such as:
-
On-Time Delivery Rate – (On-Time Deliveries ÷ Total Deliveries) × 100
Evaluate delivery reliability and customer satisfaction. -
Average Delivery Time (Hours) – (Total Delivery Time ÷ Number of Deliveries)
Assess delivery speed across regions or routes. -
Freight Cost per Delivery – (Total Freight Cost ÷ Total Deliveries)
Identify cost efficiency per shipment and optimize route profitability. -
Truck Utilization Rate – (Total Load Weight ÷ Max Load Capacity) × 100
Maximize vehicle utilization and reduce idle capacity.
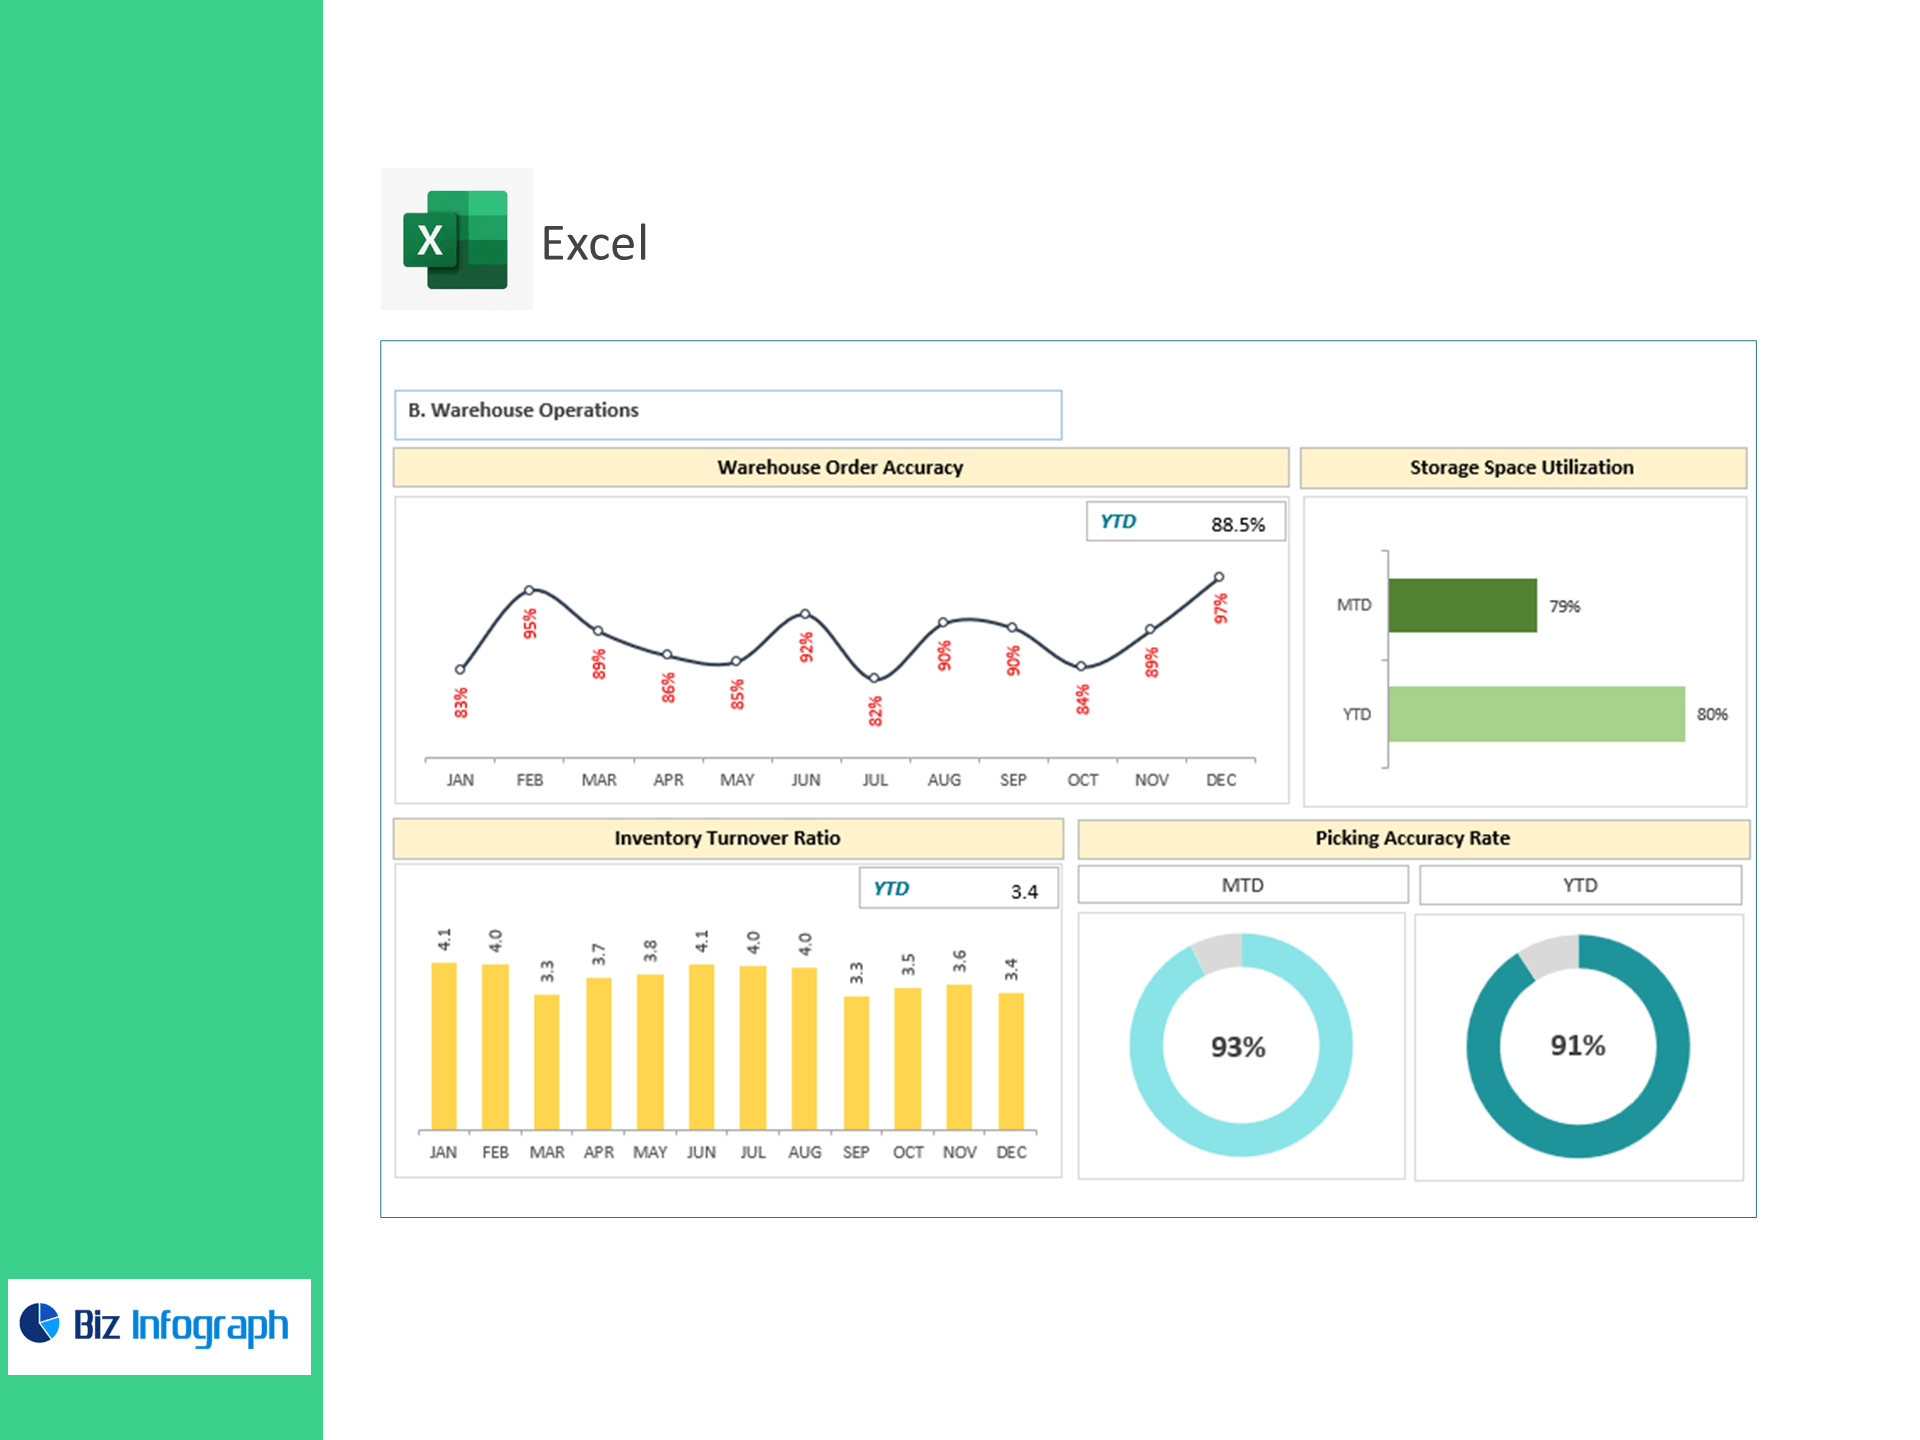
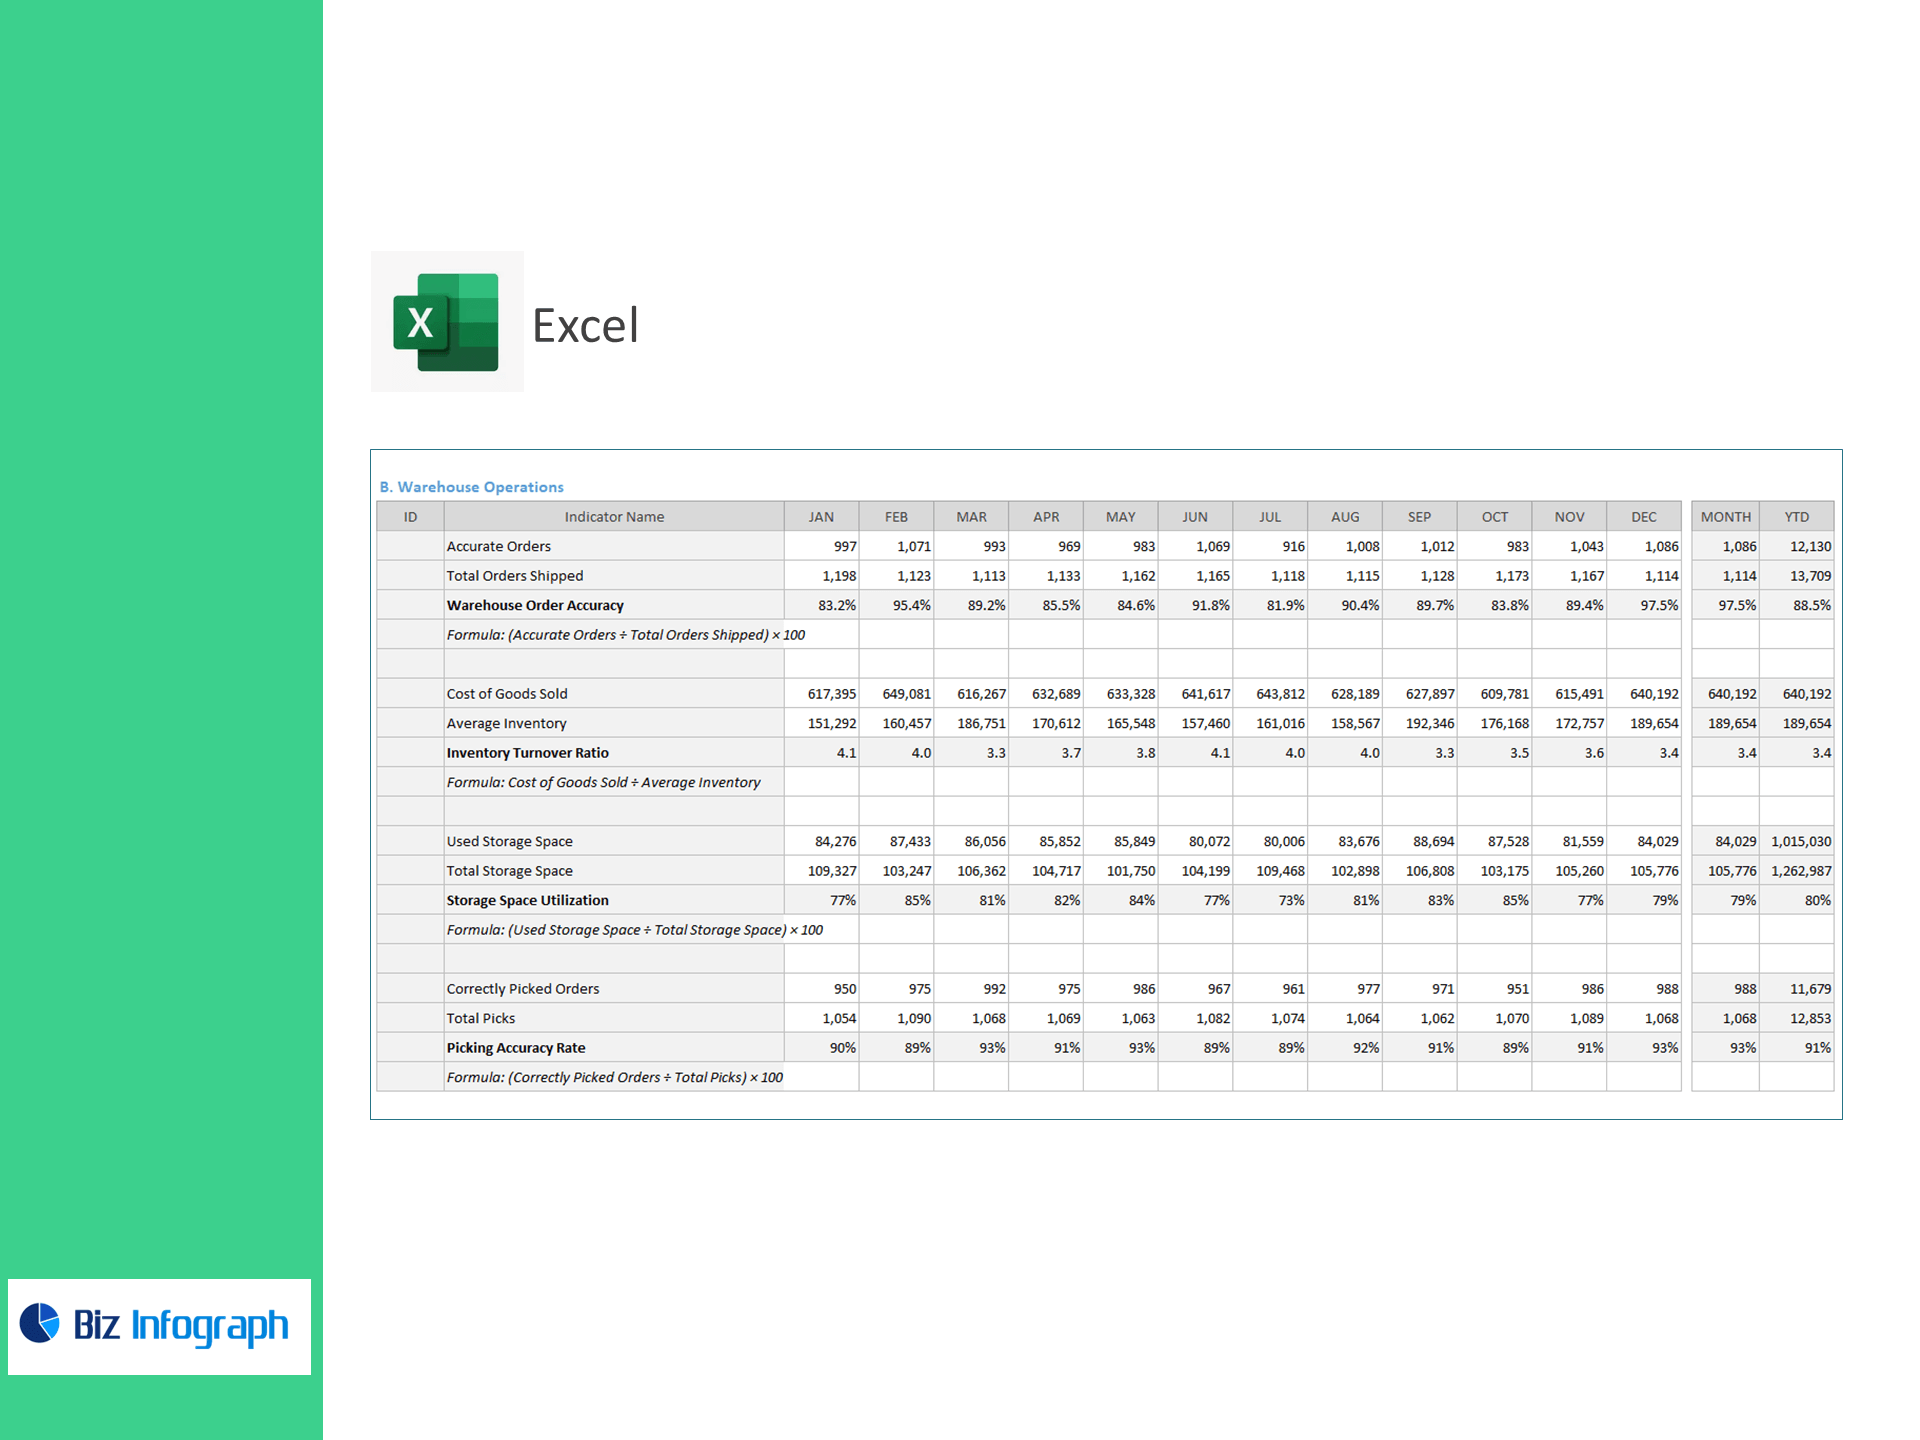
B. Warehouse Operations
Gain visibility into warehouse accuracy, space use, and productivity:
-
Warehouse Order Accuracy – (Accurate Orders ÷ Total Orders Shipped) × 100
Ensure correct and error-free order dispatch. -
Inventory Turnover Ratio – (Cost of Goods Sold ÷ Average Inventory)
Measure how efficiently inventory is managed and replenished. -
Storage Space Utilization – (Used Storage Space ÷ Total Storage Space) × 100
Track warehouse capacity use and identify optimization opportunities. -
Picking Accuracy Rate – (Correctly Picked Orders ÷ Total Picks) × 100
Improve order-picking precision and reduce returns or rework.
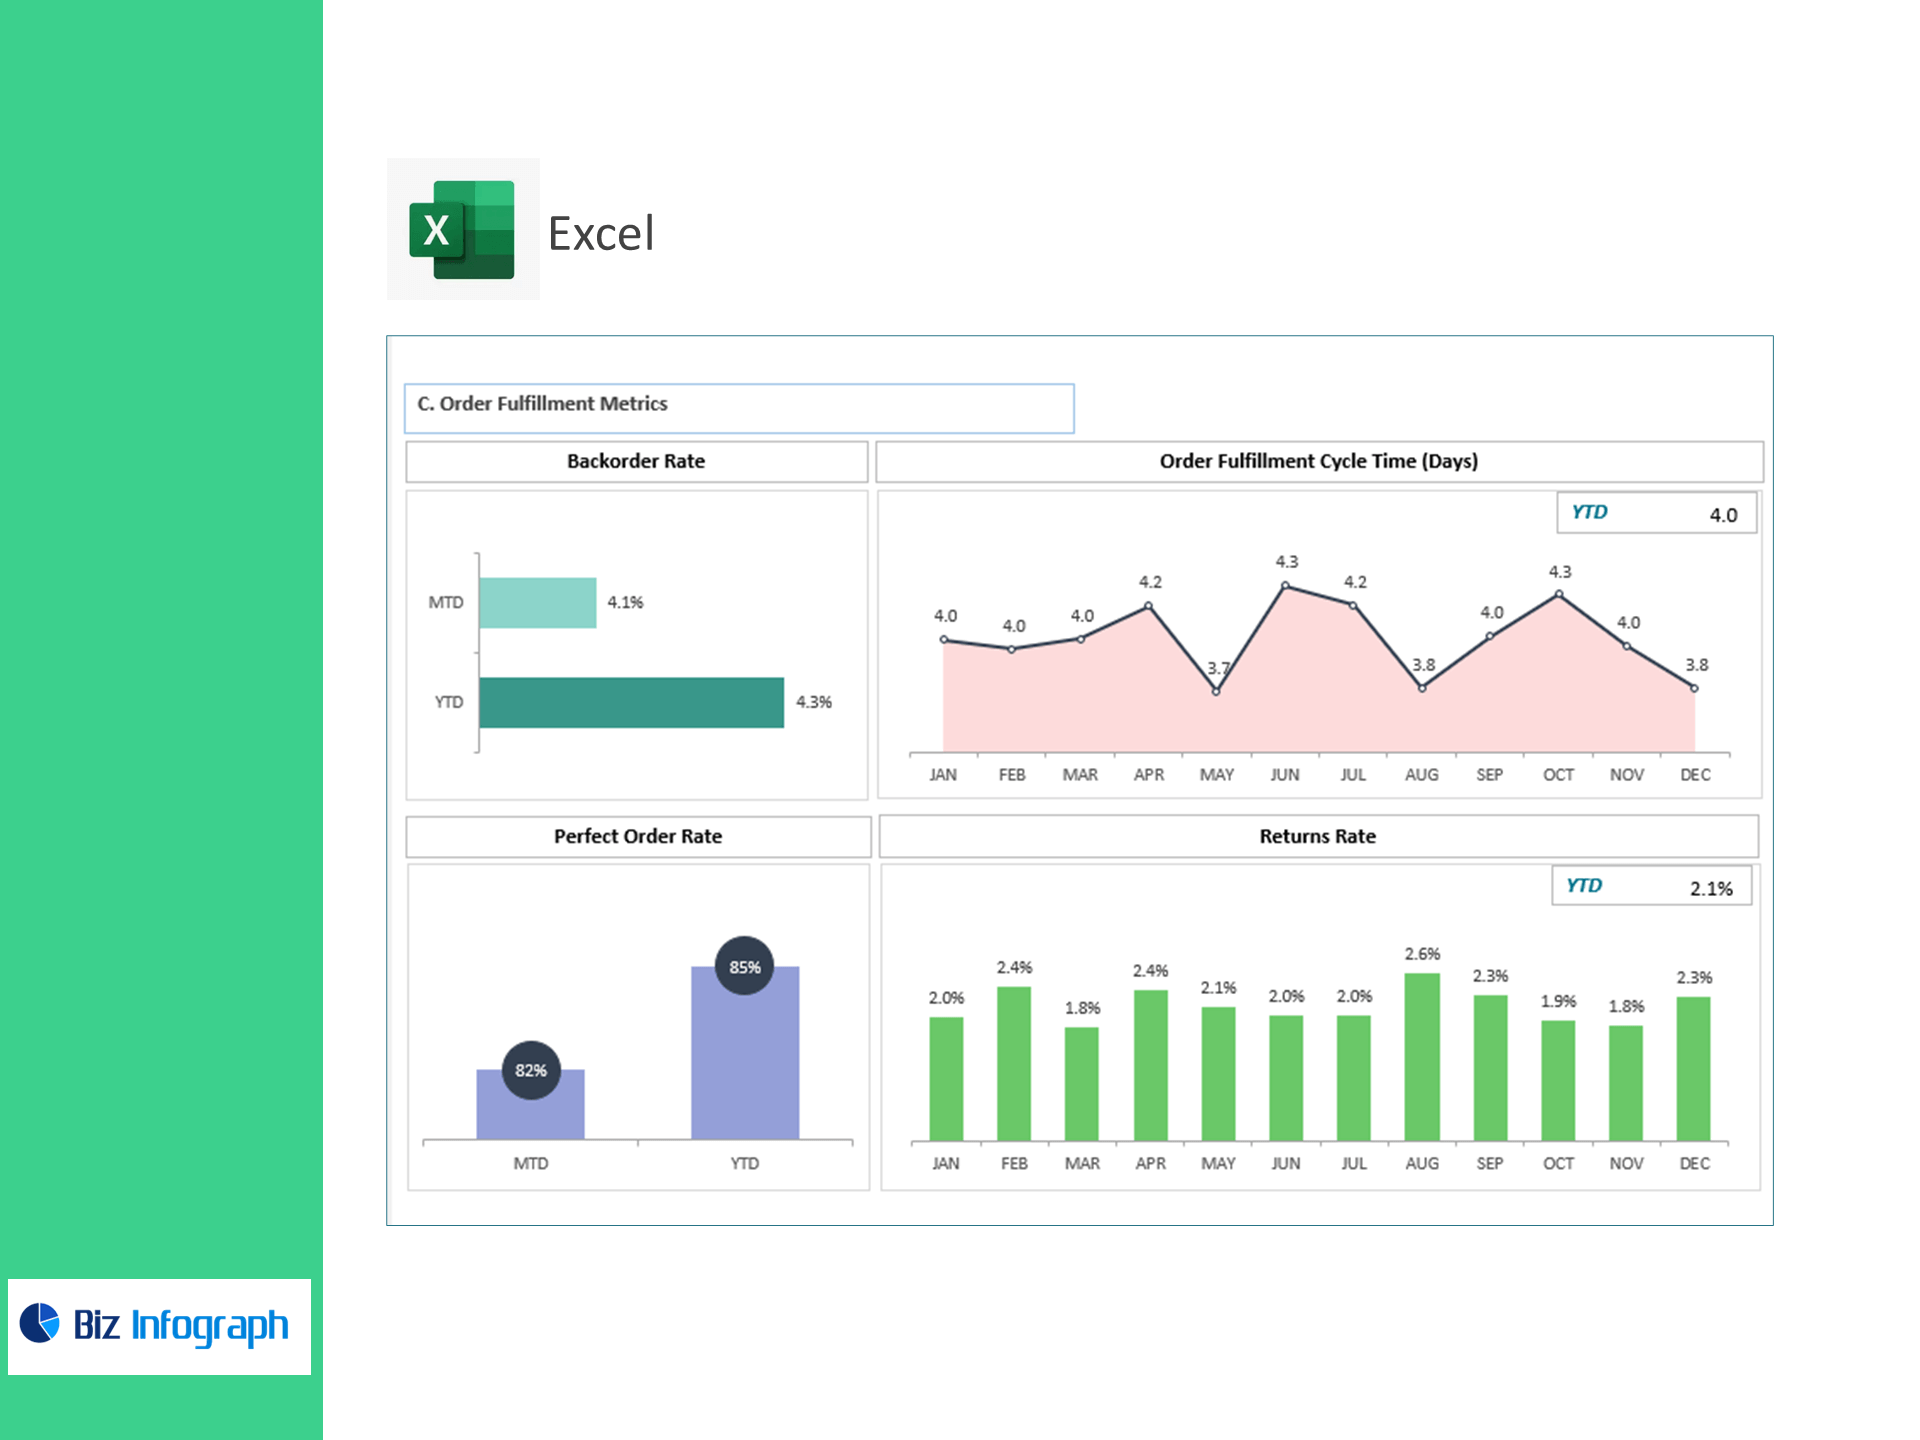
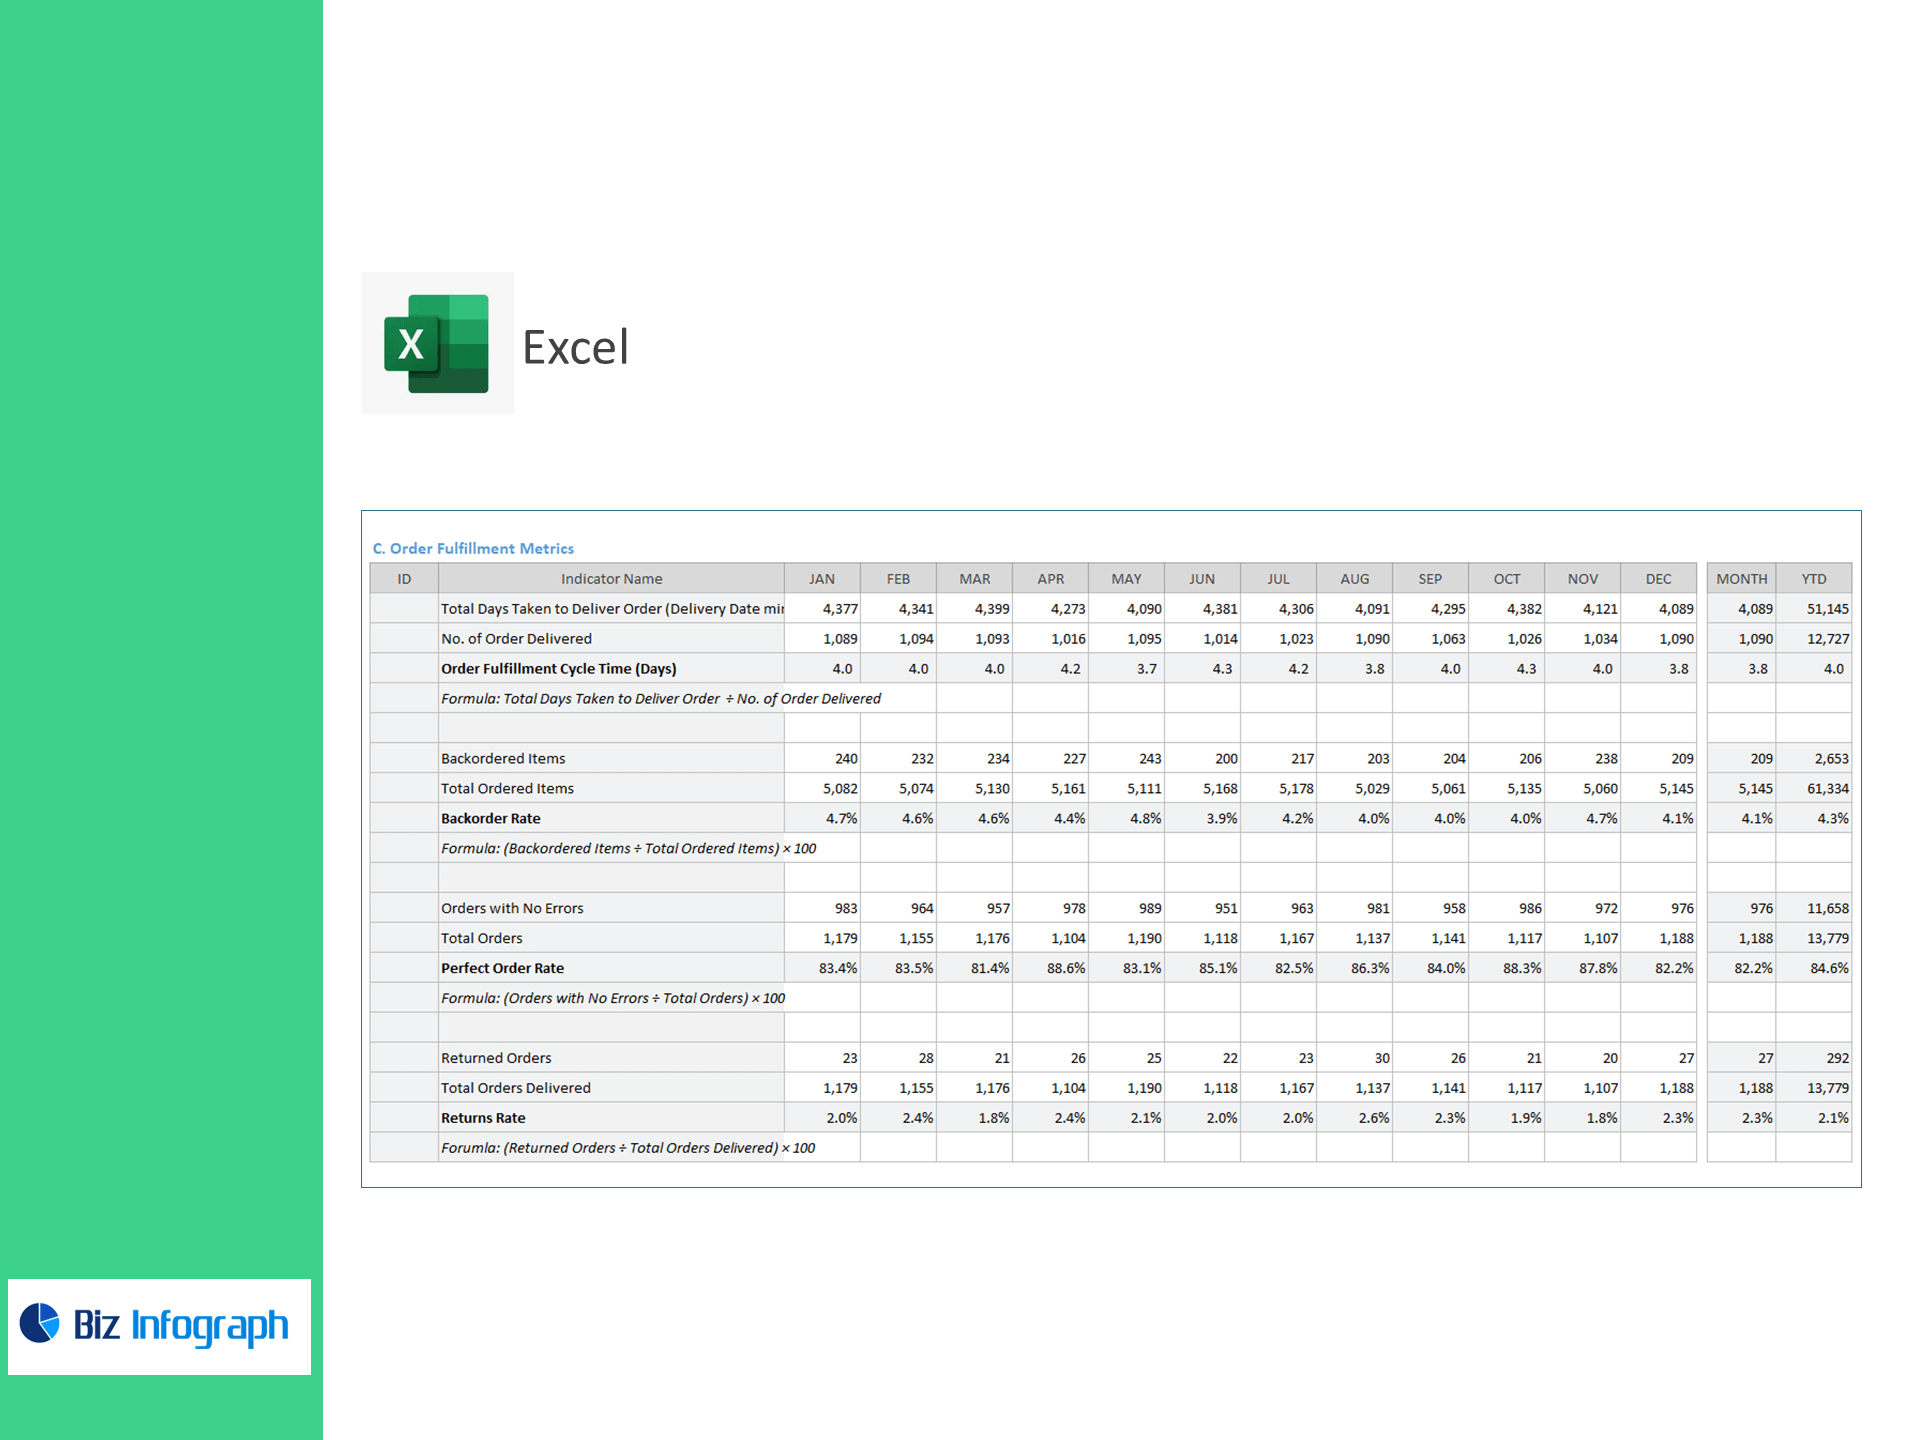
C. Order Fulfillment Metrics
Track fulfillment quality and speed to boost customer satisfaction:
-
Order Fulfillment Cycle Time (Days) – (Total Days Taken ÷ Orders Delivered)
Evaluate end-to-end fulfillment efficiency. -
Backorder Rate – (Backordered Items ÷ Total Ordered Items) × 100
Detect bottlenecks in supply or order processing. -
Perfect Order Rate – (Orders with No Errors ÷ Total Orders) × 100
Monitor operational excellence across all orders. -
Returns Rate – (Returned Orders ÷ Total Orders Delivered) × 100
Track product quality and fulfillment accuracy.
Benefits
-
Streamline logistics operations through data-driven insights.
-
Identify bottlenecks across transportation, warehouse, and fulfillment stages.
-
Improve on-time delivery performance and reduce logistics costs.
-
Enhance warehouse accuracy and inventory efficiency using real metrics.
-
Boost customer satisfaction by optimizing order fulfillment KPIs.
Ideal For
-
Logistics and distribution companies
-
Freight forwarders and 3PL providers
-
E-commerce fulfillment centers
-
Supply chain performance analysts
Deliverables
Pre-built Excel dashboard with automated KPI formulas
Editable charts, pivot tables, and visual summaries
Pre-configured sections for transportation, warehouse, and fulfillment tracking
Simple data entry and instant performance analytics