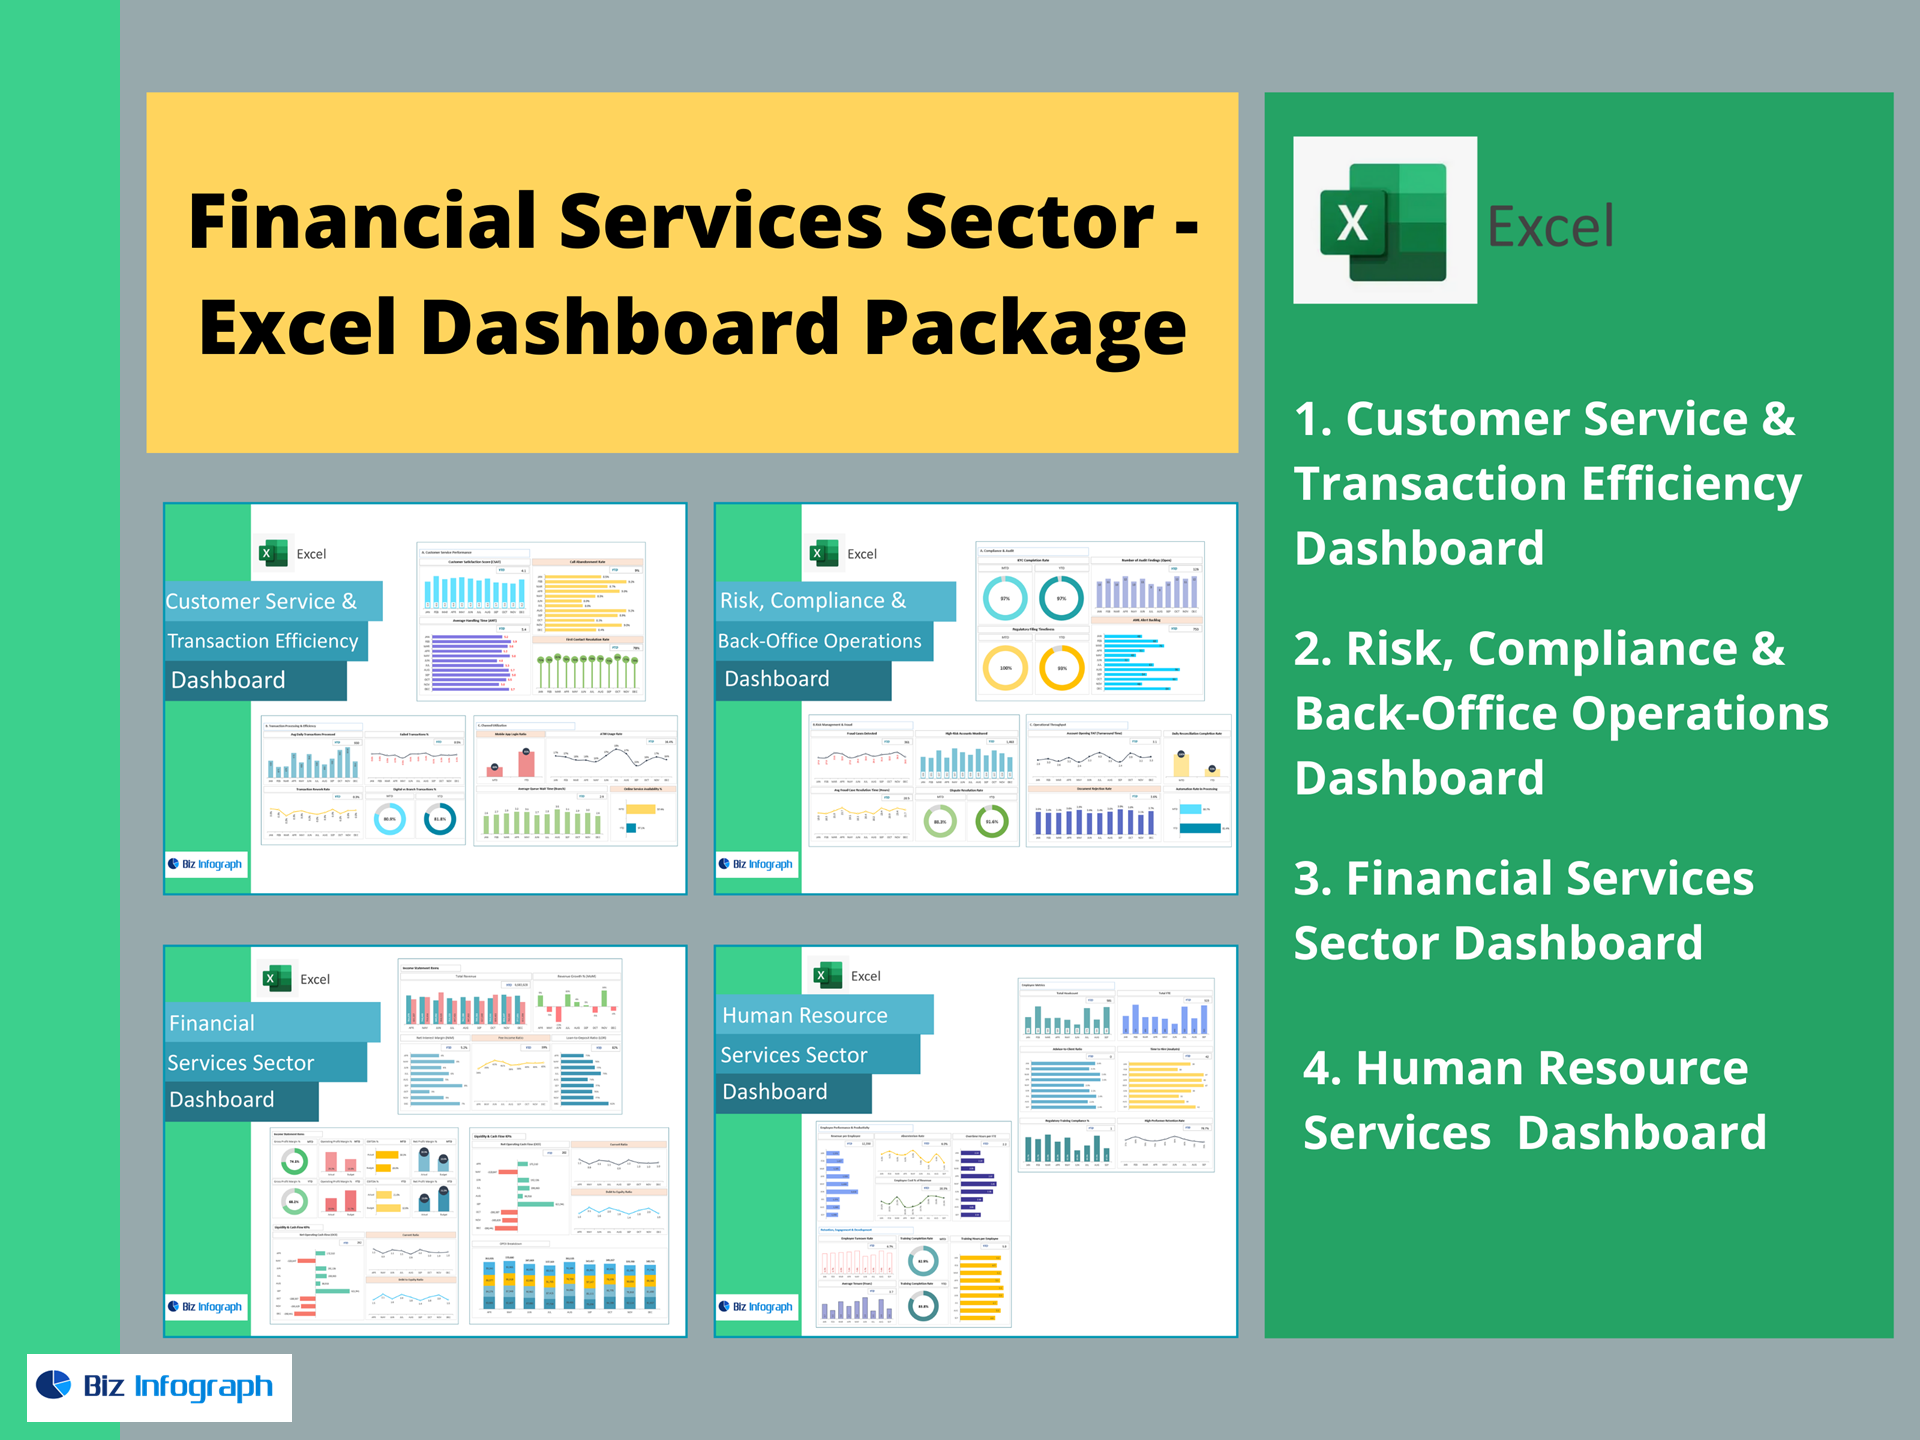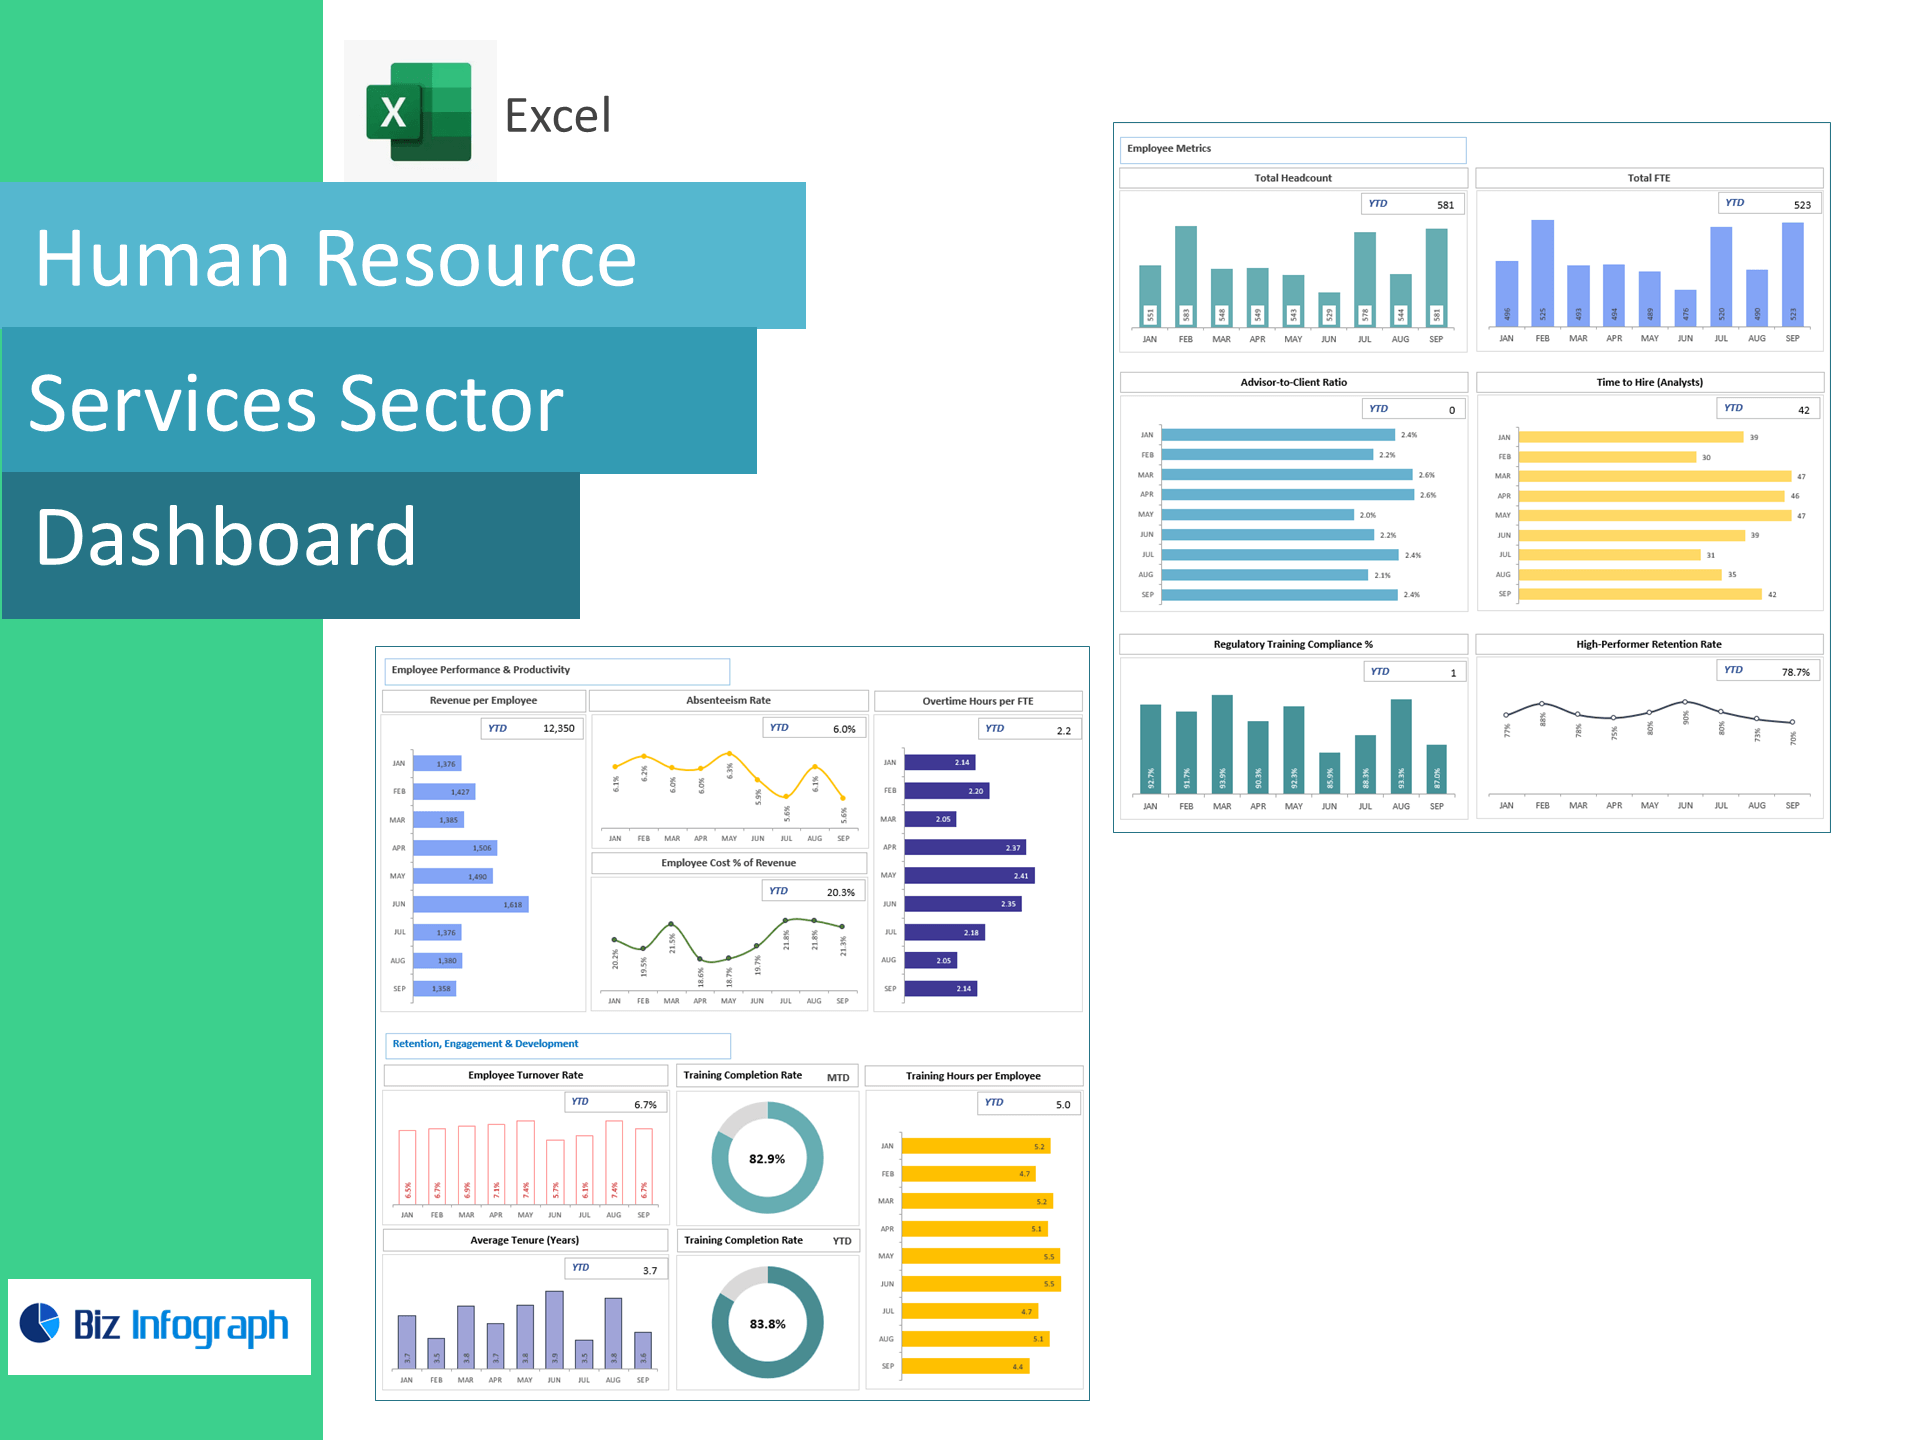
HR Financial Services Dashboard — Excel Template
A ready-to-use HR analytics dashboard for banks, fintech, insurance, and wealth/asset management firms. Track workforce capacity, compliance, productivity, and retention in one clean Excel file—no macros, 100% editable, and built for HR, Ops, and CFO teams.
What it measures (prebuilt KPIs)
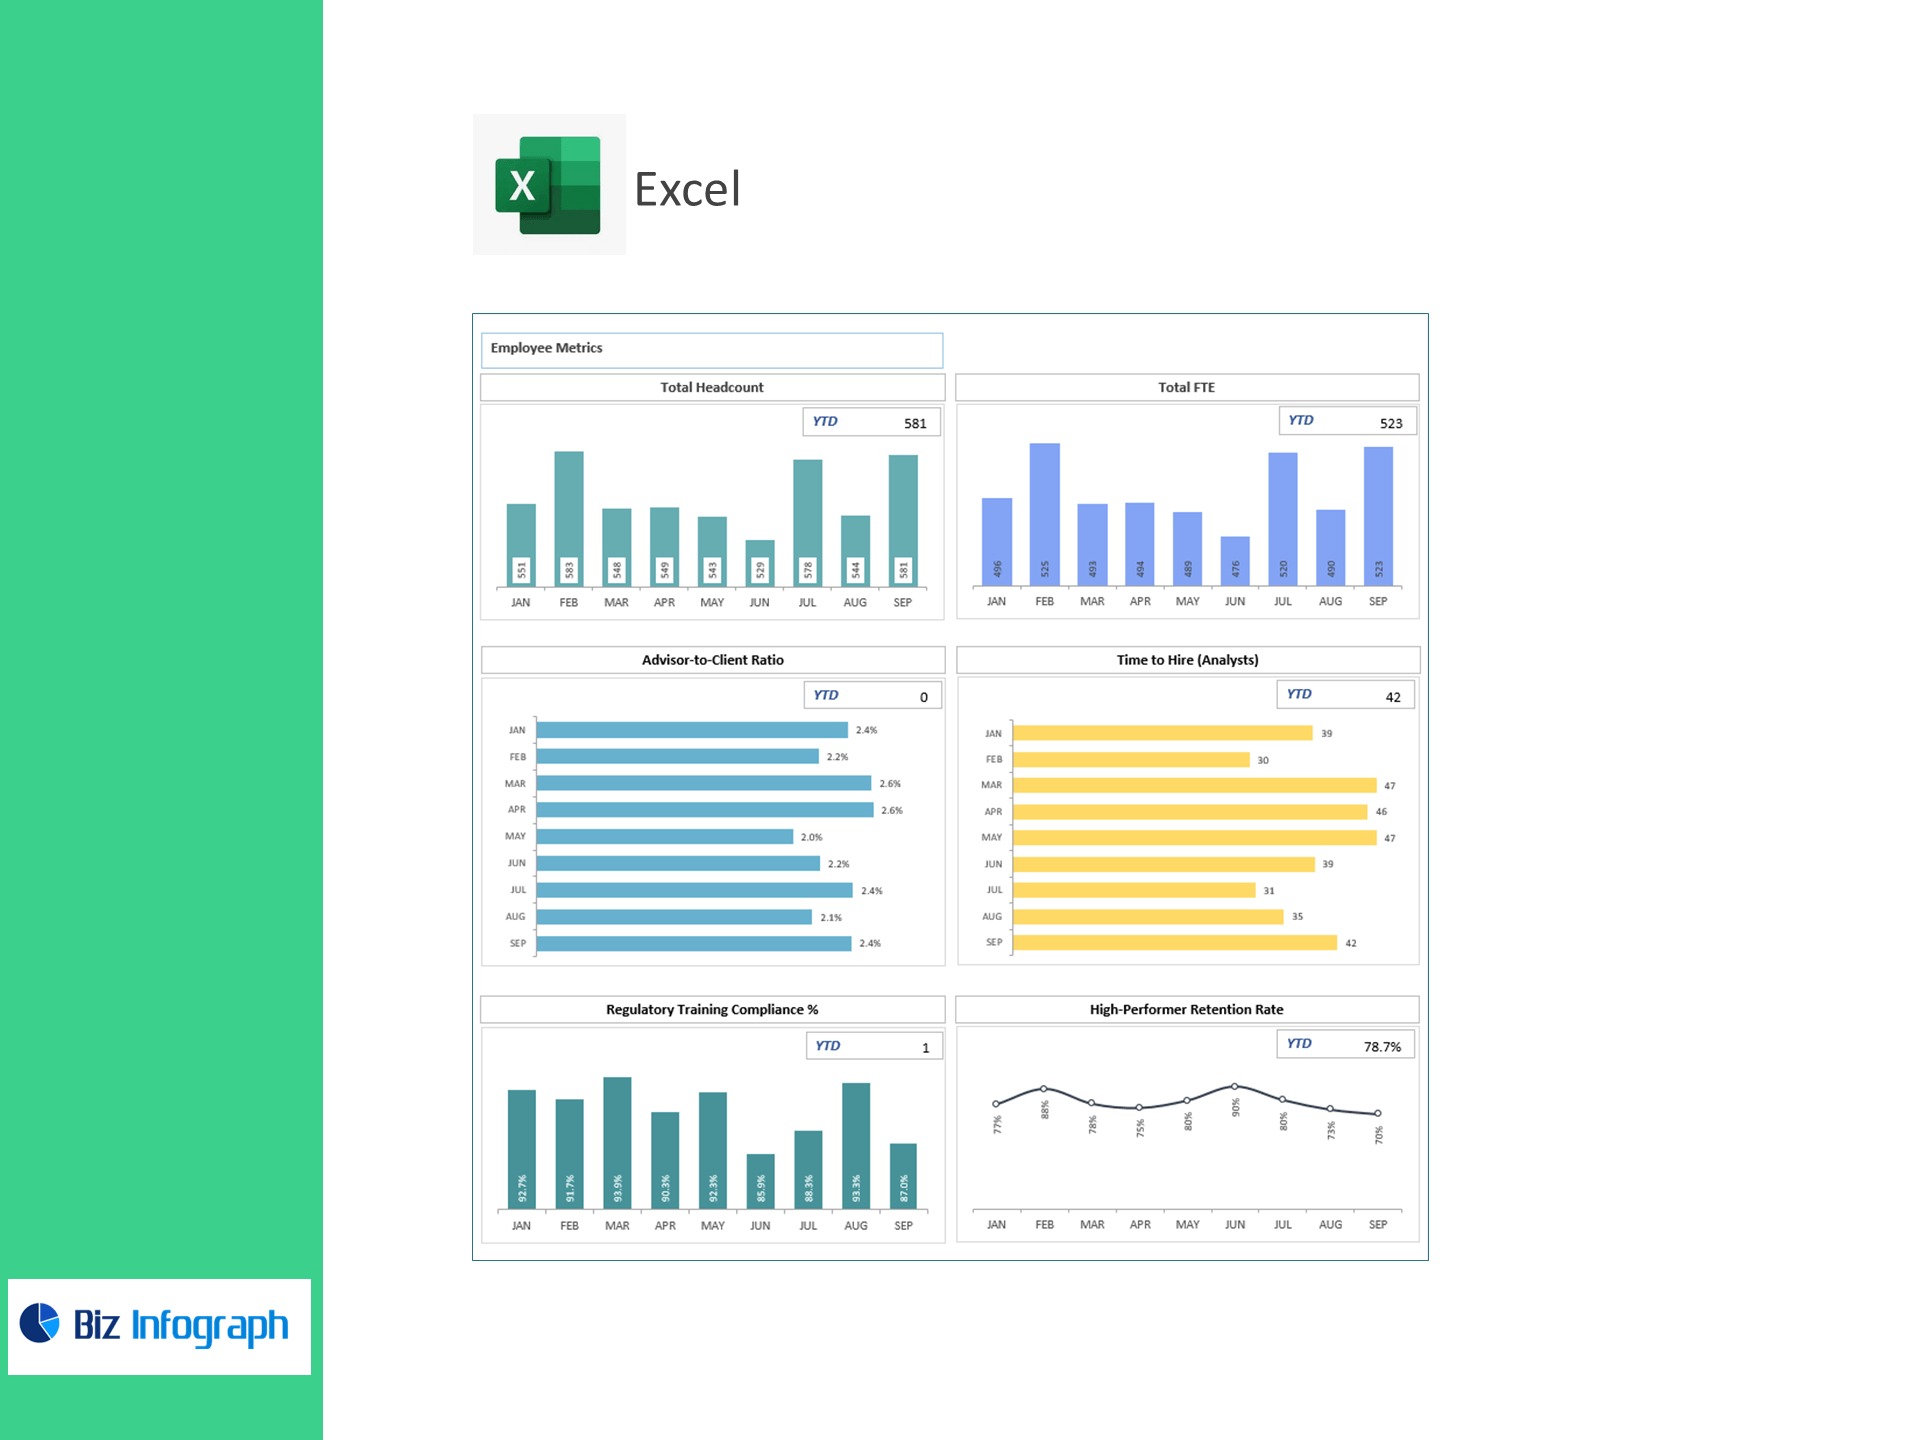
Workforce Capacity & Hiring
-
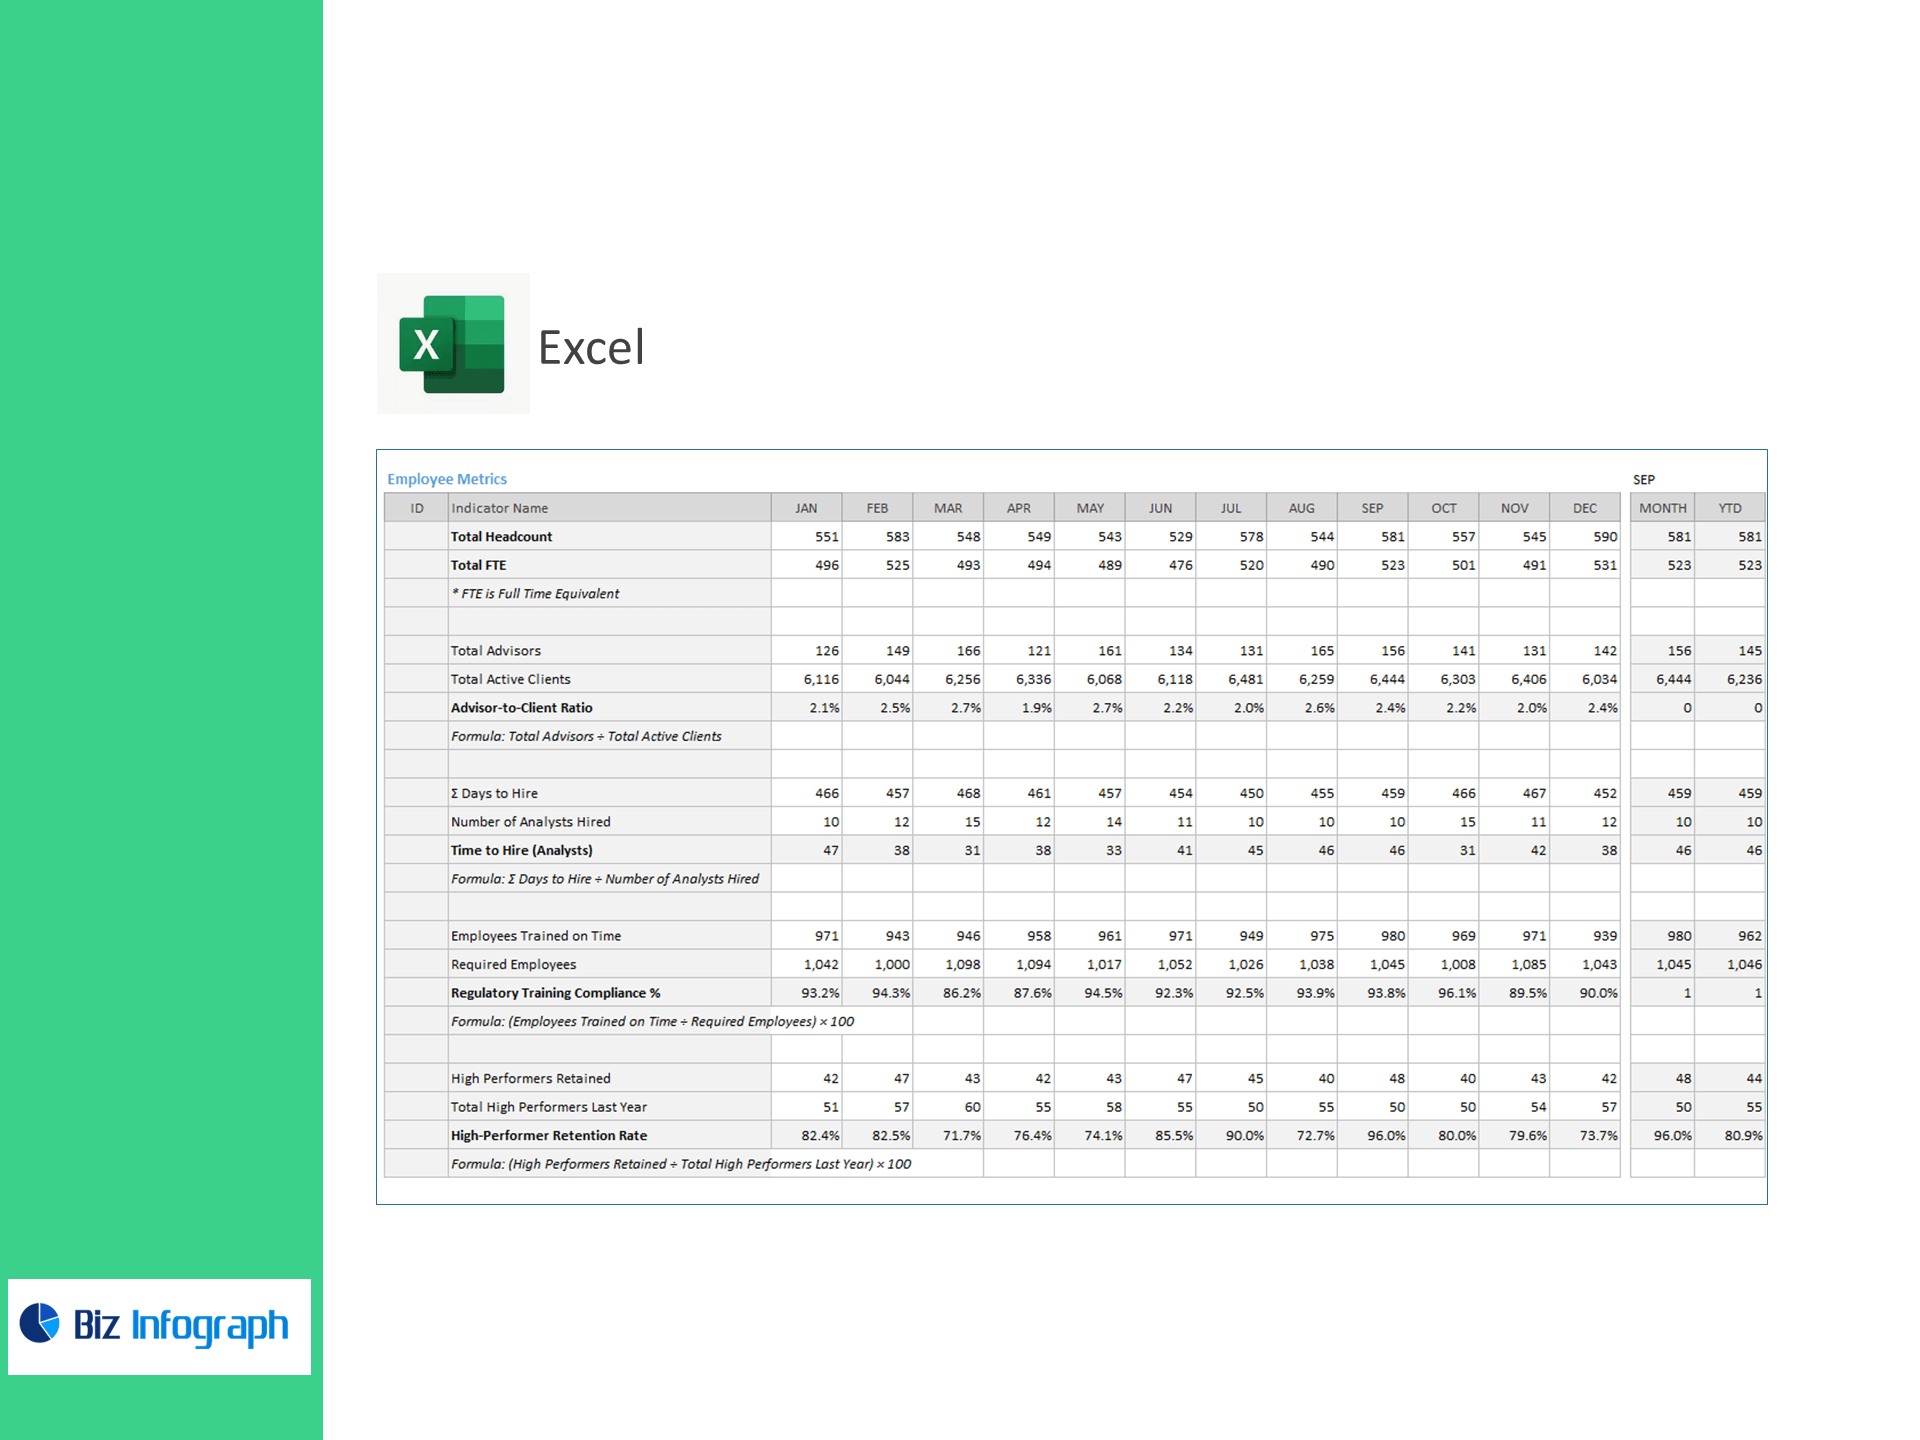
Total Headcount & FTE
-
Advisor-to-Client Ratio
-
Time to Hire (Analysts)
Risk & Compliance
-
Regulatory Training Compliance %
-
High-Performer Retention Rate
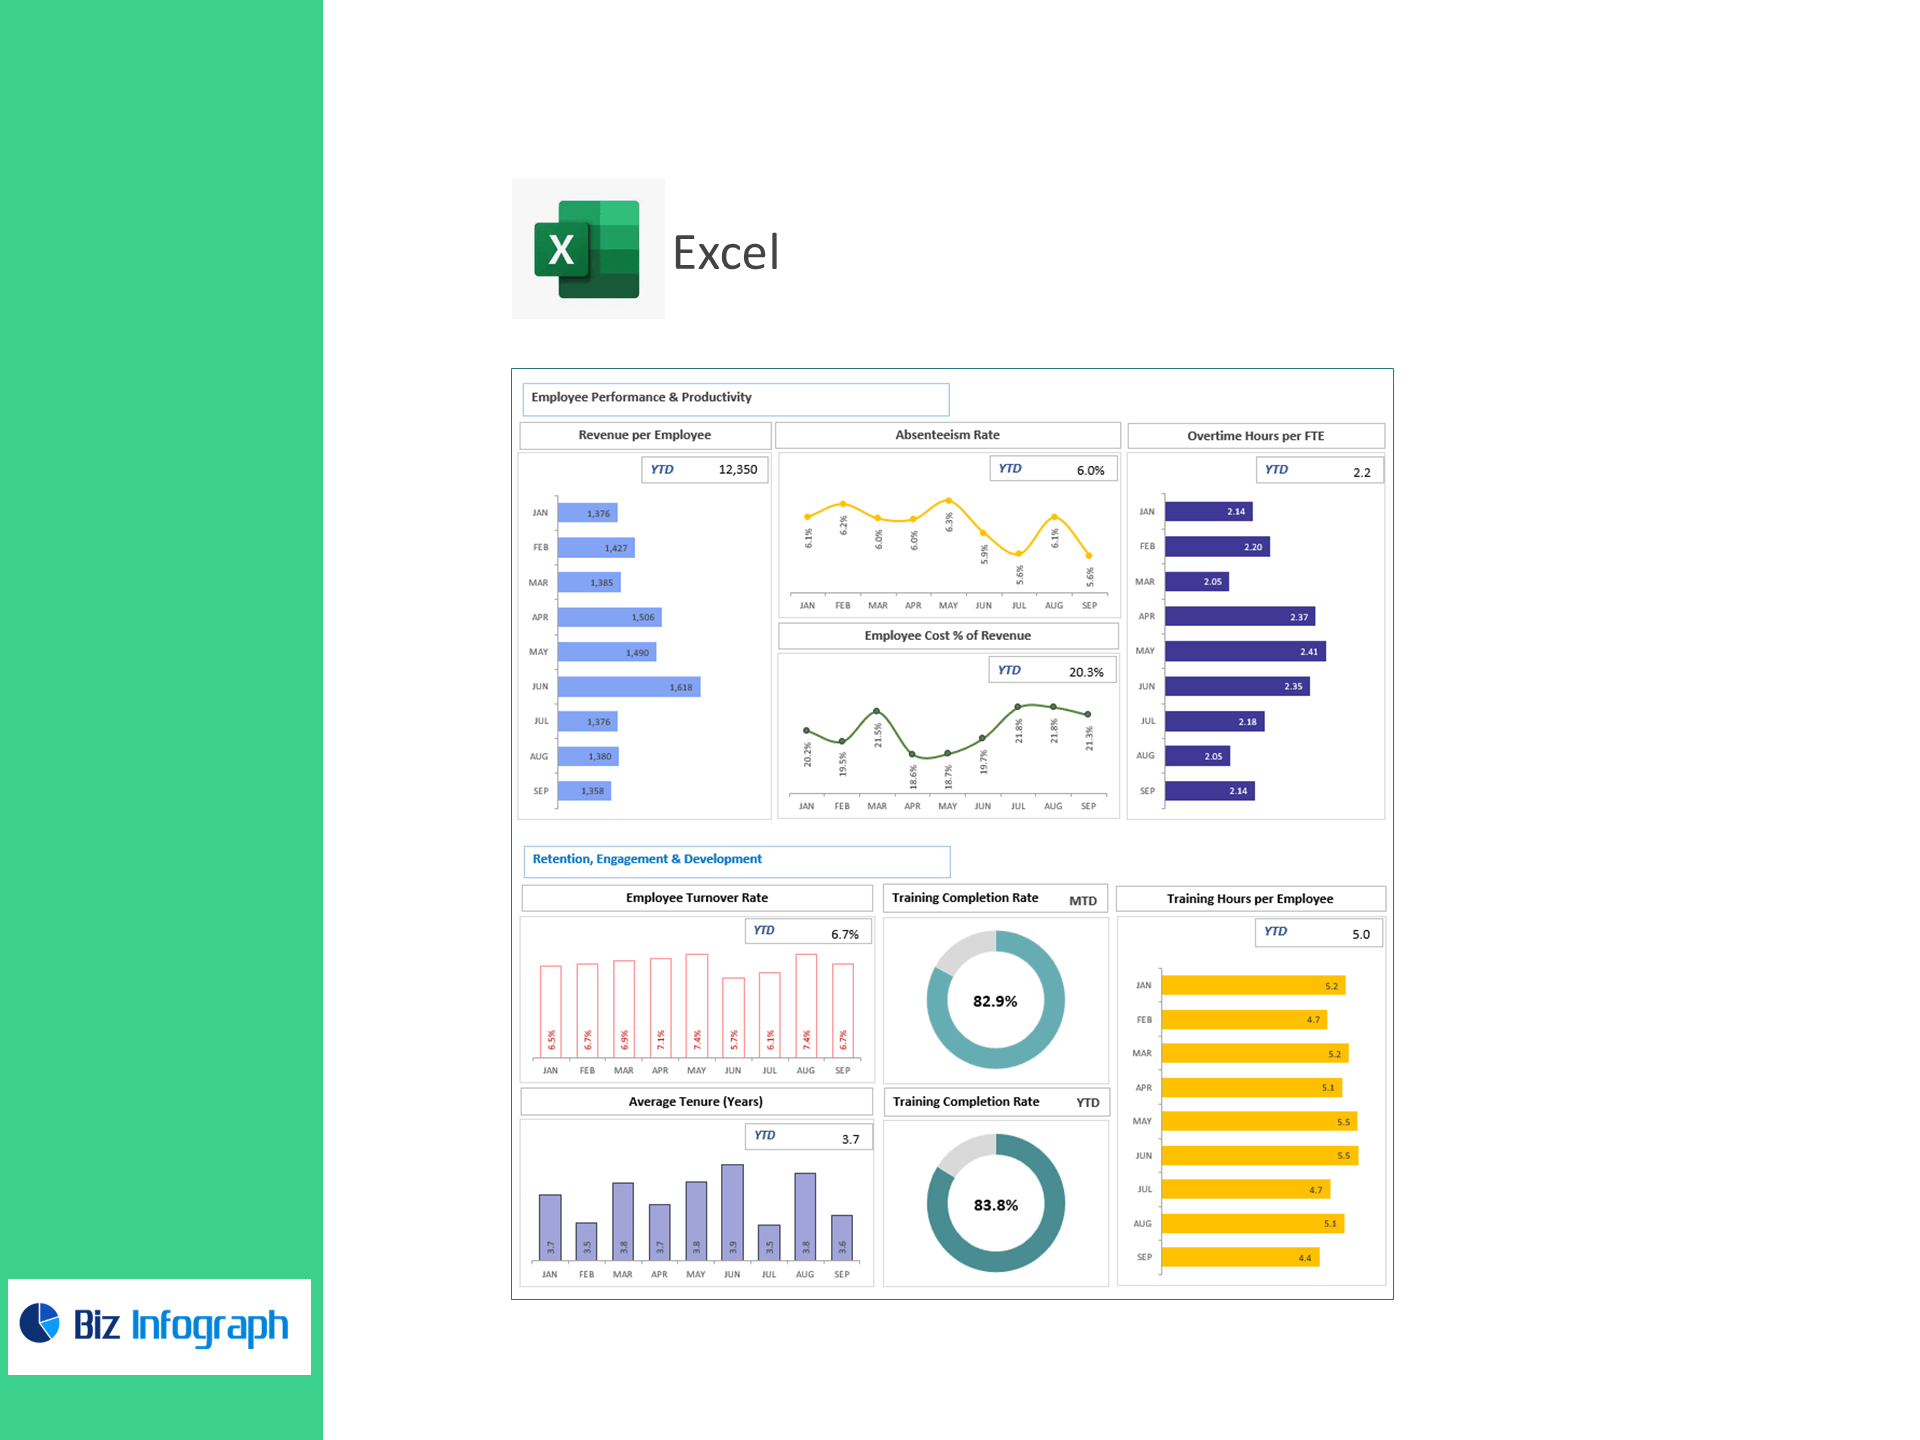
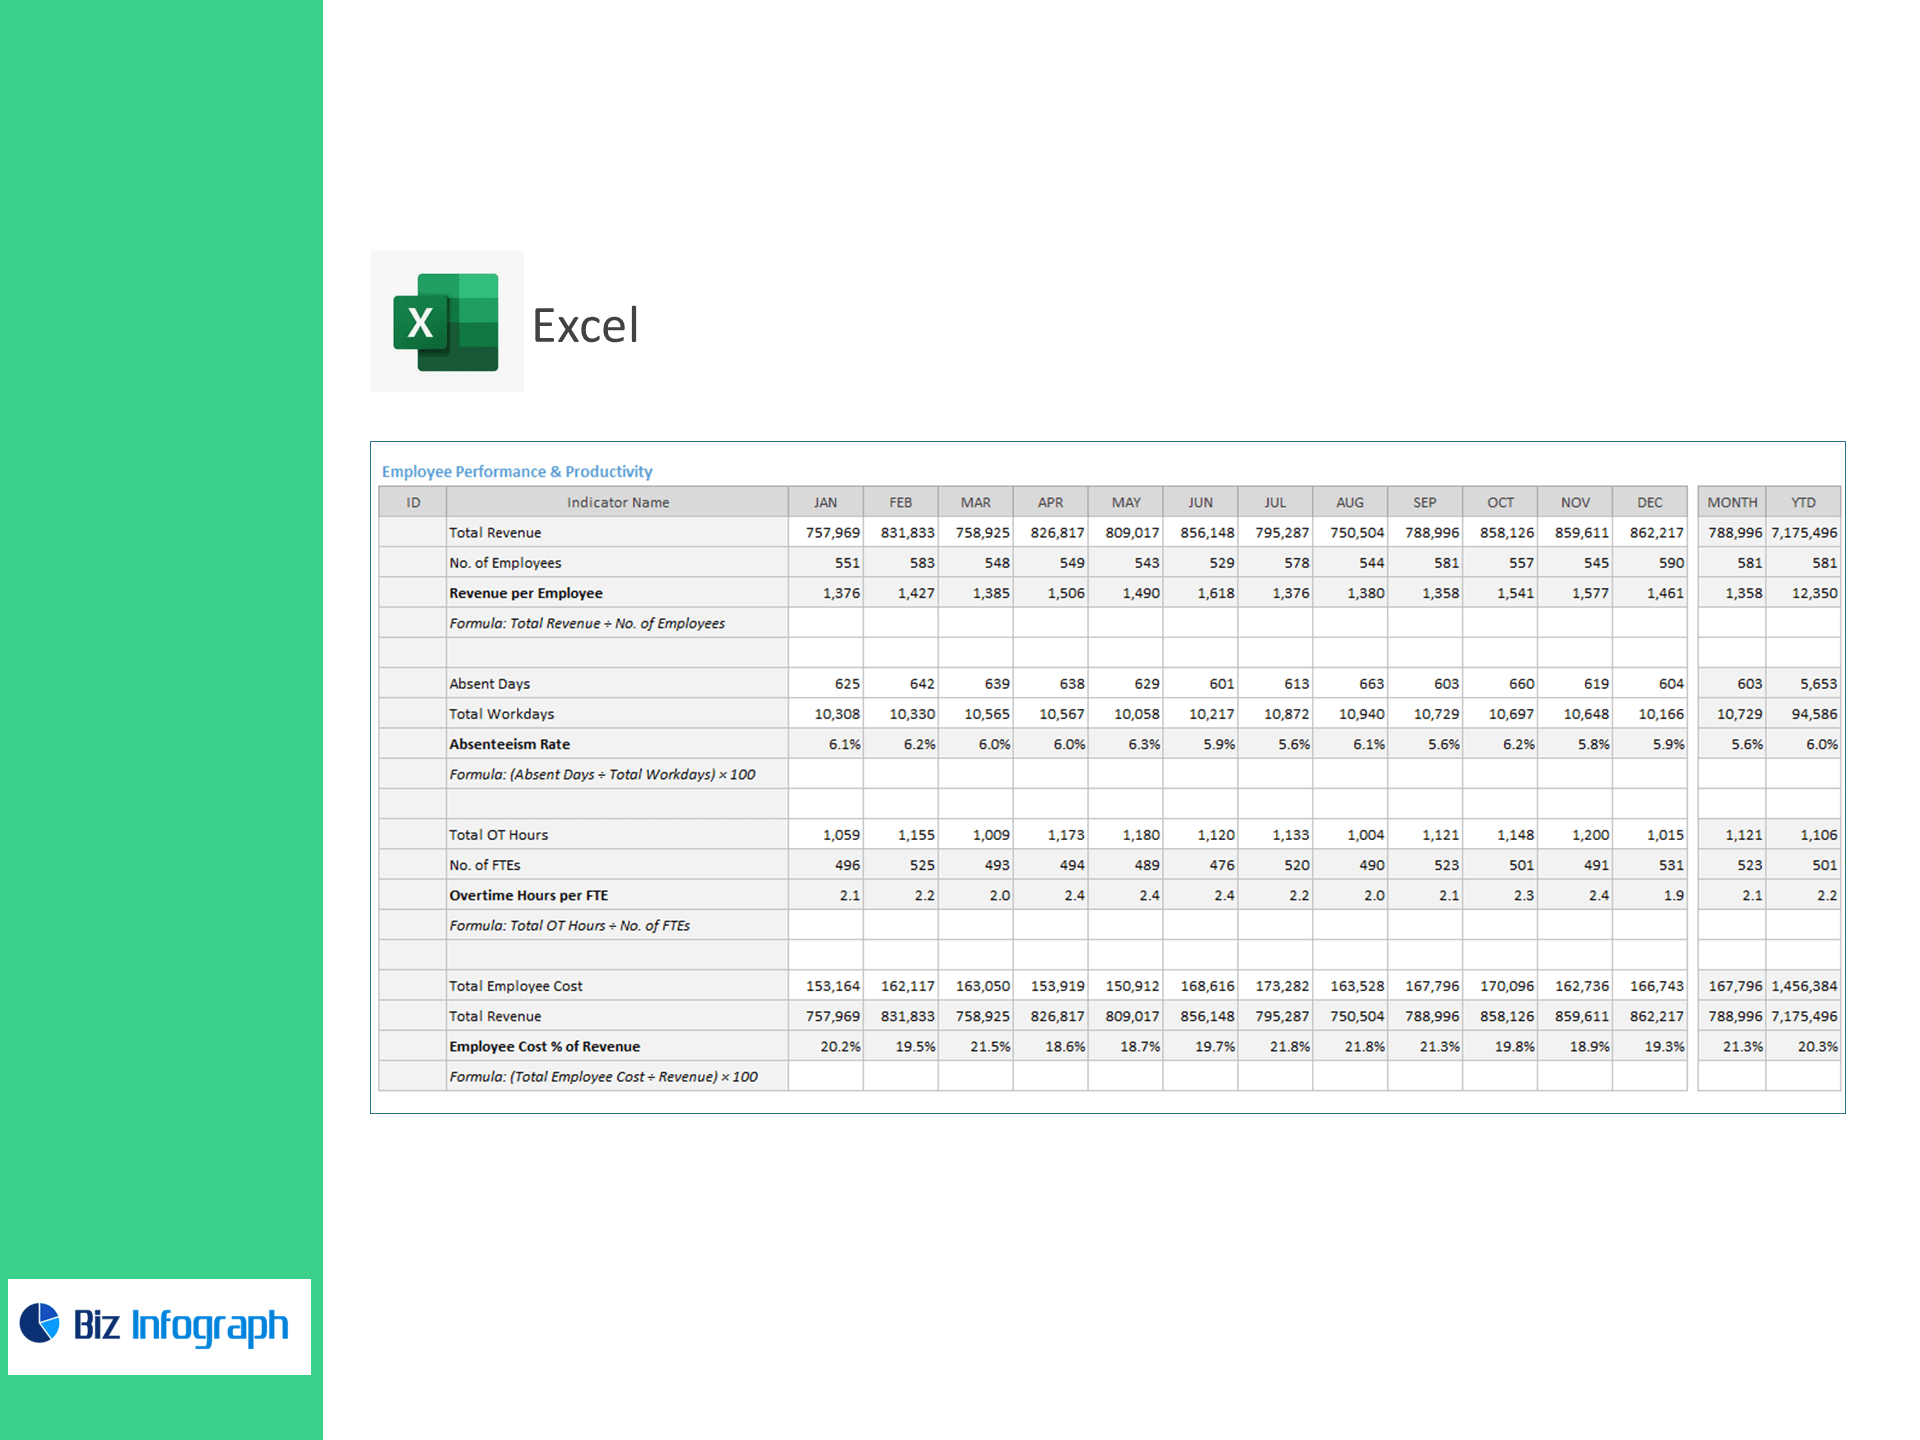
Productivity & Cost
-
Revenue per Employee
-
Absenteeism Rate
-
Overtime Hours per FTE
-
Employee Cost % of Revenue
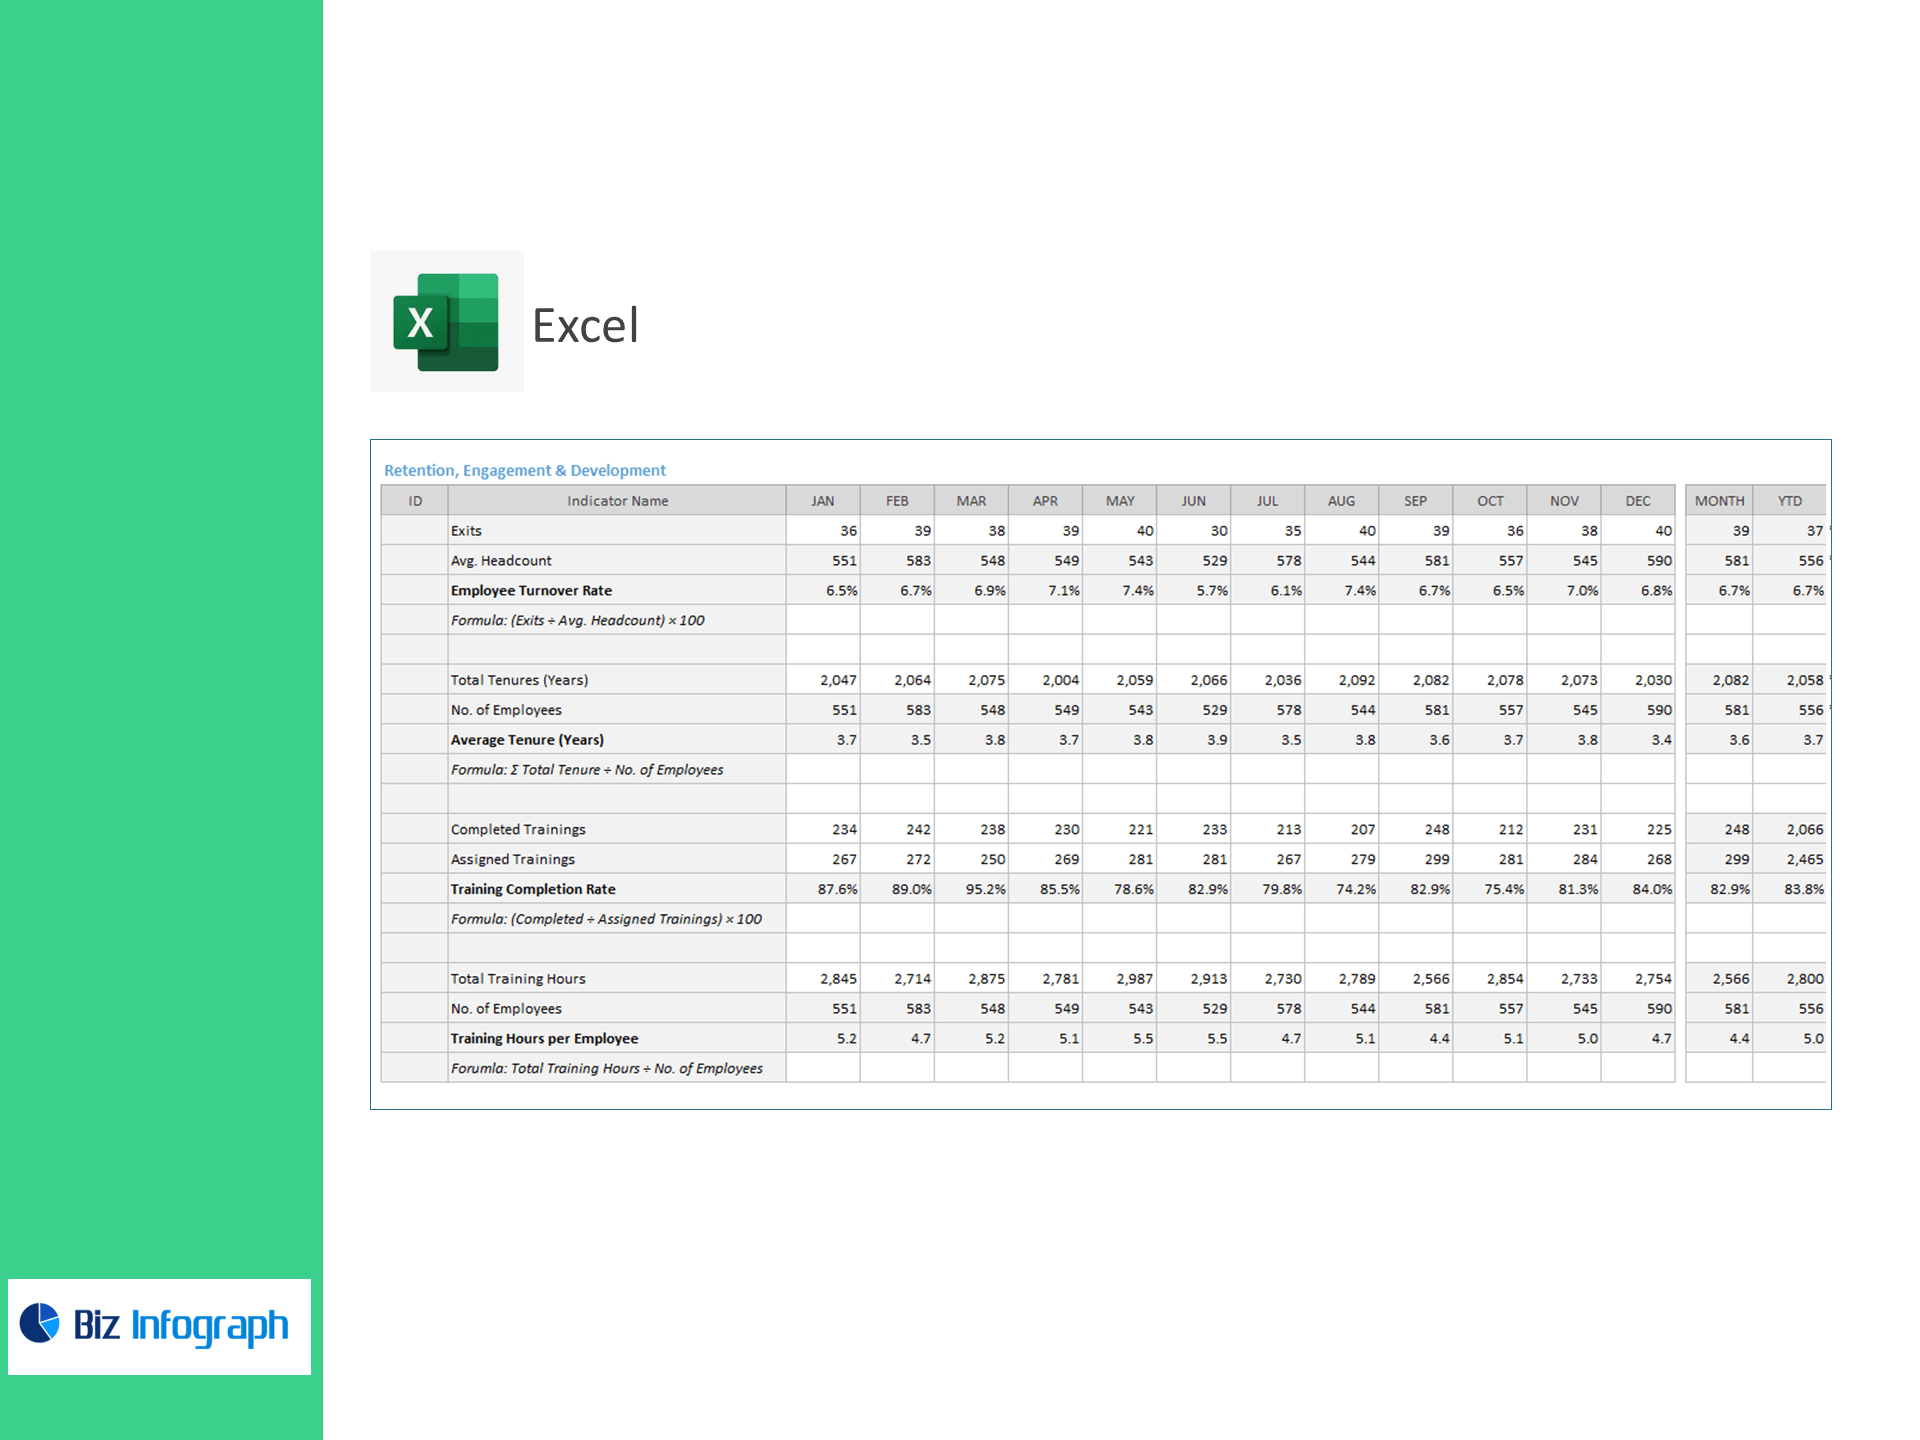
Retention & Development
-
Employee Turnover Rate
-
Average Tenure (Years)
-
Training Completion Rate
-
Training Hours per Employee
Why financial services teams use it
-
Balance advisor coverage vs. active clients to protect service levels and AUM growth.
-
Prove ROI with productivity and cost ratios trusted by CFOs.
-
Stay audit-ready with training compliance at a glance.
-
Reduce flight risk by monitoring high-performer retention and tenure trends.
What’s inside
-
Executive KPI cards with variance vs. targets
-
Trend charts by business unit, branch, or role (advisors, analysts, ops)
-
Headcount & FTE bridges, cohort tenure views
-
Compliance heatmaps and training pipeline tracker
-
Clean data sheets + refresh instructions, slicers for entity, location, month
-
Works on Excel 365/2021 (Win & Mac); easy export to PDF/PowerPoint
SEO Essentials
-
Meta Title (≤60): HR Financial Services Dashboard Excel Template | KPIs & Compliance
-
Meta Description (≤160): Track advisor-to-client ratio, time to hire analysts, training compliance, revenue per employee, turnover, and overtime with a ready-to-use HR dashboard for financial services.
-
URL Slug: hr-financial-services-dashboard-excel
-
Primary Keywords: HR financial services dashboard, banking HR KPIs, advisor to client ratio Excel, training compliance dashboard
-
Secondary Keywords: revenue per employee finance, overtime hours per FTE, employee cost percentage of revenue, analyst time to hire, turnover and tenure report
For ready-to-use Dashboard Templates: