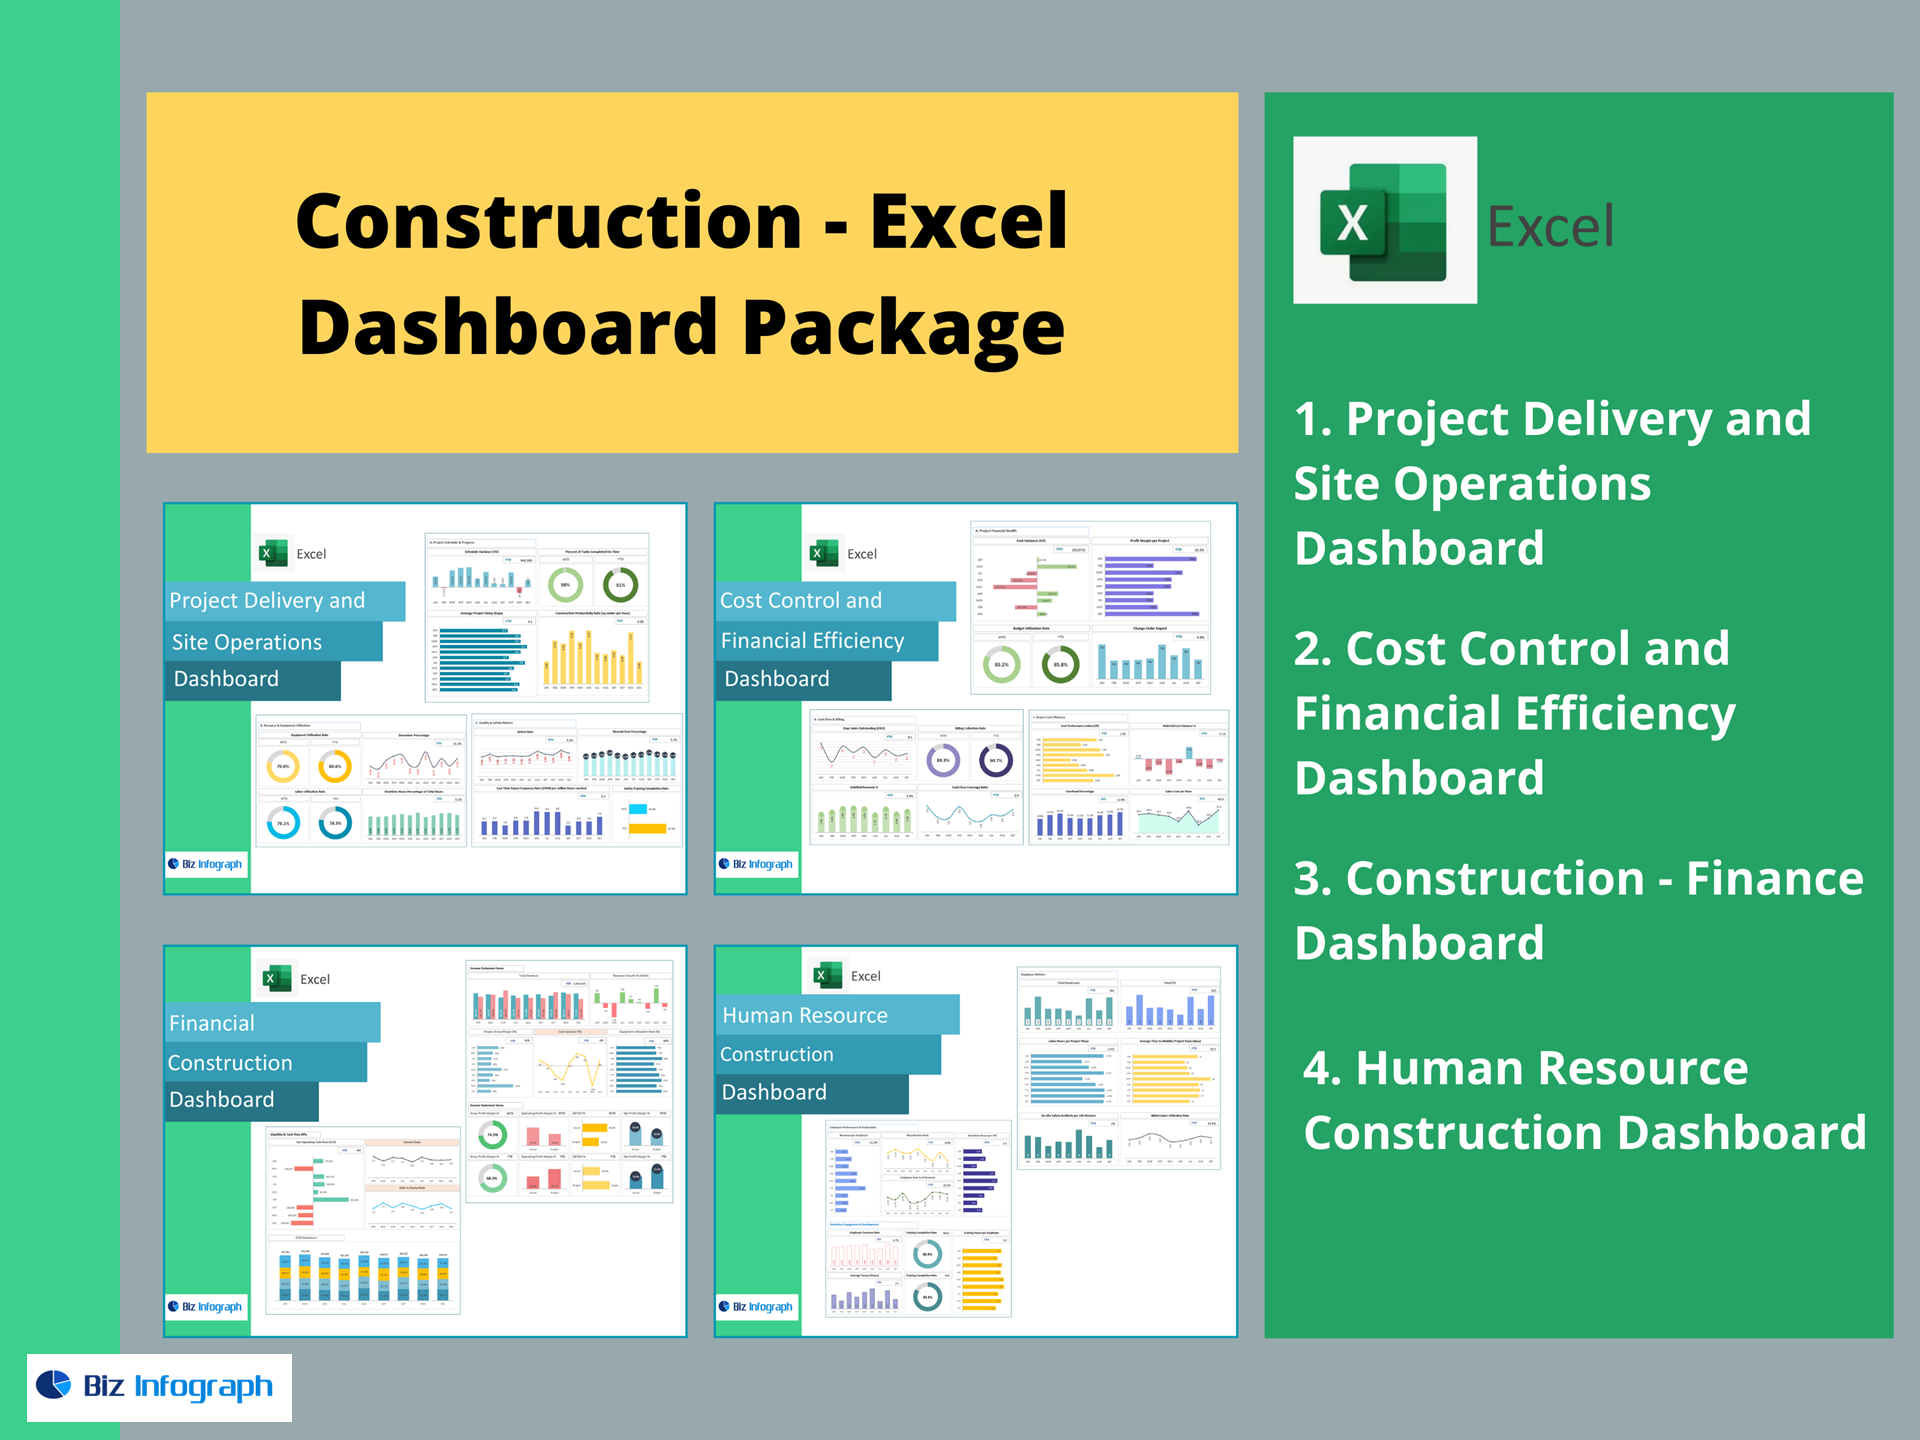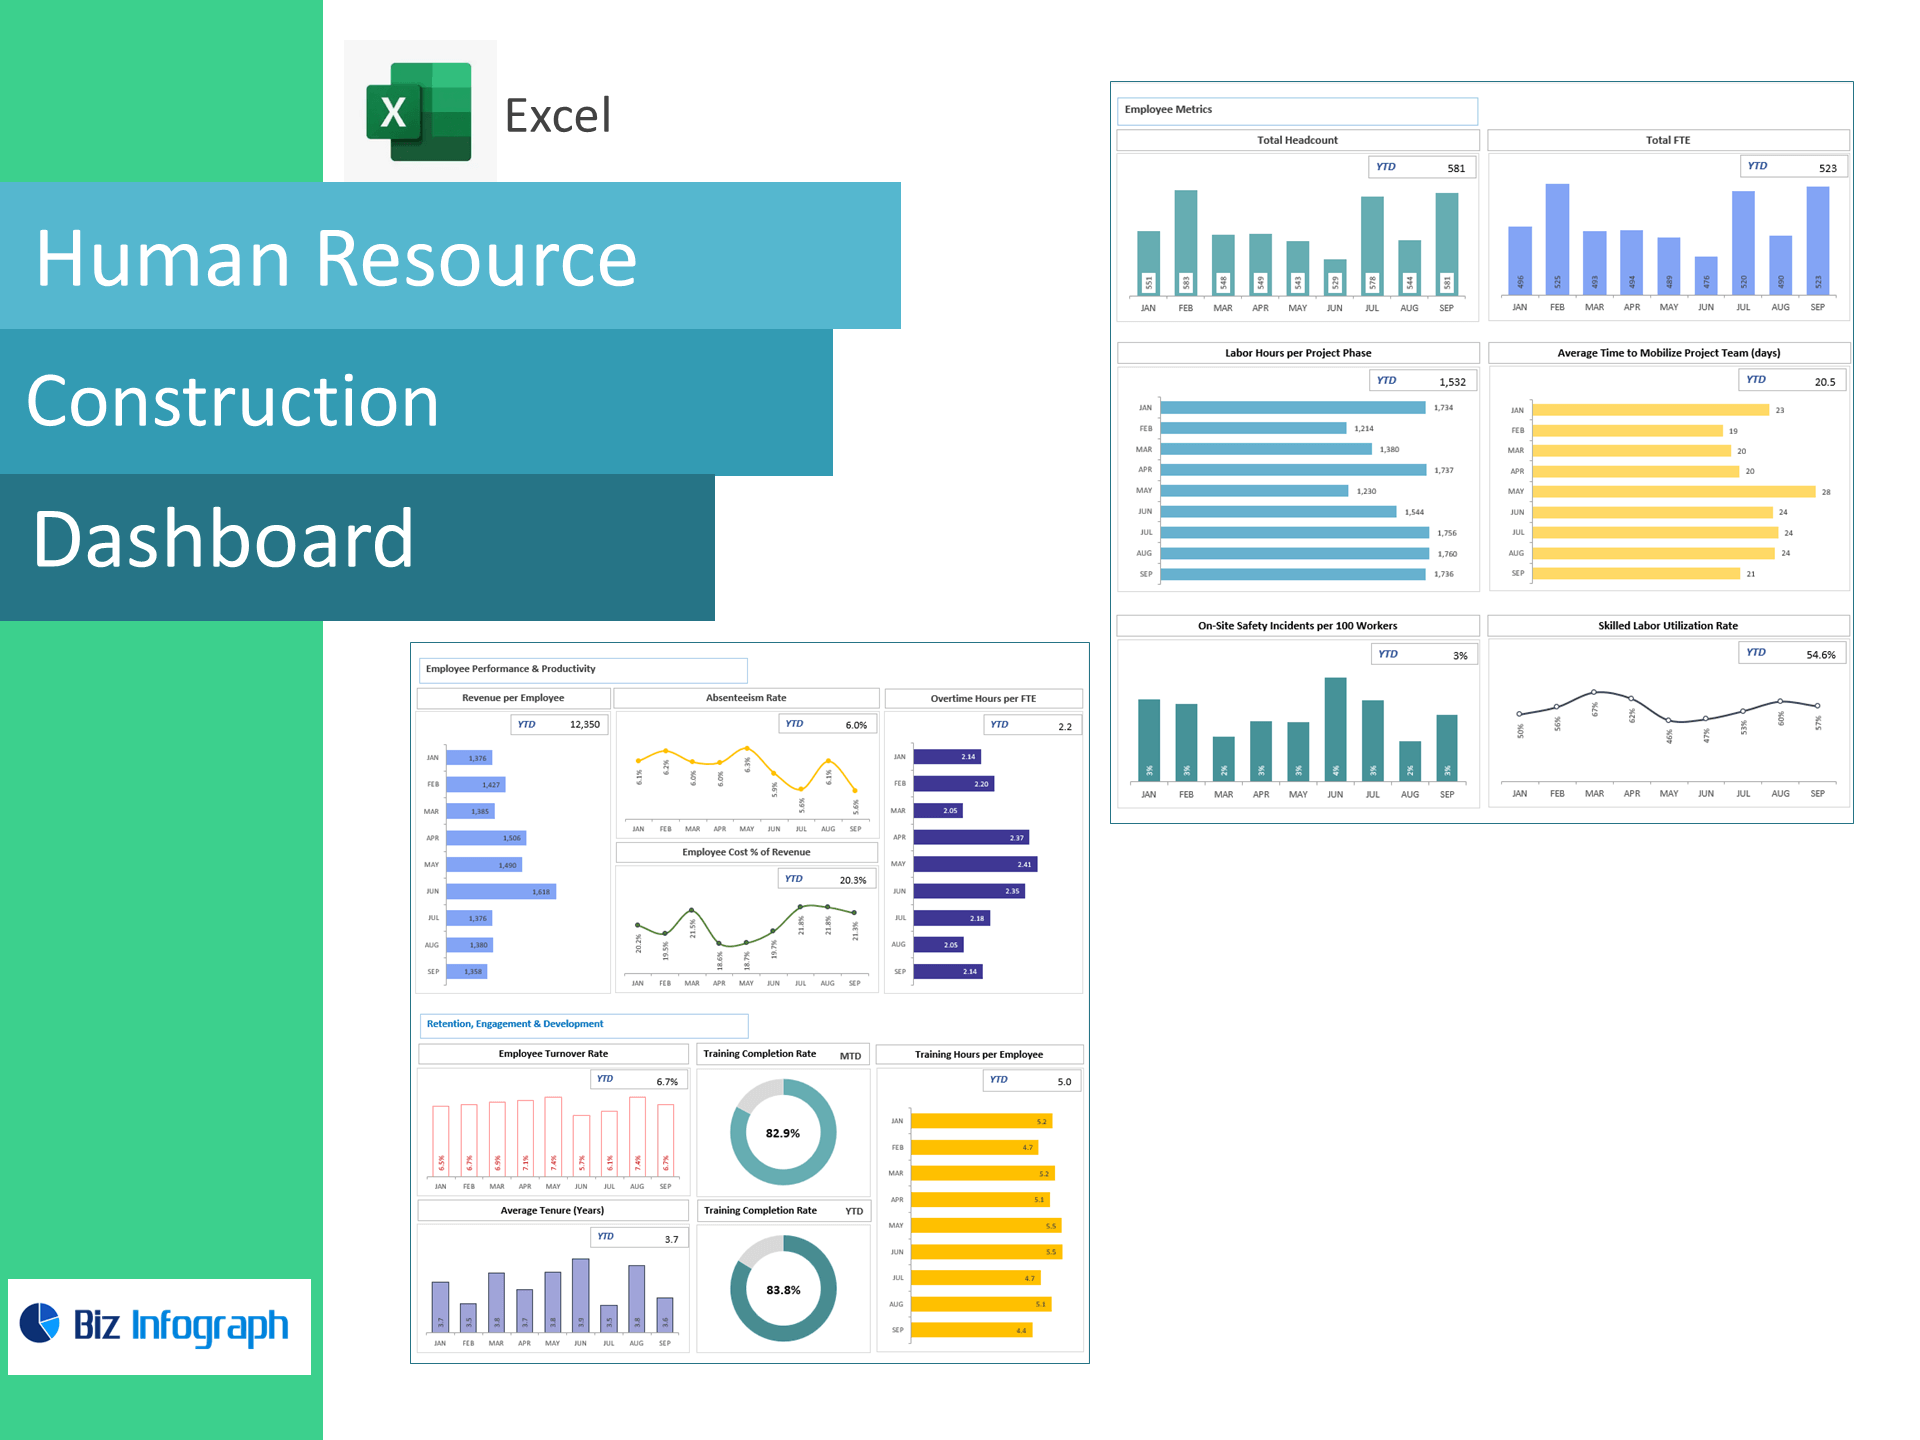
HR Construction Dashboard — Excel Template
Mobilize crews faster, keep sites safer, and control labor costs—right in Excel. This ready-to-use HR analytics template turns timesheets, safety logs, and payroll exports into a live dashboard tracking Labor Hours per Project Phase, Time to Mobilize Project Team, Safety Incidents per 100 Workers, Skilled Labor Utilization, Revenue per Employee, Absenteeism, Overtime per FTE, Employee Cost % of Revenue, Turnover, Average Tenure, Training Completion, and Training Hours per Employee—so you can staff smarter and deliver projects on schedule.
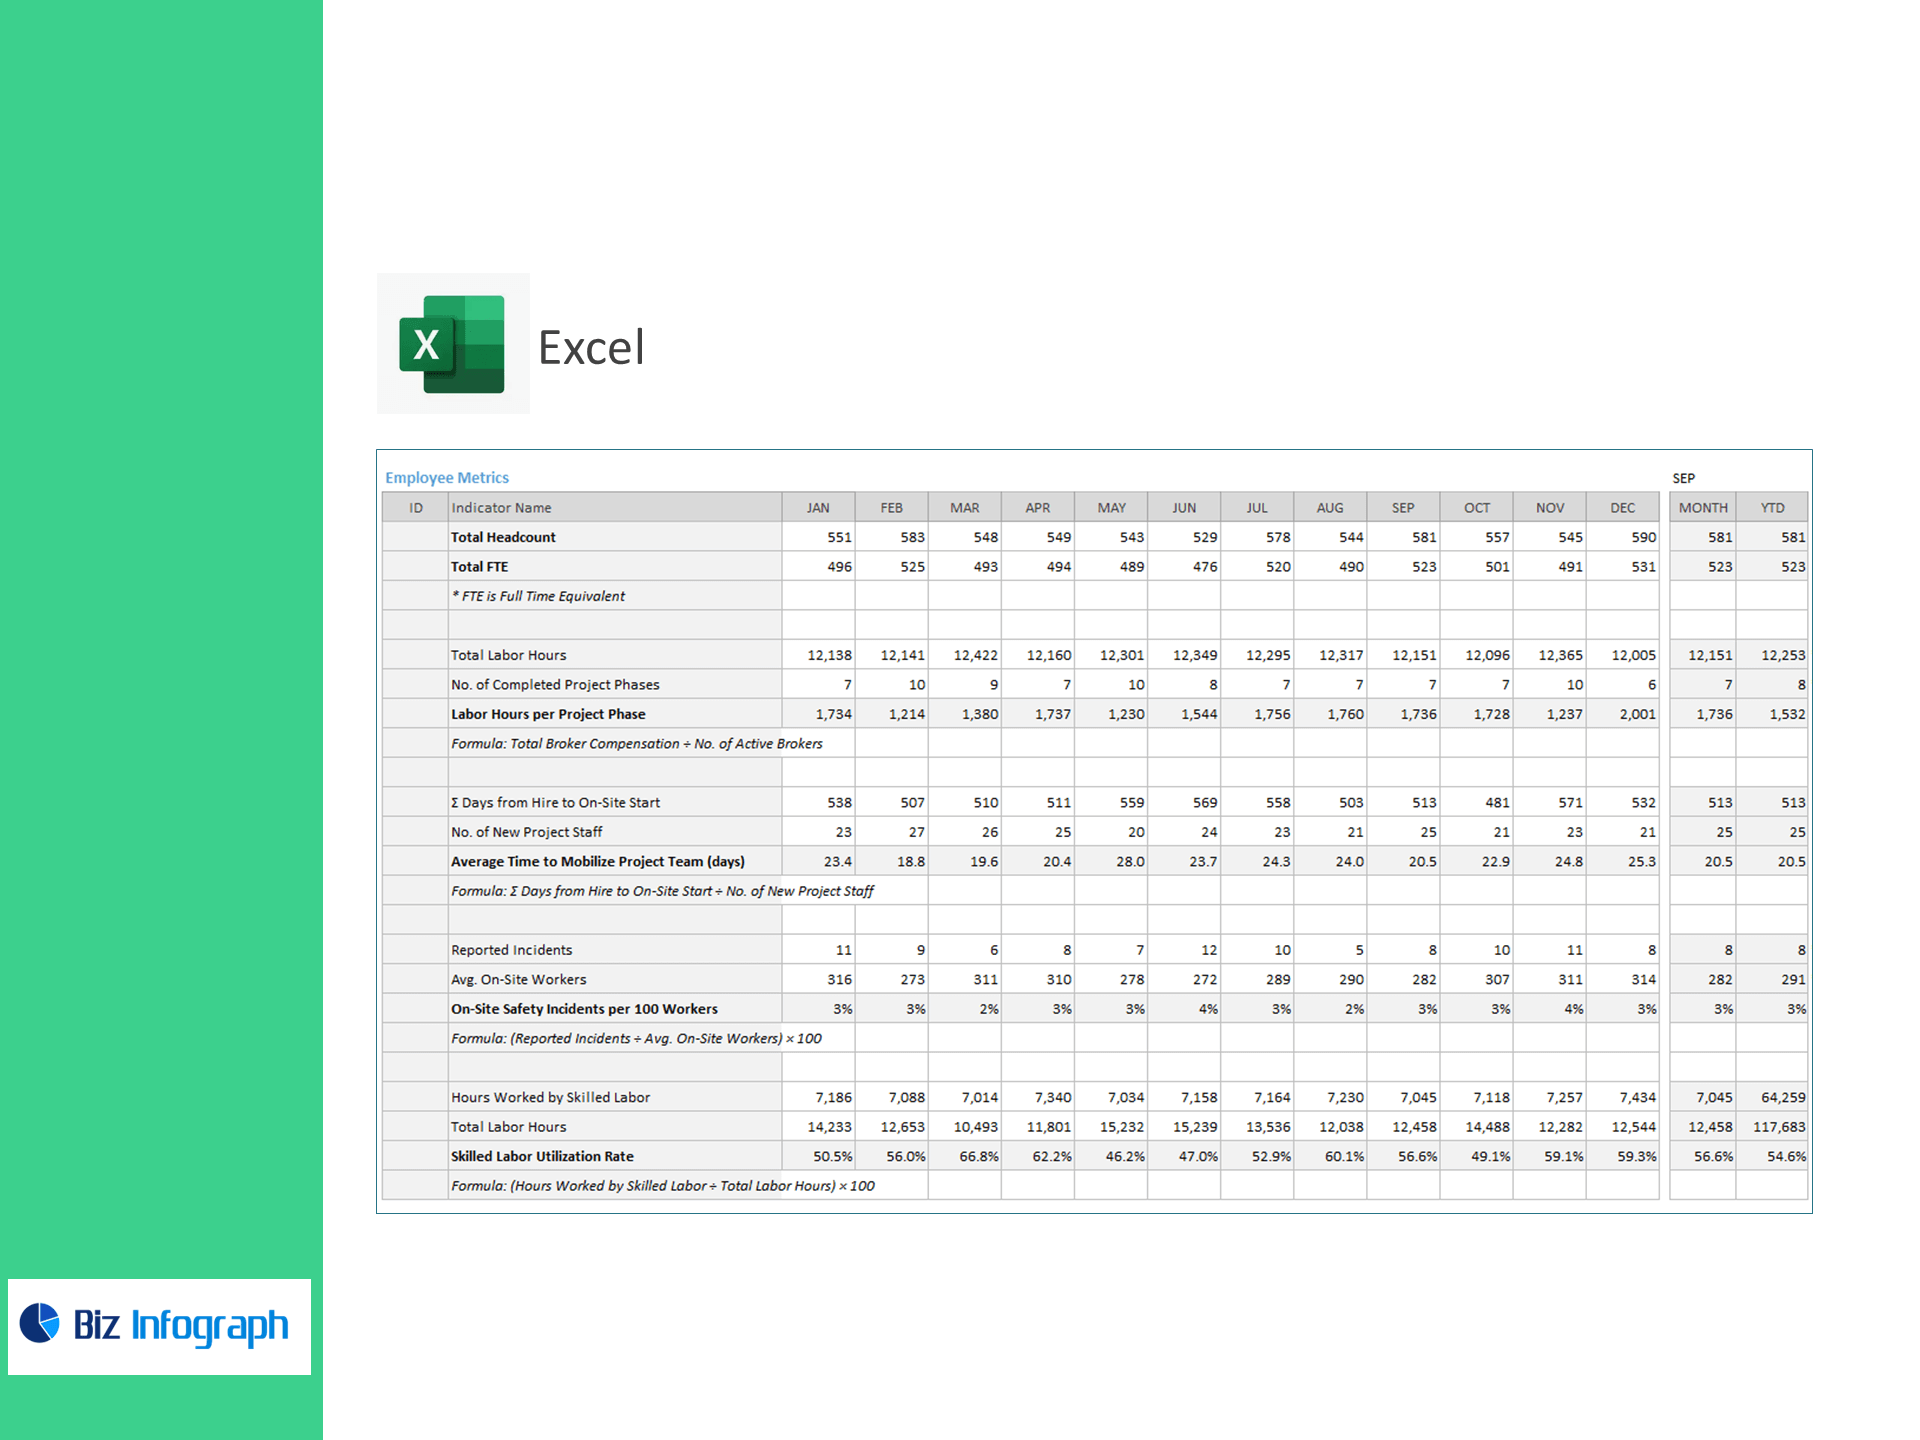
What it tracks (prebuilt KPIs & formulas)
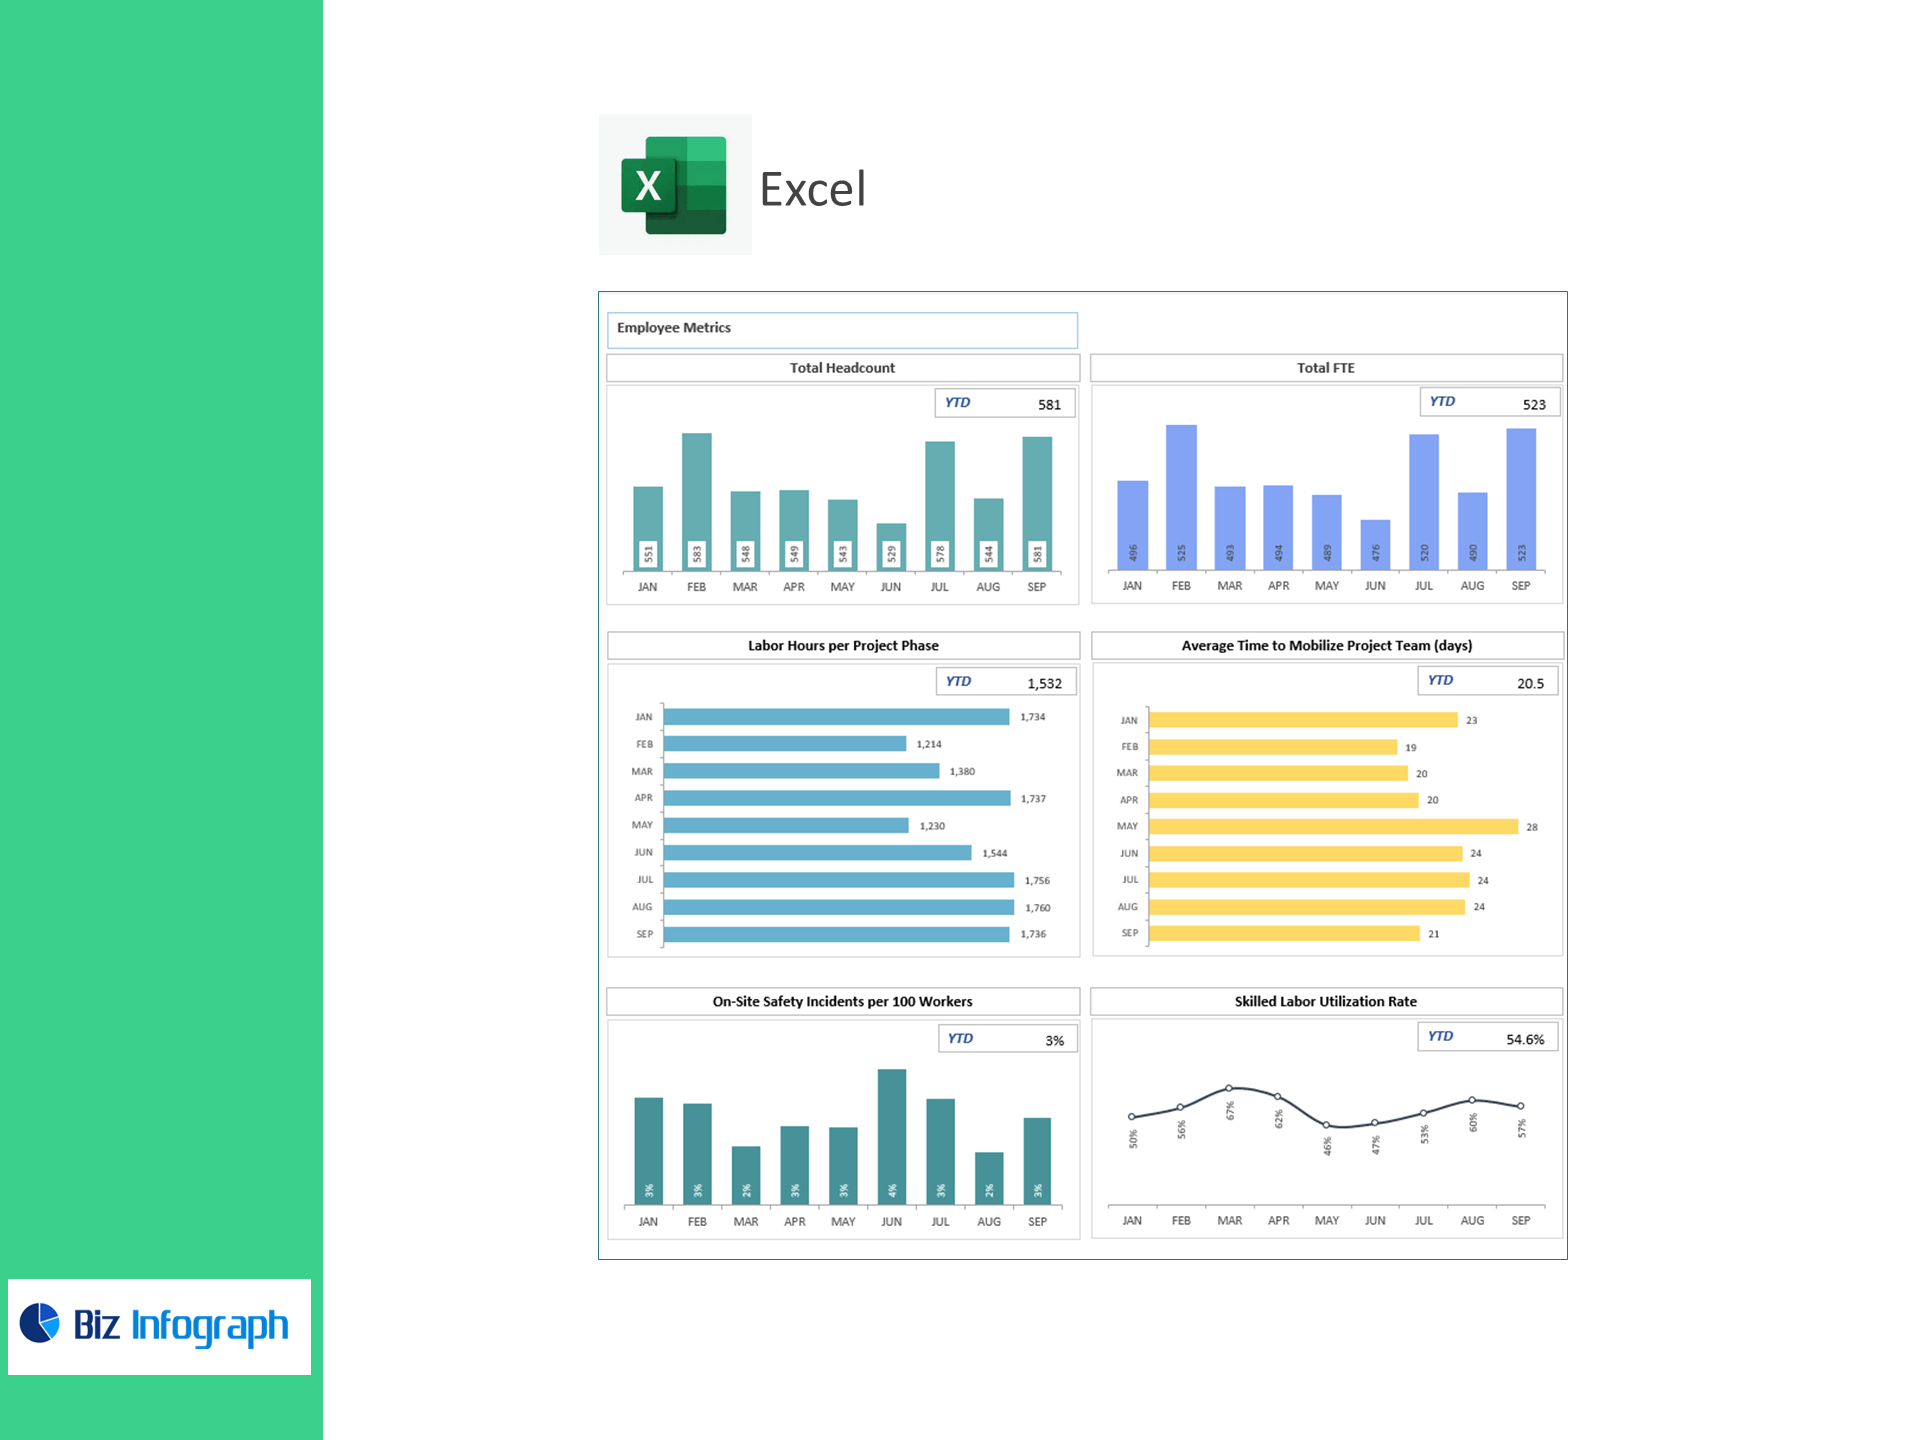
Workforce Sizing & Mobilization
-
Total Headcount, Total FTE
-
Labor Hours per Project Phase = Total Labor Hours ÷ Completed Phases
-
Average Time to Mobilize (days) = Σ(Hire→On-Site) ÷ New Project Staff
Safety & Utilization
-
On-Site Safety Incidents per 100 Workers = Incidents ÷ Avg On-Site Workers × 100
-
Skilled Labor Utilization Rate (%) = Skilled Labor Hours ÷ Total Labor Hours × 100
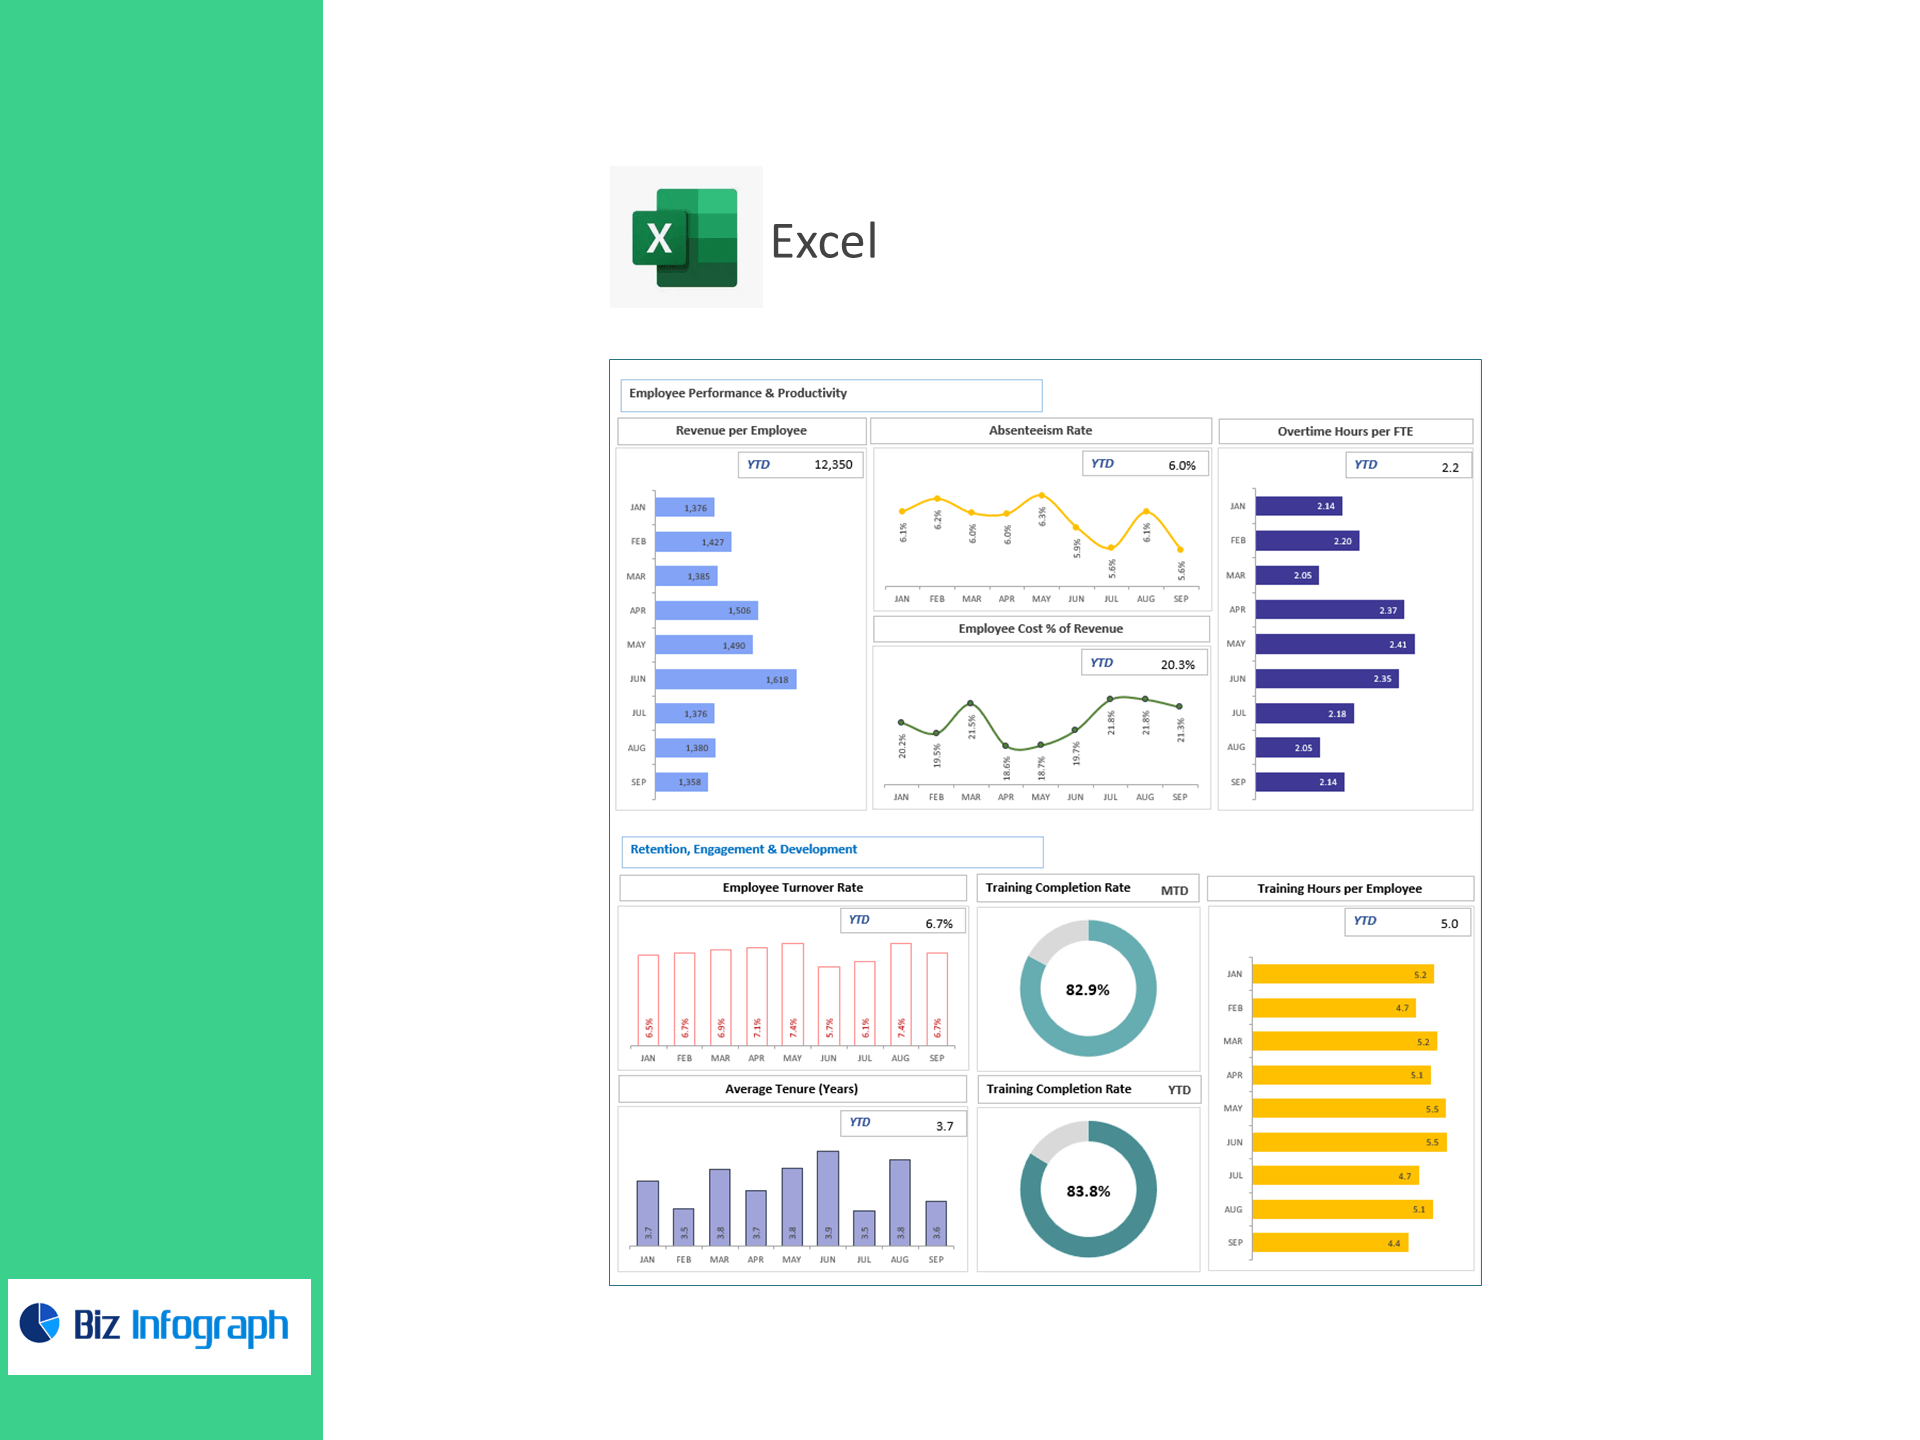
Performance & Cost
-
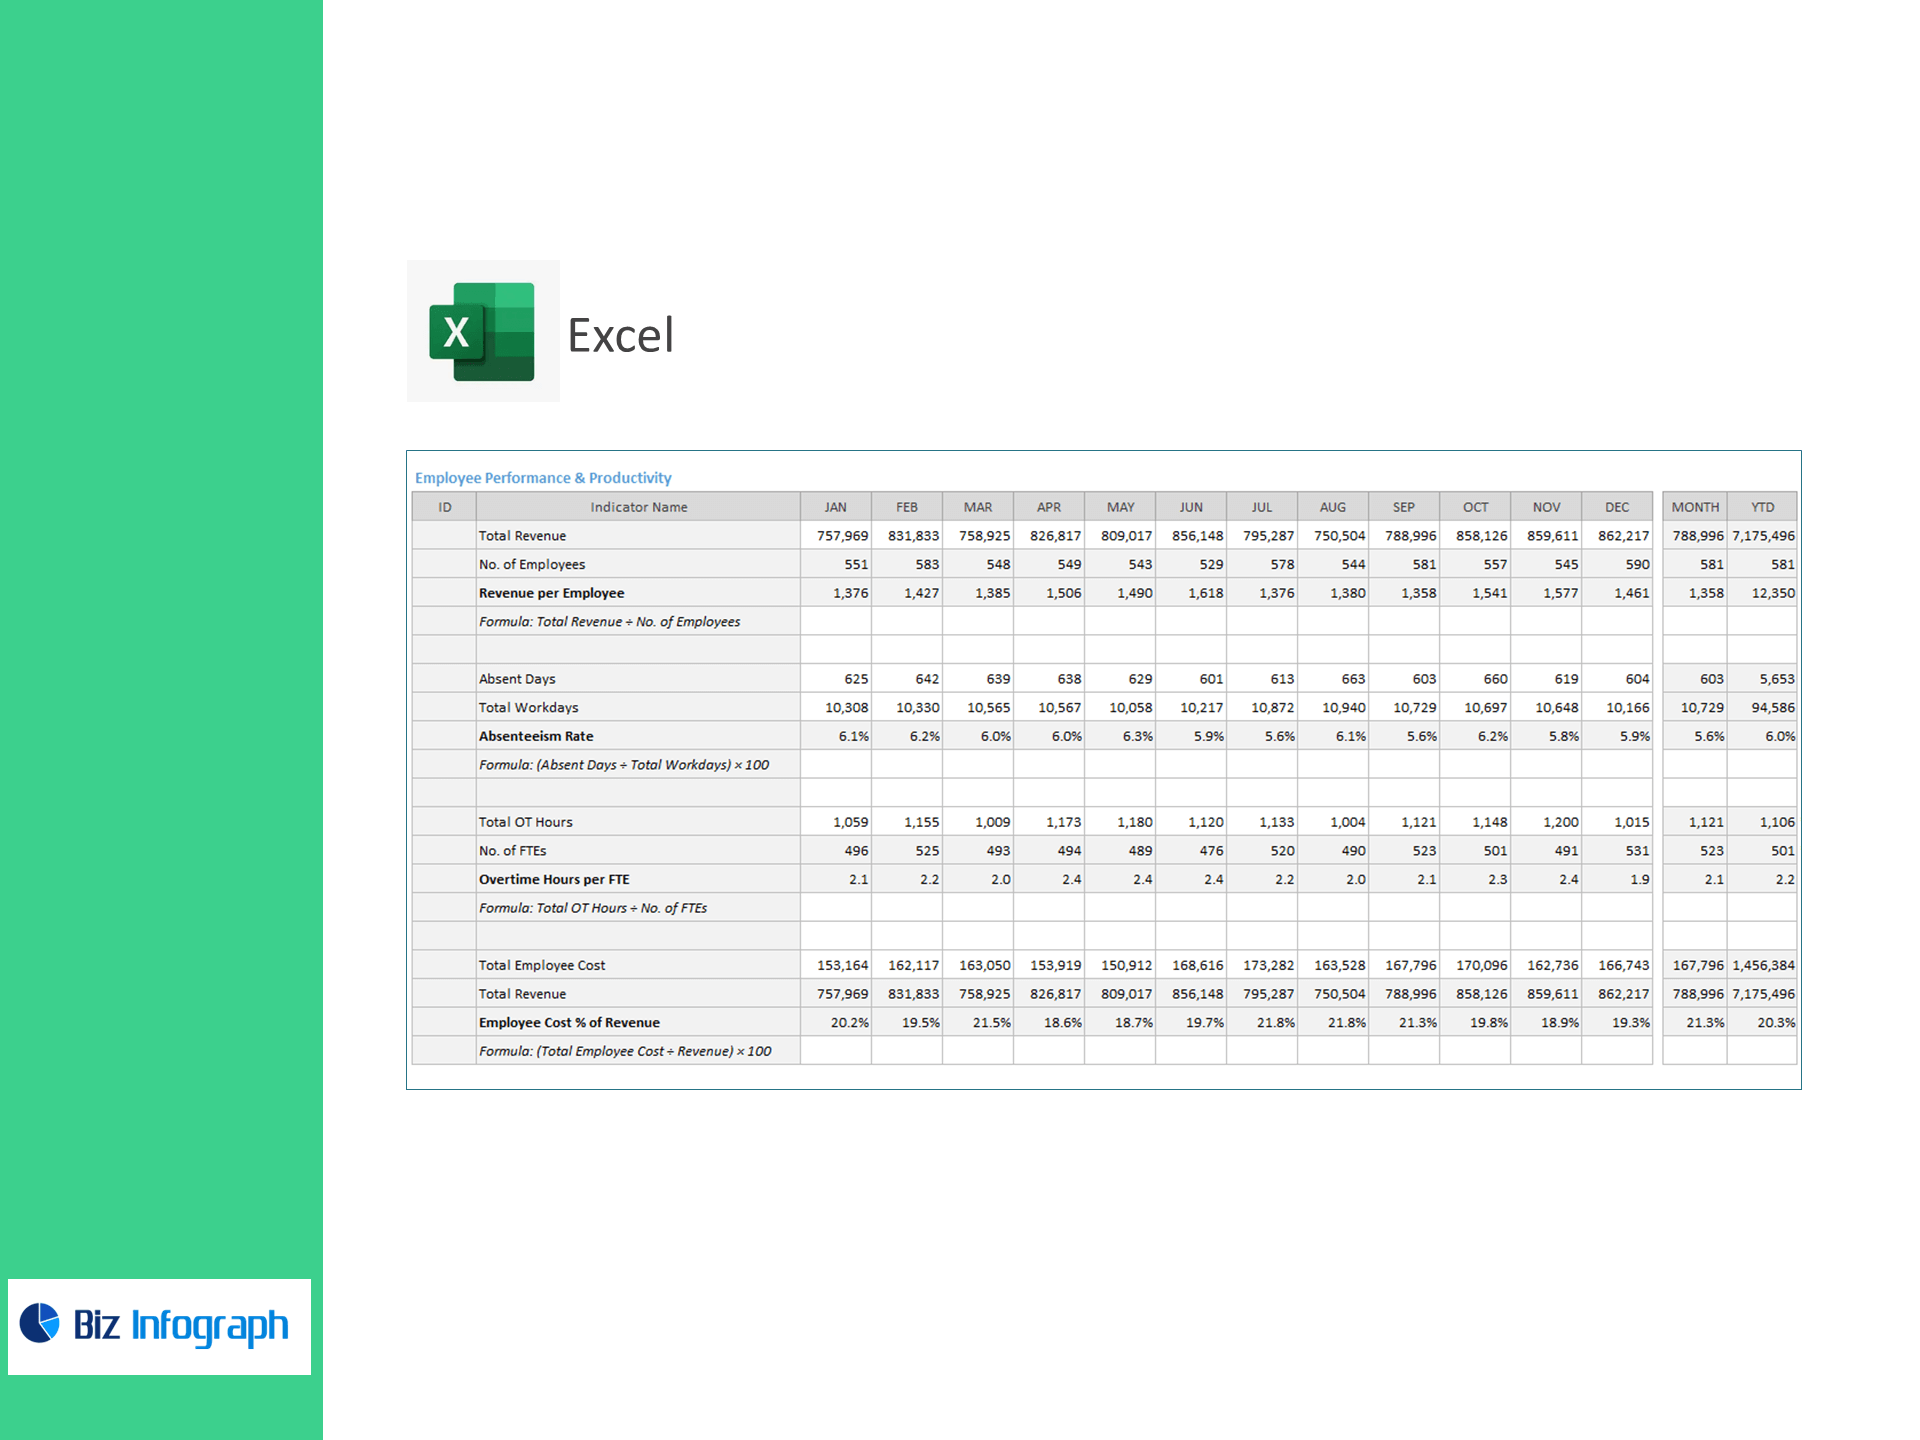
Revenue per Employee = Revenue ÷ Employees
-
Absenteeism Rate (%) = Absent Days ÷ Workdays × 100
-
Overtime Hours per FTE = Total OT Hours ÷ FTEs
-
Employee Cost % of Revenue = Total Employee Cost ÷ Revenue × 100
Retention & Capability
-
Employee Turnover Rate (%) = Exits ÷ Avg Headcount × 100
-
Average Tenure (Years) = Σ Tenure ÷ Employees
-
Training Completion Rate (%) = Completed ÷ Assigned Trainings × 100
-
Training Hours per Employee = Total Training Hours ÷ Employees
Why construction teams choose it
-
Field-ready insights: Monitor mobilization speed, site safety, and craft utilization by job or phase.
-
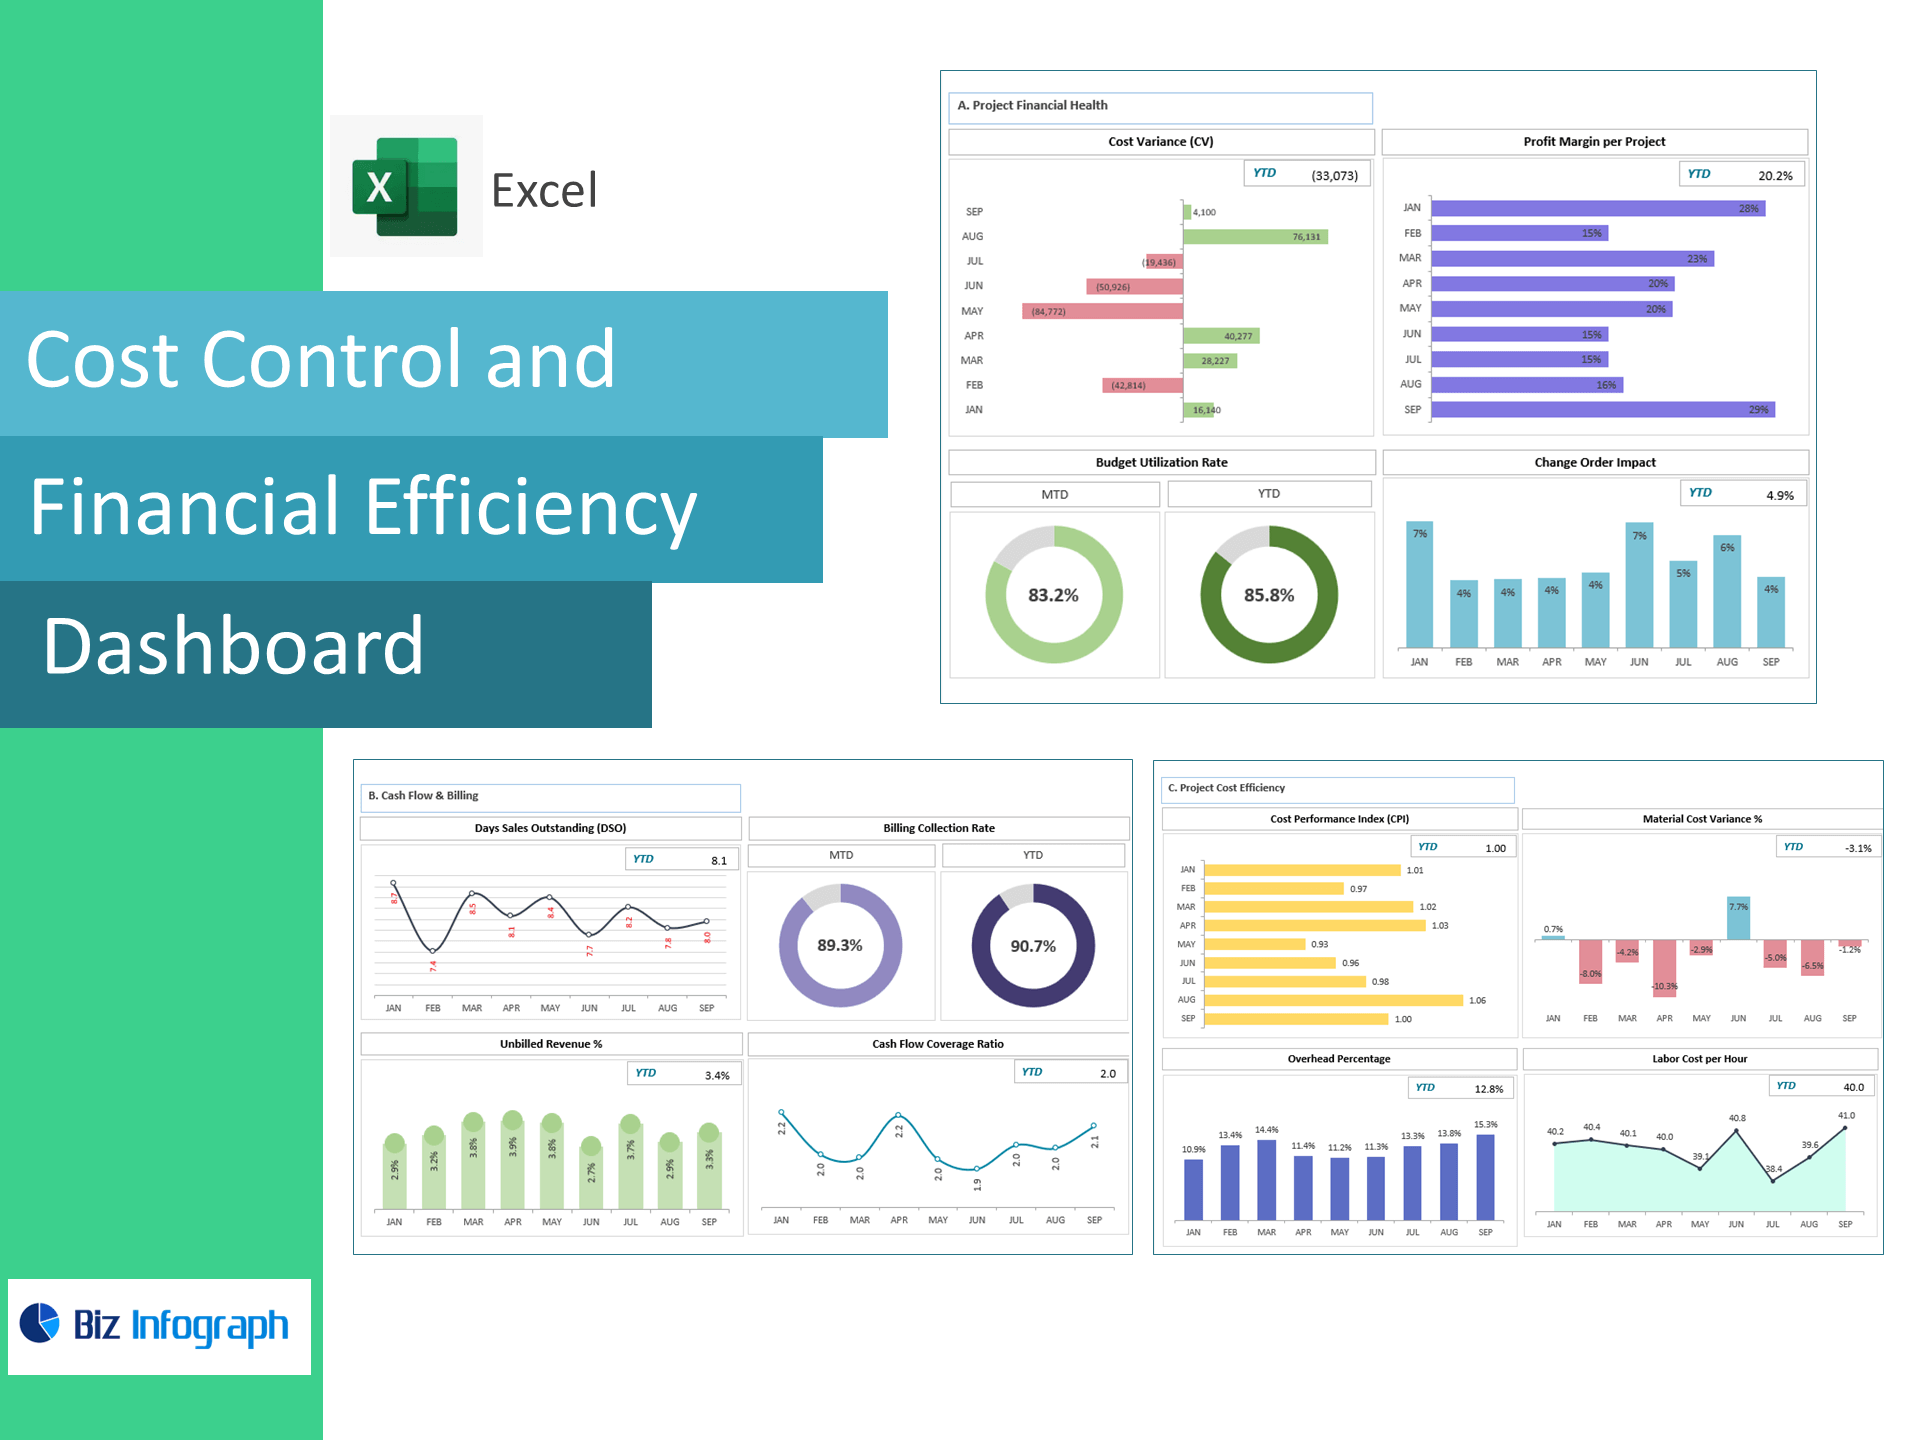
Cost control built-in: Track OT, absenteeism, and labor share of revenue to protect margins.
-
Excel-native: Paste CSVs from payroll, HCM, or timekeeping—no add-ins or coding.
What’s inside
-
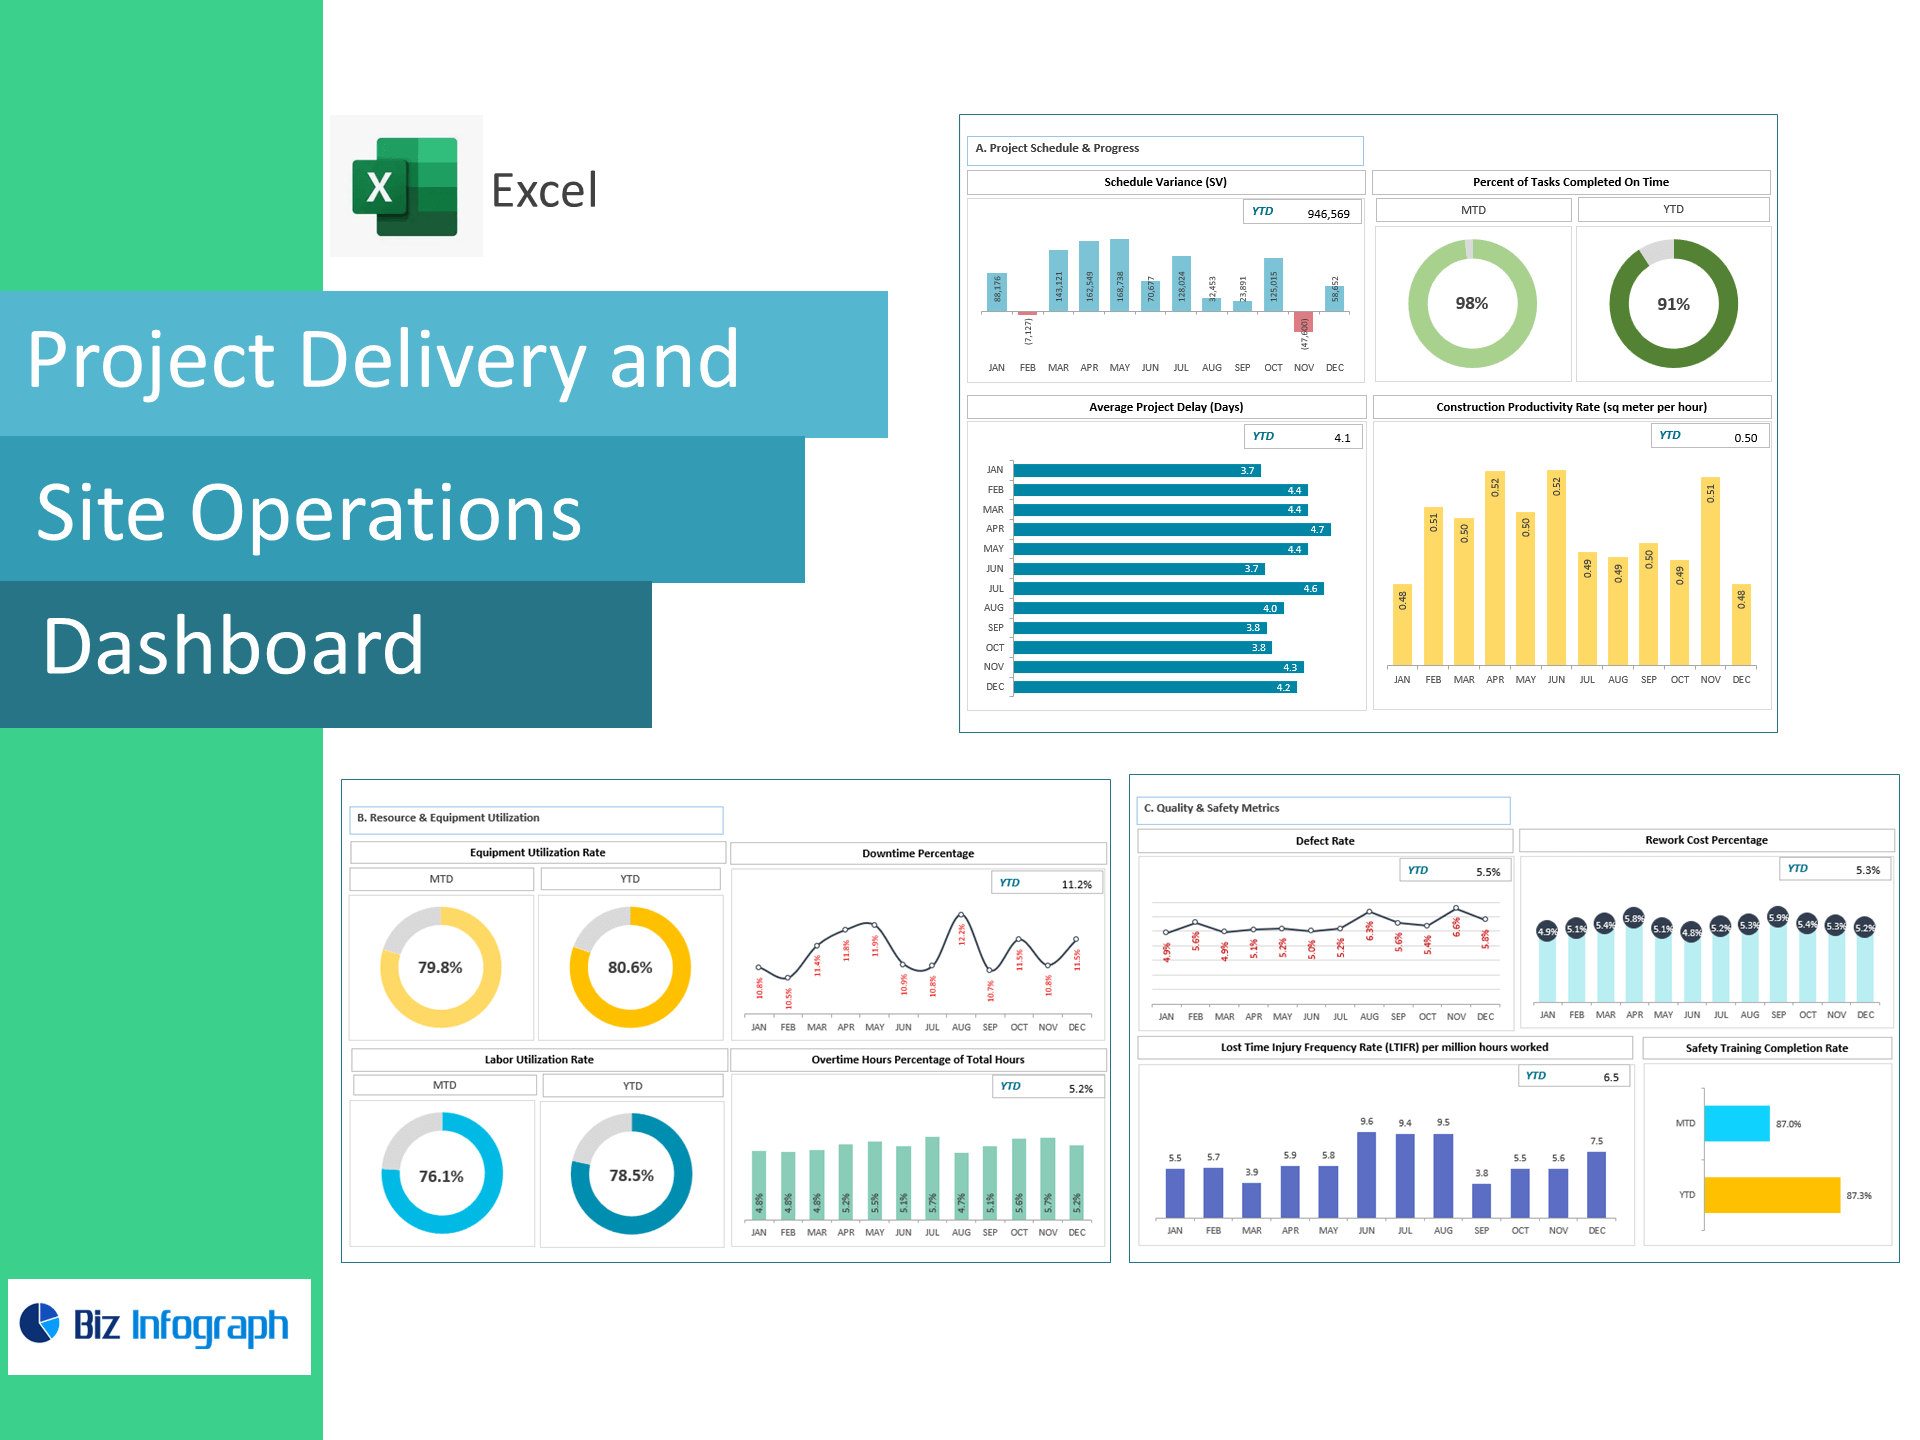
Executive HR Dashboard: Workforce, safety, cost, and retention tiles with trend lines and Above/Below Target flags.
-
Project & Phase View: Compare labor hours, mobilization time, and utilization across jobs.
-
Training & Compliance Panel: Completion status and hours by role or crew.
-
Clean Data Tables: Ready for headcount, hours, incidents, OT, exits, and training records.
-
Quick-Start Guide + sample data.
For ready-to-use Dashboard Templates: