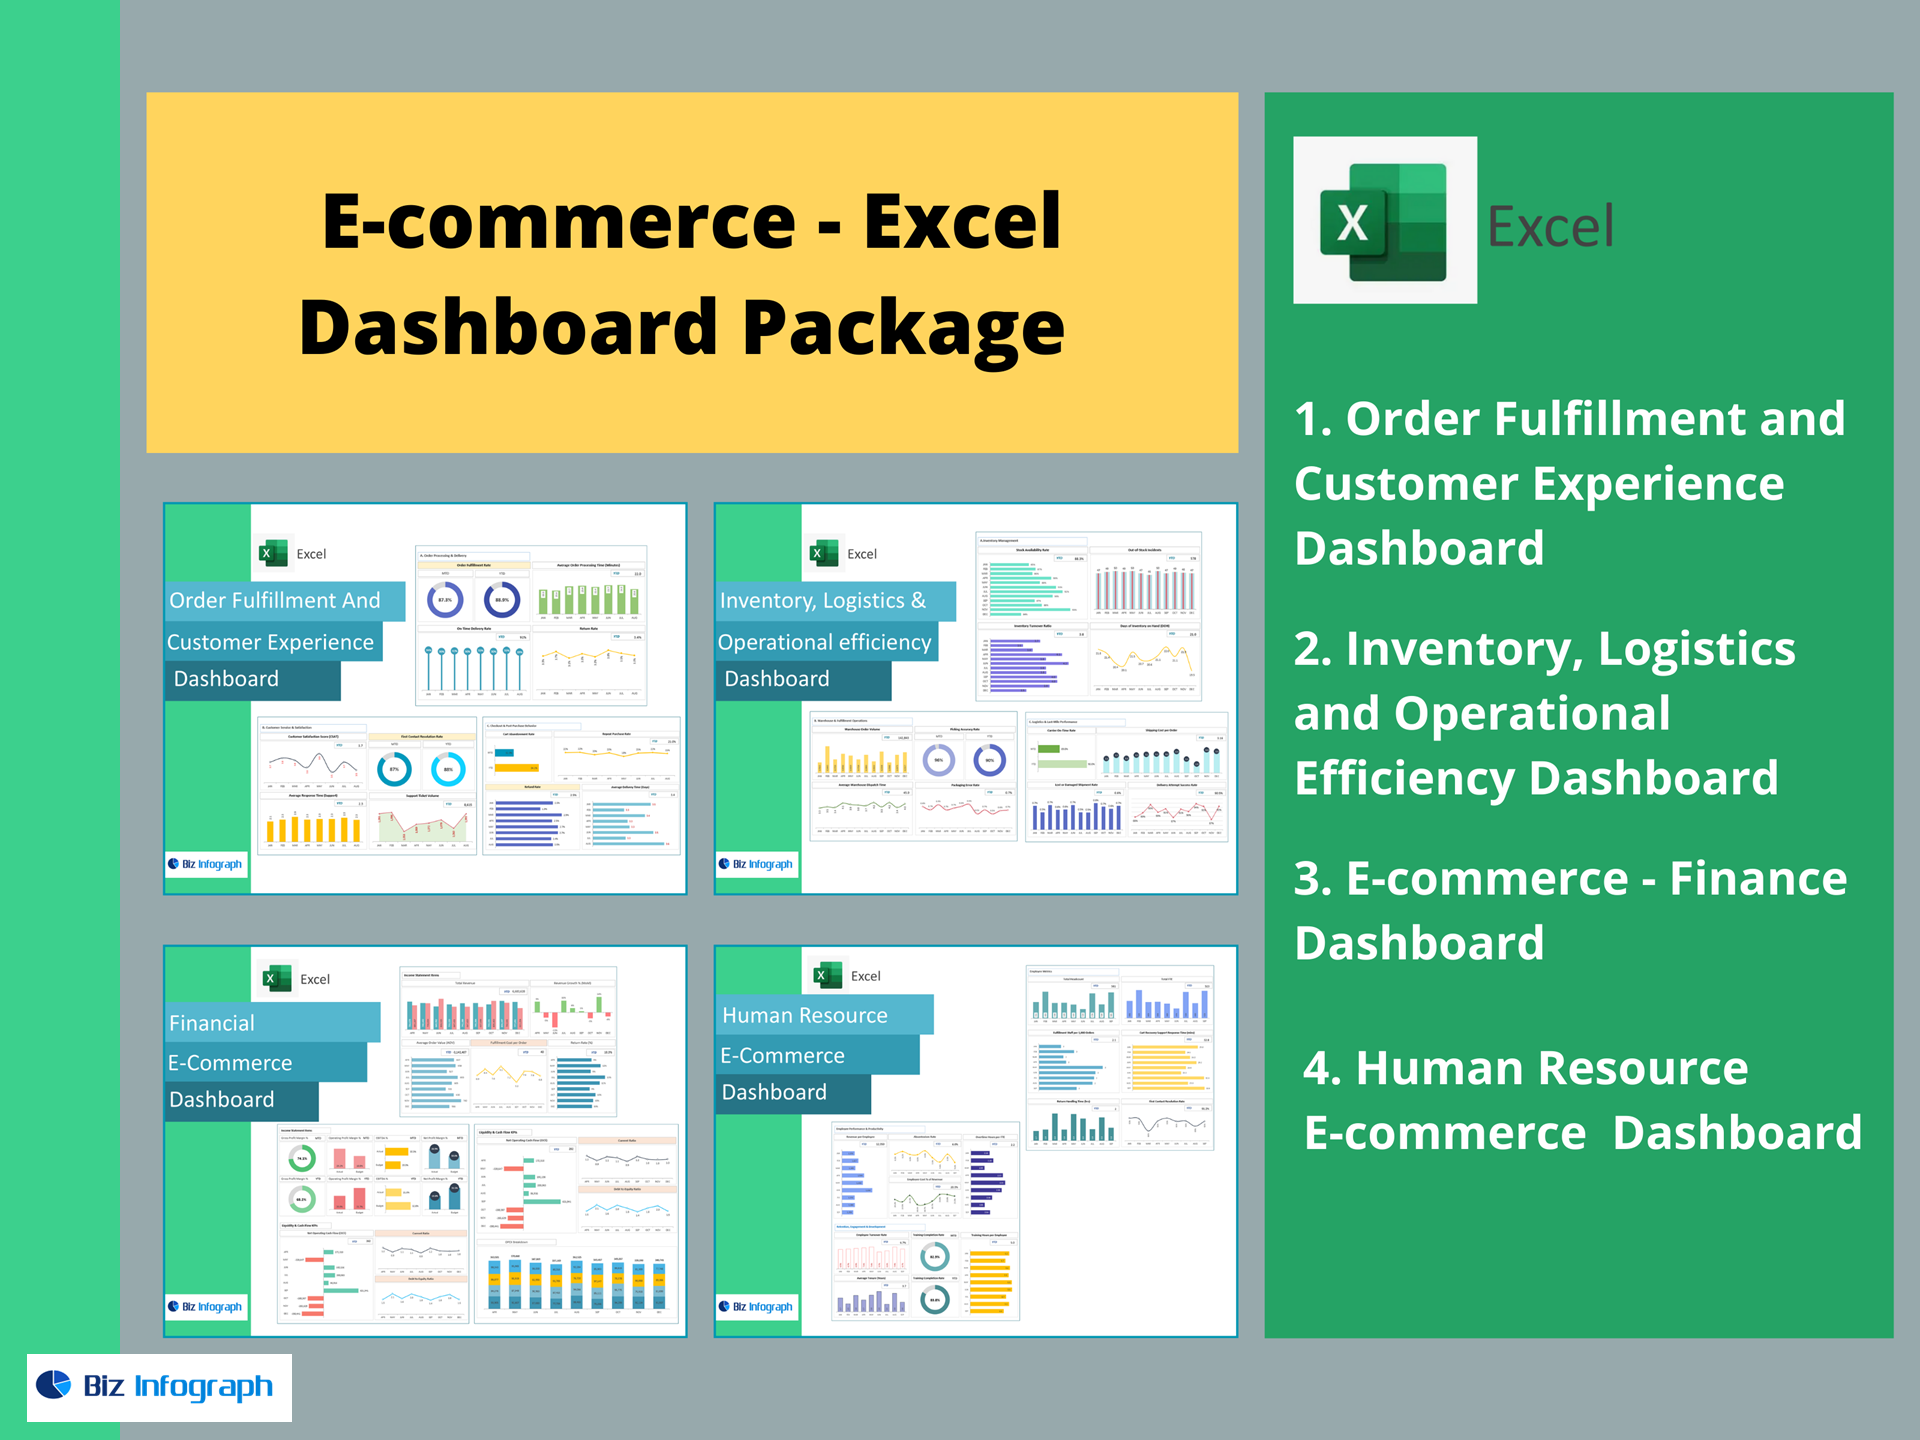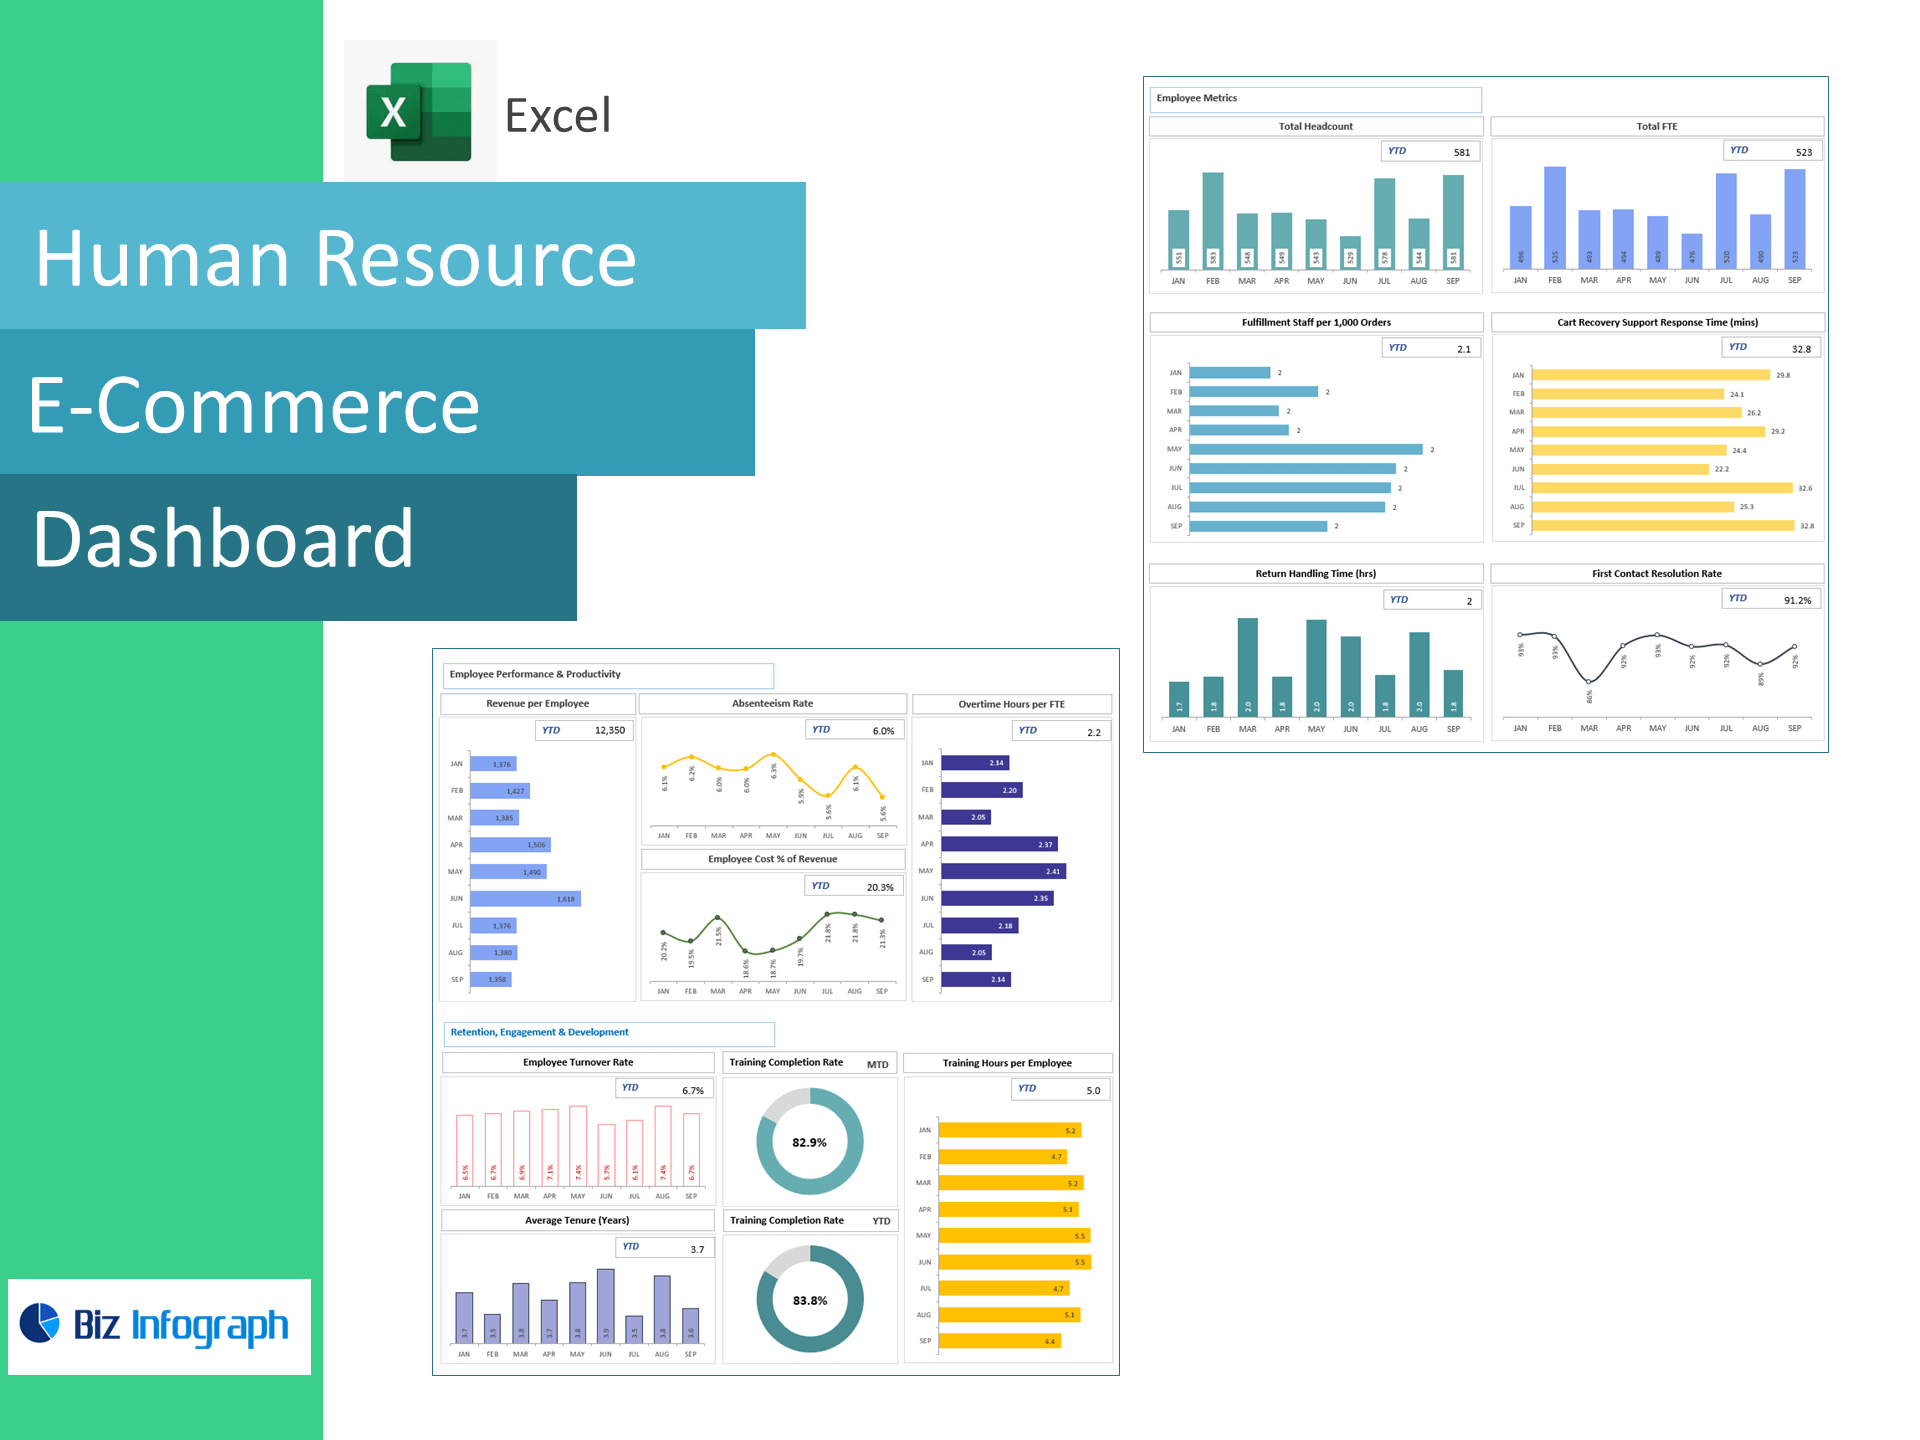
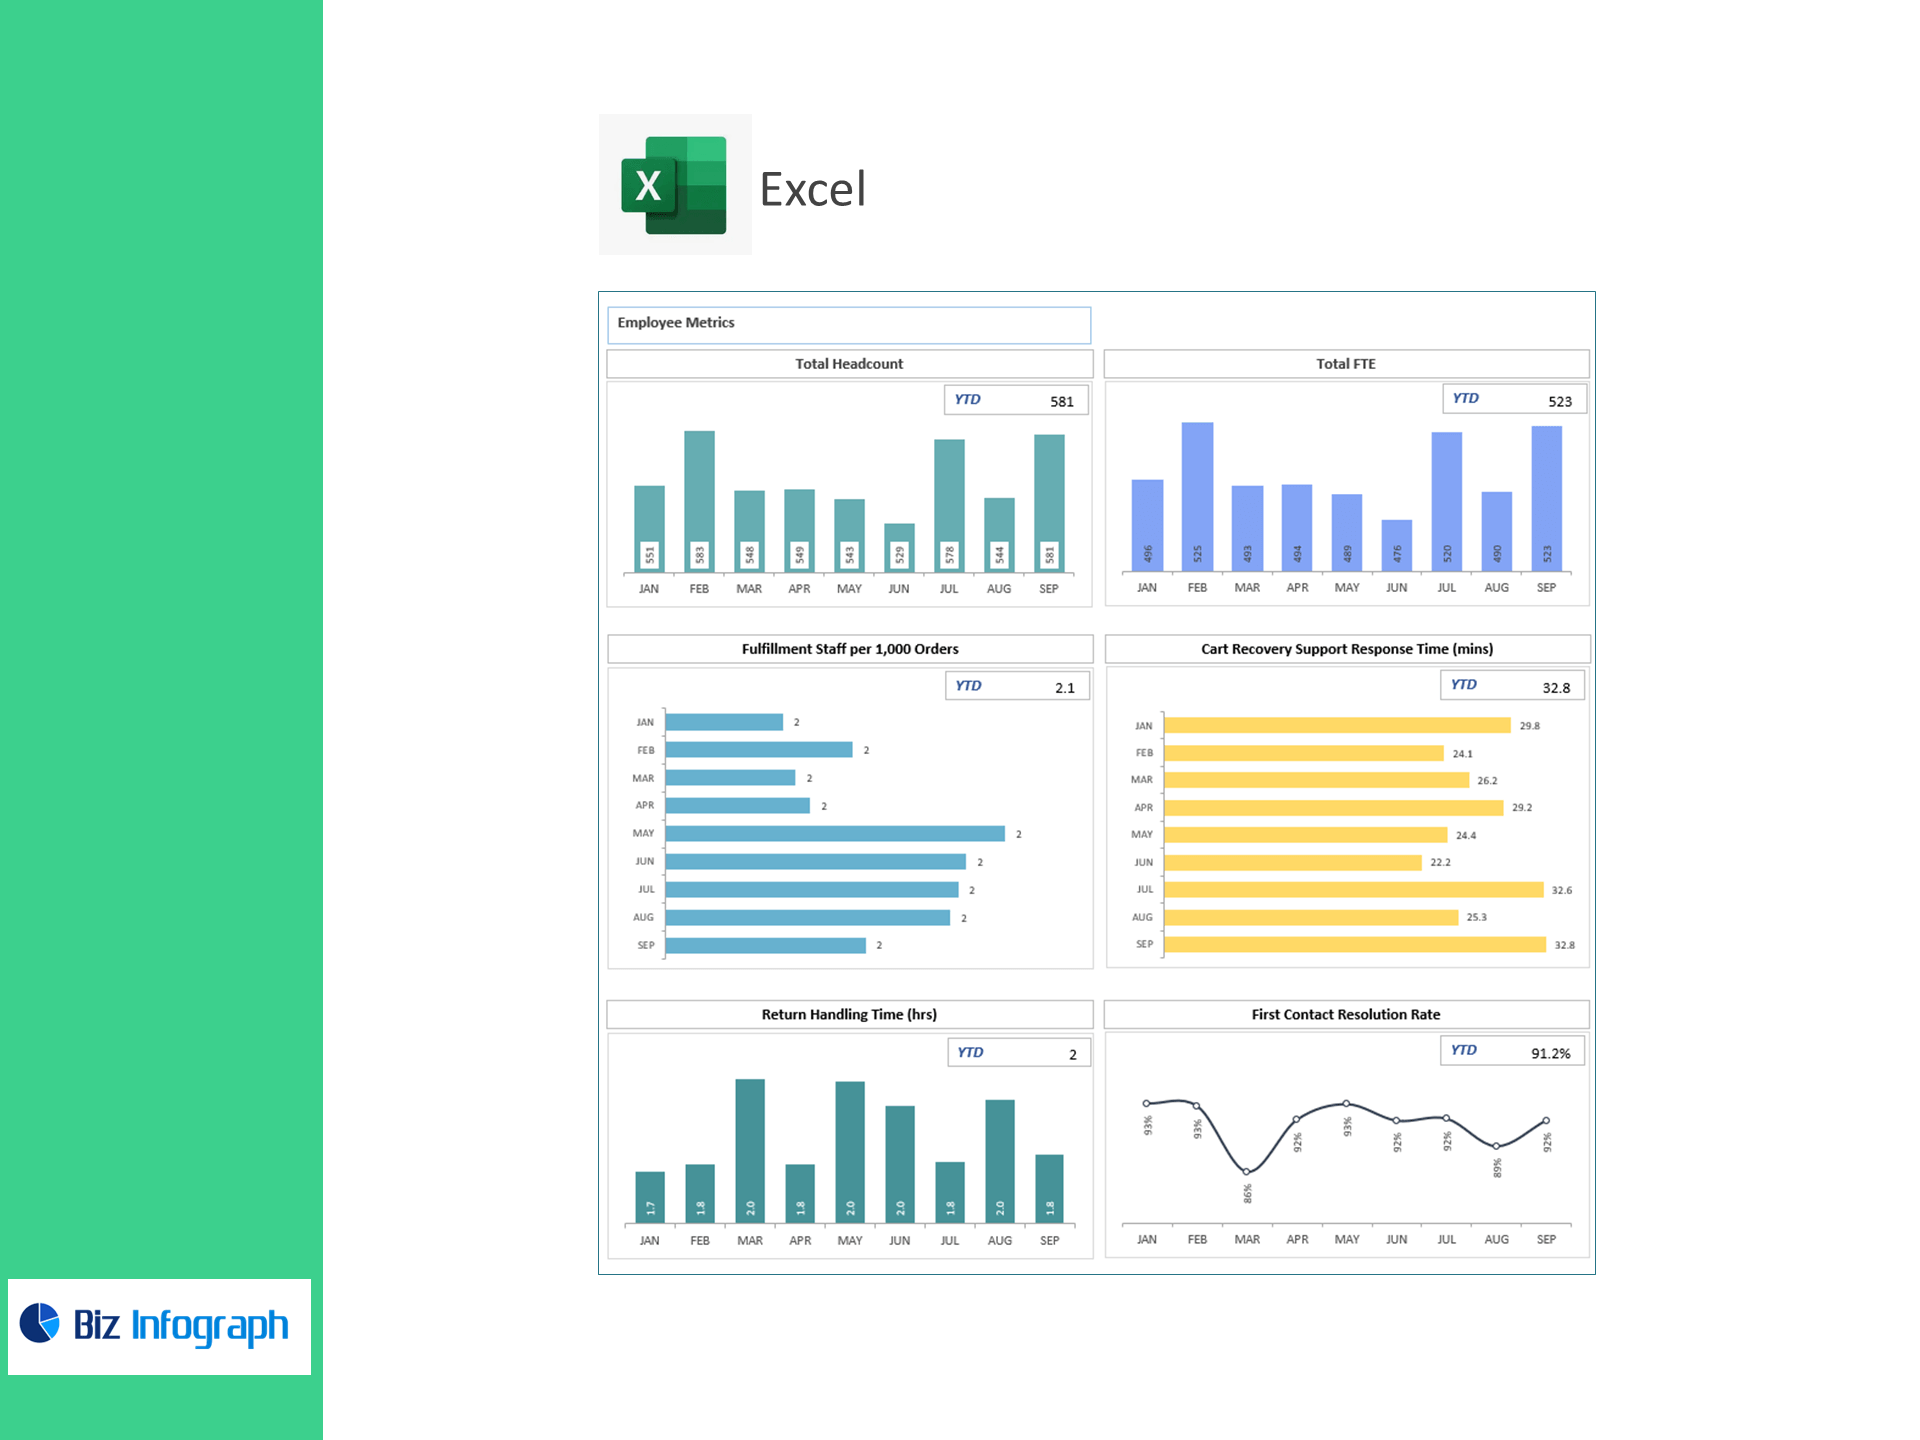
HR E-Commerce Dashboard — Excel Template
Right-size staffing, speed support, and cut labor waste—directly in Excel. Designed for online retailers and 3PL-backed stores, this template turns HR, WFM, and CX data into a live dashboard tracking Fulfillment Staff per 1,000 Orders, Cart-Recovery Response Time, Return Handling Time, First Contact Resolution Rate, Revenue per Employee, Absenteeism, Overtime Hours per FTE, Employee Cost % of Revenue, Turnover, Average Tenure, Training Completion Rate, and Training Hours per Employee—so you can scale orders without ballooning costs.
Why e-commerce teams choose this template
-
Ops + HR in one view: See how staffing levels affect returns processing and customer recovery.
-
Lower labor cost per order: Monitor OT/FTE, absenteeism, and employee cost % of revenue.
-
Improve CX & conversion: Reduce cart-recovery response time and raise FCR.
-
Excel-native: Paste your data—no add-ins or BI setup required.
KPIs included (with ready-made formulas)
Capacity & Coverage
-
Total Headcount, Total FTE
-
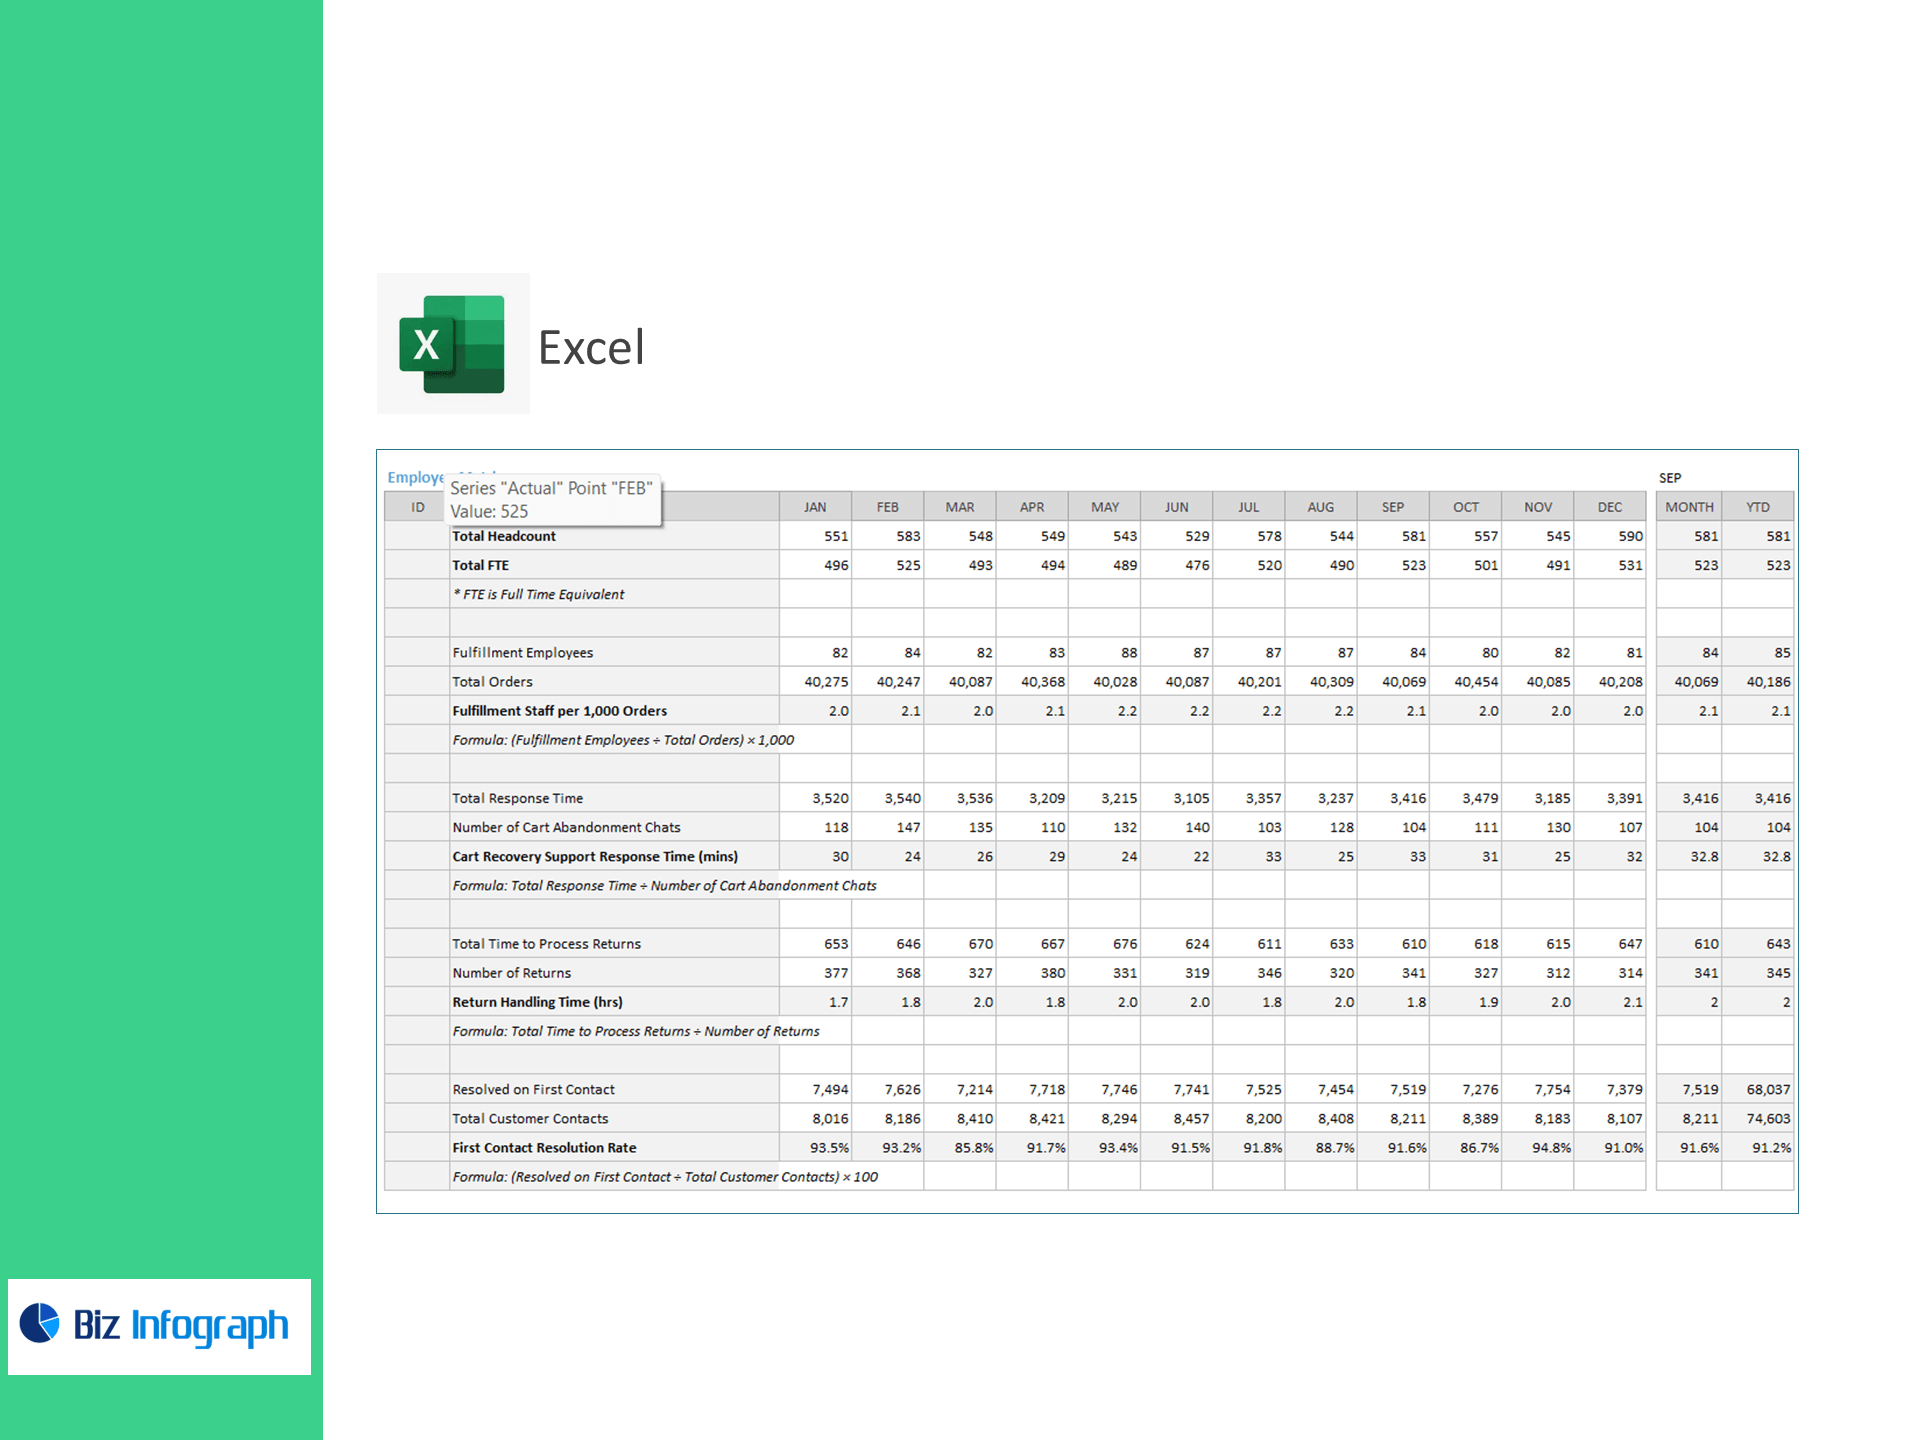
Fulfillment Staff per 1,000 Orders = (Fulfillment Employees ÷ Total Orders) × 1,000
Support & Returns
-
Cart-Recovery Support Response Time (mins) = Total Response Time ÷ Cart-Abandonment Chats
-
Return Handling Time (hrs) = Total Time to Process Returns ÷ Number of Returns
-
First Contact Resolution Rate (%) = Resolved on First Contact ÷ Total Customer Contacts × 100
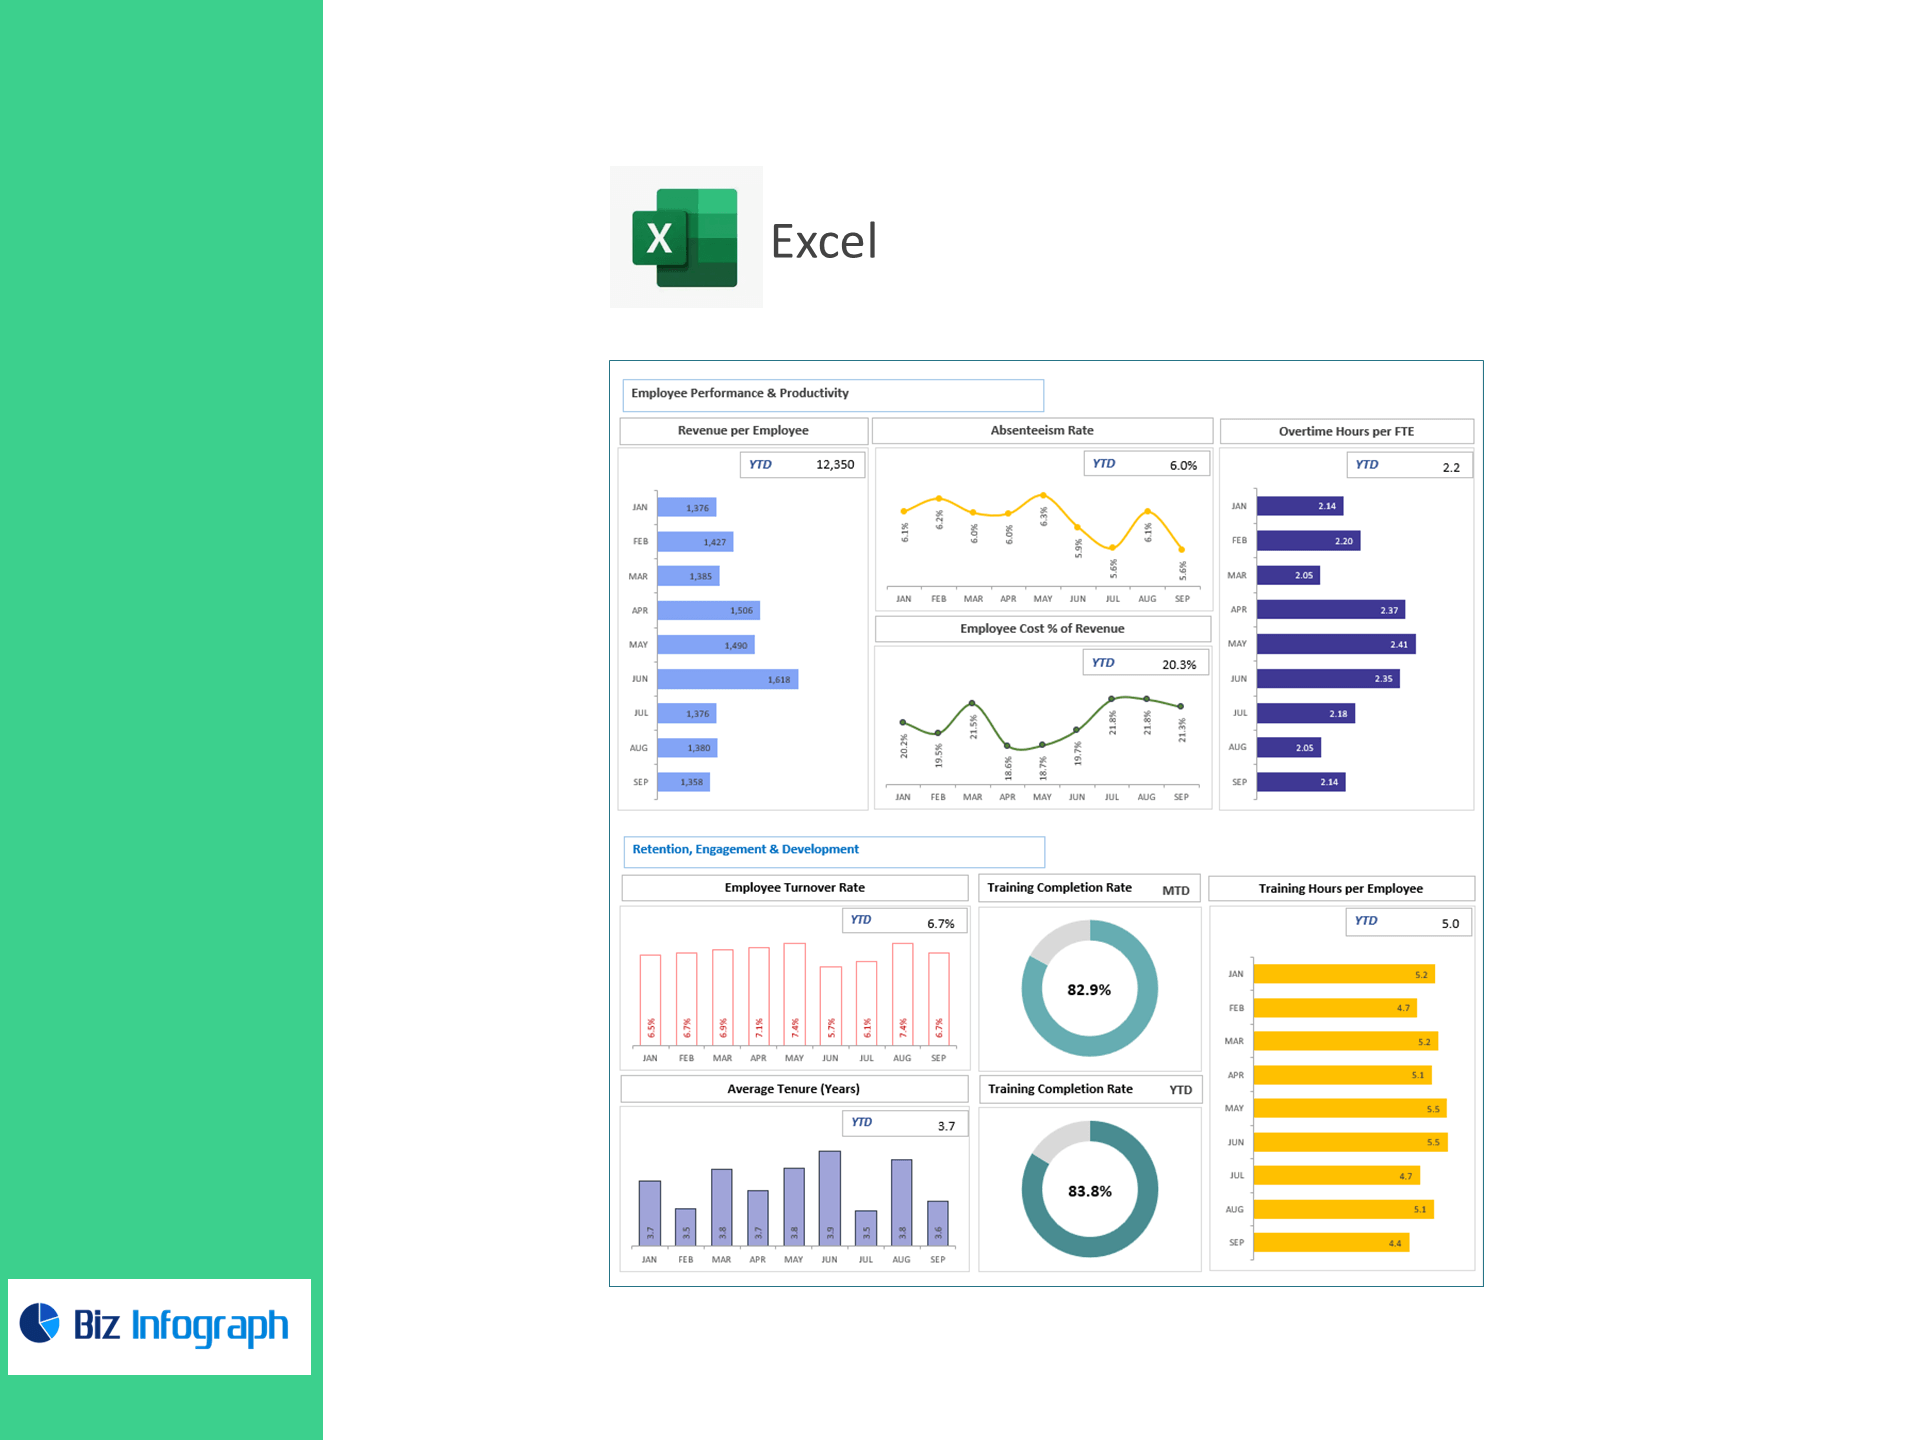
Productivity & Cost
-
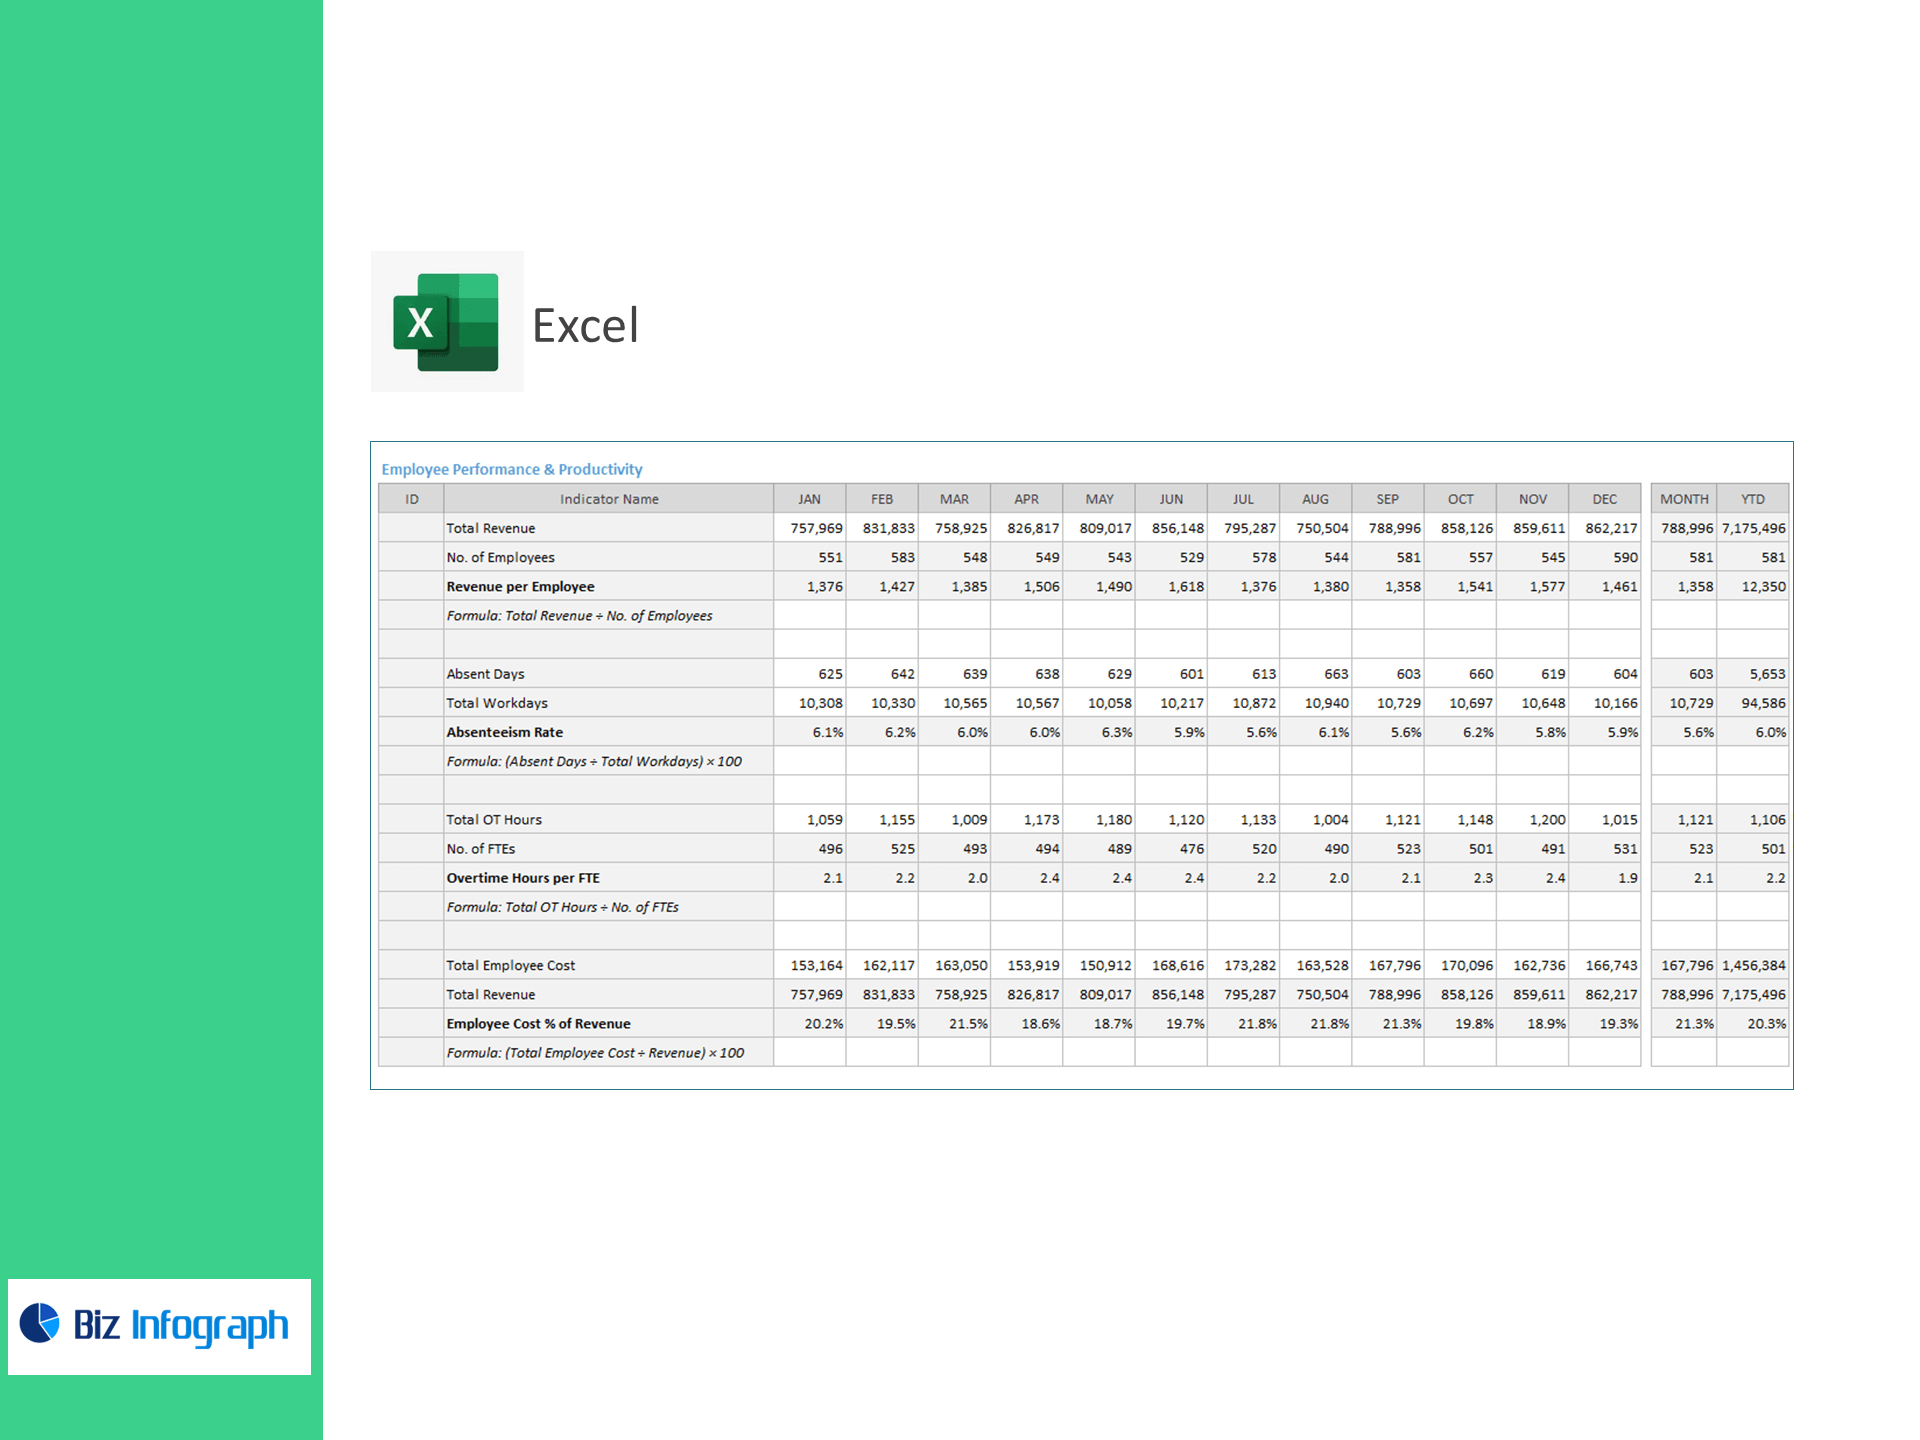
Revenue per Employee = Total Revenue ÷ Employees
-
Absenteeism Rate (%) = Absent Days ÷ Workdays × 100
-
Overtime Hours per FTE = Total OT Hours ÷ FTEs
-
Employee Cost % of Revenue = Total Employee Cost ÷ Revenue × 100
Retention & Development
-
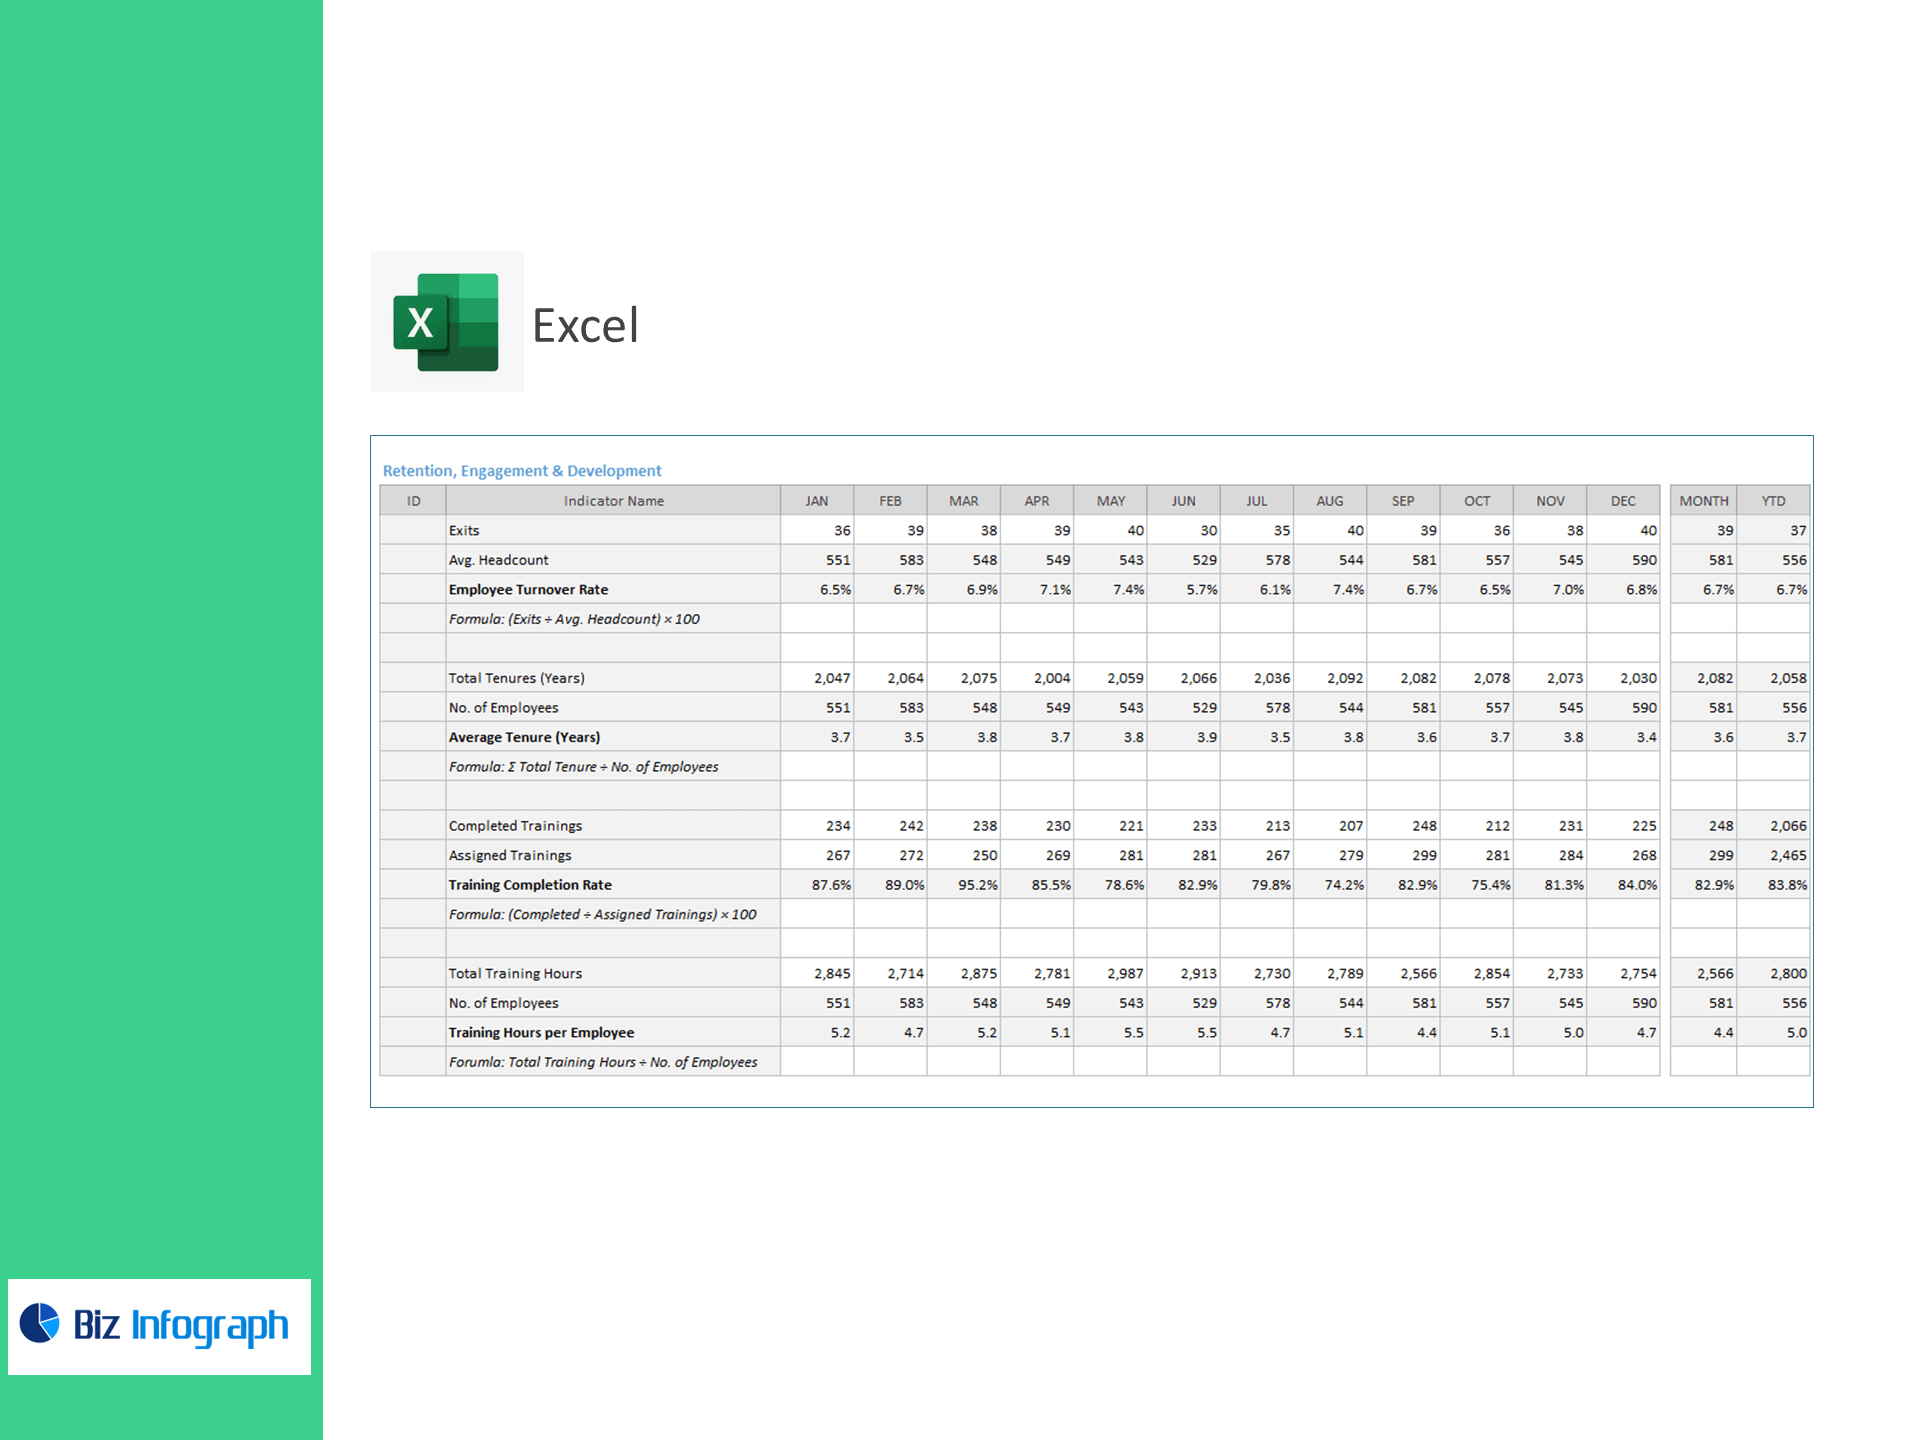
Employee Turnover Rate (%) = Exits ÷ Avg. Headcount × 100
-
Average Tenure (Years) = Σ Total Tenure ÷ Employees
-
Training Completion Rate (%) = Completed ÷ Assigned Trainings × 100
-
Training Hours per Employee = Total Training Hours ÷ Employees
What’s inside
-
Executive Dashboard: Tiles for staffing density, response/handling times, FCR, productivity, cost %, turnover, tenure, and training—with trend & target variance.
-
Fulfillment & Returns View: Spot bottlenecks in picking/packing and reverse logistics.
-
Support Performance Panel: Chat/email metrics and recovery speed by queue or shift.
-
Workforce Health: OT/absence hotspots and tenure/attrition by role or site.
-
Targets & Assumptions: Enter KPI targets; automatic Above/Below Target flags.
-
Clean Data Sheets: Import-ready tables for Headcount/FTE, Orders, Chats, Returns, Hours/OT, Payroll/Cost, and Training.
How it works
-
Paste CSV/Excel exports from HRIS, WFM, helpdesk, and OMS/returns tools.
-
Set reporting periods and KPI targets.
-
Review visuals to balance shifts, accelerate recovery, and lower cost per order.
Benefits
-
Faster recovery & fewer refunds: Shorten response and return handling times to protect revenue.
-
Lean operations: Reduce OT/FTE and employee cost % of revenue.
-
Stronger teams: Track turnover, tenure, and training to retain top performers.
-
Decide faster: Board-ready visuals with transparent, audit-friendly formulas.
For ready-to-use Dashboard Templates: