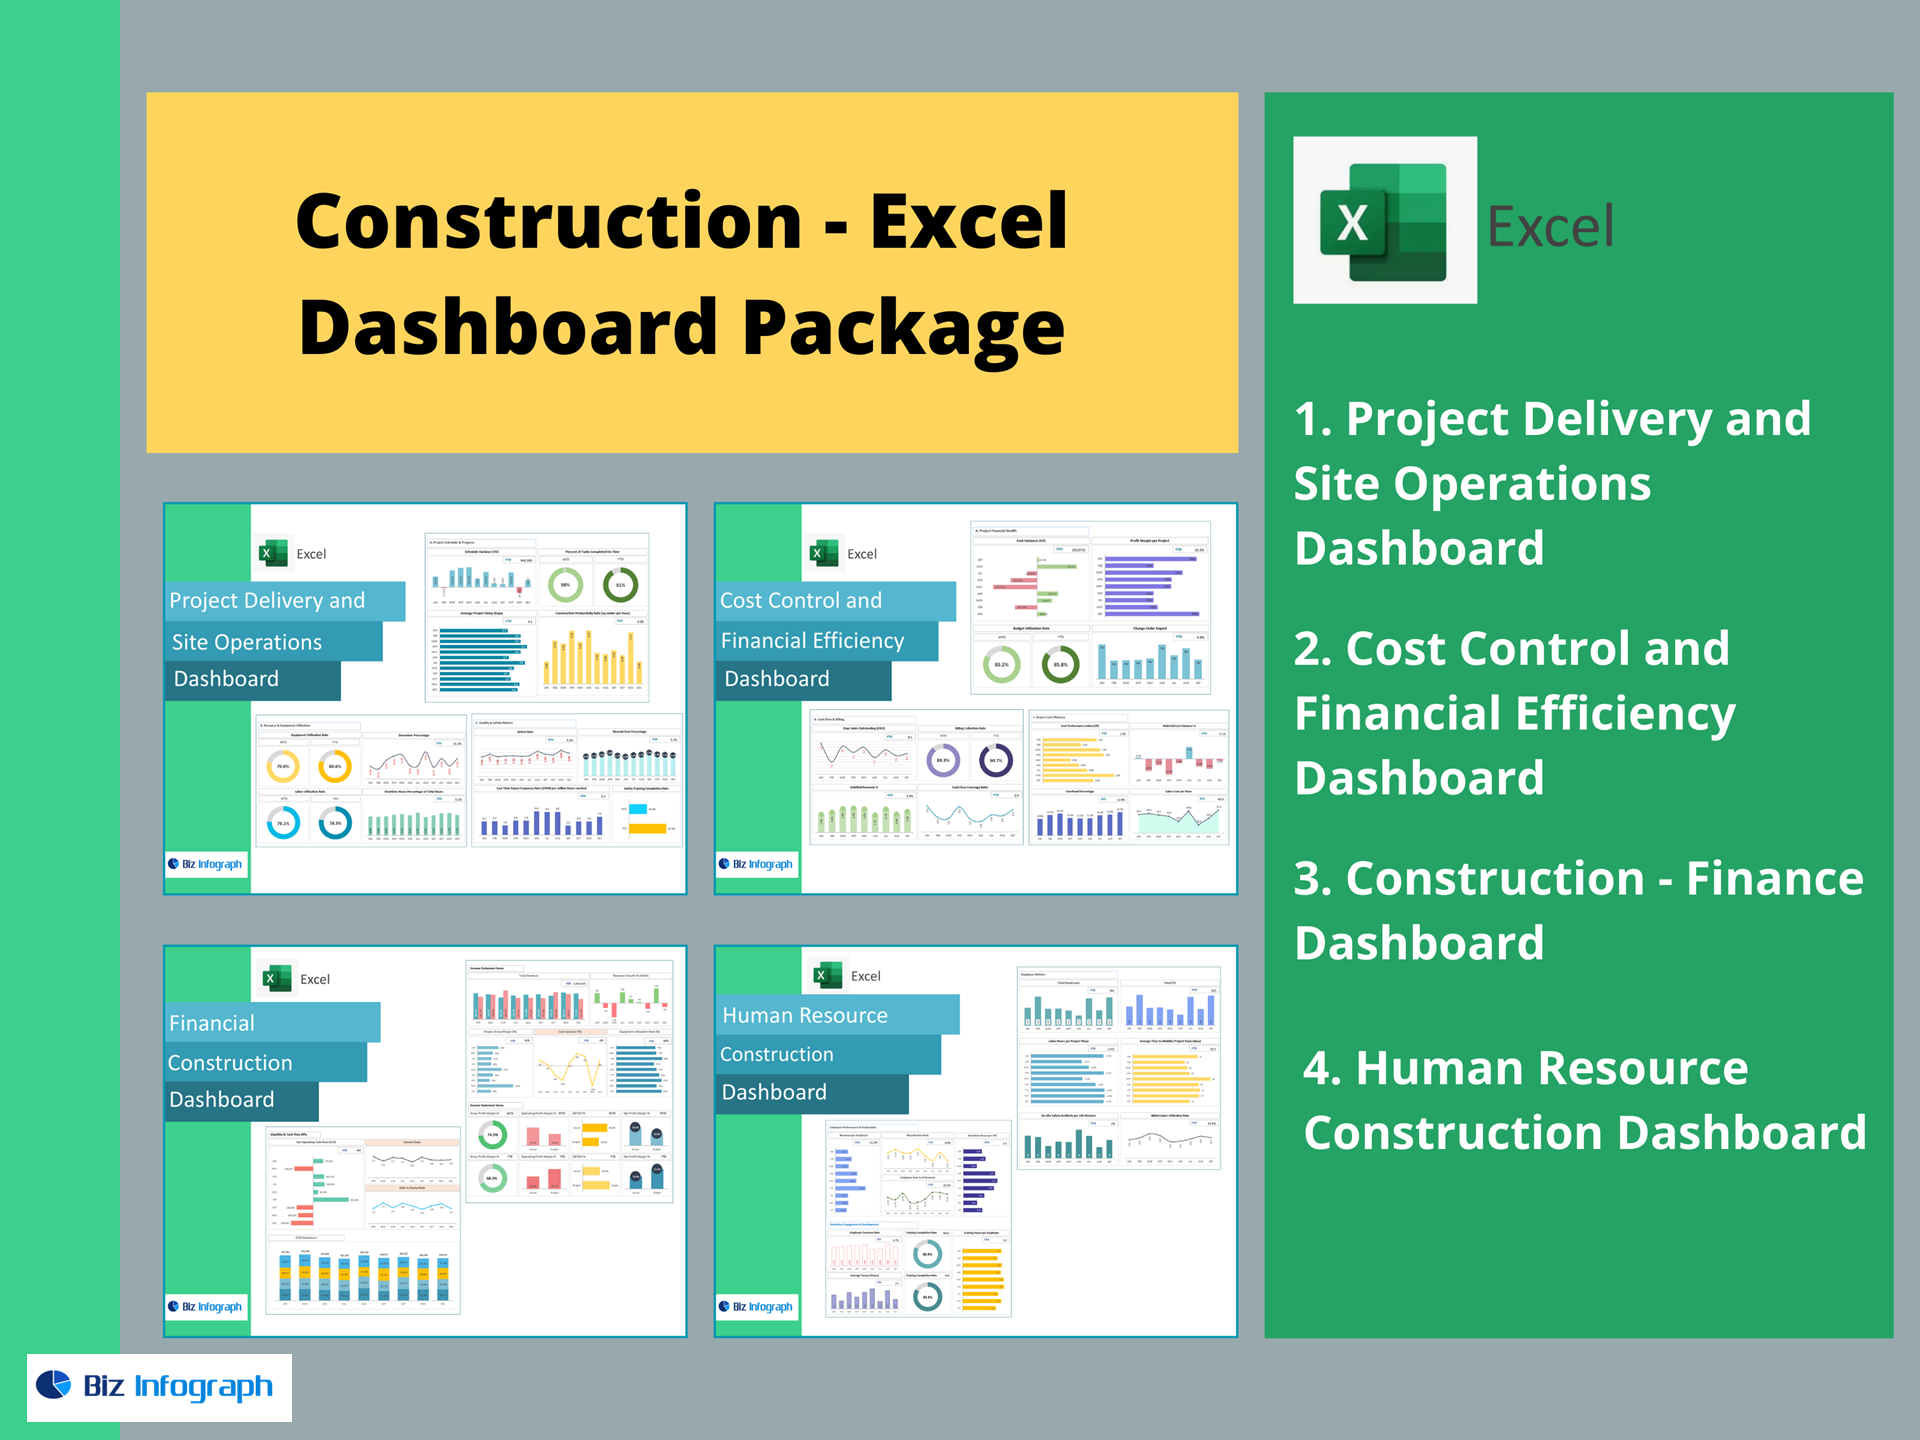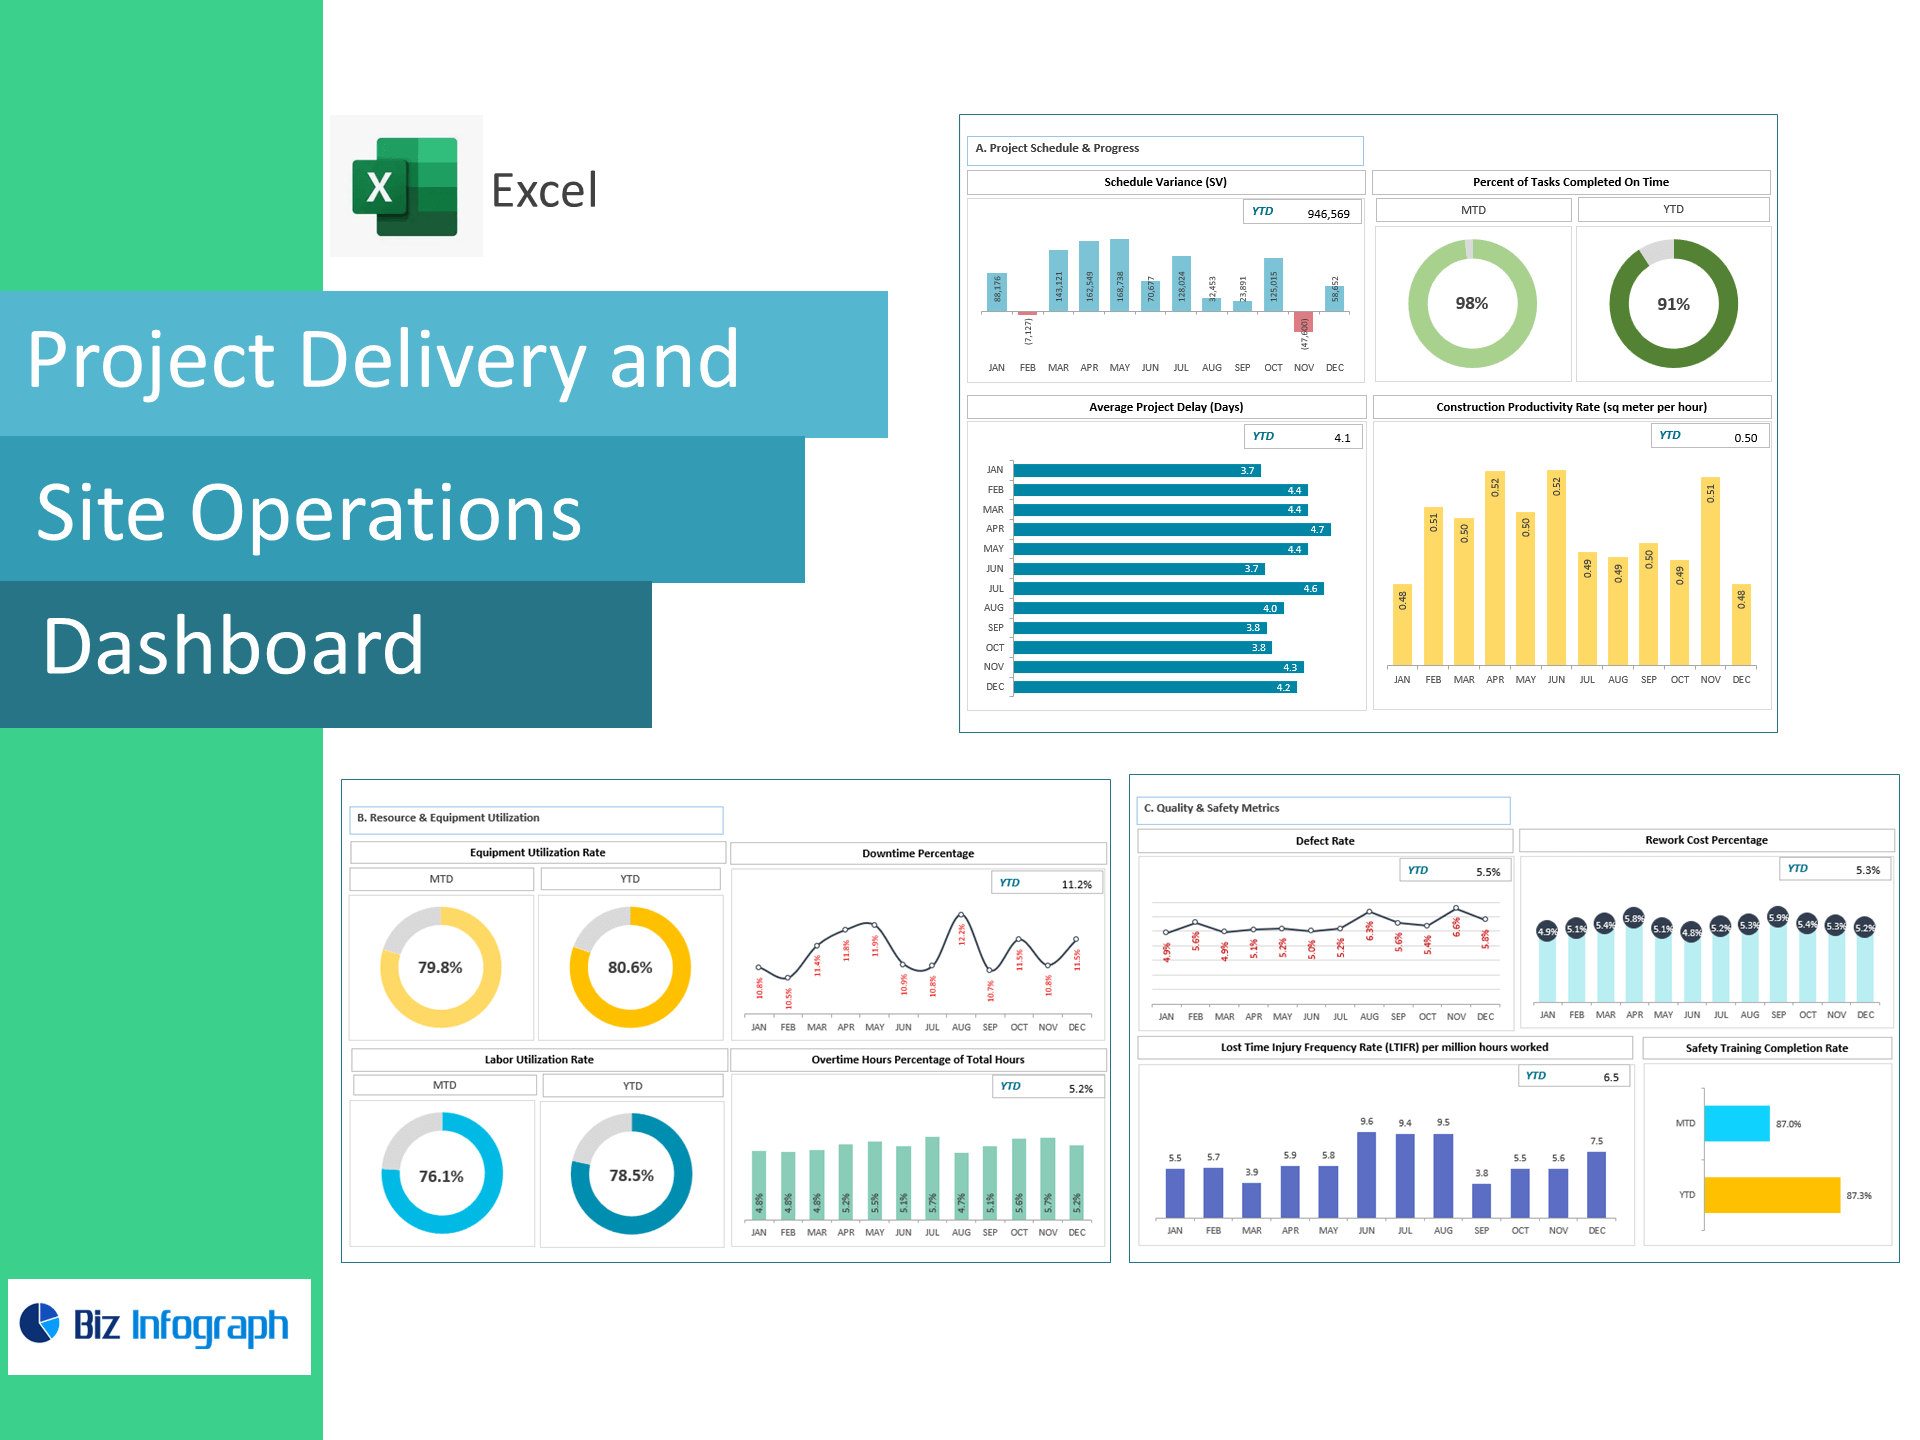
Project Delivery and Site Operations Dashboard — Excel Template
Deliver projects on time, under budget, and safely. This plug-and-play Excel dashboard gives construction and field operations teams instant visibility into schedule performance, resource utilization, quality, and safety. No macros, fully editable, works with Excel 365/2021 (Win & Mac).
What this template tracks (prebuilt KPIs)
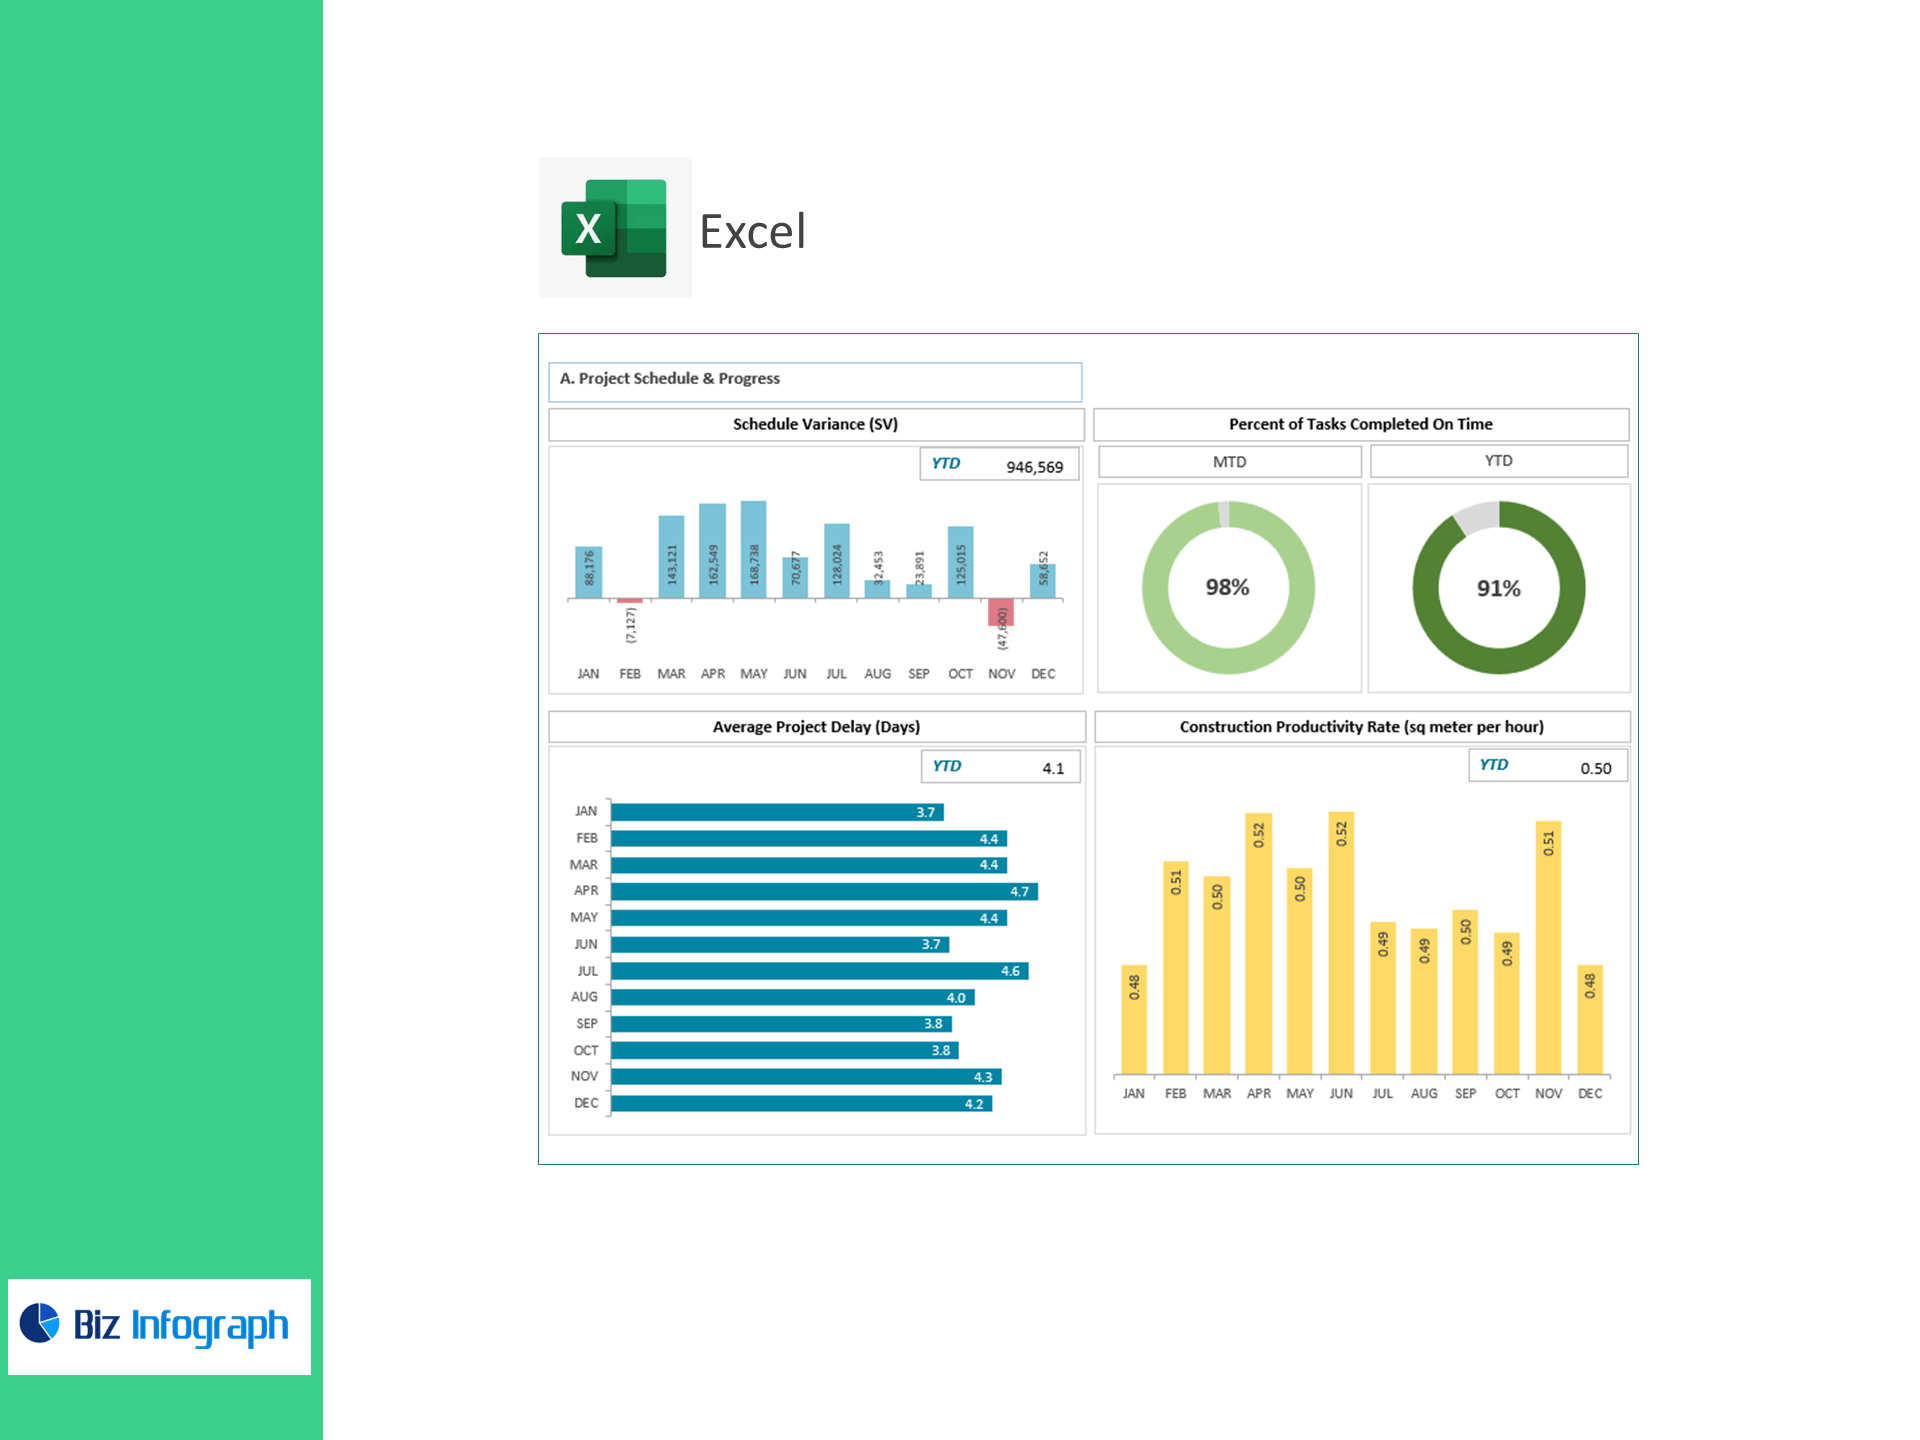
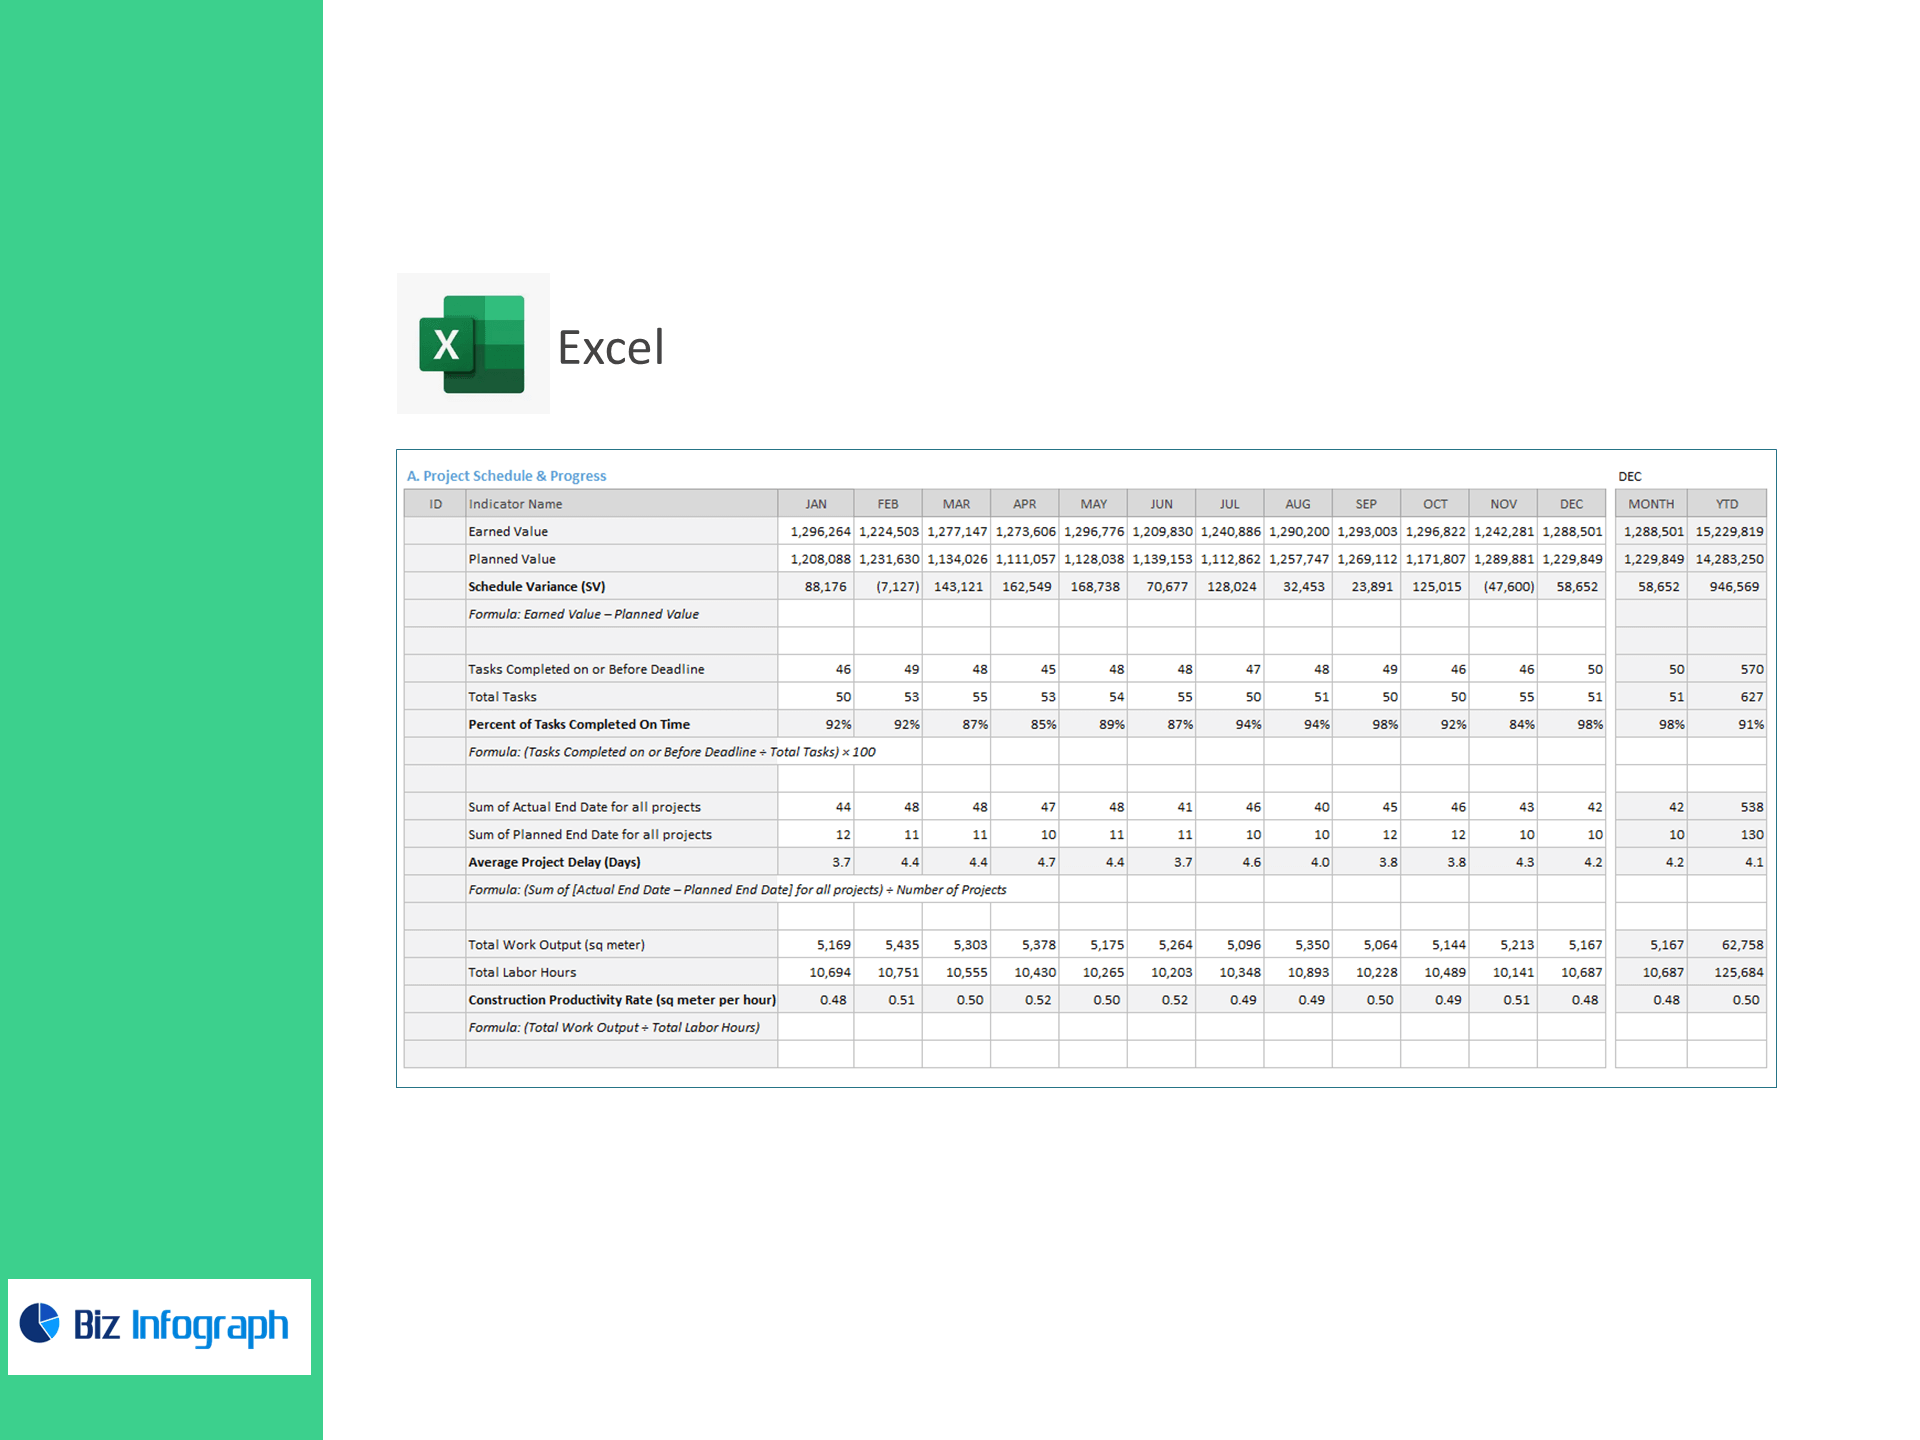
A) Project Schedule & Progress
-
Schedule Variance (SV) (Earned Value – Planned Value)
-
% Tasks Completed On Time
-
Average Project Delay (Days) across all projects
-
Construction Productivity Rate (sq m per labor hour)
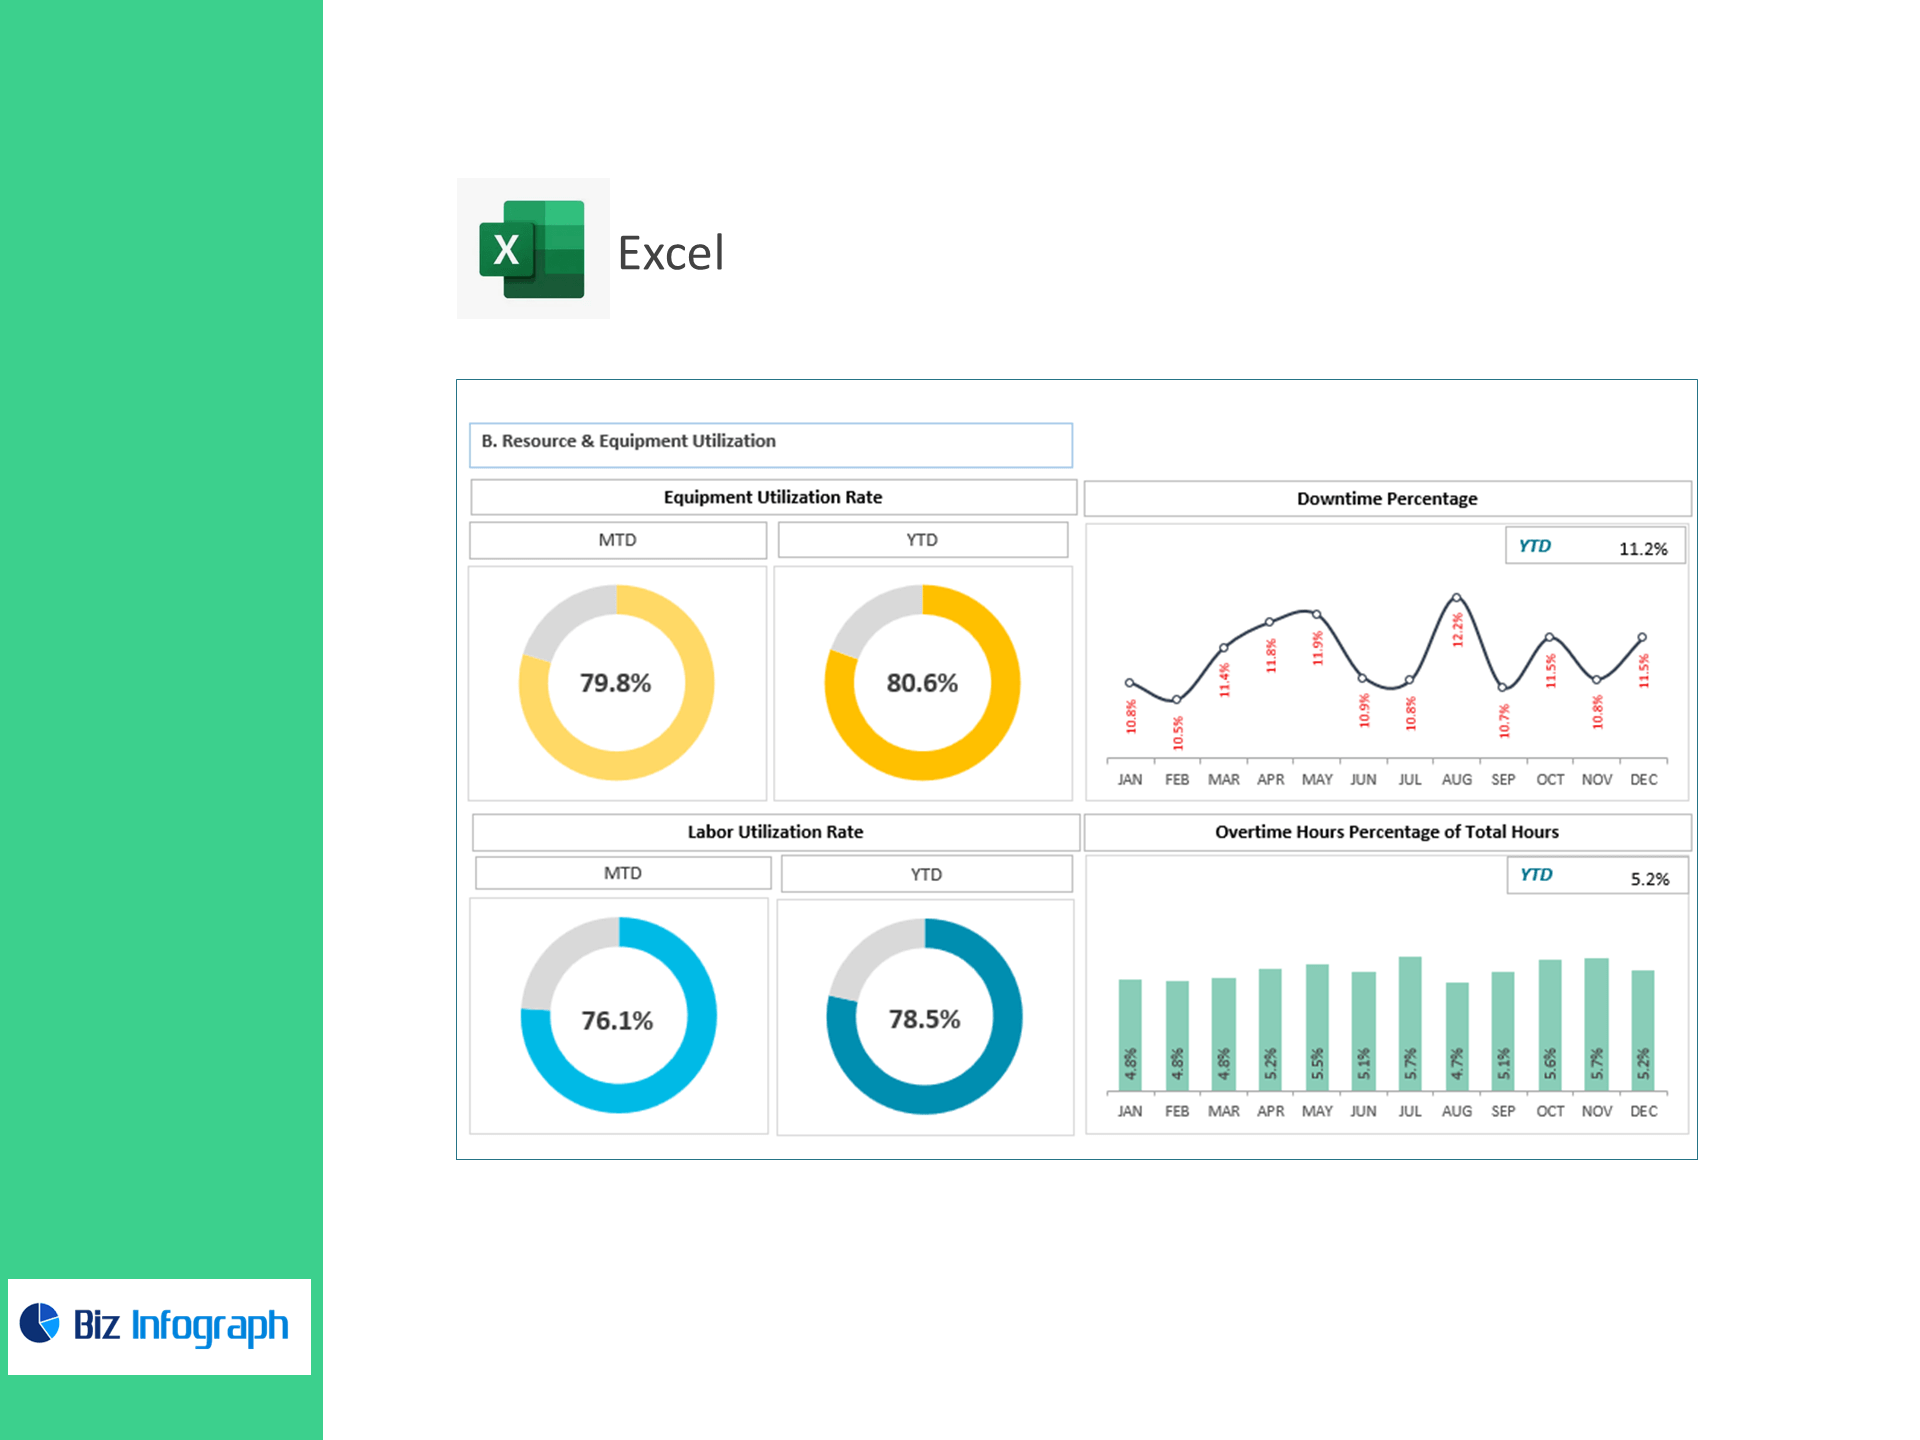
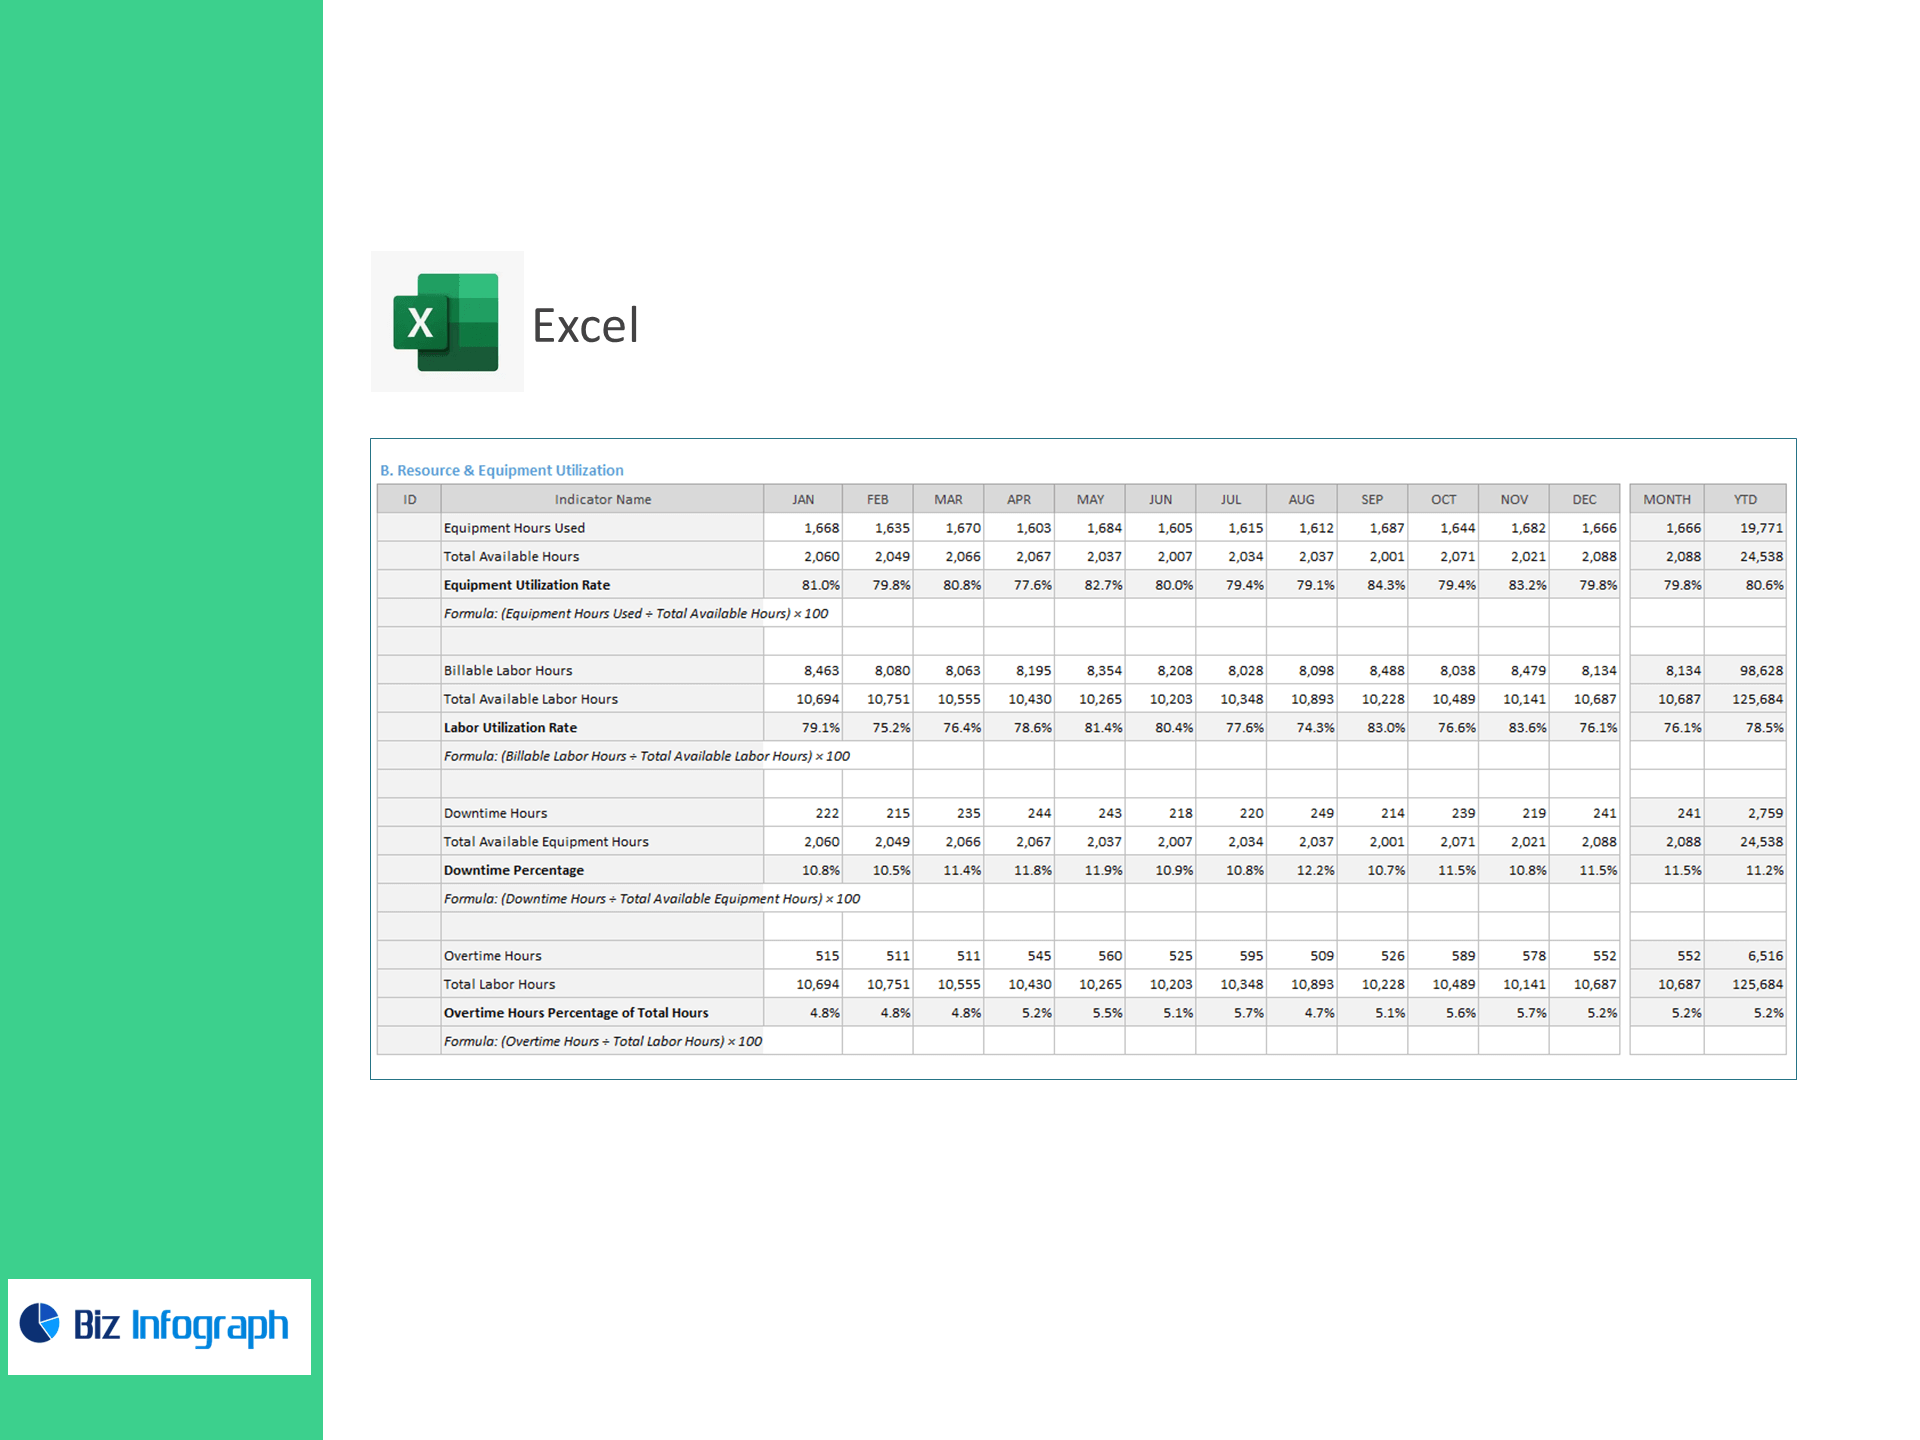
B) Resource & Equipment Utilization
-
Equipment Utilization Rate
-
Labor Utilization Rate (billable vs. available)
-
Downtime Percentage (equipment idle time)
-
Overtime Hours % of Total Hours
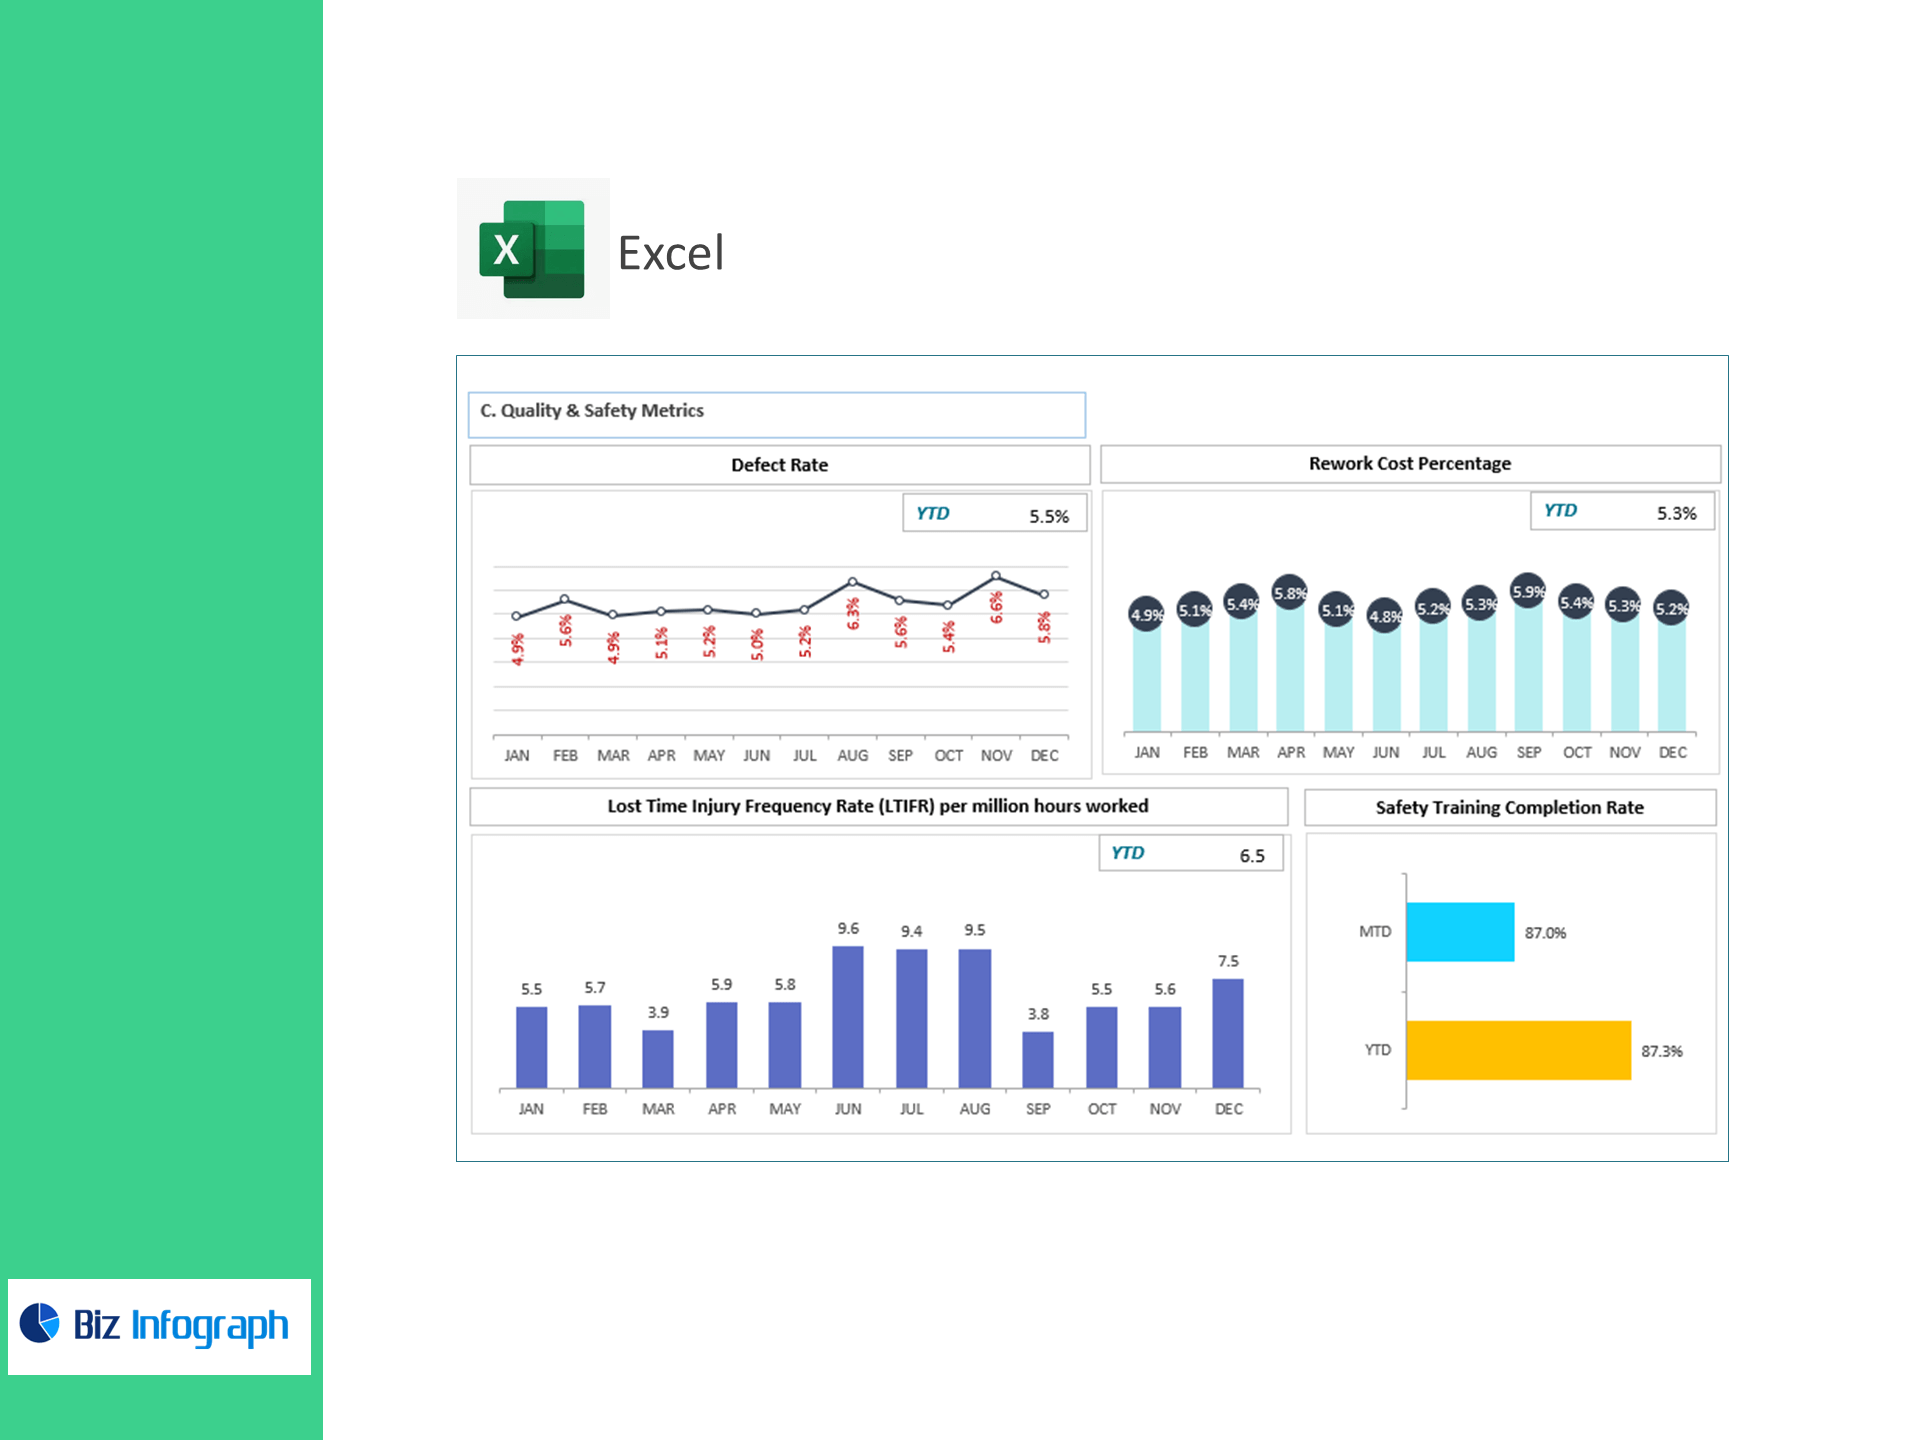
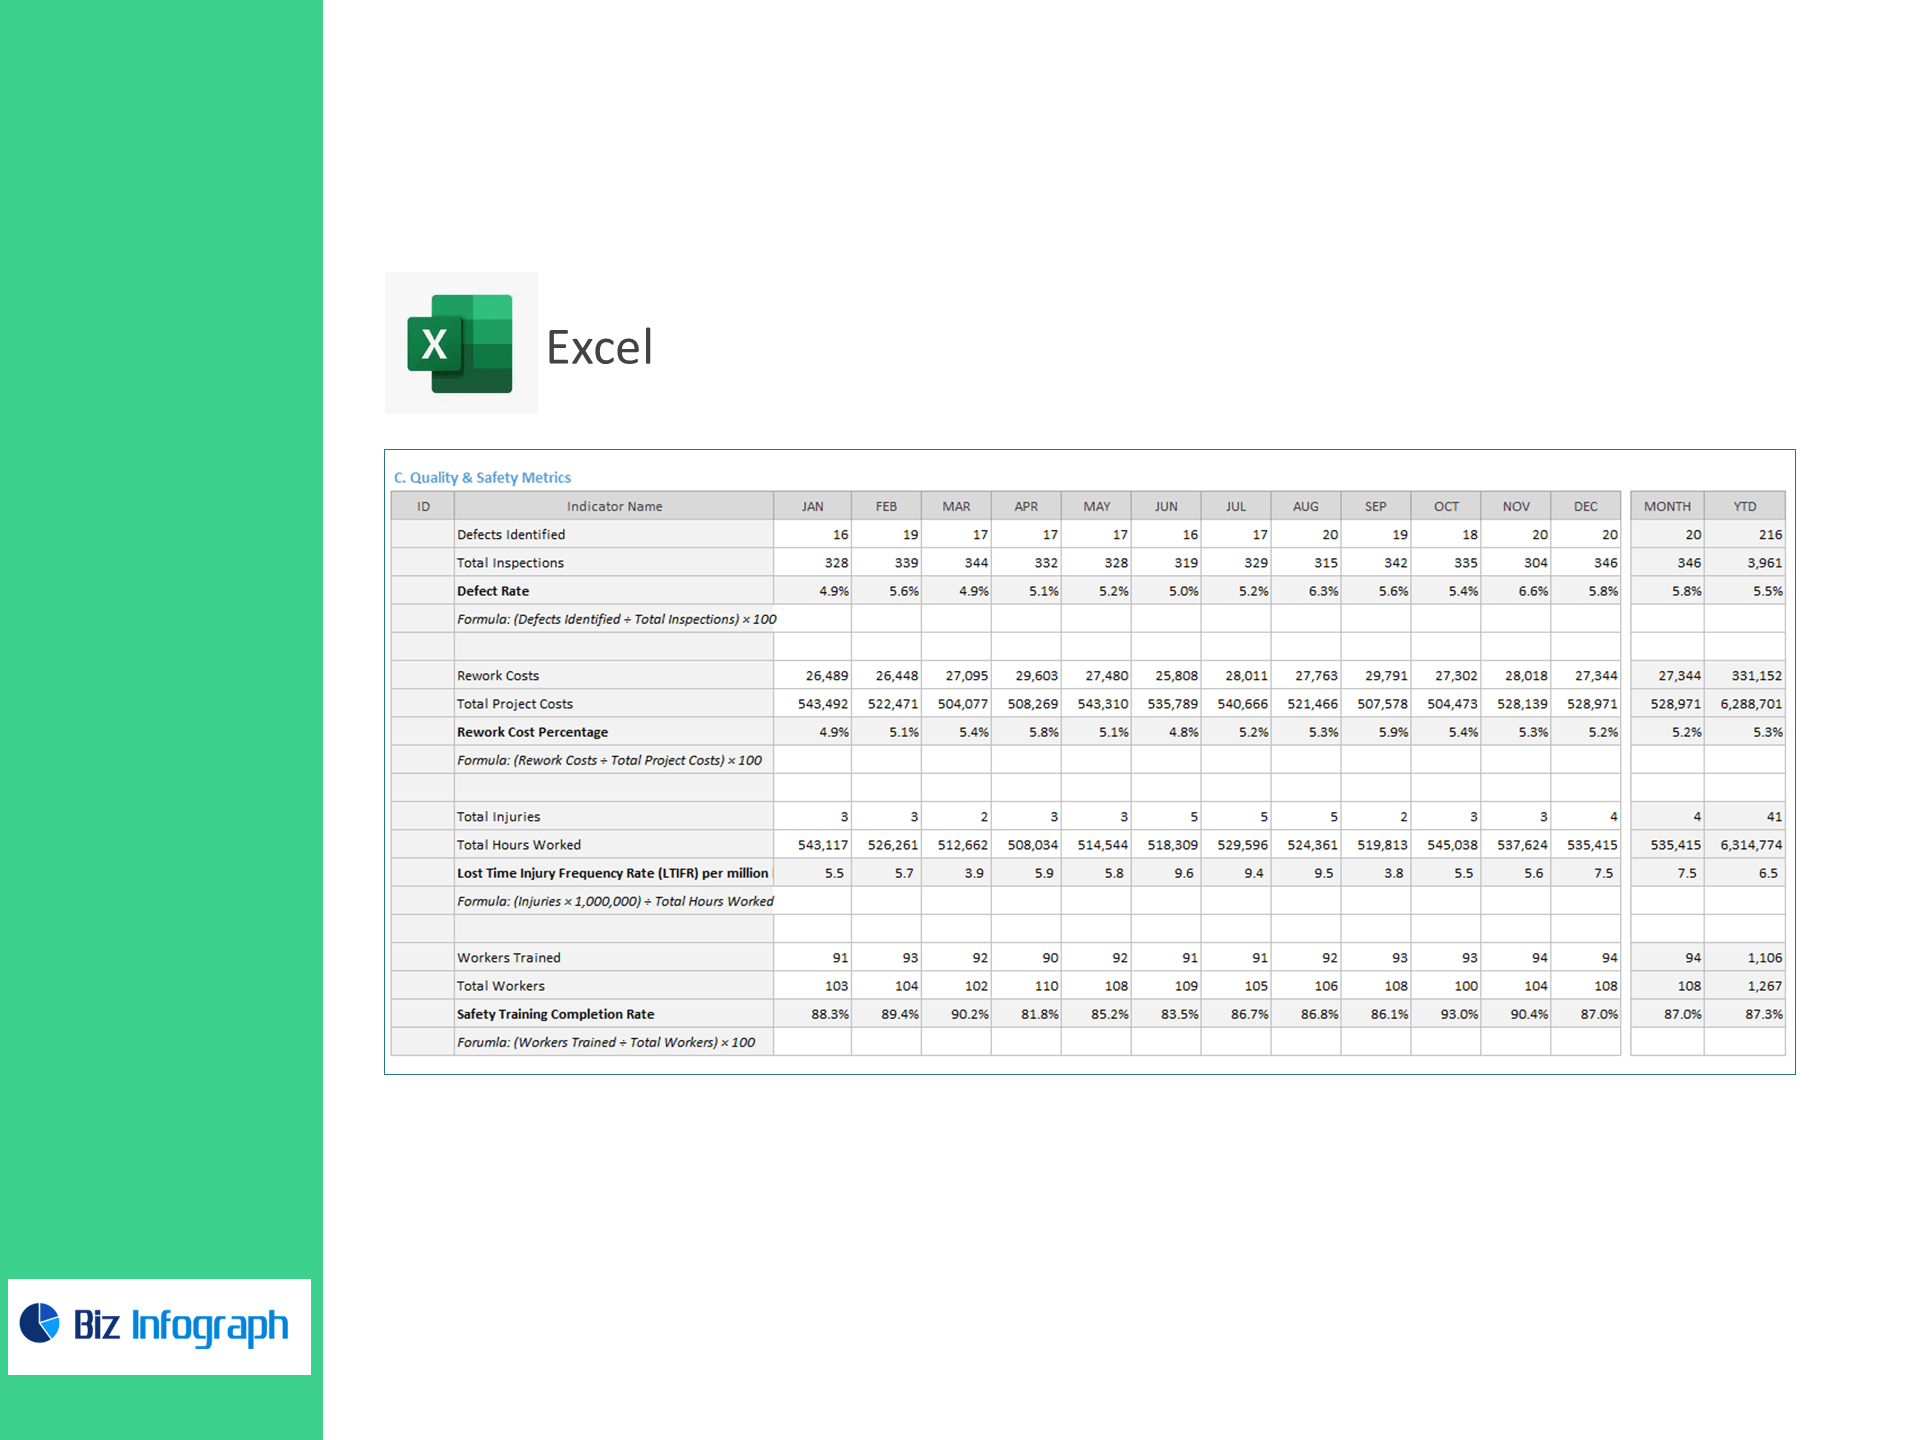
C) Quality & Safety Metrics
-
Defect Rate (defects ÷ inspections)
-
Rework Cost % of total project cost
-
LTIFR (Lost Time Injury Frequency Rate per 1M hours)
-
Safety Training Completion Rate
Inside the file
-
Executive KPI tiles with red/amber/green targets & variance
-
Trend charts for schedule, productivity, downtime, and LTIFR
-
Drill-downs by project, site, foreman, trade, equipment class, month
-
Automated data model with sample data & “Paste/Refresh” instructions
-
Filters (Slicers) for region, client, status, risk, subcontractor
-
Printable one-page summary & stakeholder report PDF export
Benefits
-
Shorten delays by monitoring SV, task timeliness, and bottlenecks
-
Boost utilization of crews and equipment while cutting overtime
-
Reduce rework and defects with real-time quality scorecards
-
Improve safety performance and compliance tracking across sites
Perfect for
General contractors, EPC firms, PMOs, site managers, owners’ reps, and field operations leaders who need a fast, reliable Project Delivery & Site Ops dashboard in Excel.
Technical details
-
100% Excel (no add-ins), structured tables + formulas
-
Works with CSV/ERP exports (Primavera/MS Project/Procore)
-
Clean, brandable layout; easy to extend with your KPIs
For ready-to-use Dashboard Templates: