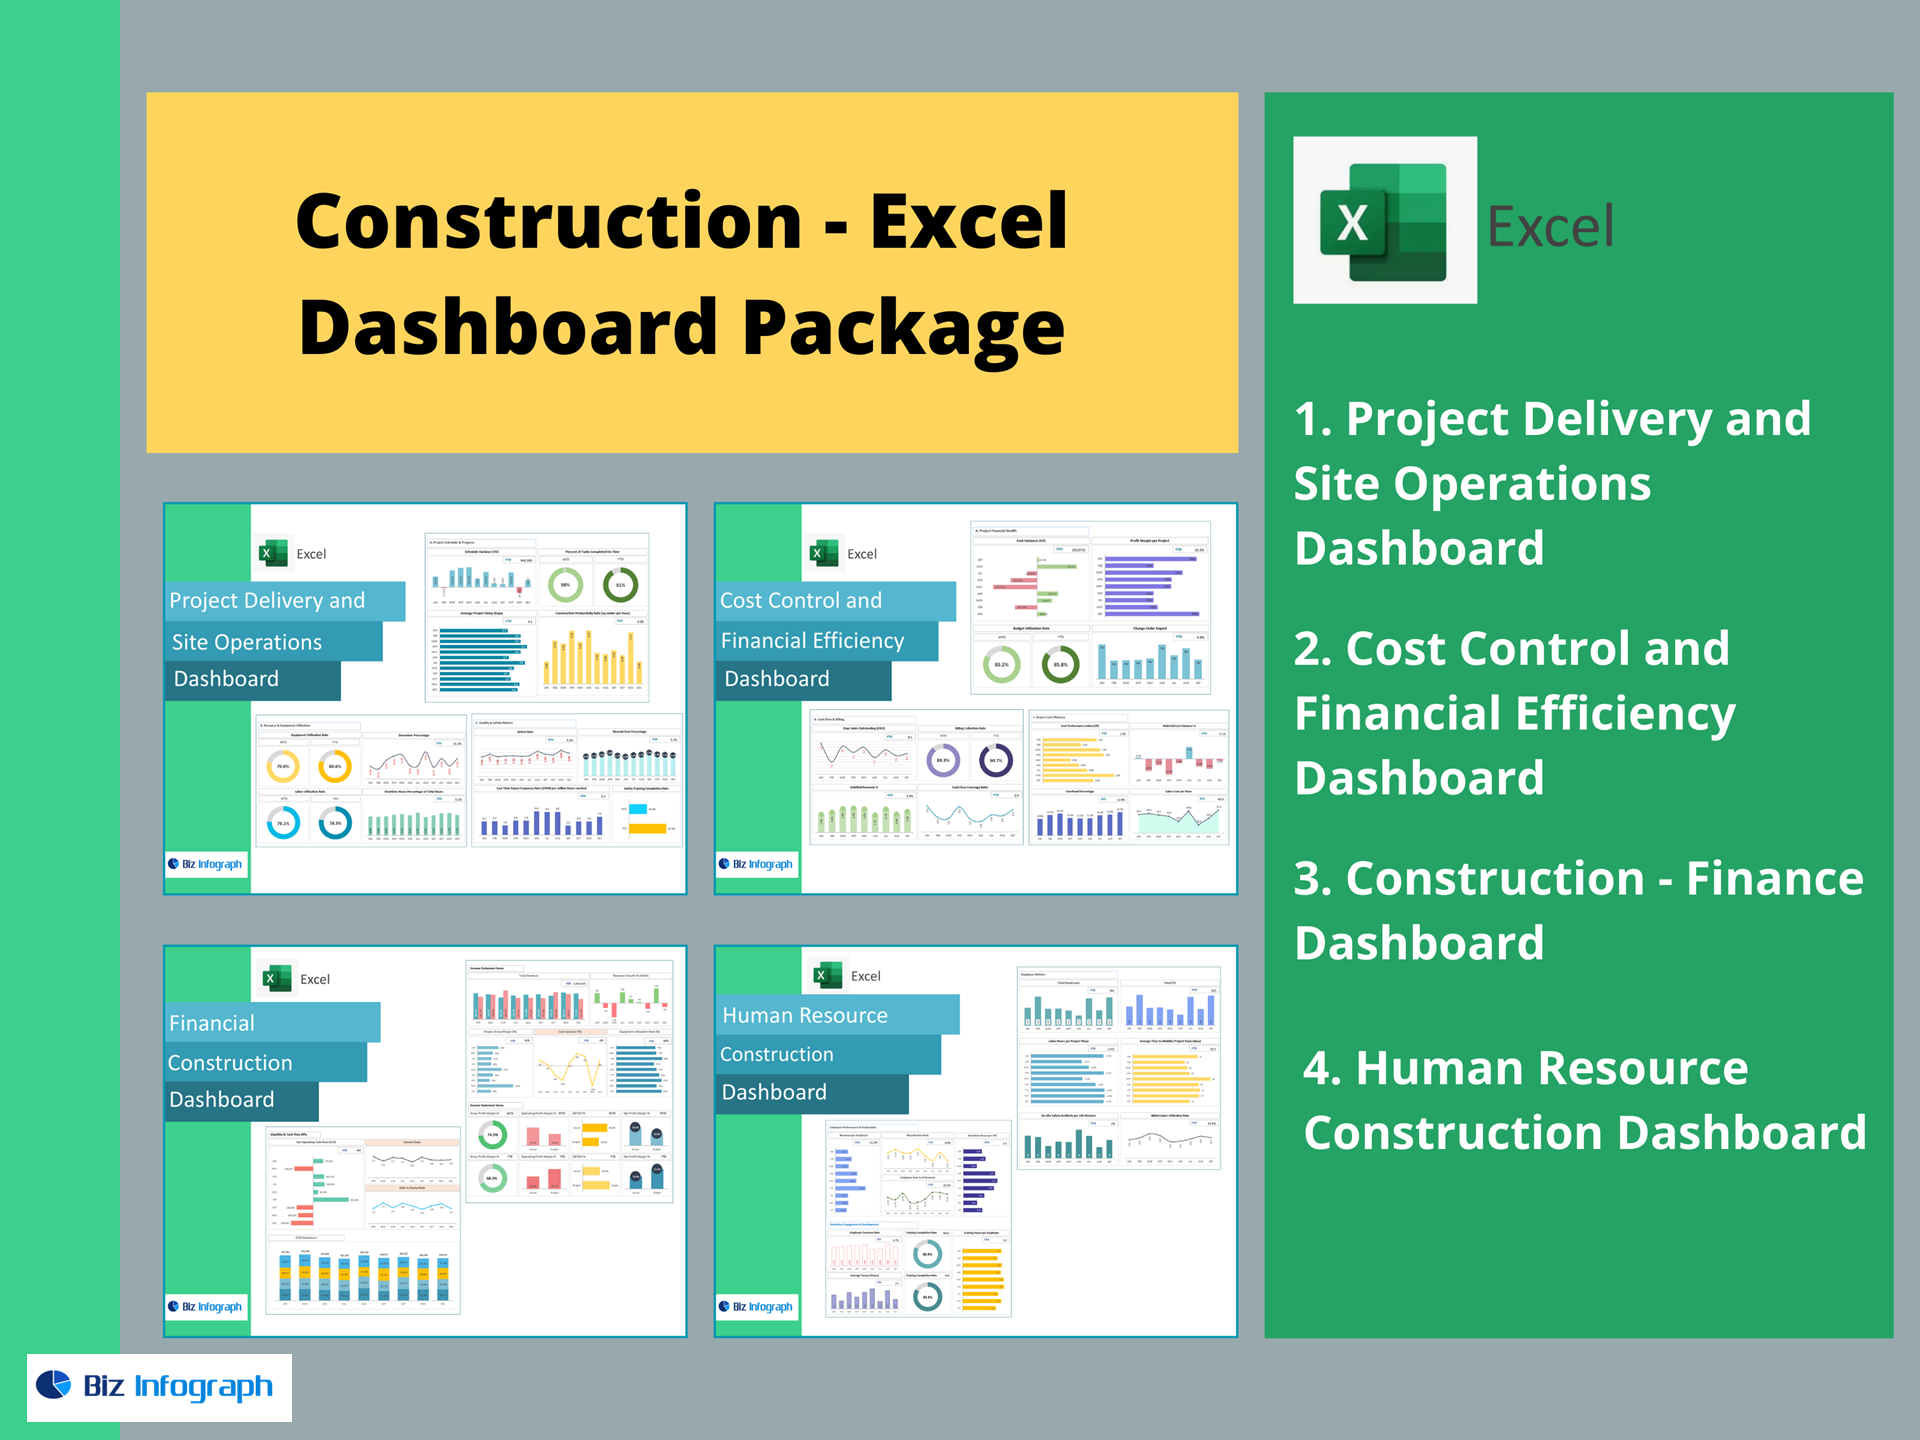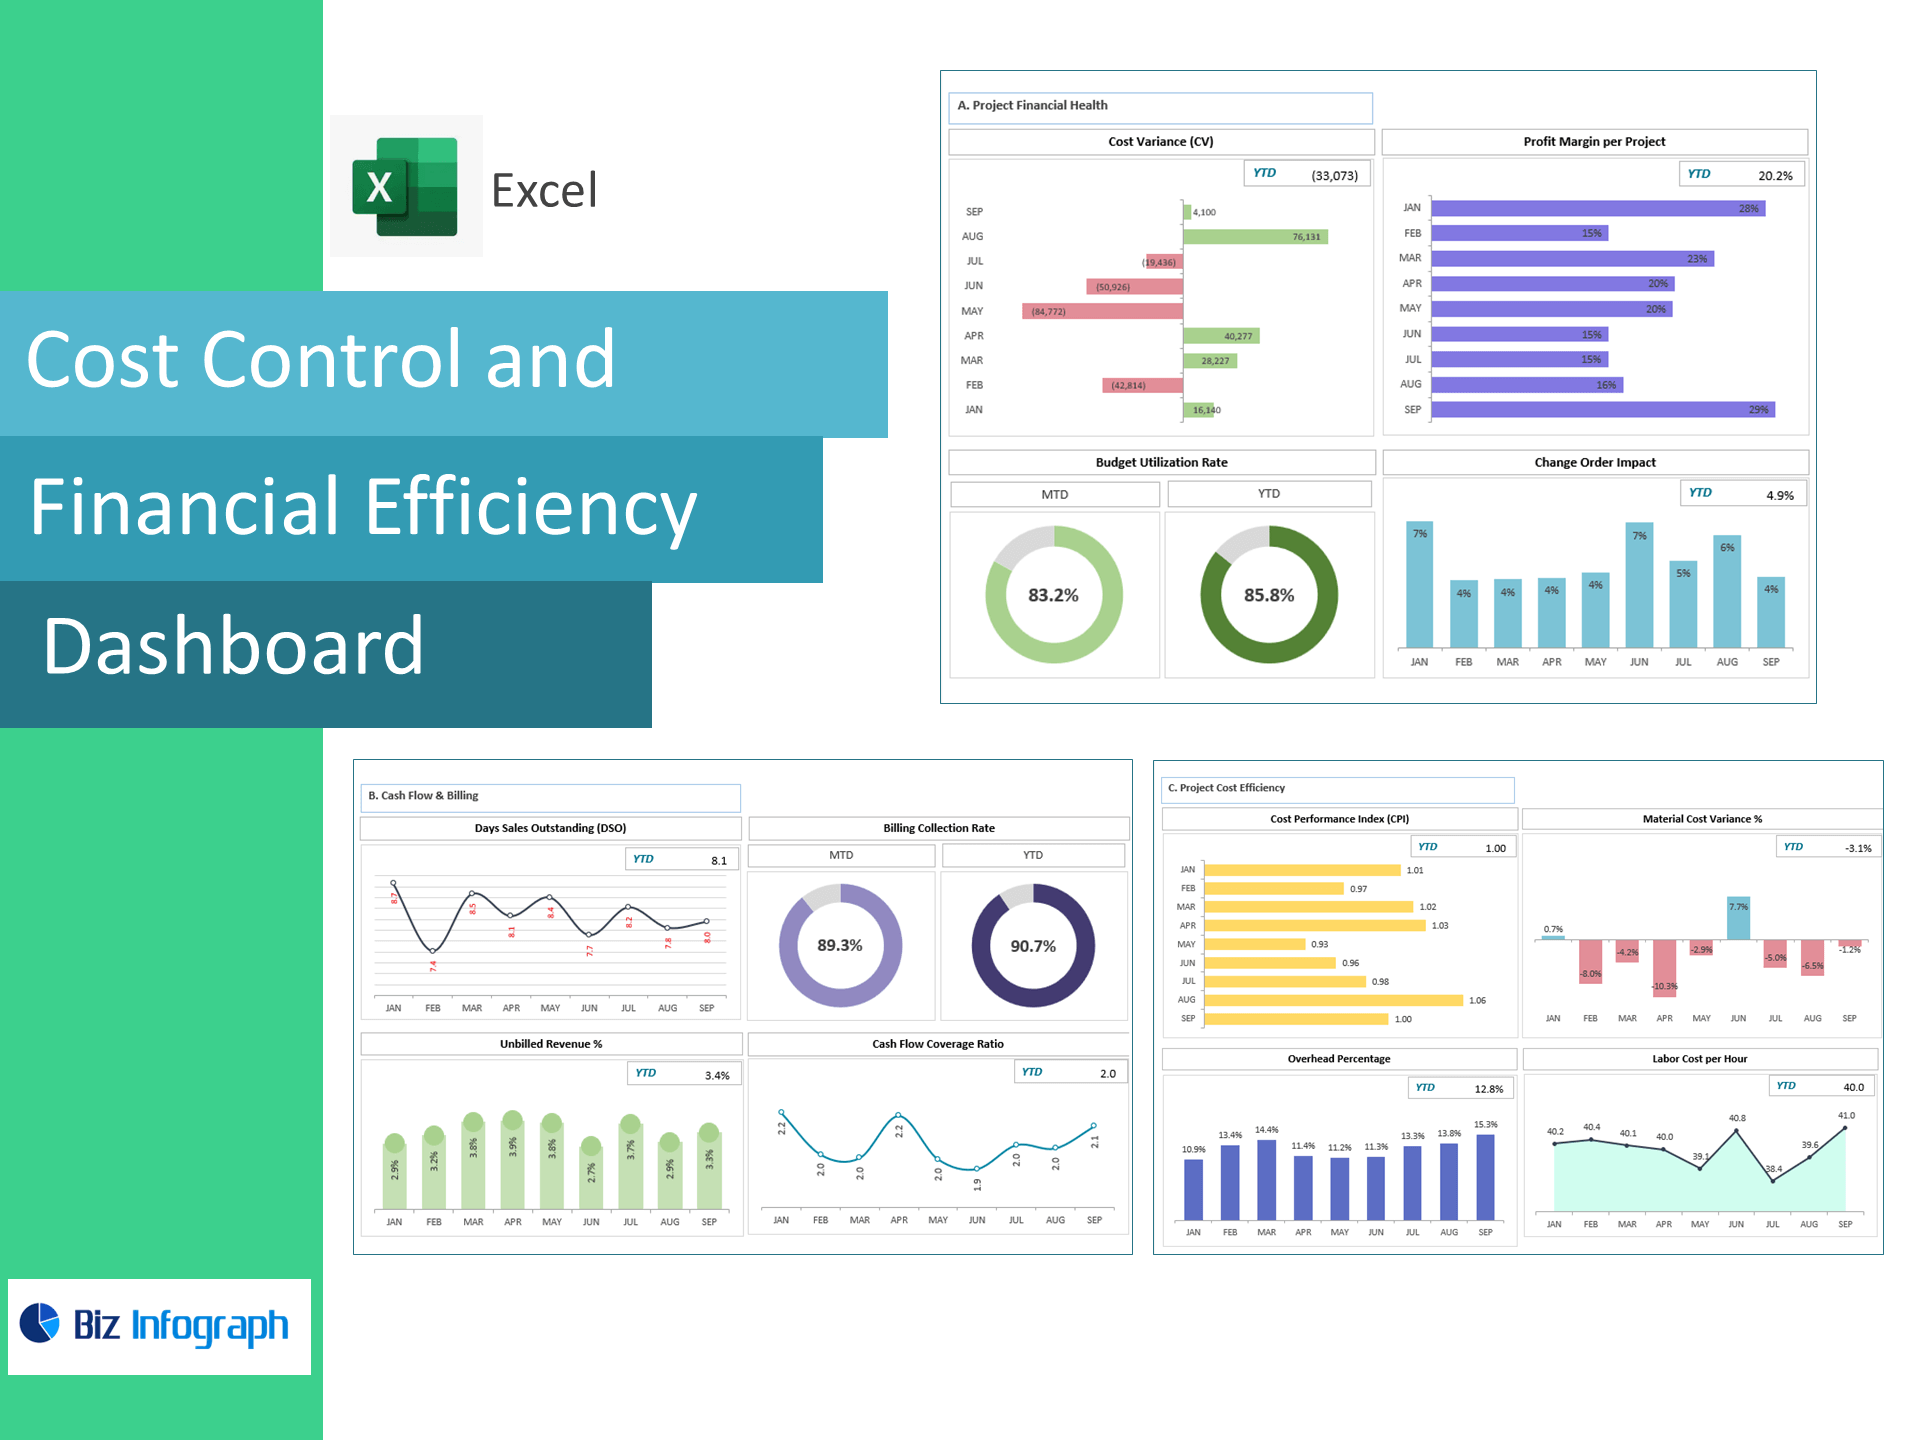
Cost Control & Financial Efficiency Dashboard — Excel Template
See cost overruns early, speed up collections, and protect project margins—right in Excel. This ready-to-use dashboard transforms your job-cost, billing and timesheet exports into an executive view of Cost Variance (CV), Budget Utilization, Profit Margin per Project, Change-Order Impact, Billing Collection Rate, Cash Flow Coverage, DSO, Unbilled Revenue %, Cost Performance Index (CPI), Labor Cost per Hour, Material Cost Variance %, and Overhead %—so finance and project leaders can act before profits slip.
What you’ll track (prebuilt KPIs & formulas)
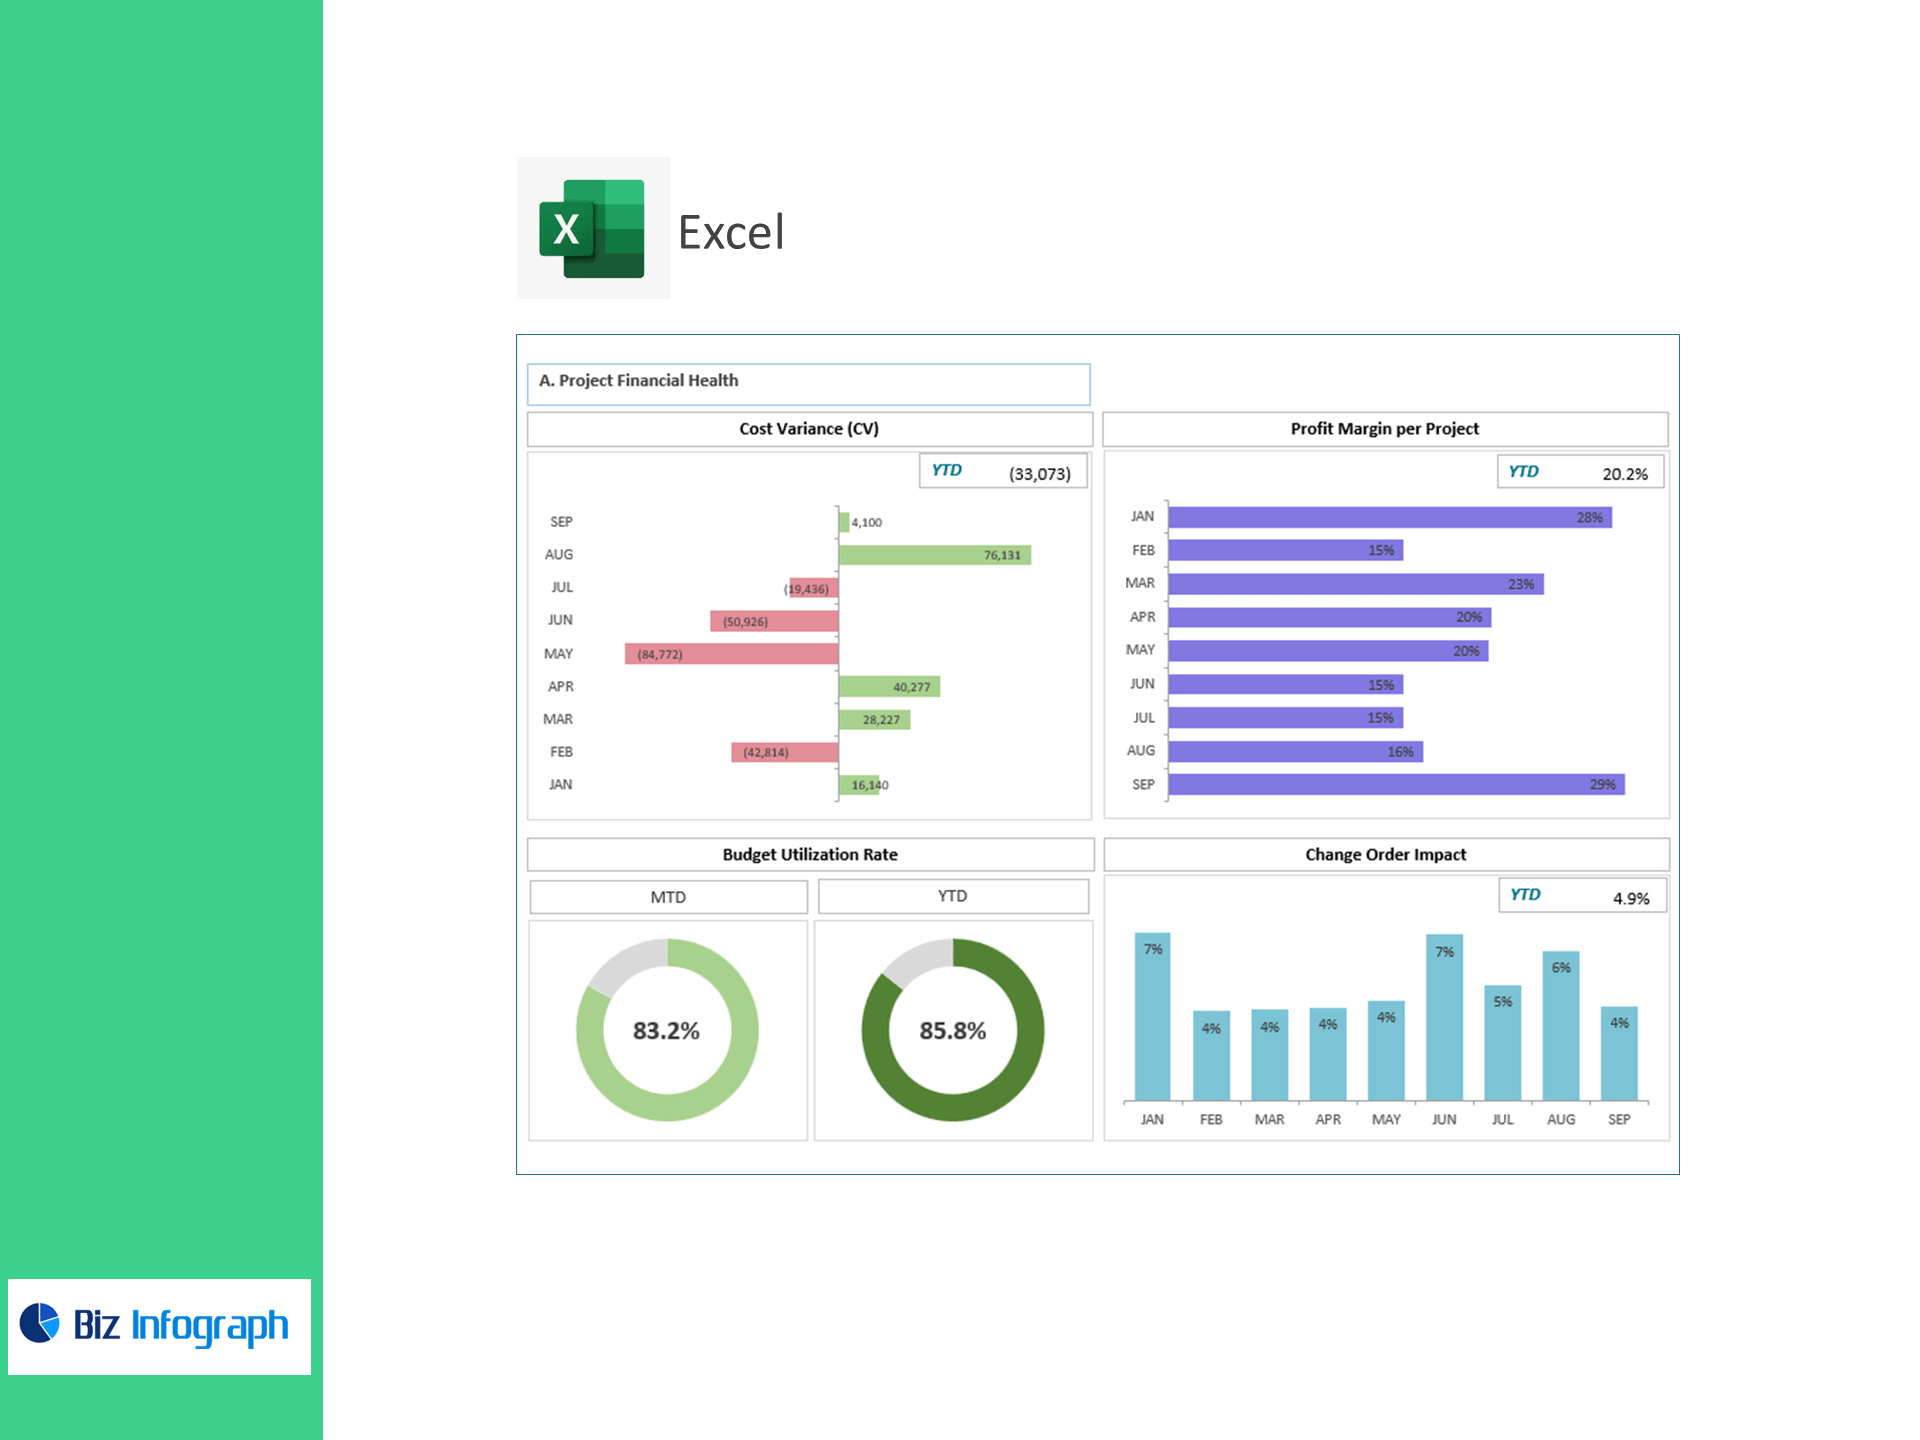
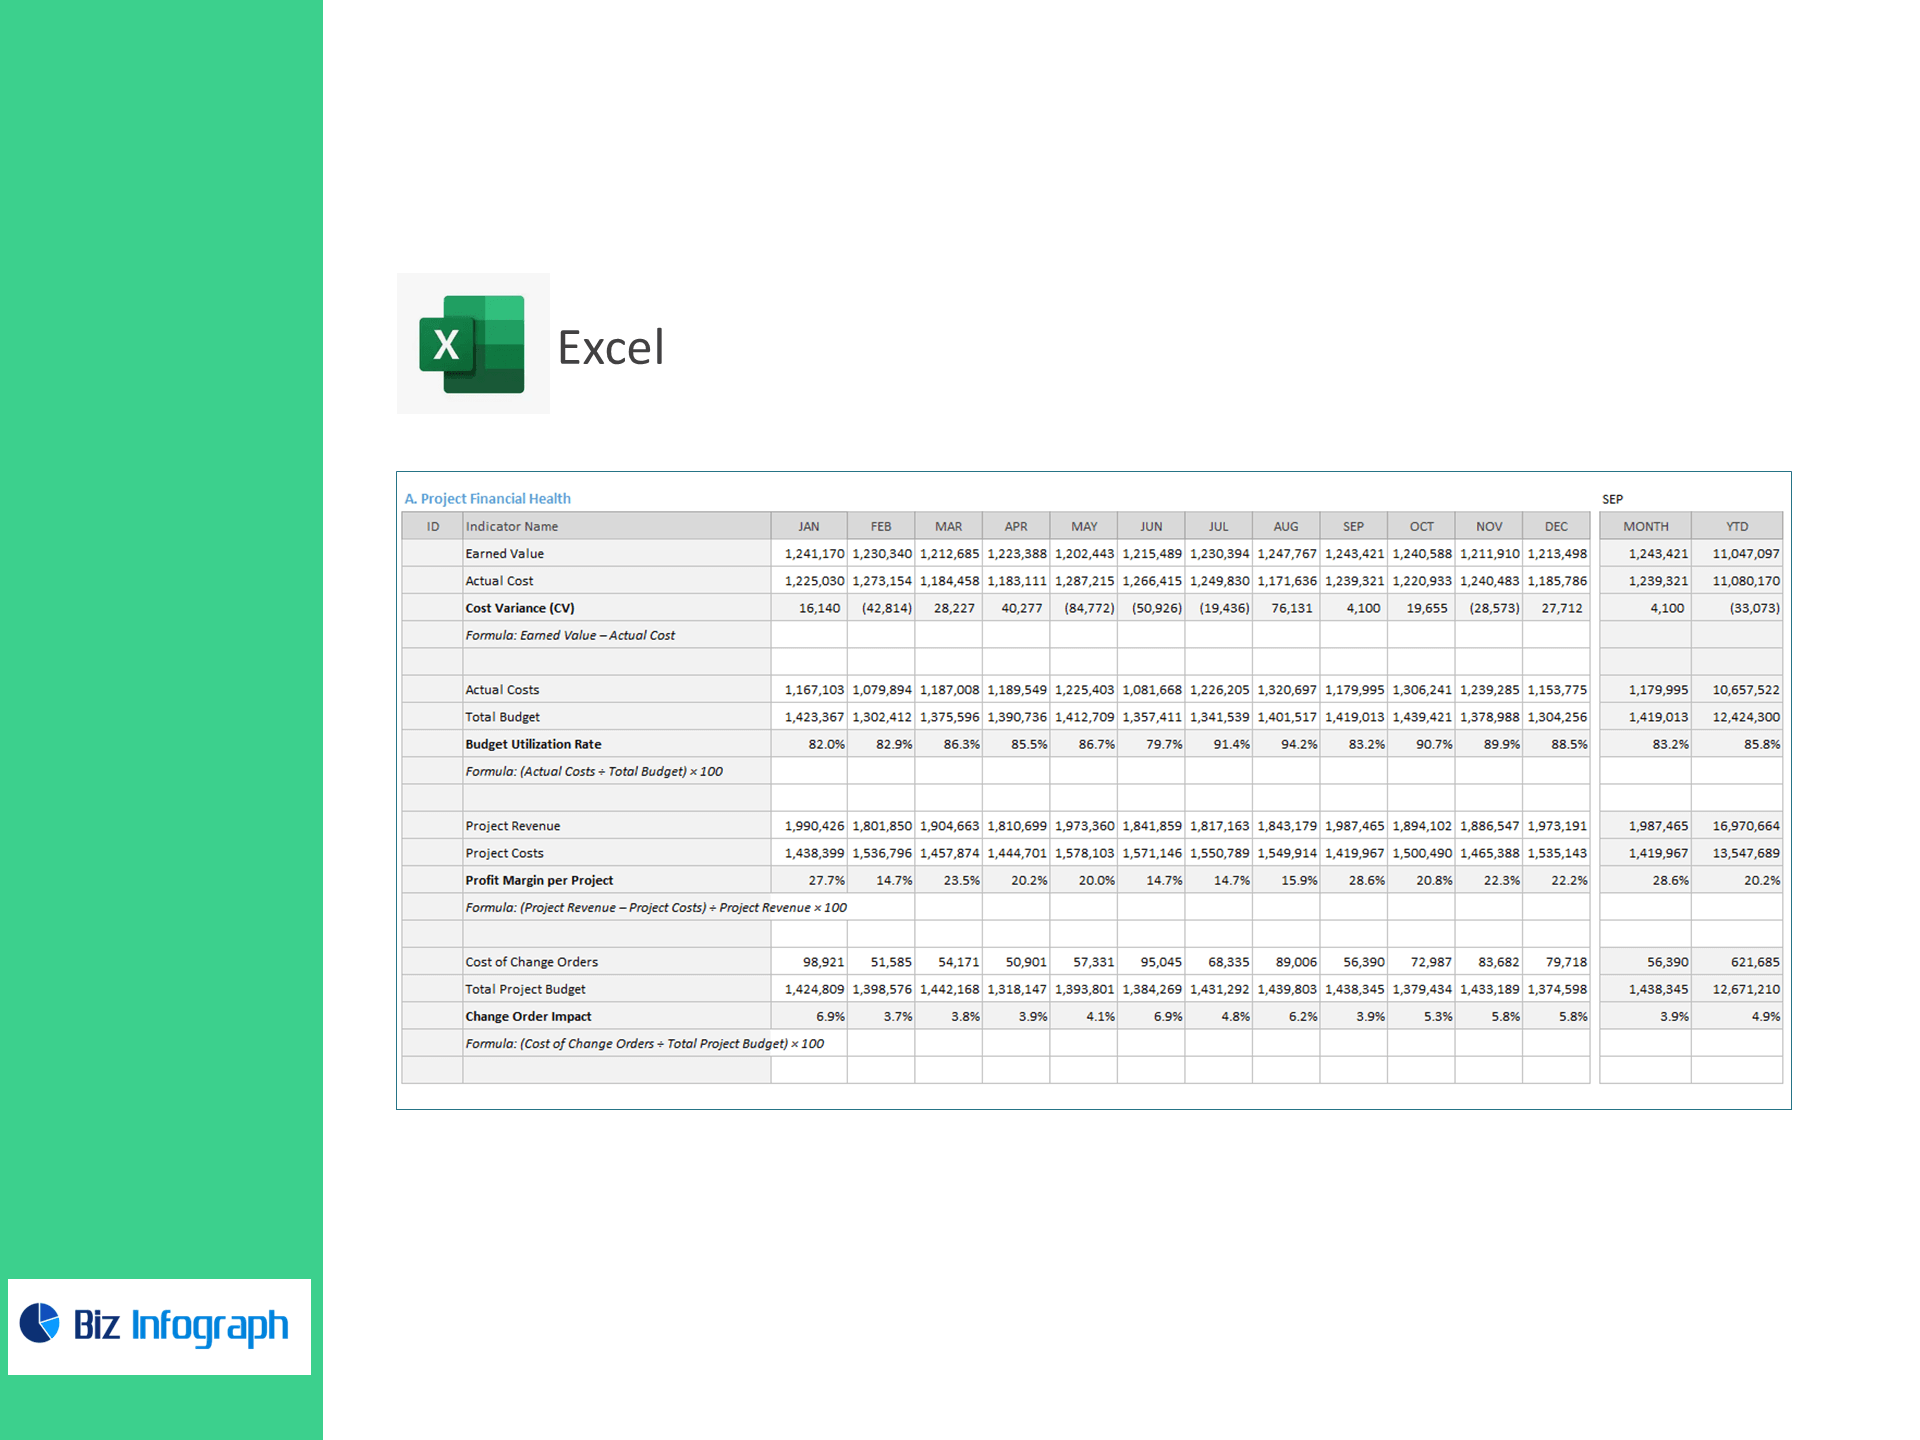
A) Project Financial Health
-
Cost Variance (CV) = Earned Value − Actual Cost
-
Budget Utilization Rate (%) = Actual Costs ÷ Total Budget × 100
-
Profit Margin per Project (%) = (Project Revenue − Project Costs) ÷ Project Revenue × 100
-
Change-Order Impact (%) = Cost of Change Orders ÷ Project Budget × 100
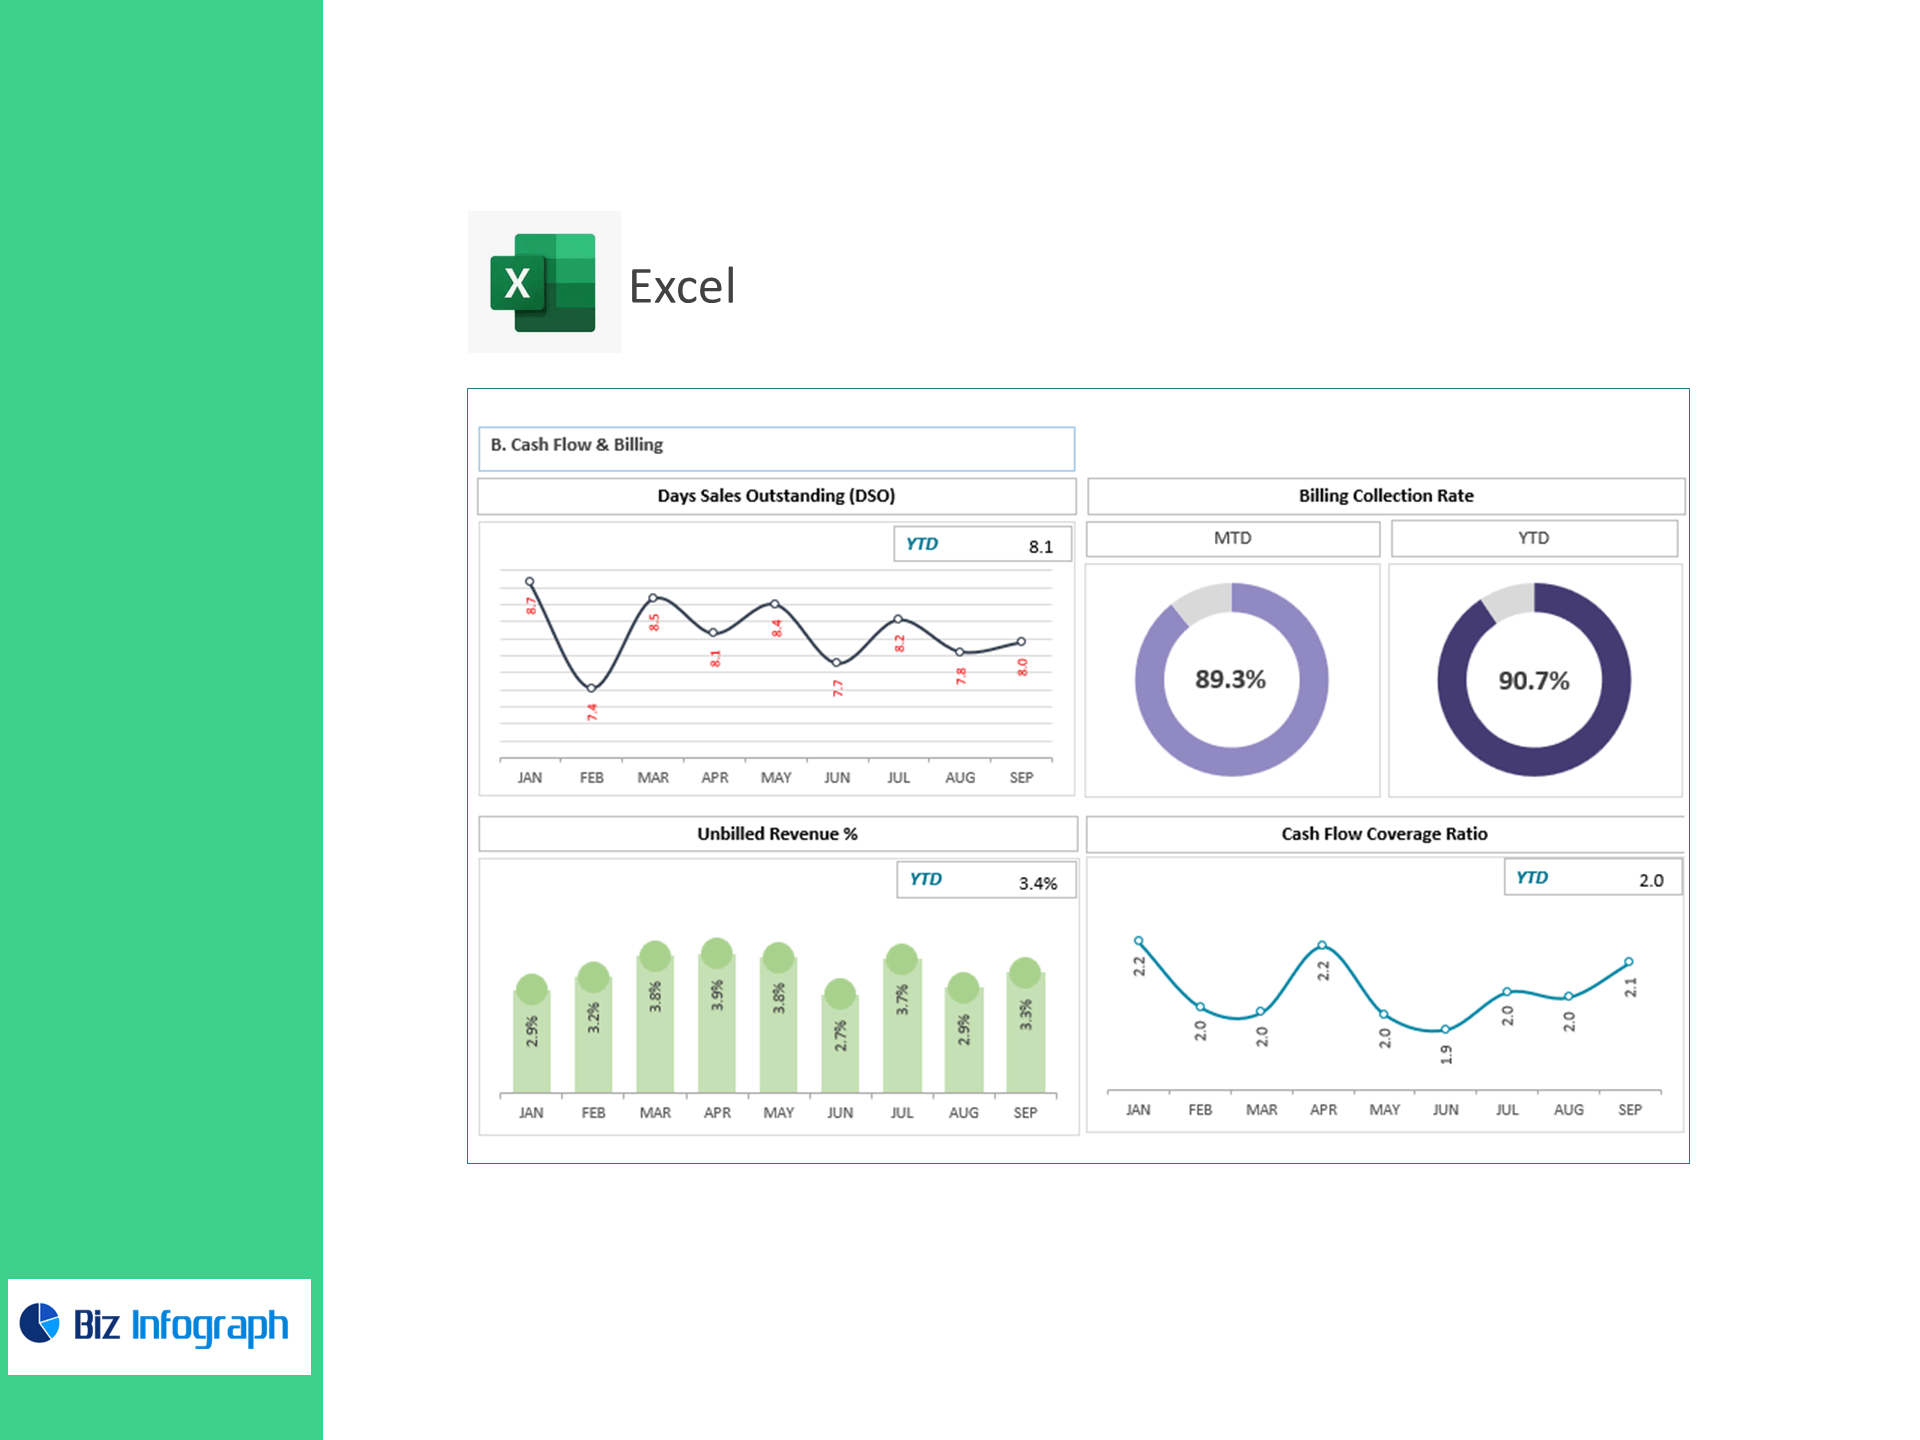
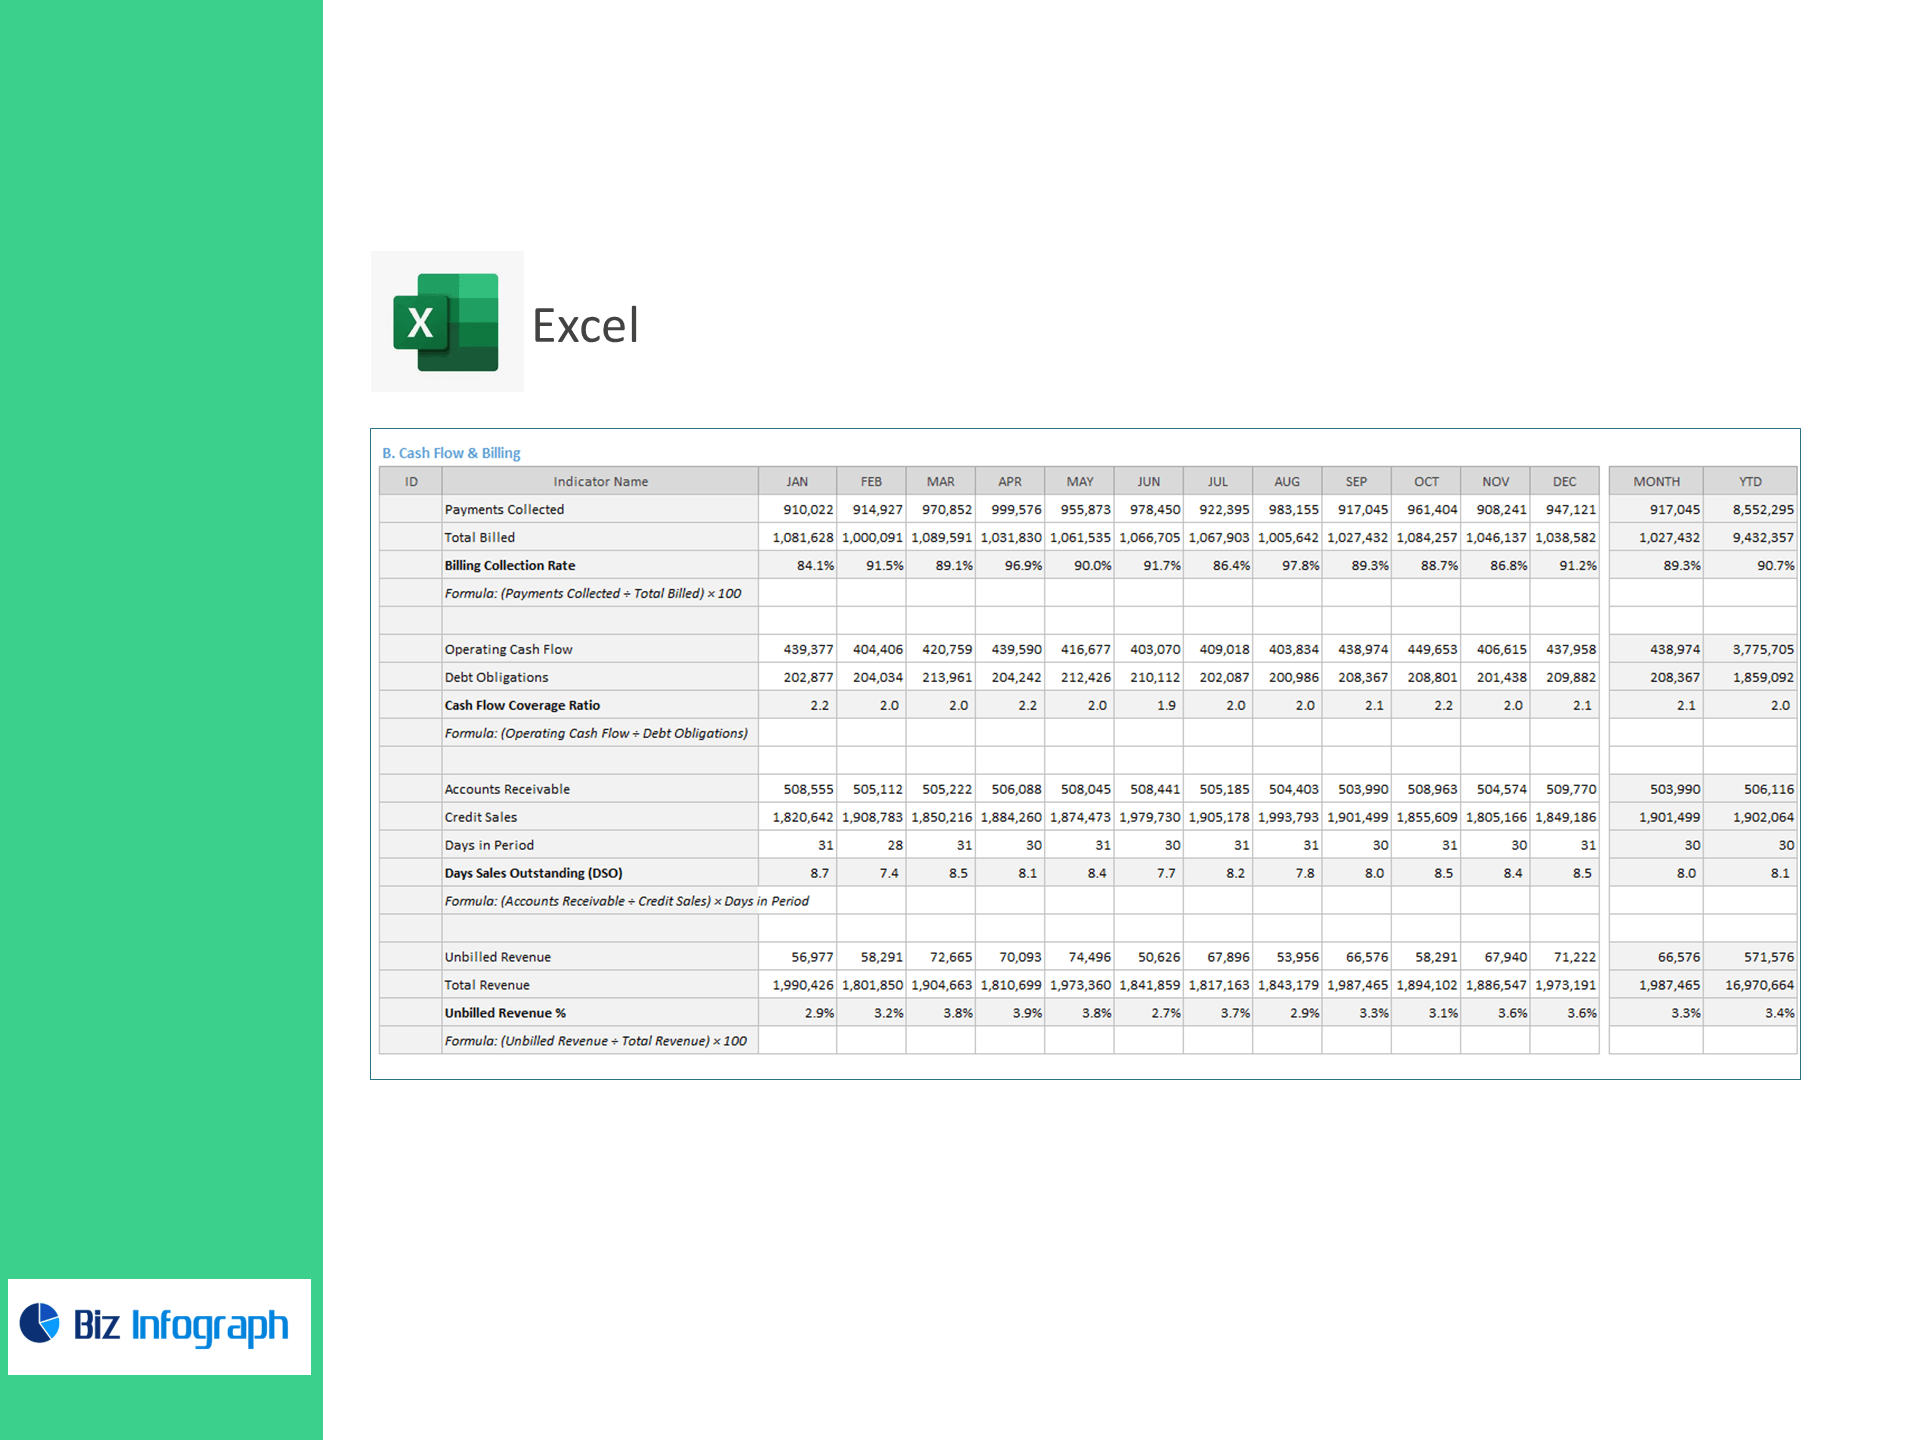
B) Cash Flow & Billing
-
Billing Collection Rate (%) = Payments Collected ÷ Total Billed × 100
-
Cash Flow Coverage Ratio = Operating Cash Flow ÷ Debt Obligations
-
Days Sales Outstanding (DSO) = AR ÷ Credit Sales × Days in Period
-
Unbilled Revenue (%) = Unbilled Revenue ÷ Total Revenue × 100
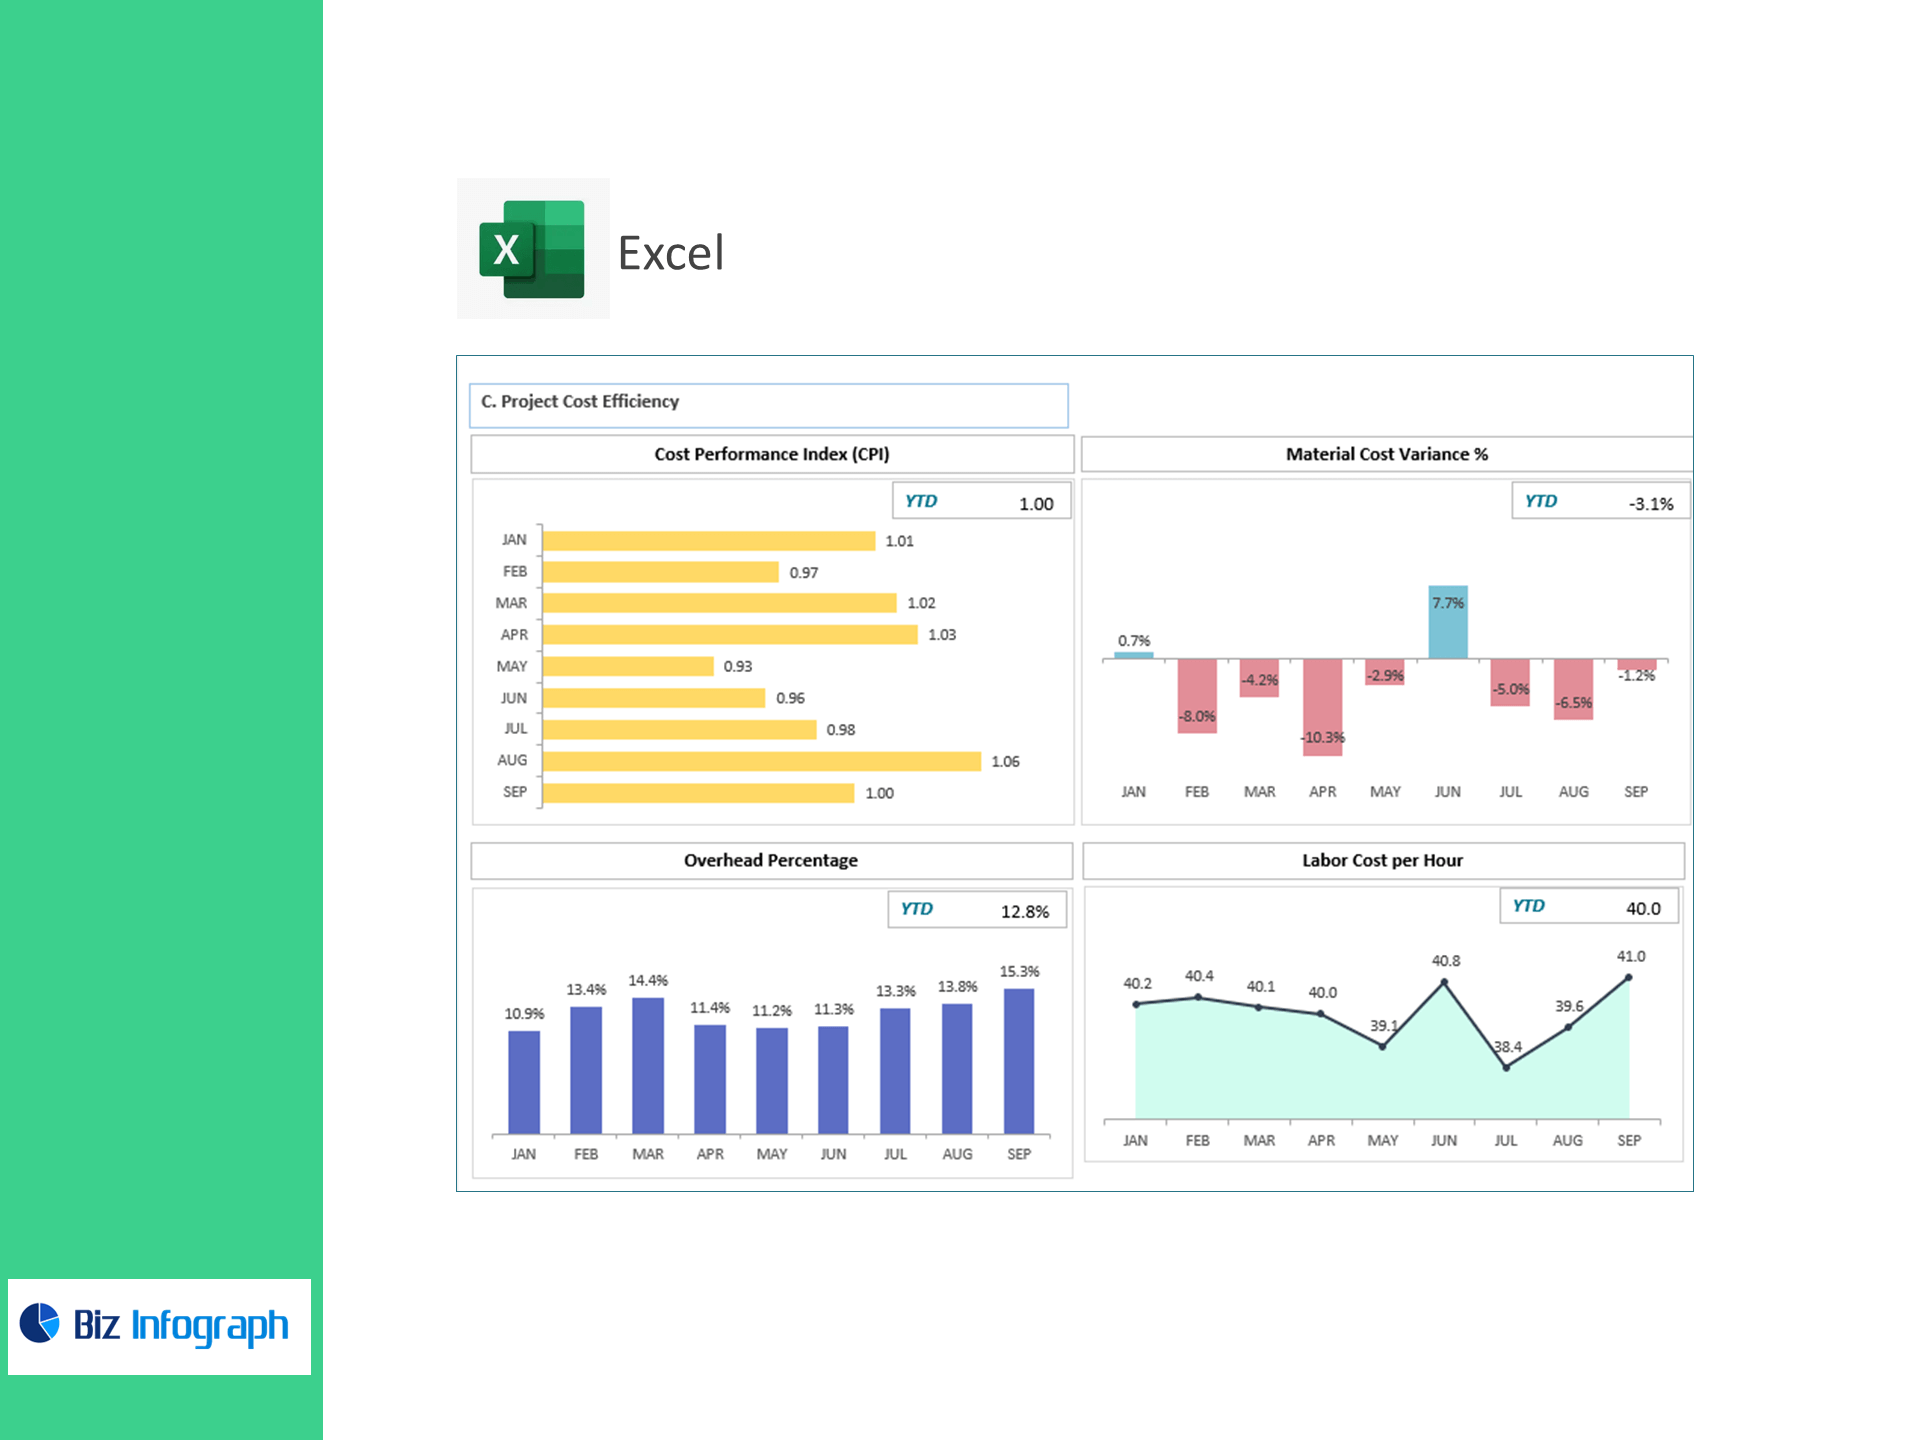
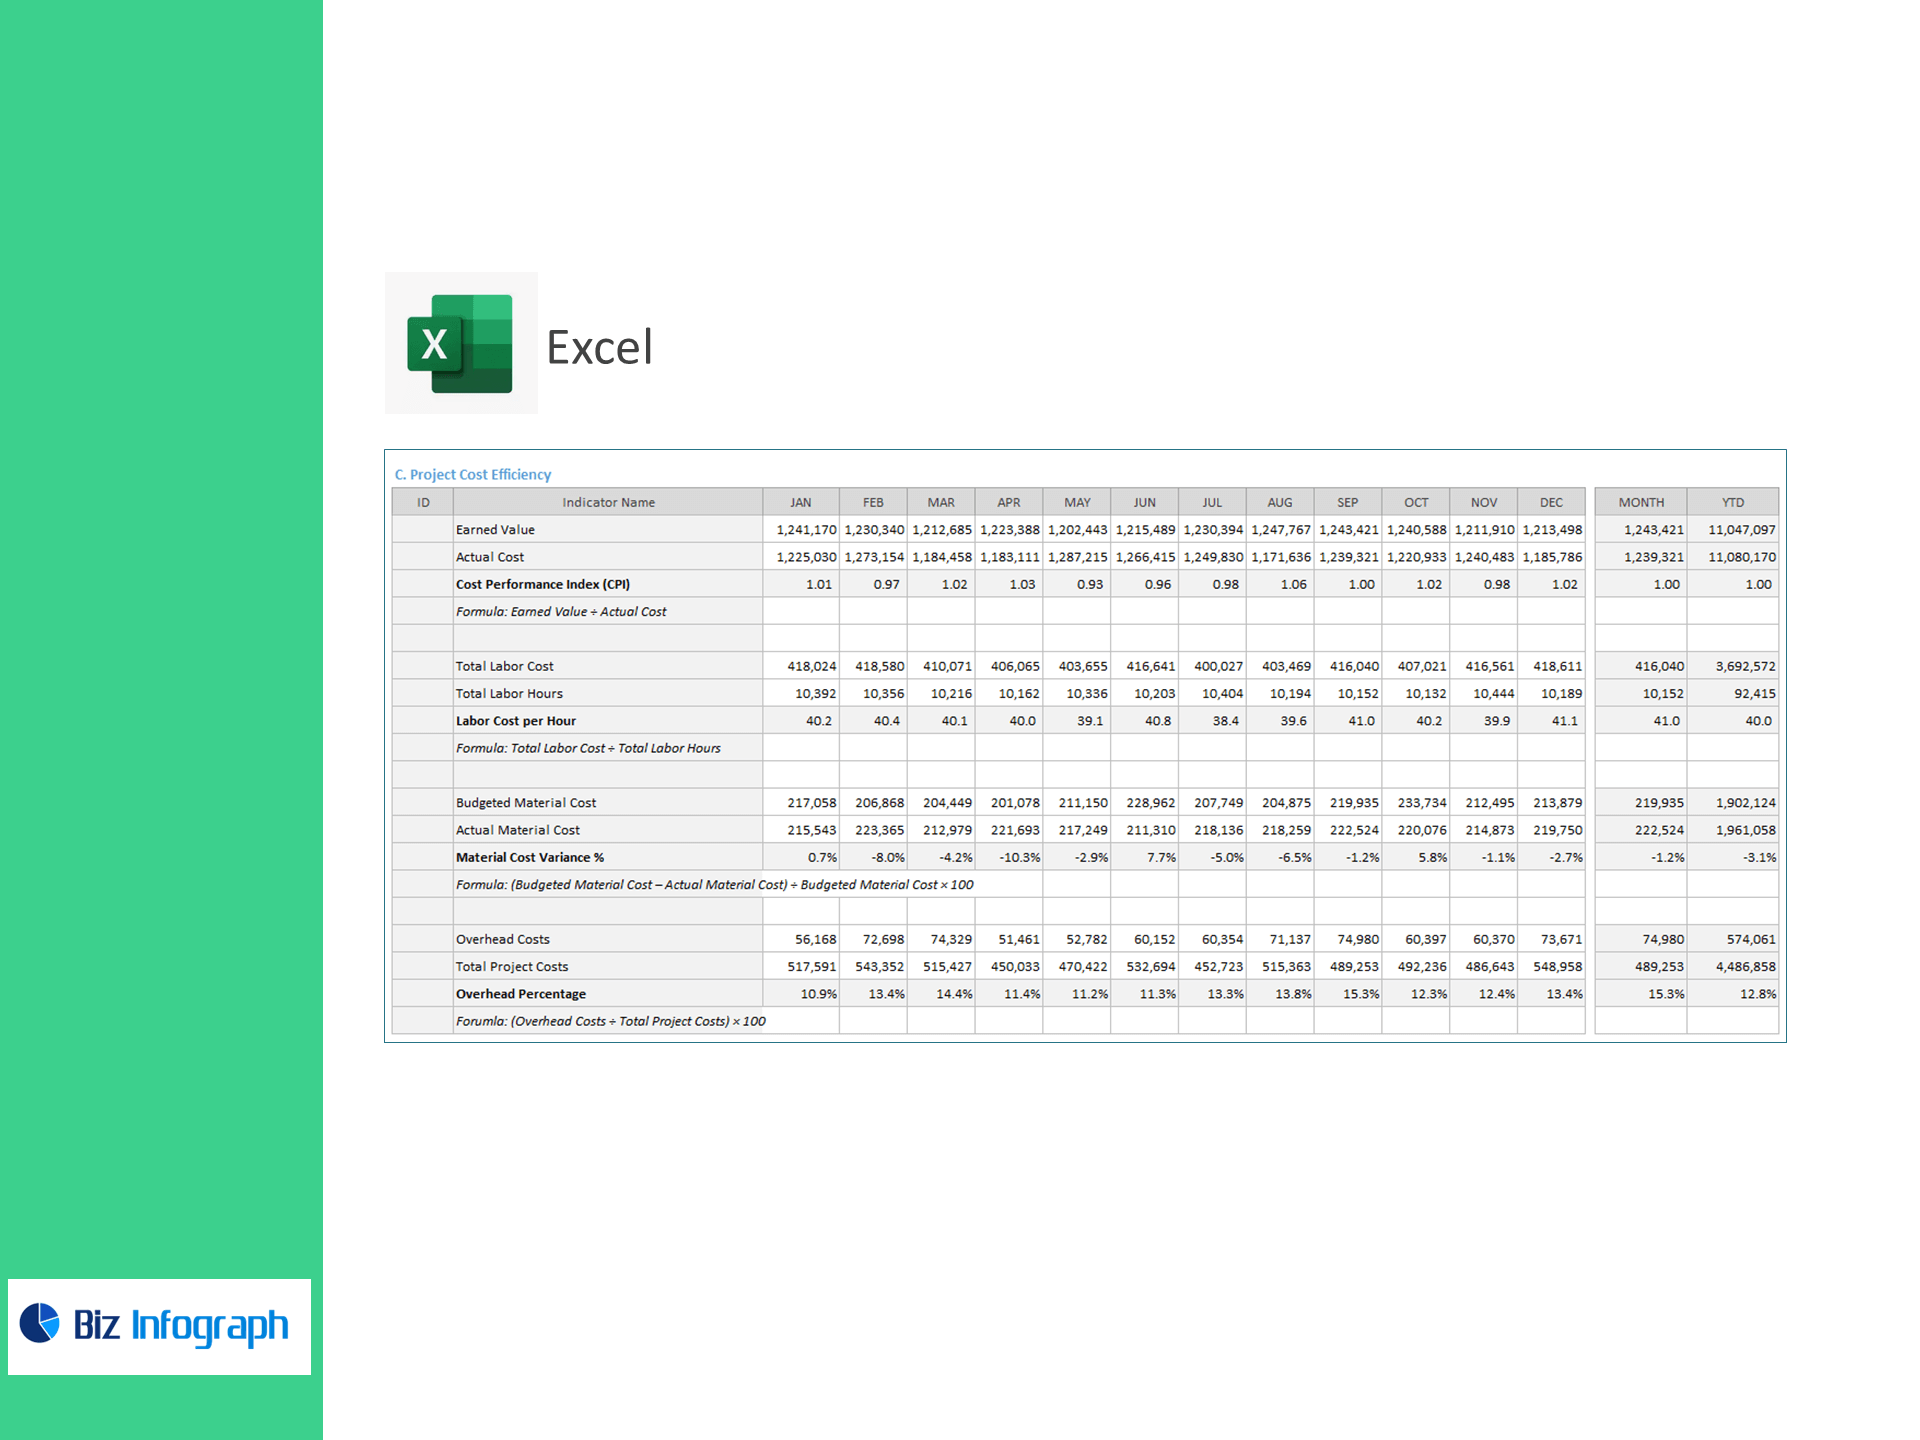
C) Project Cost Efficiency
-
Cost Performance Index (CPI) = Earned Value ÷ Actual Cost
-
Labor Cost per Hour = Total Labor Cost ÷ Labor Hours
-
Material Cost Variance (%) = (Budgeted − Actual Material Cost) ÷ Budgeted × 100
-
Overhead Percentage (%) = Overhead Costs ÷ Total Project Costs × 100
Why teams choose this template
-
Immediate visibility: Paste your CSVs—no macros or add-ins—and the dashboard lights up.
-
Actionable insight: Variance flags and trend lines surface overspend, slow collections, and margin erosion.
-
Project & portfolio ready: Compare jobs, phases, or cost centers and roll them up to a CFO view.
-
Scales with you: Perfect on its own in Excel; easy to pair with Power BI later.
For ready-to-use Dashboard Templates: