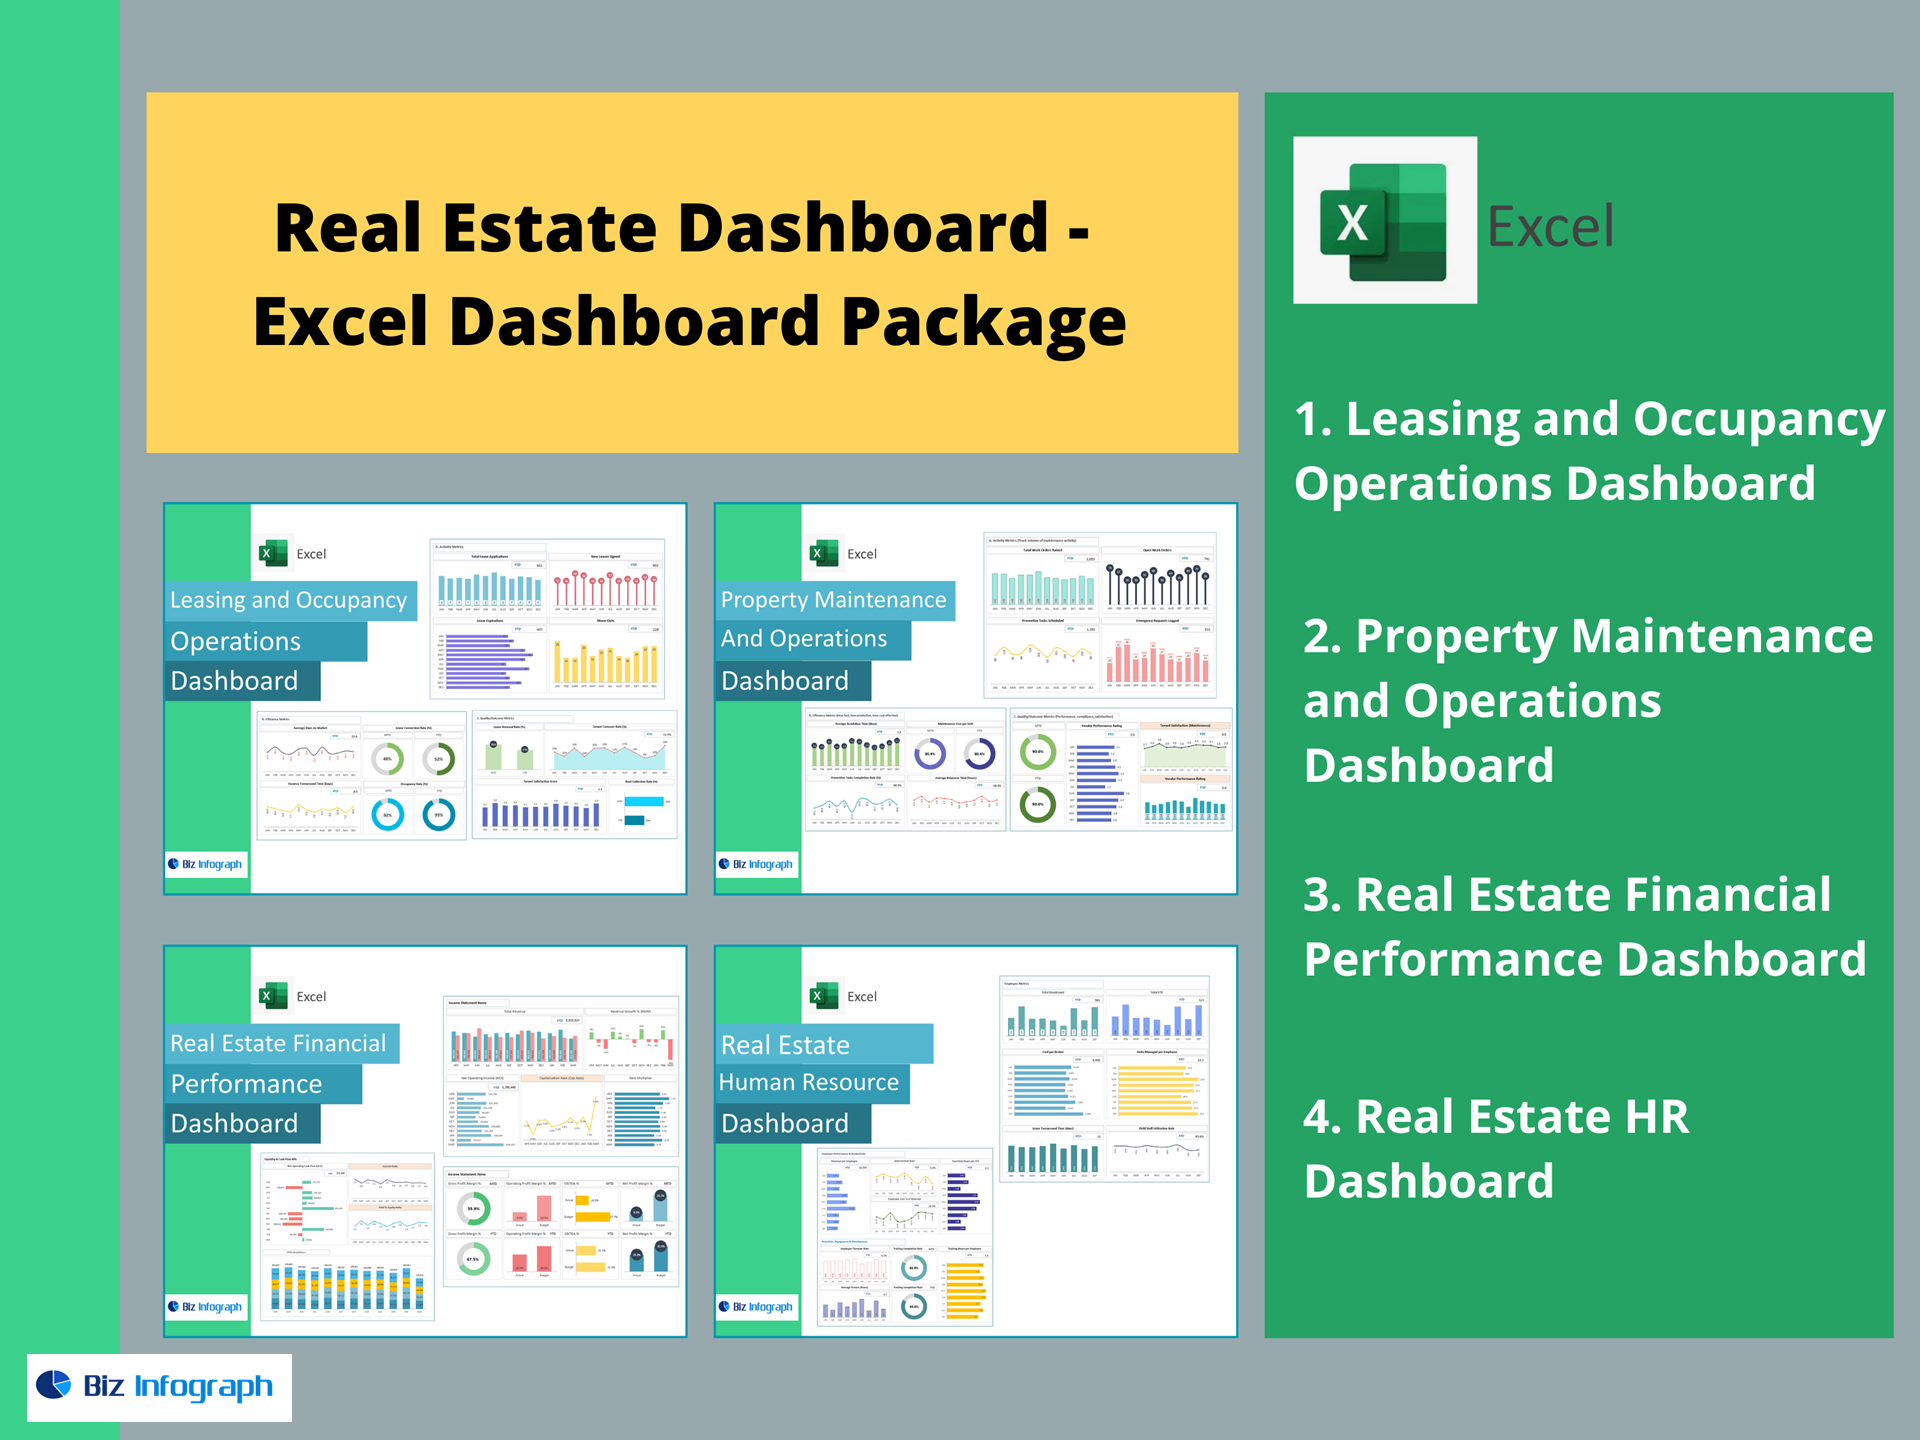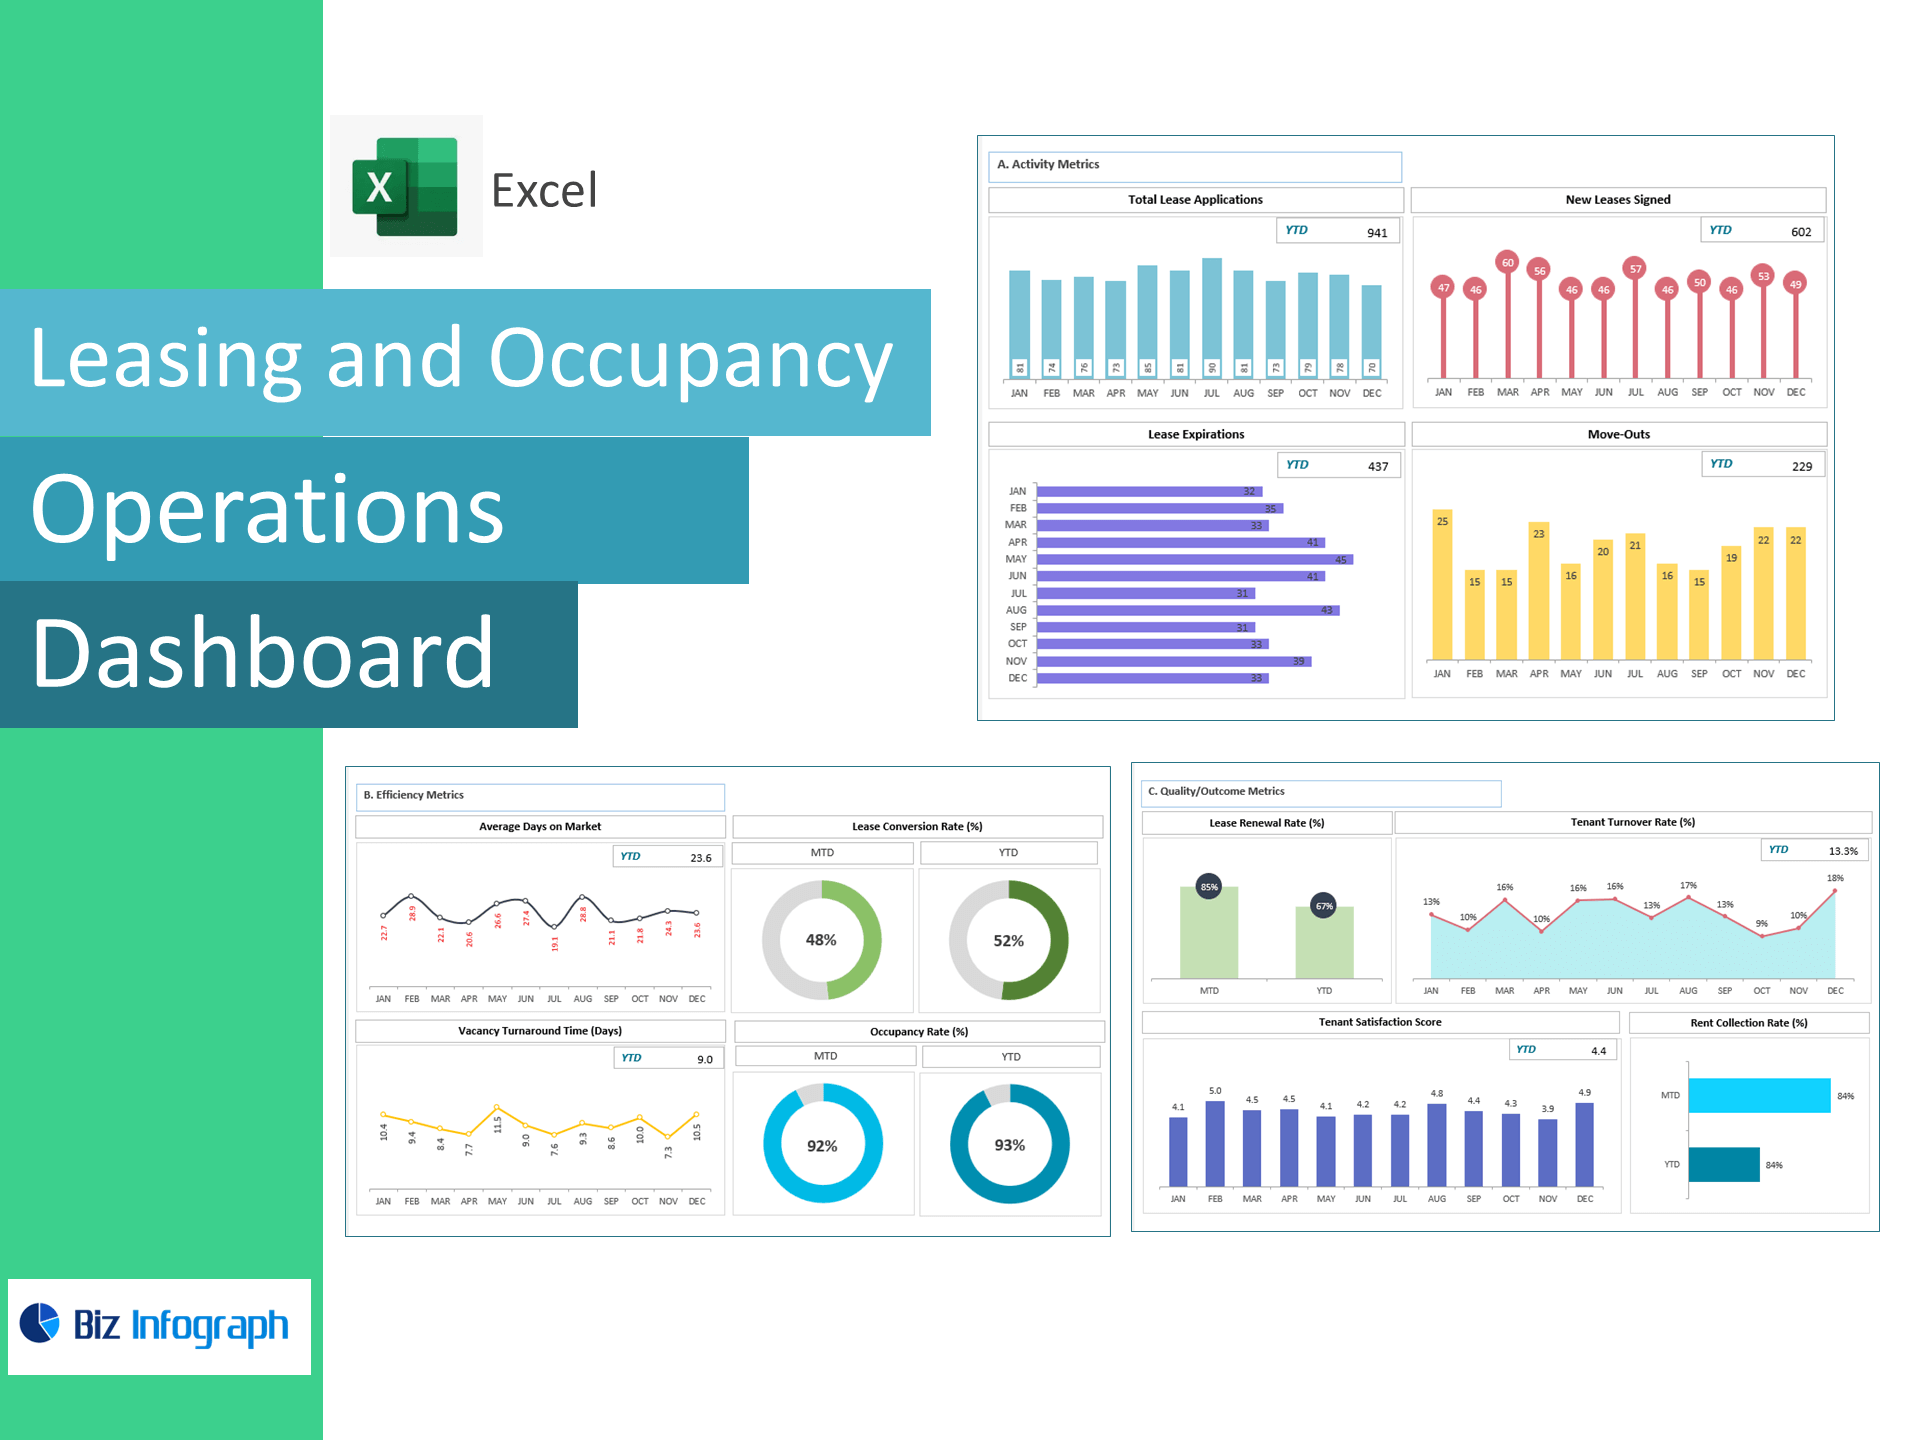
Leasing & Occupancy Operations Dashboard — Excel Template
Accelerate leasing, cut vacancy days, and lift collections—right in Excel. This template converts your leasing, unit-turn, and tenant data into a live, operations-ready dashboard that tracks applications, signed leases, days on market, vacancy turnaround, lease conversion, occupancy, renewals, tenant turnover, rent collection, and tenant satisfaction—so property teams can fill units faster and retain more residents.
Why teams choose this template
-
Pipeline-to-occupancy visibility: See the full journey from application to move-in and renewal.
-
Vacancy control: Monitor Average Days on Market and Vacancy Turnaround Time to reduce lost rent.
-
Revenue protection: Improve Rent Collection Rate and Lease Renewal Rate with clear, actionable metrics.
-
Excel-native: Paste data and go—no add-ins or BI tools required.
KPIs included (with ready-made formulas)
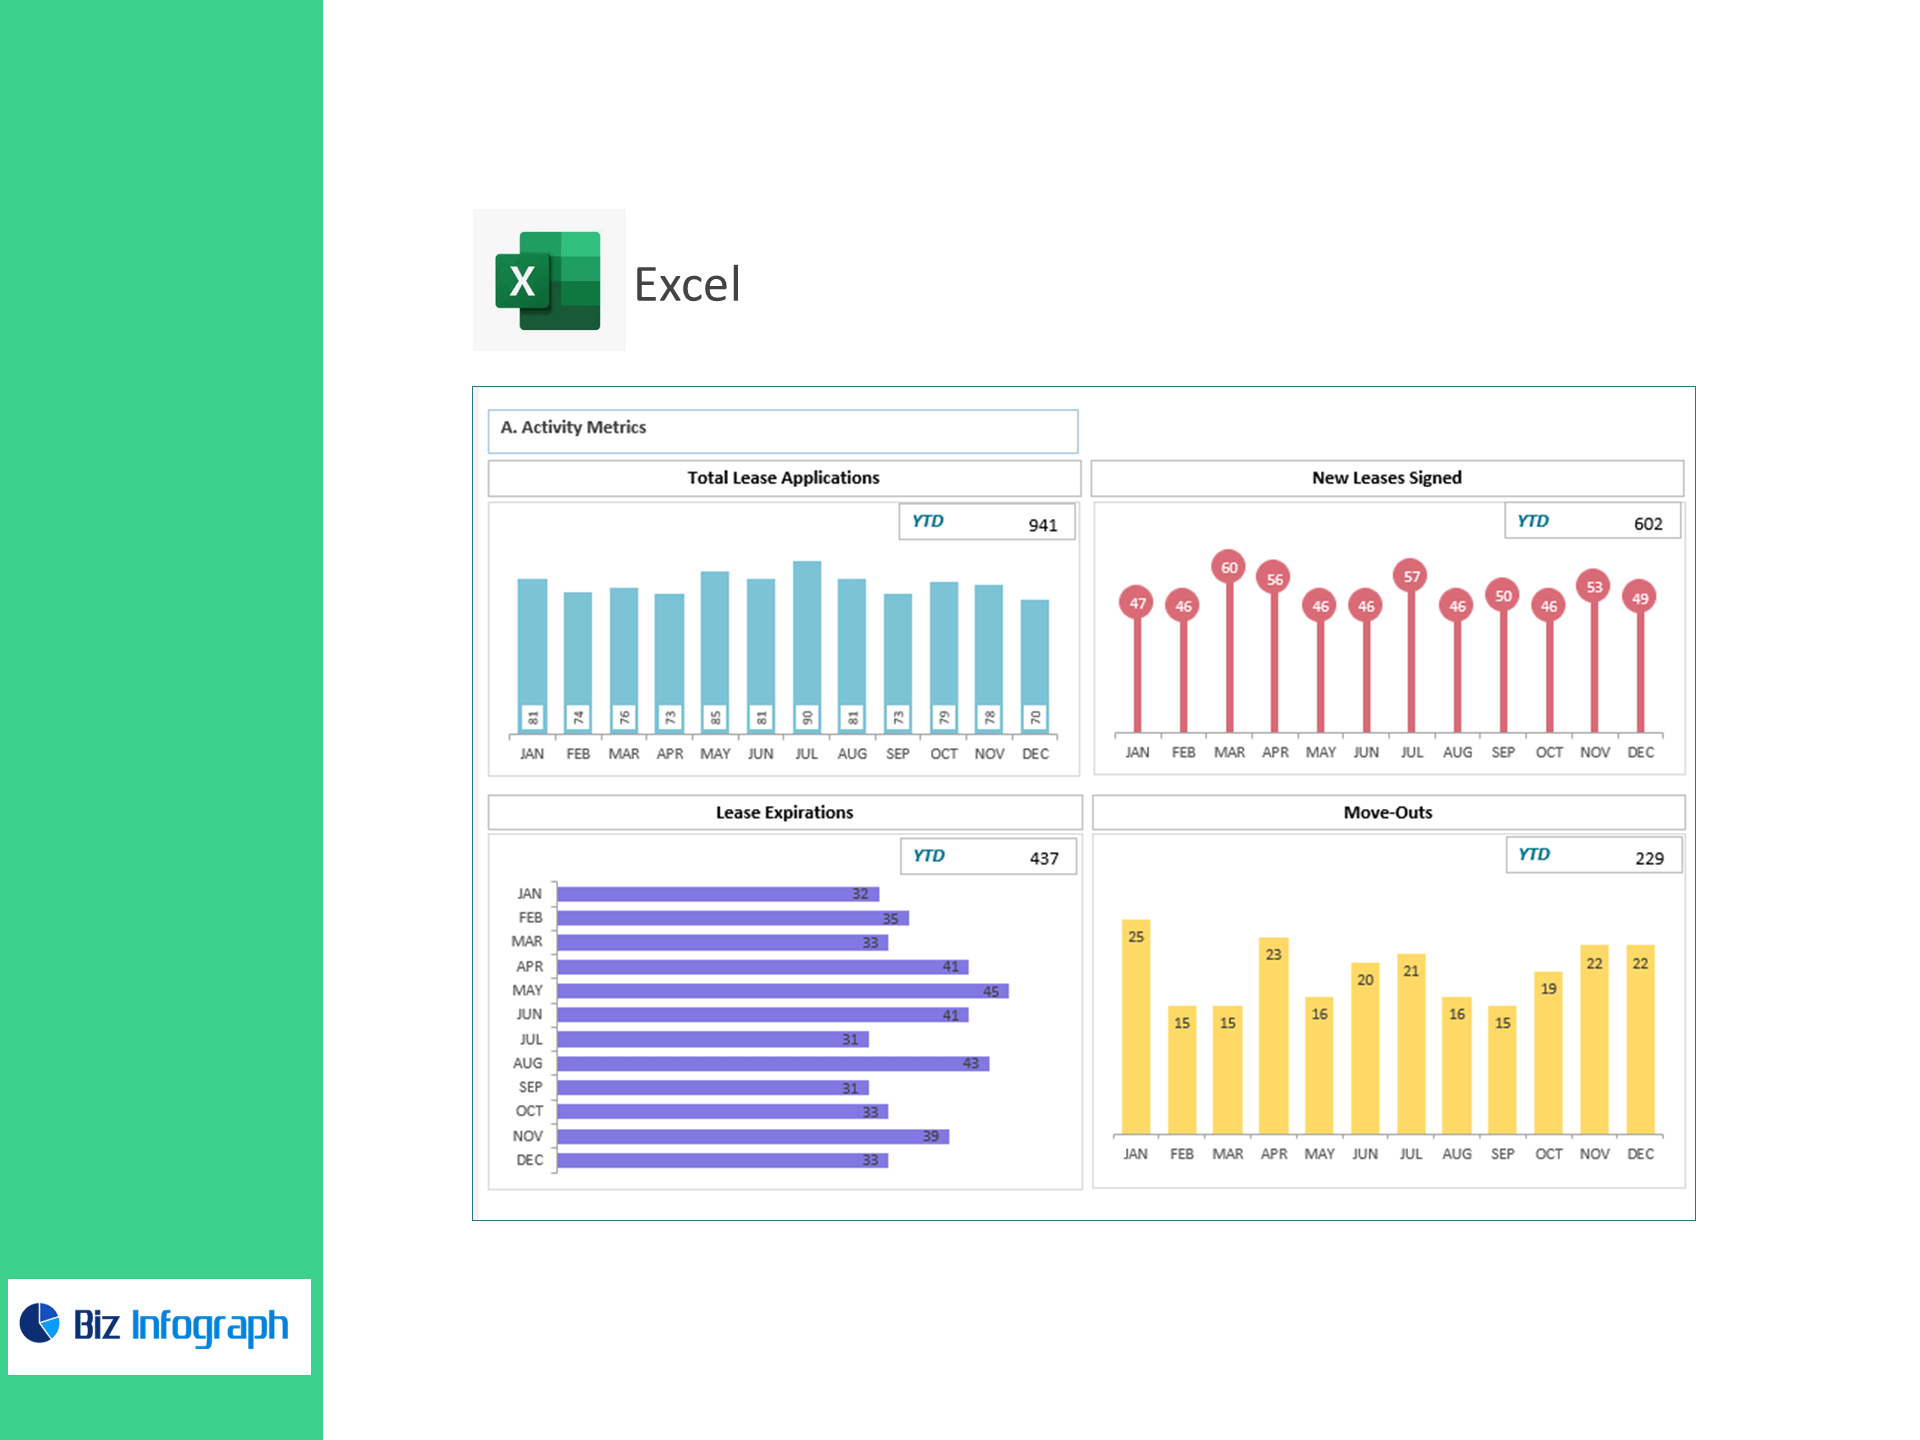
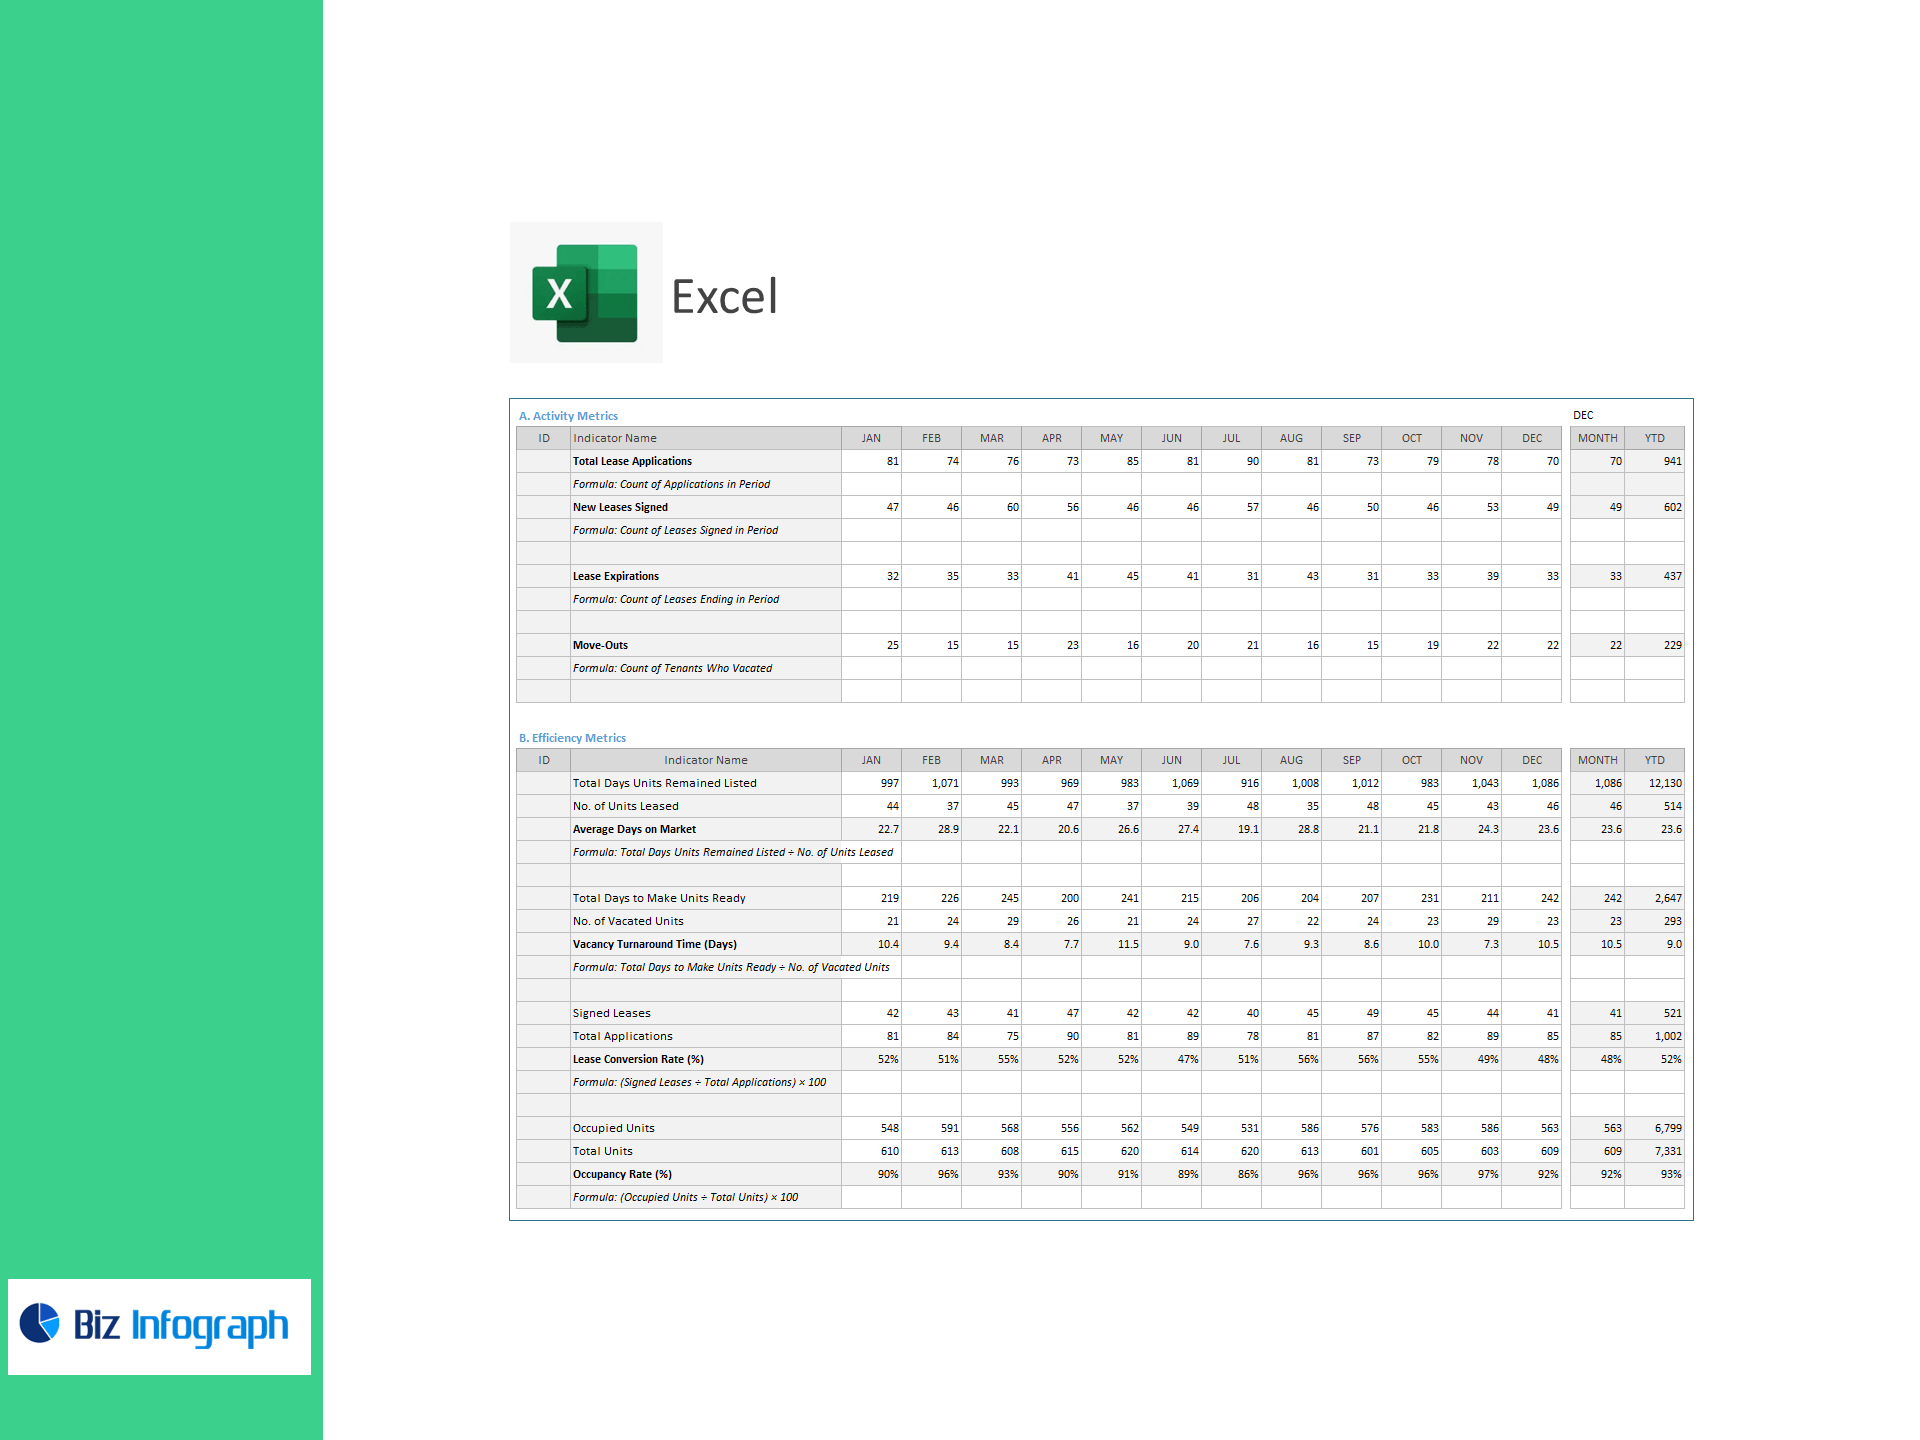
A. Activity Metrics
-
Total Lease Applications — count in period
-
New Leases Signed — count in period
-
Lease Expirations — count of leases ending in period
-
Move-Outs — count of tenants who vacated
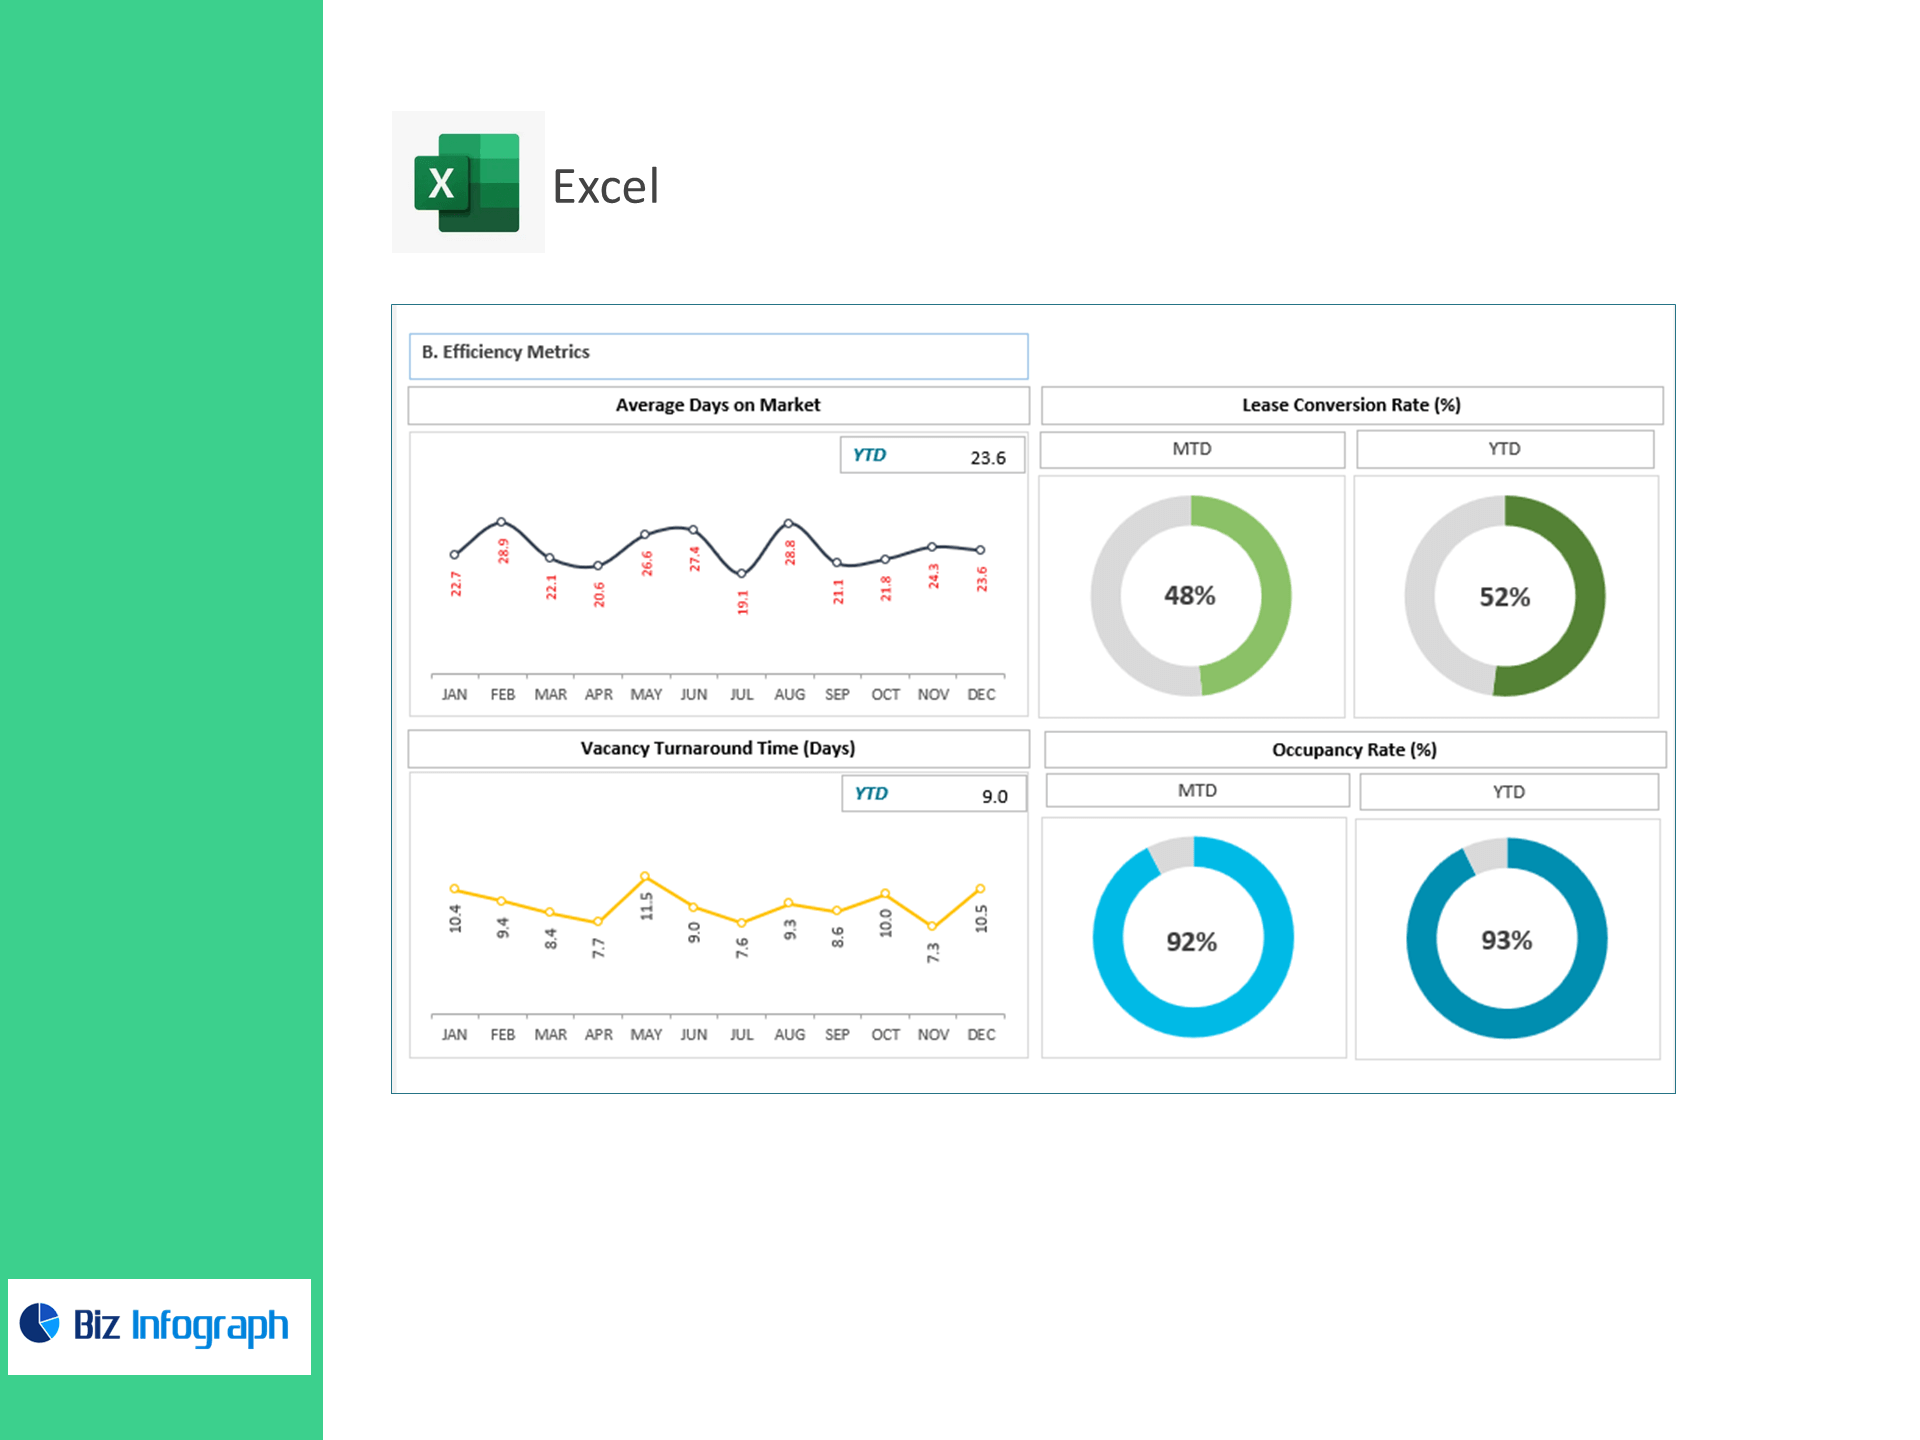
B. Efficiency Metrics
-
Average Days on Market = Total Days Units Remained Listed ÷ No. of Units Leased
-
Vacancy Turnaround Time (Days) = Total Days to Make Units Ready ÷ No. of Vacated Units
-
Lease Conversion Rate (%) = (Signed Leases ÷ Total Applications) × 100
-
Occupancy Rate (%) = (Occupied Units ÷ Total Units) × 100
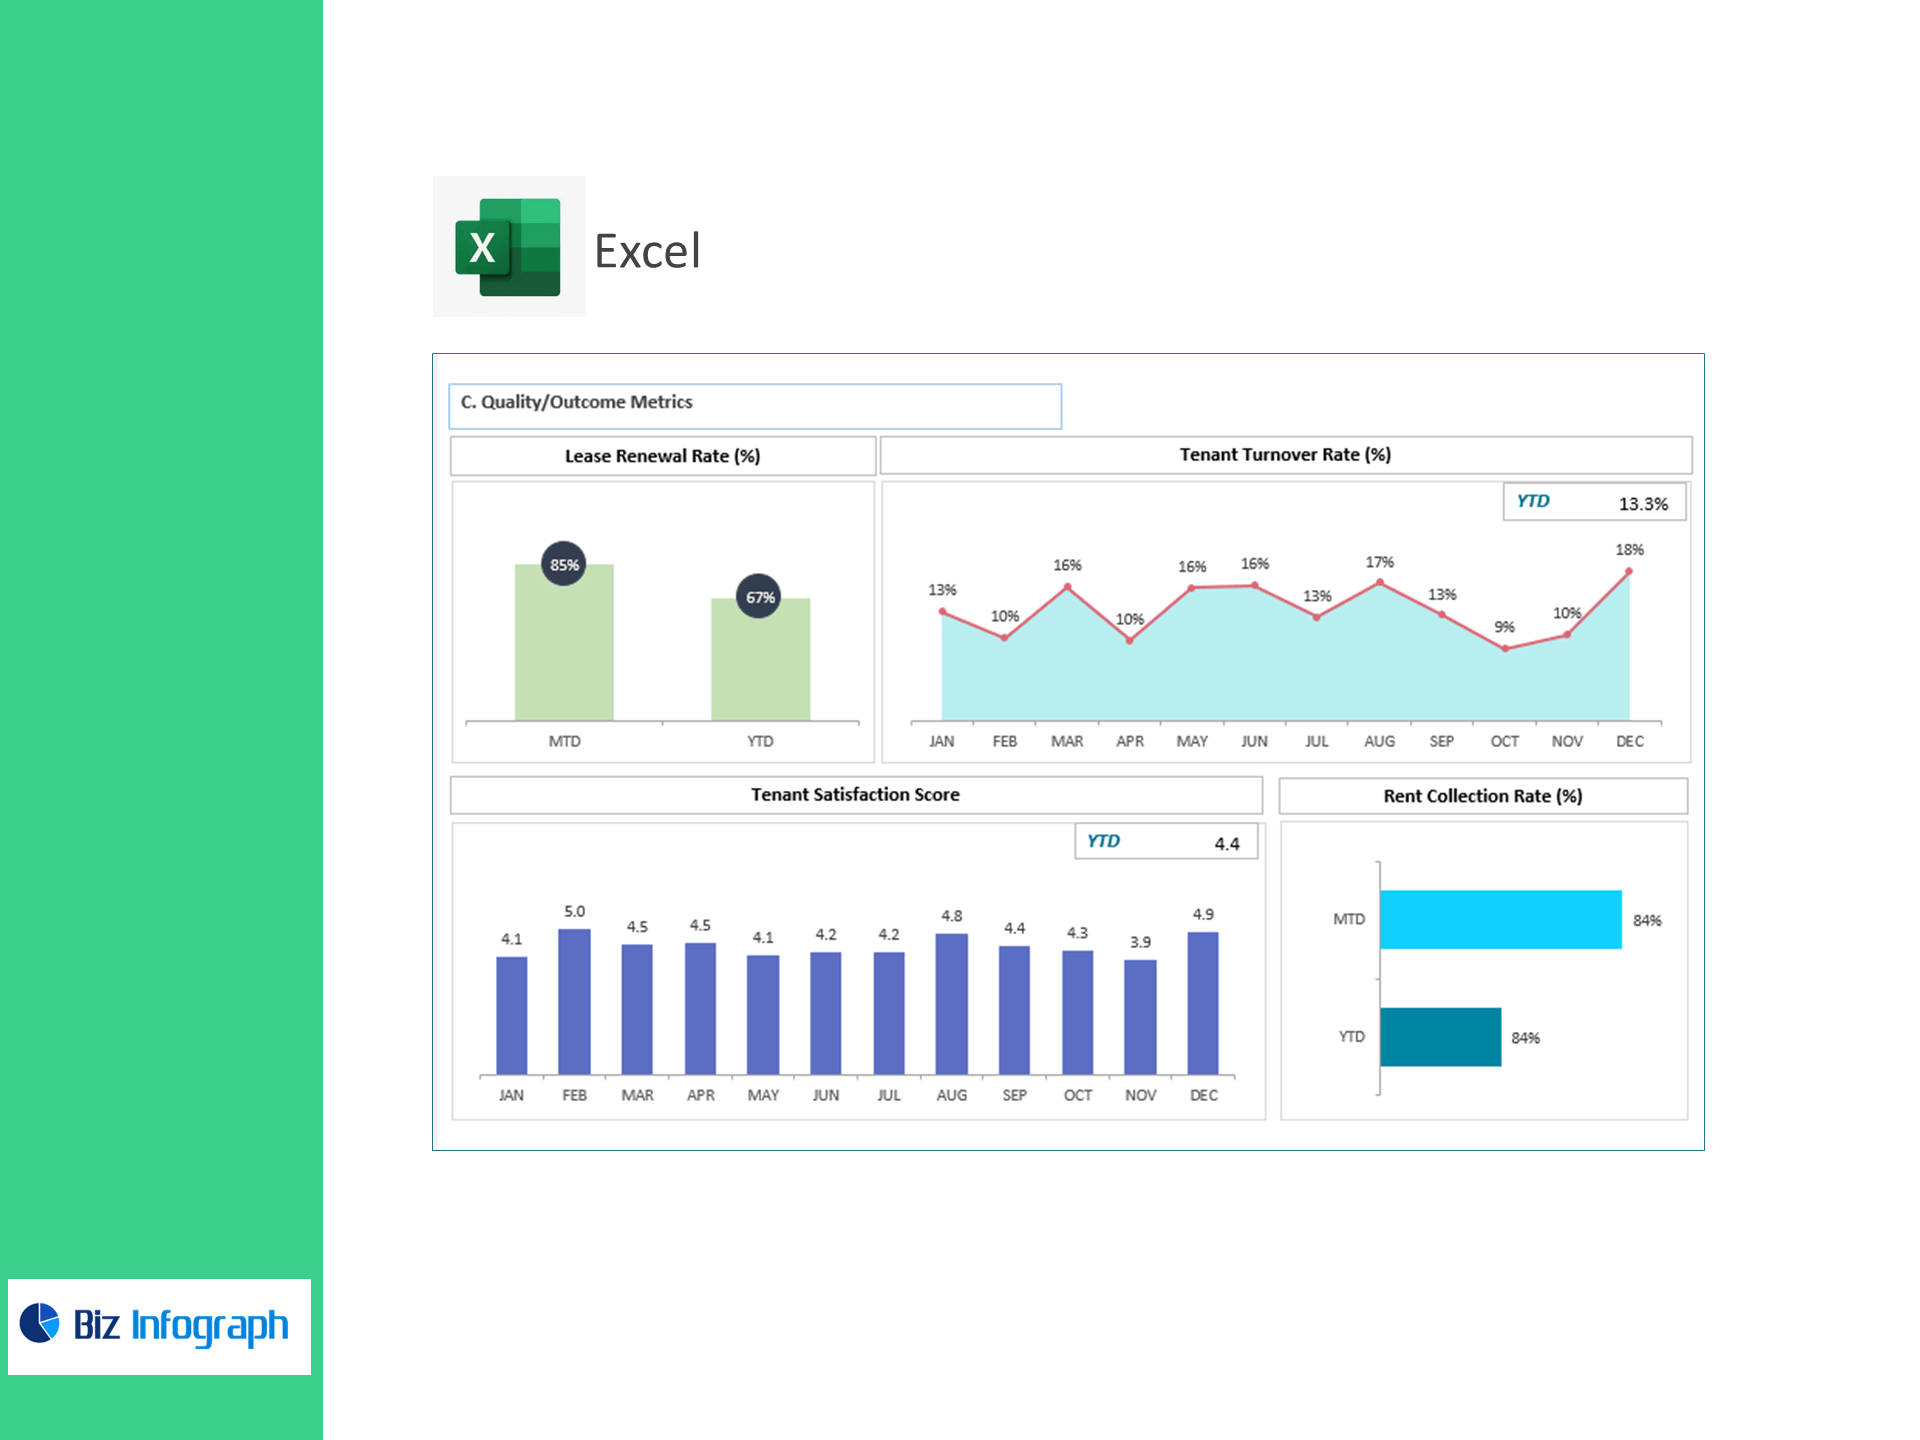
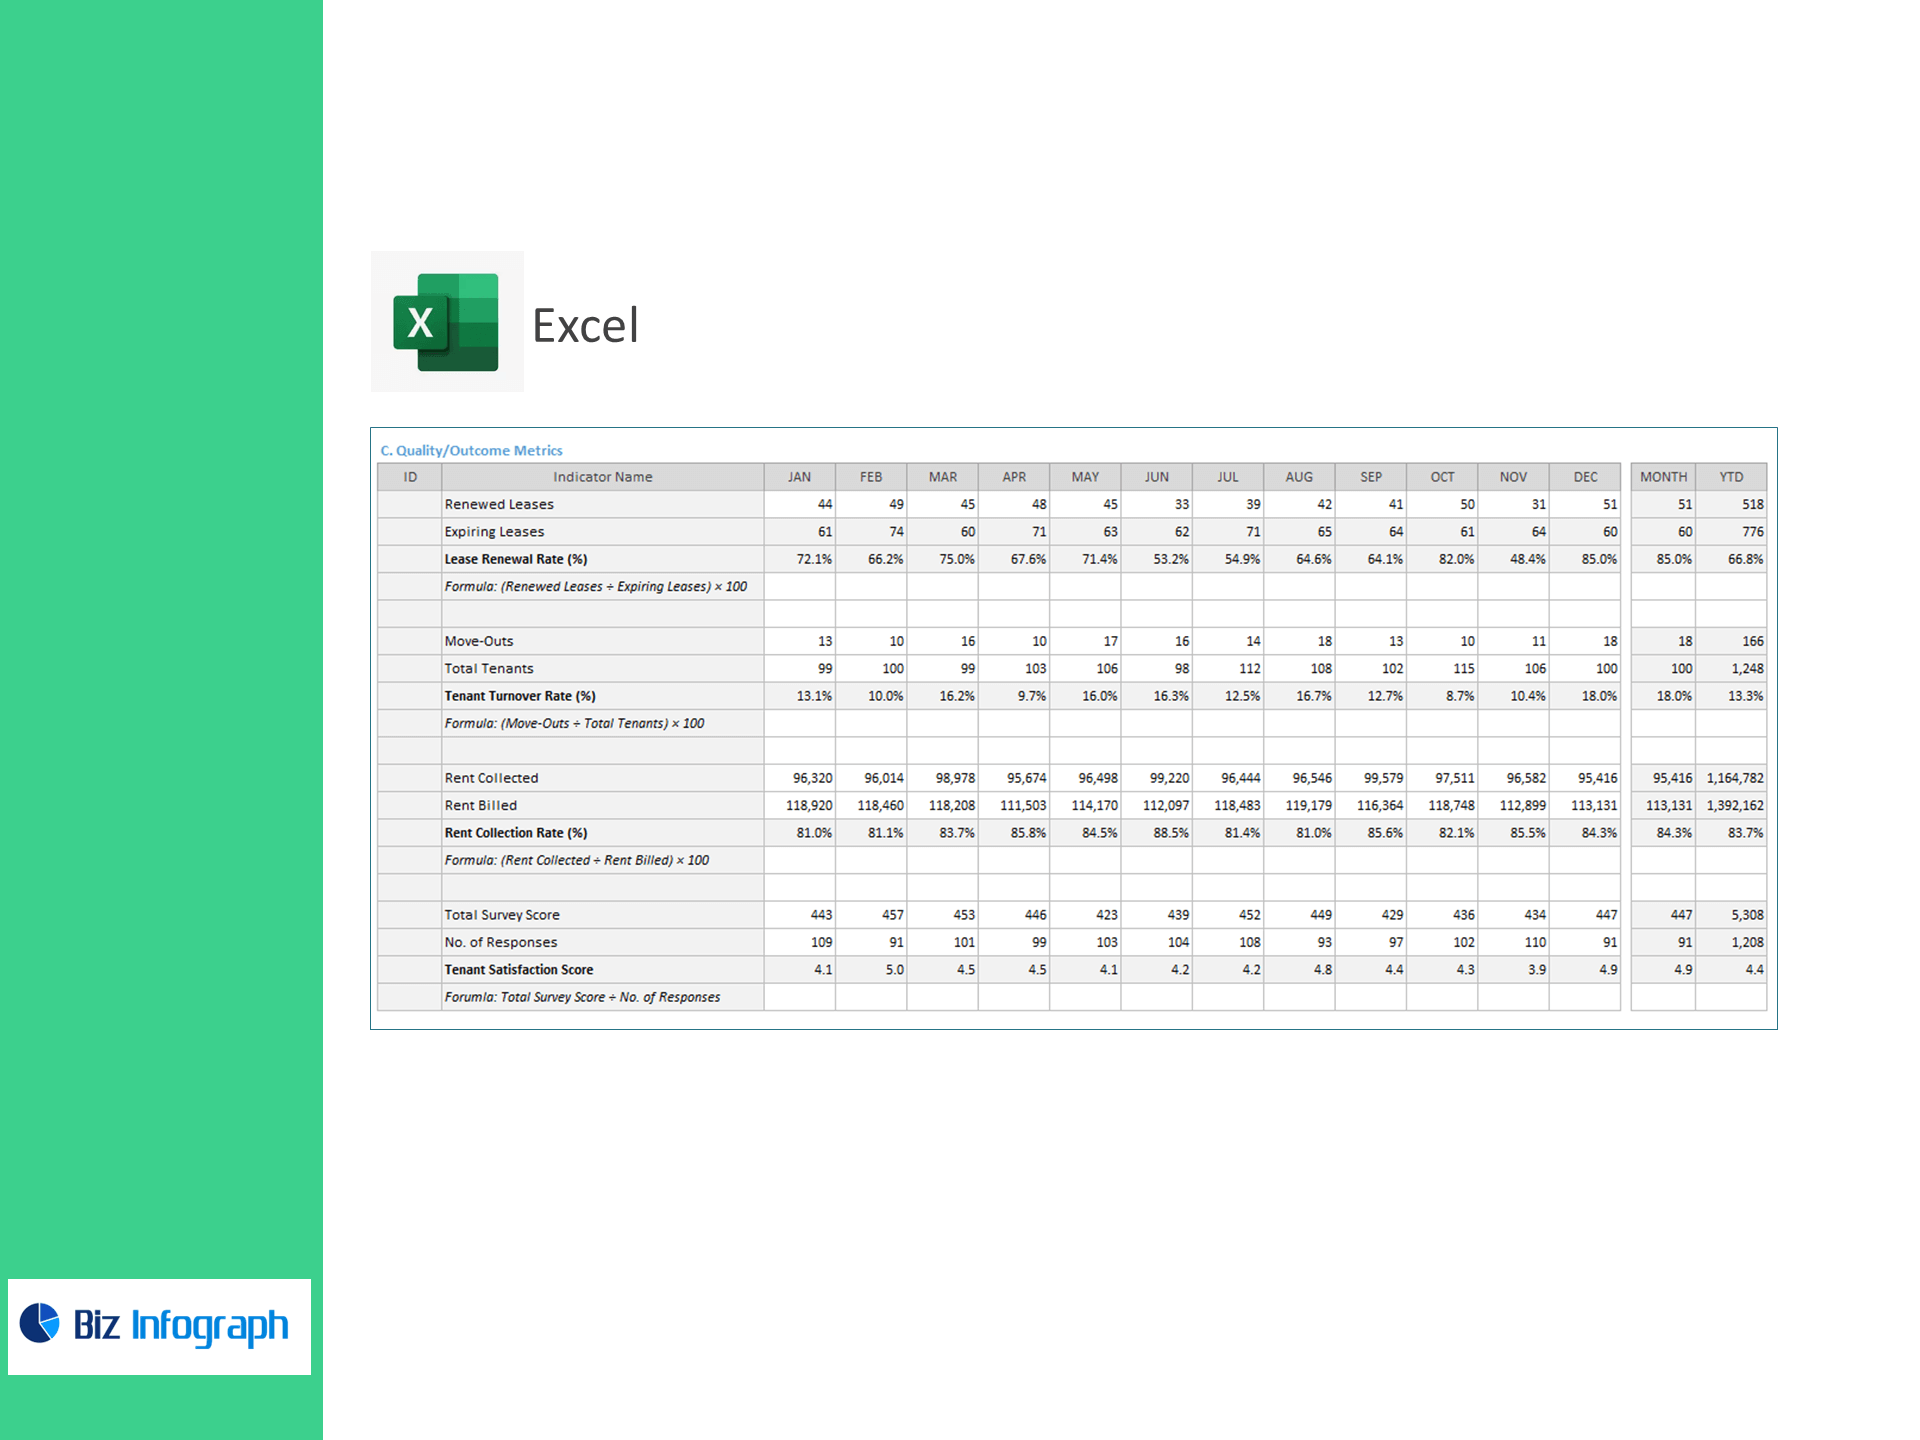
C. Quality / Outcome Metrics
-
Lease Renewal Rate (%) = (Renewed Leases ÷ Expiring Leases) × 100
-
Tenant Turnover Rate (%) = (Move-Outs ÷ Total Tenants) × 100
-
Rent Collection Rate (%) = (Rent Collected ÷ Rent Billed) × 100
-
Tenant Satisfaction Score = Total Survey Score ÷ No. of Responses
What’s inside
-
Executive Dashboard: Tiles and trend lines for Occupancy, Conversion, Days on Market, Vacancy Turnaround, Renewals, Turnover, Collection Rate, and Satisfaction—with variance to target.
-
Leasing Funnel View: Applications → Approvals → Signed Leases, with drop-off analysis.
-
Turn & Readiness Tracker: Time-to-make-ready by property/unit type, bottleneck highlights.
-
Collections Panel: Billed vs. collected and delinquency watch.
-
Resident Experience Hub: Satisfaction trends alongside renewals and turnover.
-
Targets & Assumptions: Set KPI targets once; automatic Above/Below Target status.
-
Clean Data Sheets: Import-ready tables for Applications, Leases, Units/Turns, Occupancy, Billing/Collections, and Surveys.
How it works
-
Paste your monthly (or weekly) data into the provided tables.
-
Set portfolio targets and reporting periods.
-
Review the dashboard to prioritize unit turns, leasing follow-ups, renewals, and collections.
Benefits
-
Fill faster: Lower Days on Market and Turnaround Time to reduce vacancy loss.
-
Improve stability: Lift Renewal Rate and reduce Tenant Turnover.
-
Protect cash: Raise Rent Collection Rate and spotlight delinquency risk early.
-
Act with confidence: Pinpoint bottlenecks across properties and unit types.
For ready-to-use Dashboard Templates: