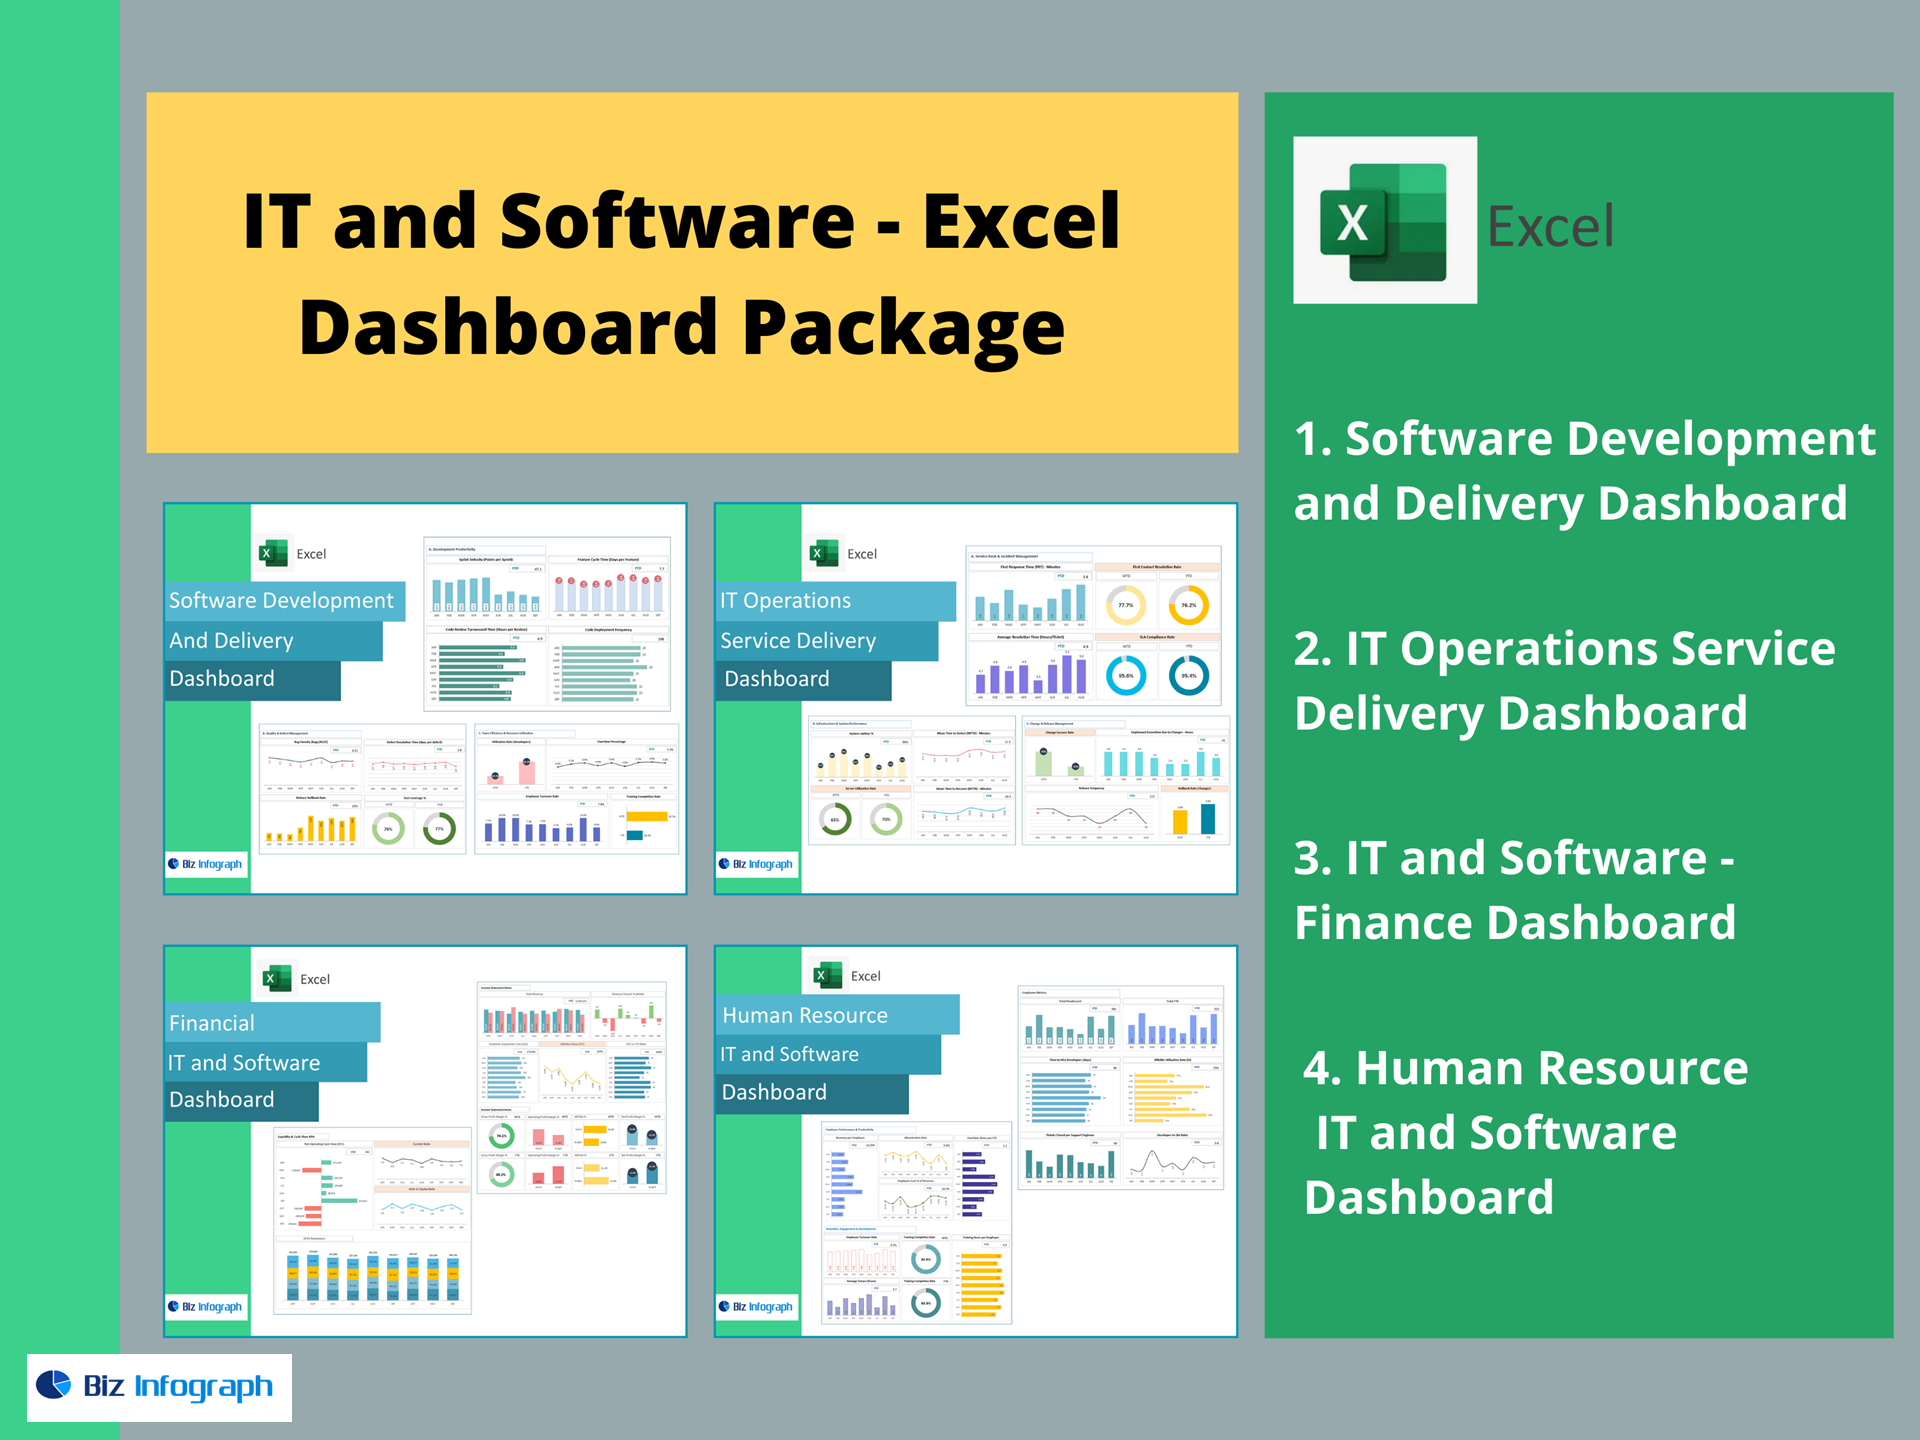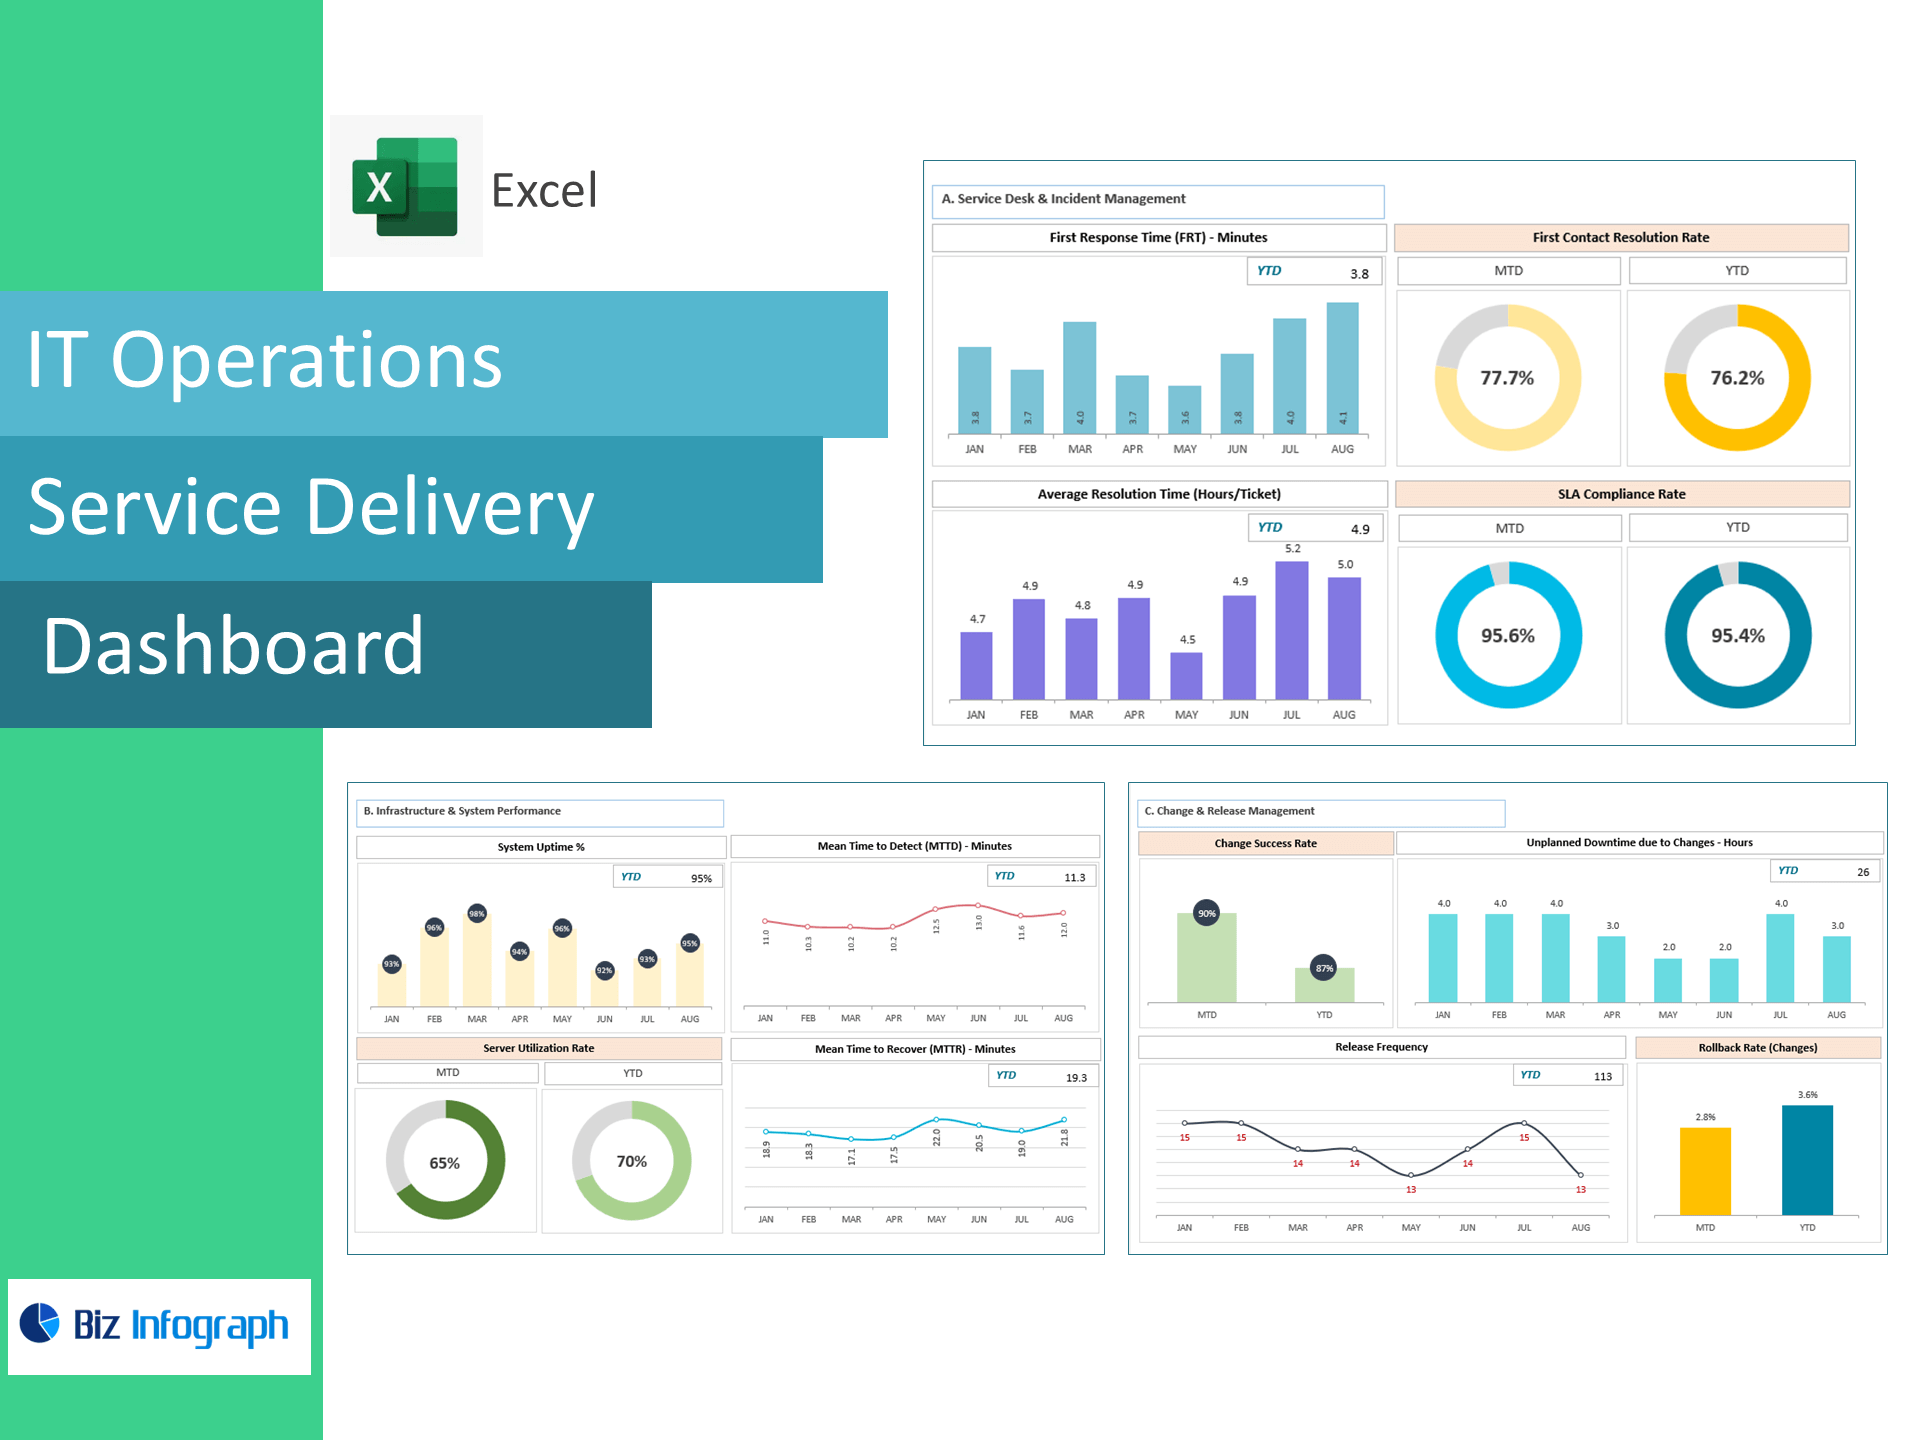
IT Operations Service Delivery Dashboard — Excel Template
Resolve incidents faster, maximize uptime, and prove SLA performance. This plug-and-play Excel dashboard transforms raw ITSM/exported logs into clean visuals for Service Desk, Infrastructure & System Performance, and Change/Release KPIs—so Ops leaders, SREs, and MSPs can monitor reliability, spot bottlenecks, and drive continuous improvement.
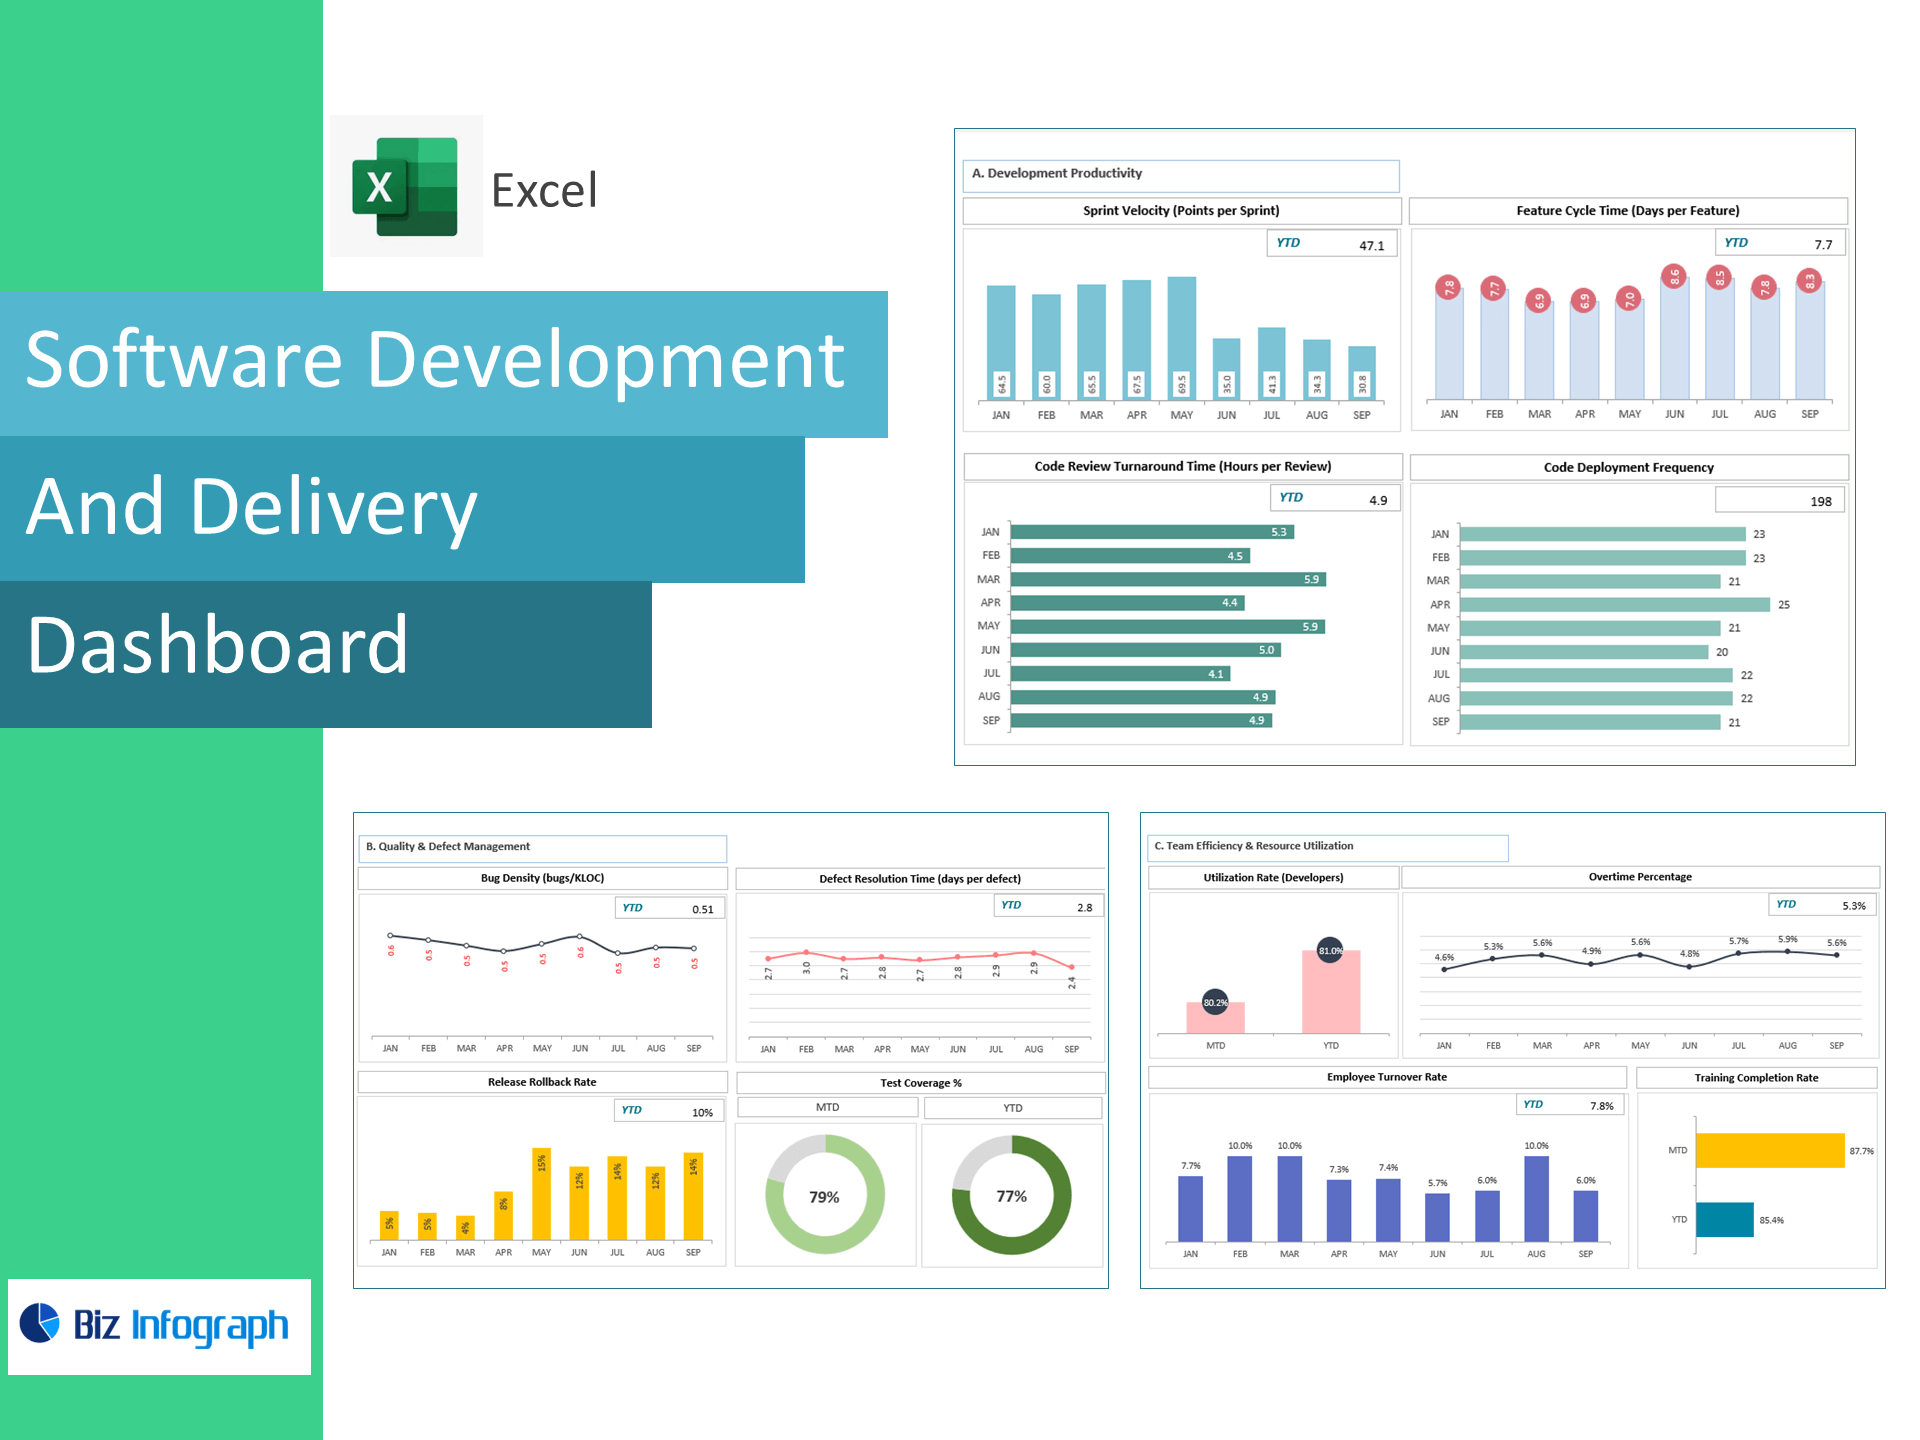
What it tracks (pre-built KPIs)
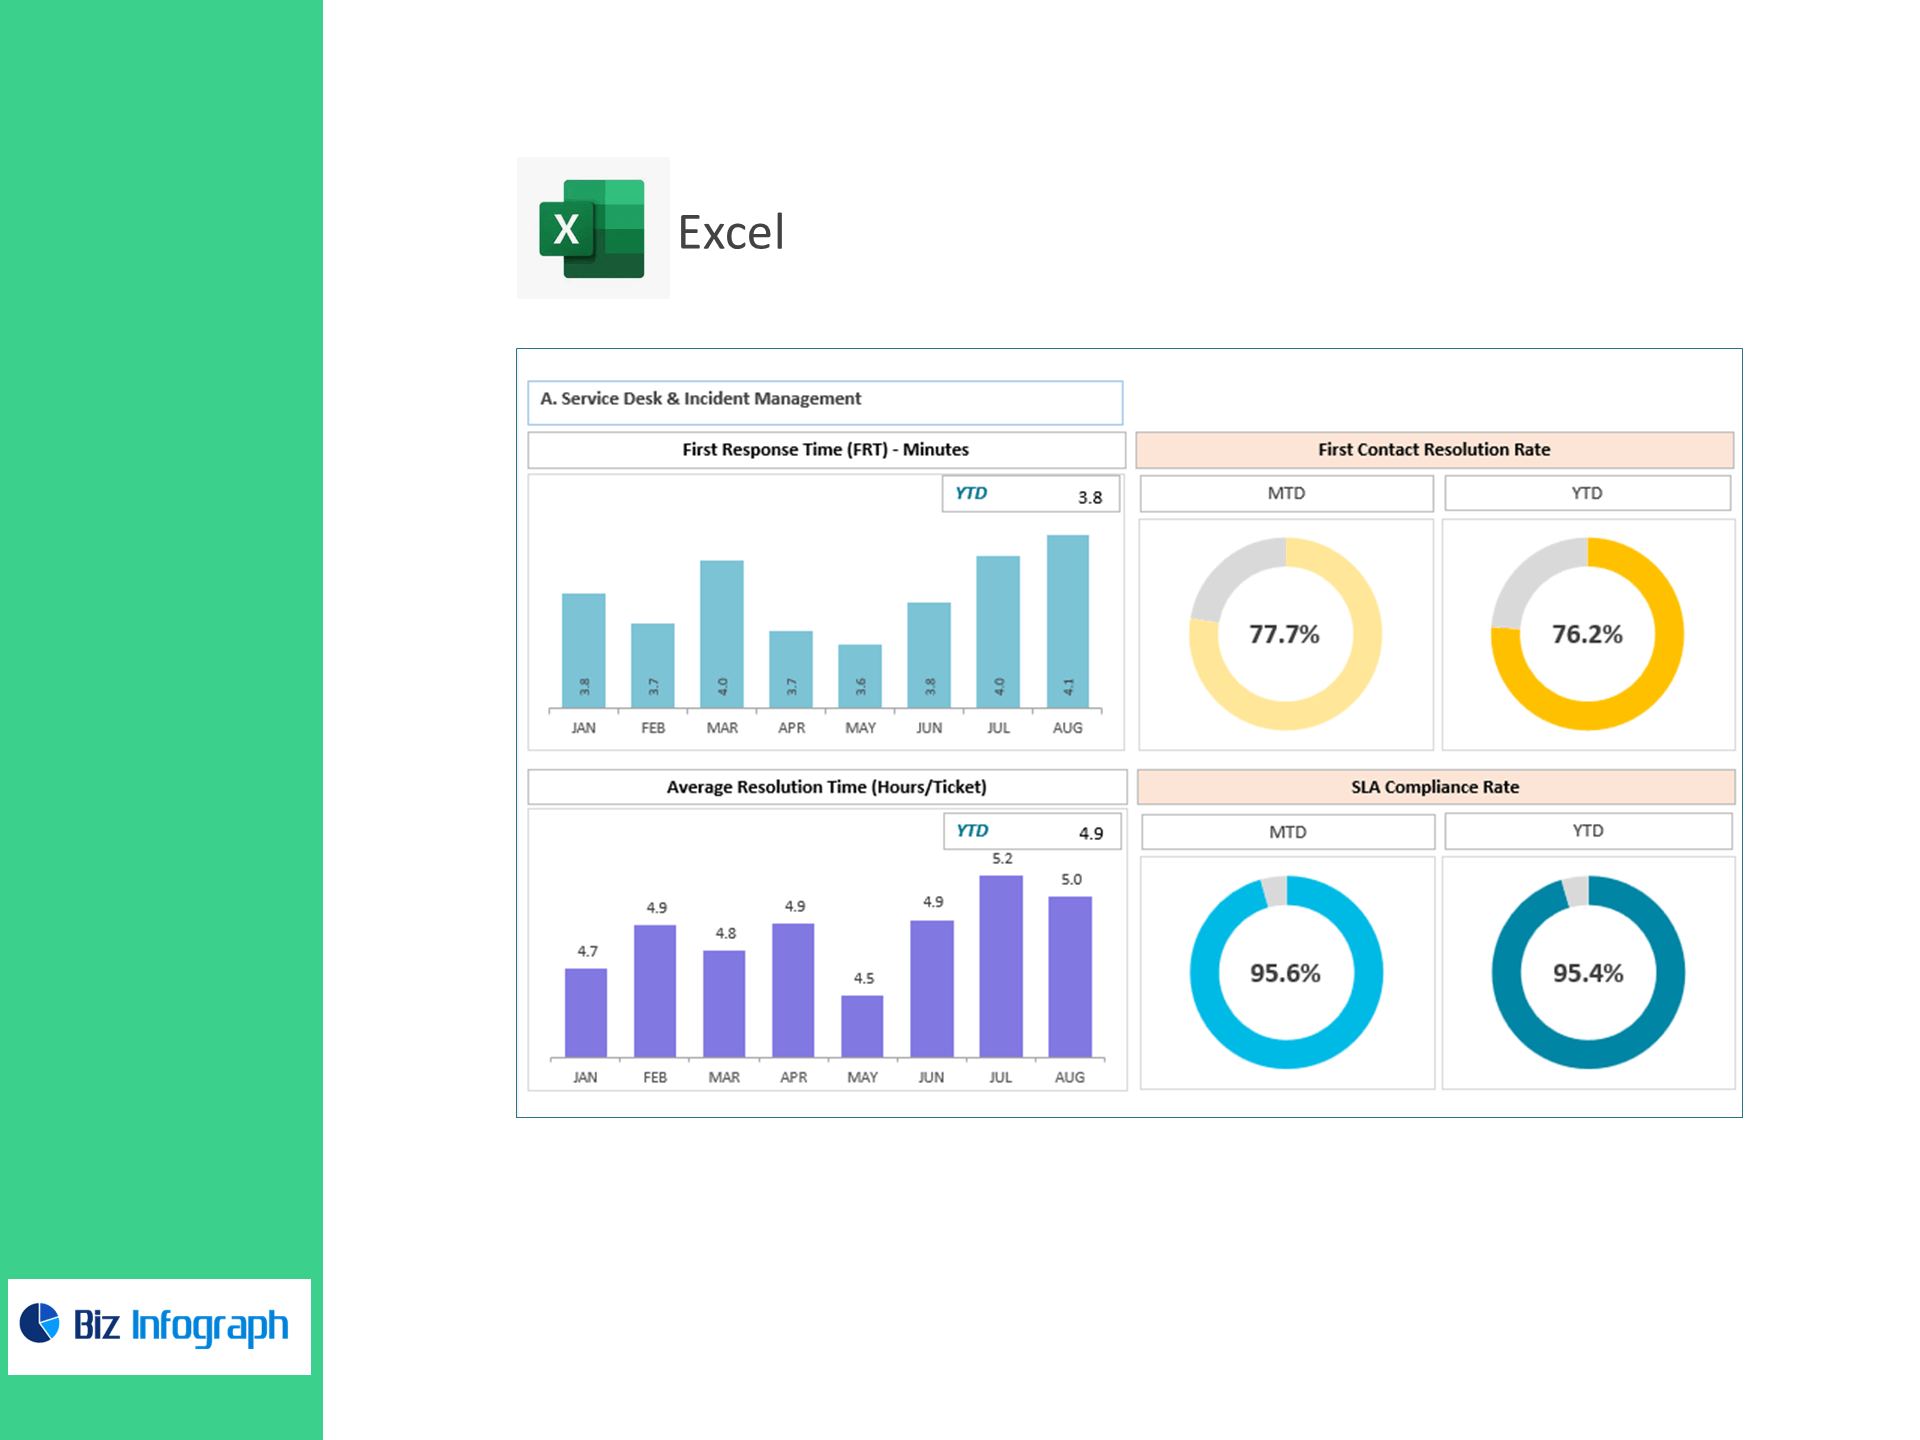
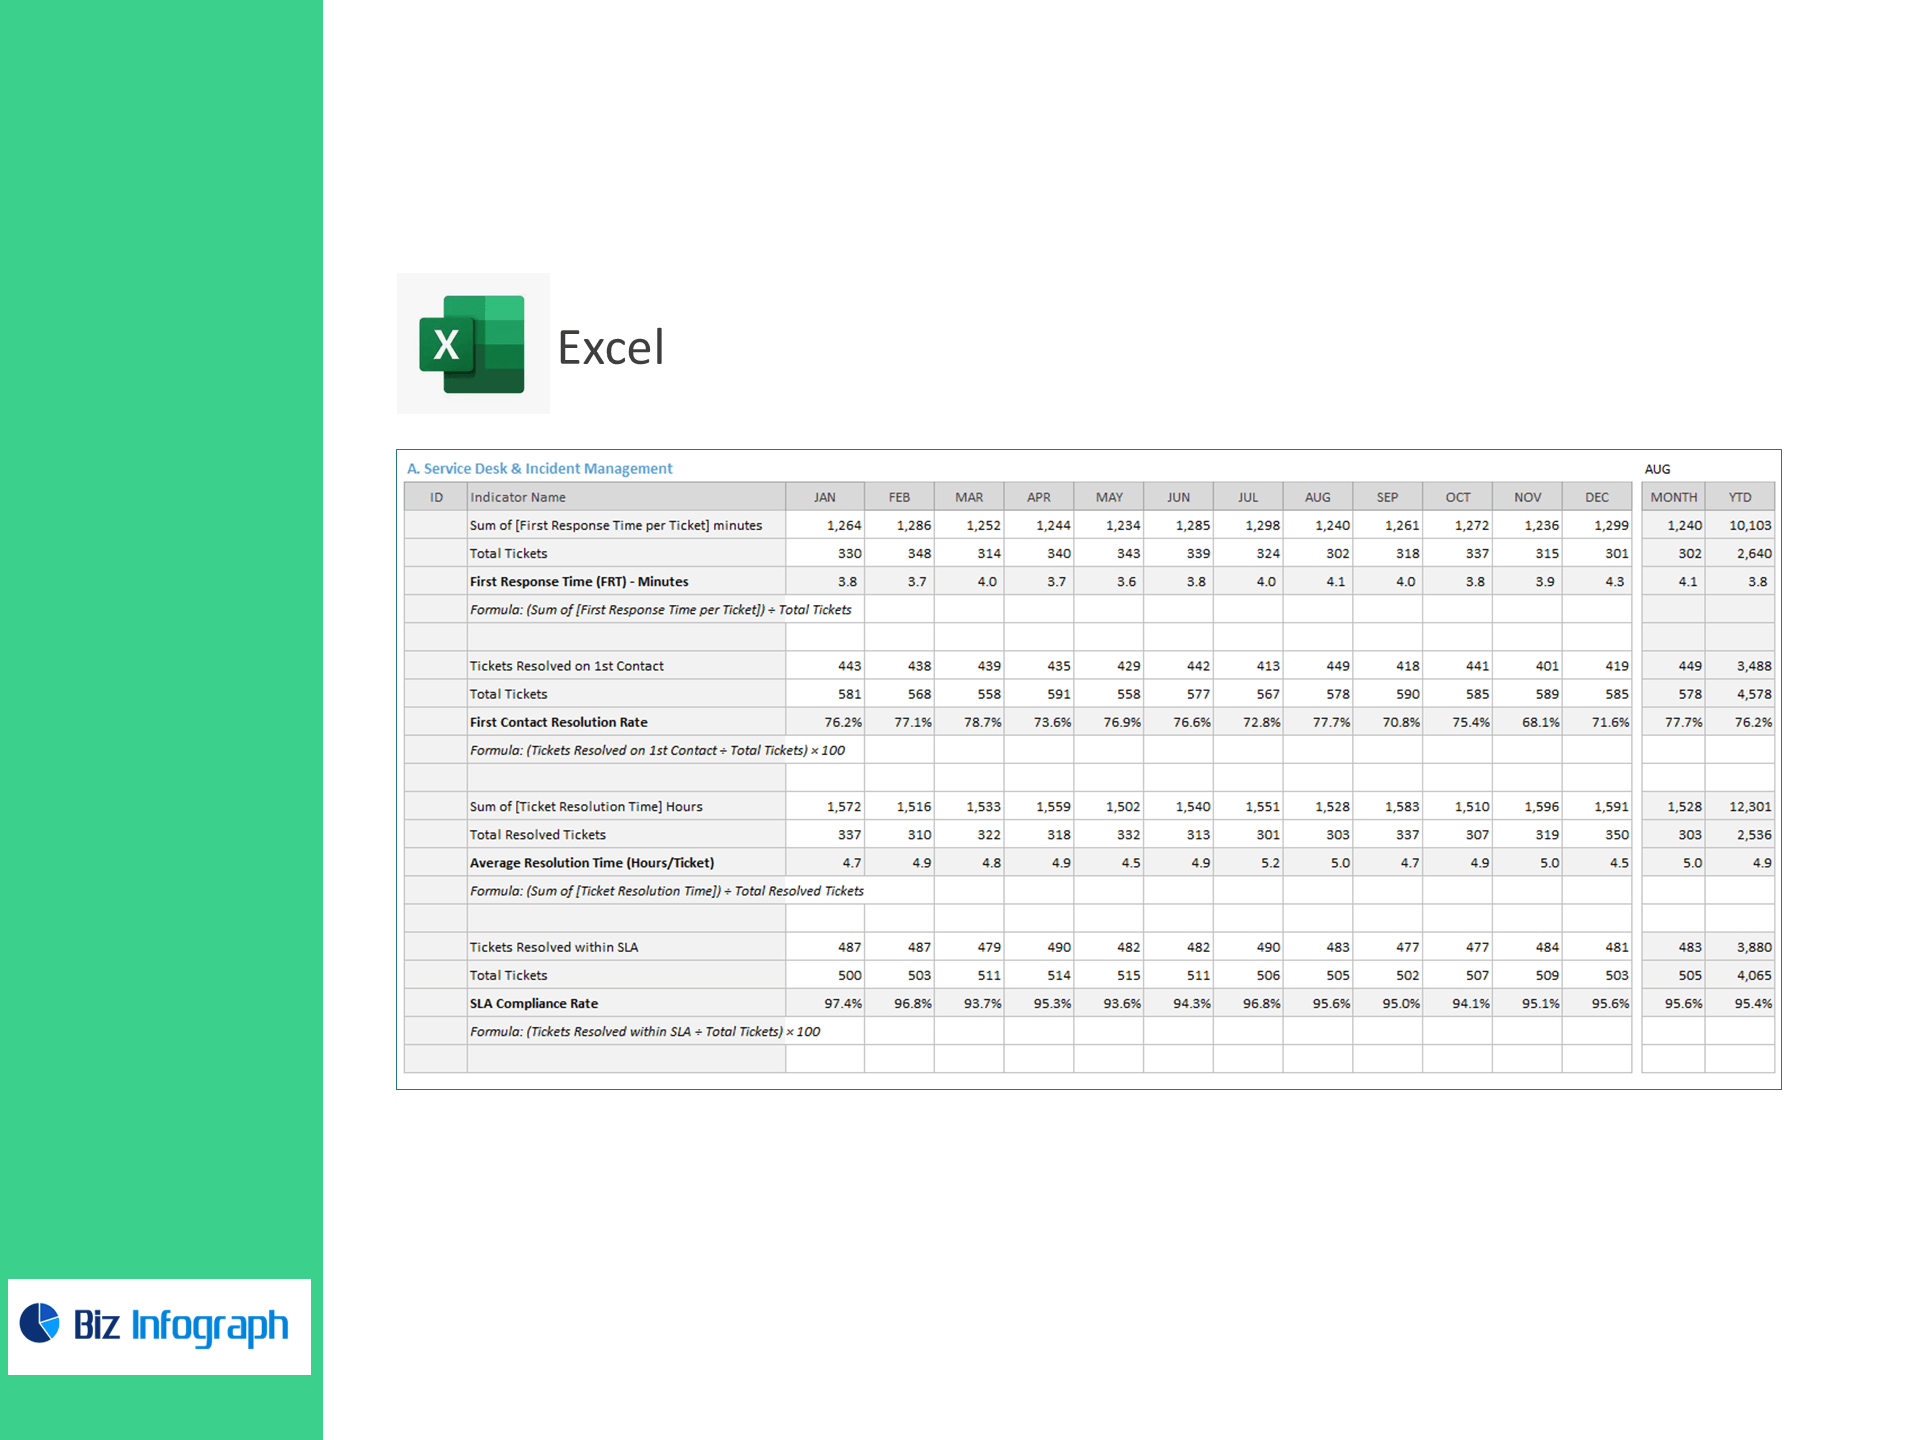
A) Service Desk & Incident Management
-
First Response Time (FRT) (mins)
-
First Contact Resolution Rate (%)
-
Average Resolution Time (hrs/ticket)
-
SLA Compliance Rate (%)
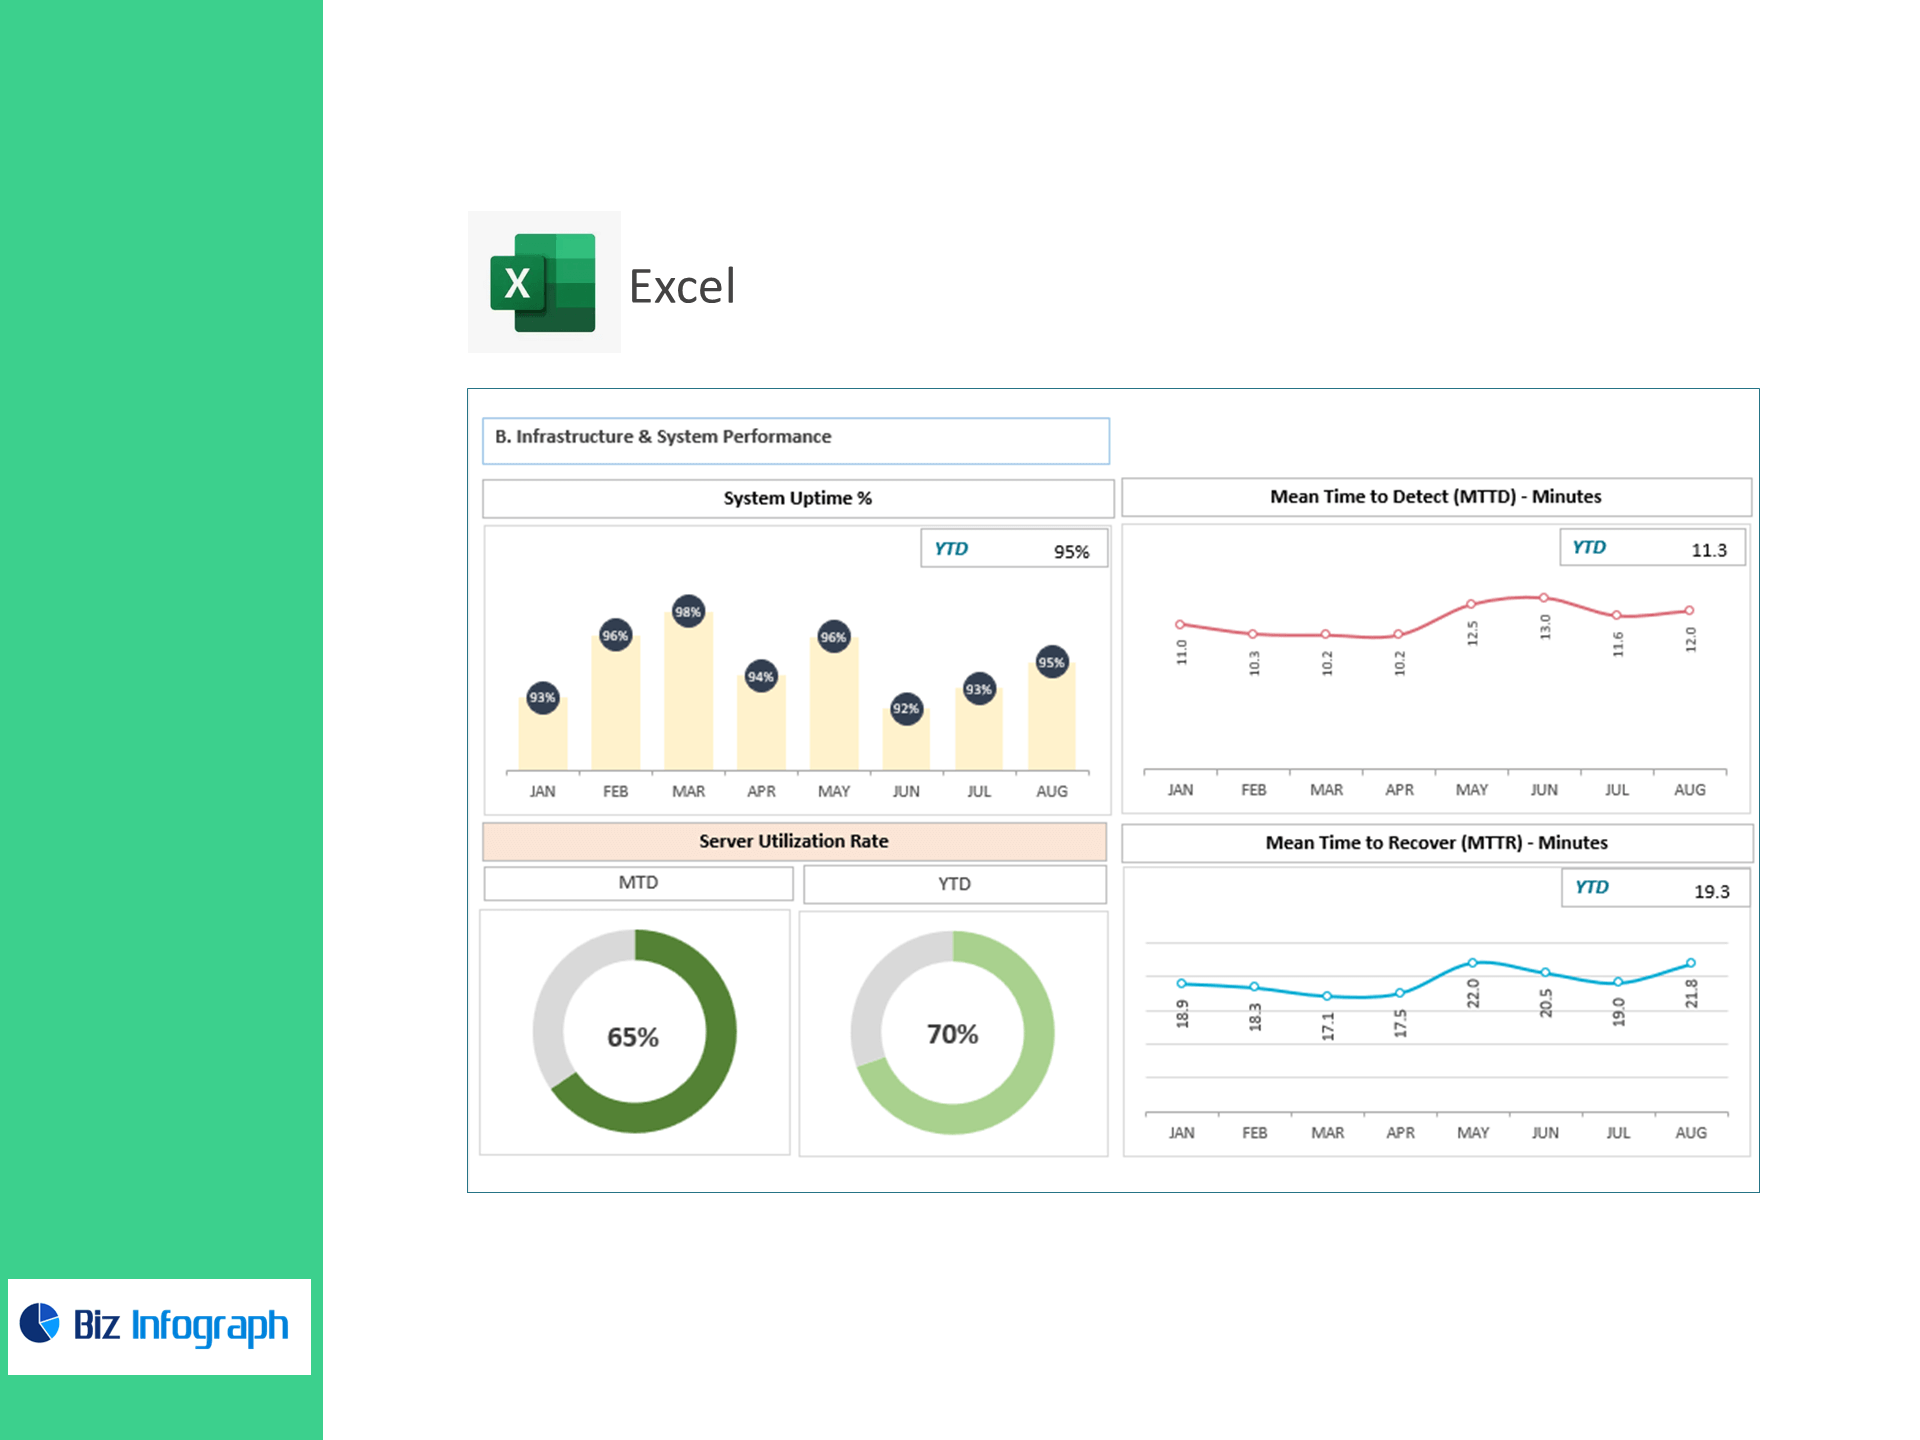
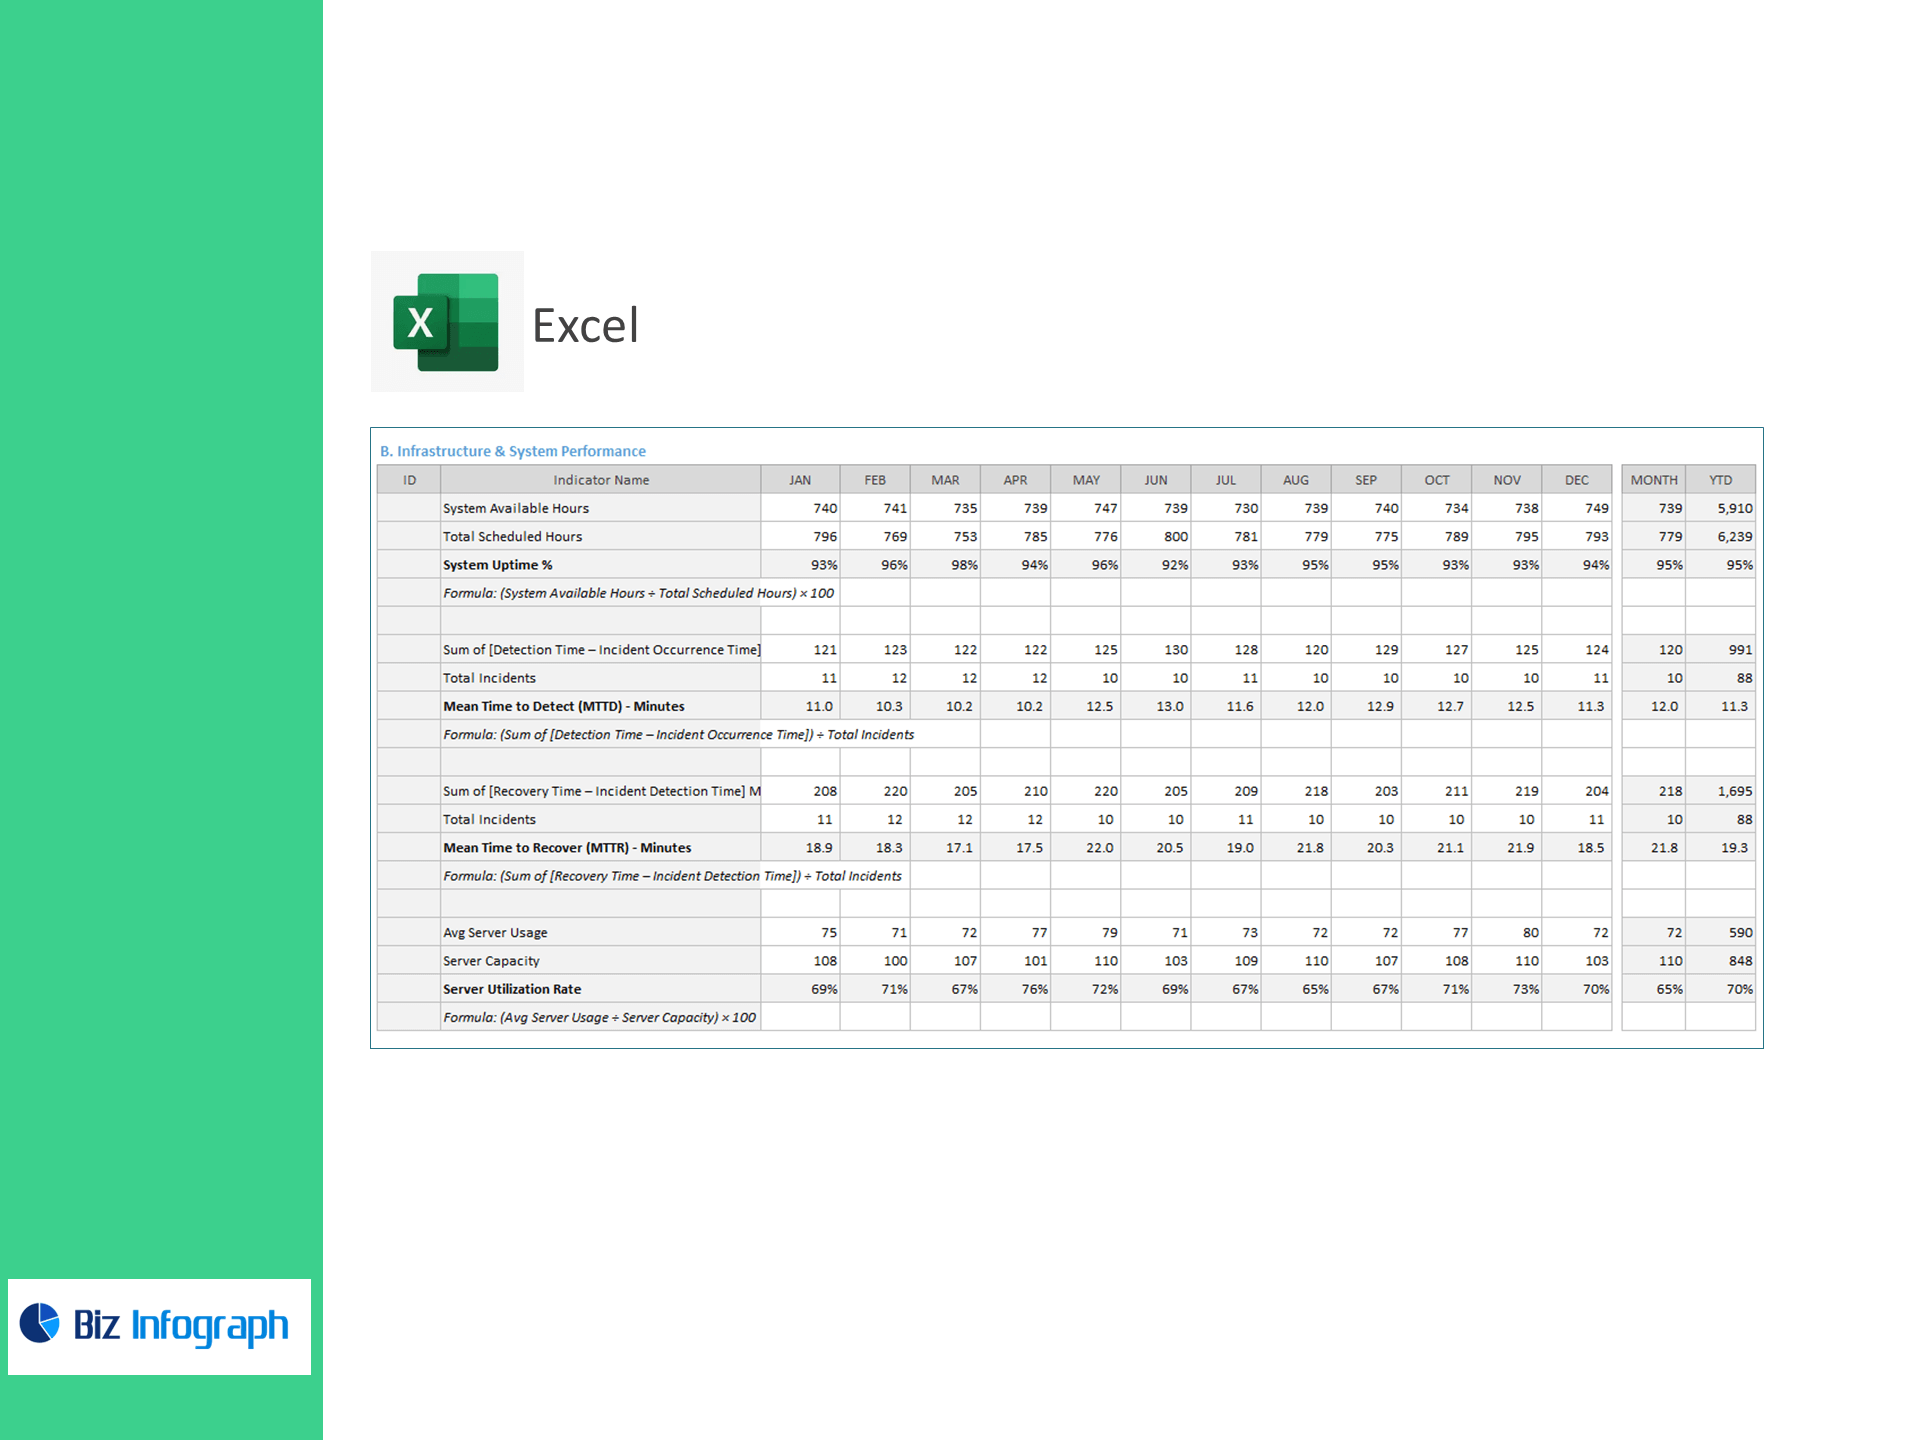
B) Infrastructure & System Performance
-
System Uptime %
-
MTTD (Mean Time to Detect, mins)
-
MTTR (Mean Time to Recover, mins)
-
Server Utilization Rate (%)
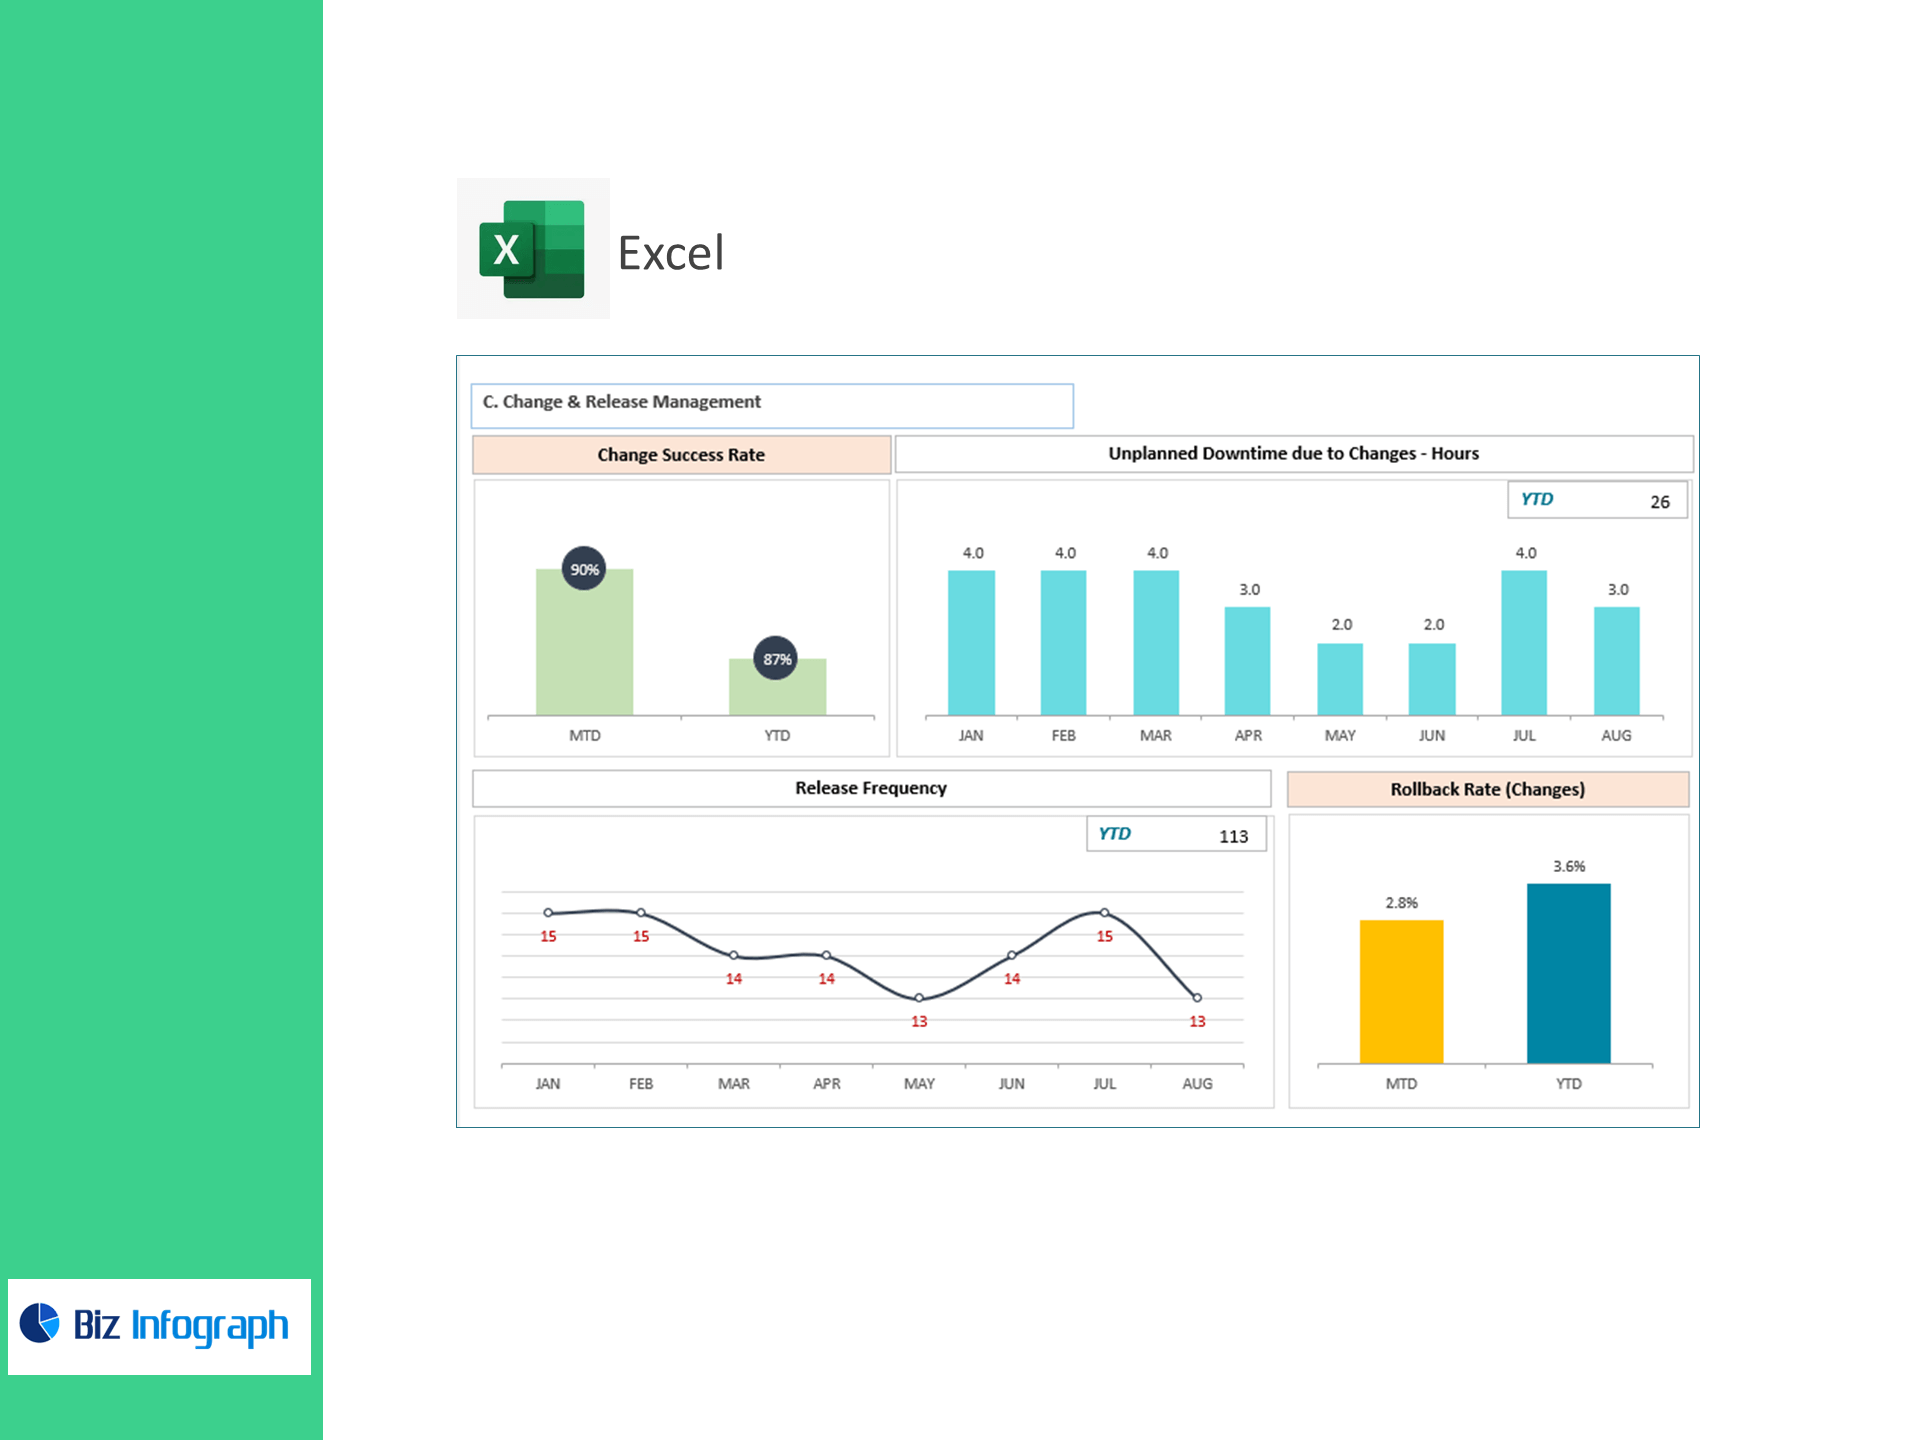
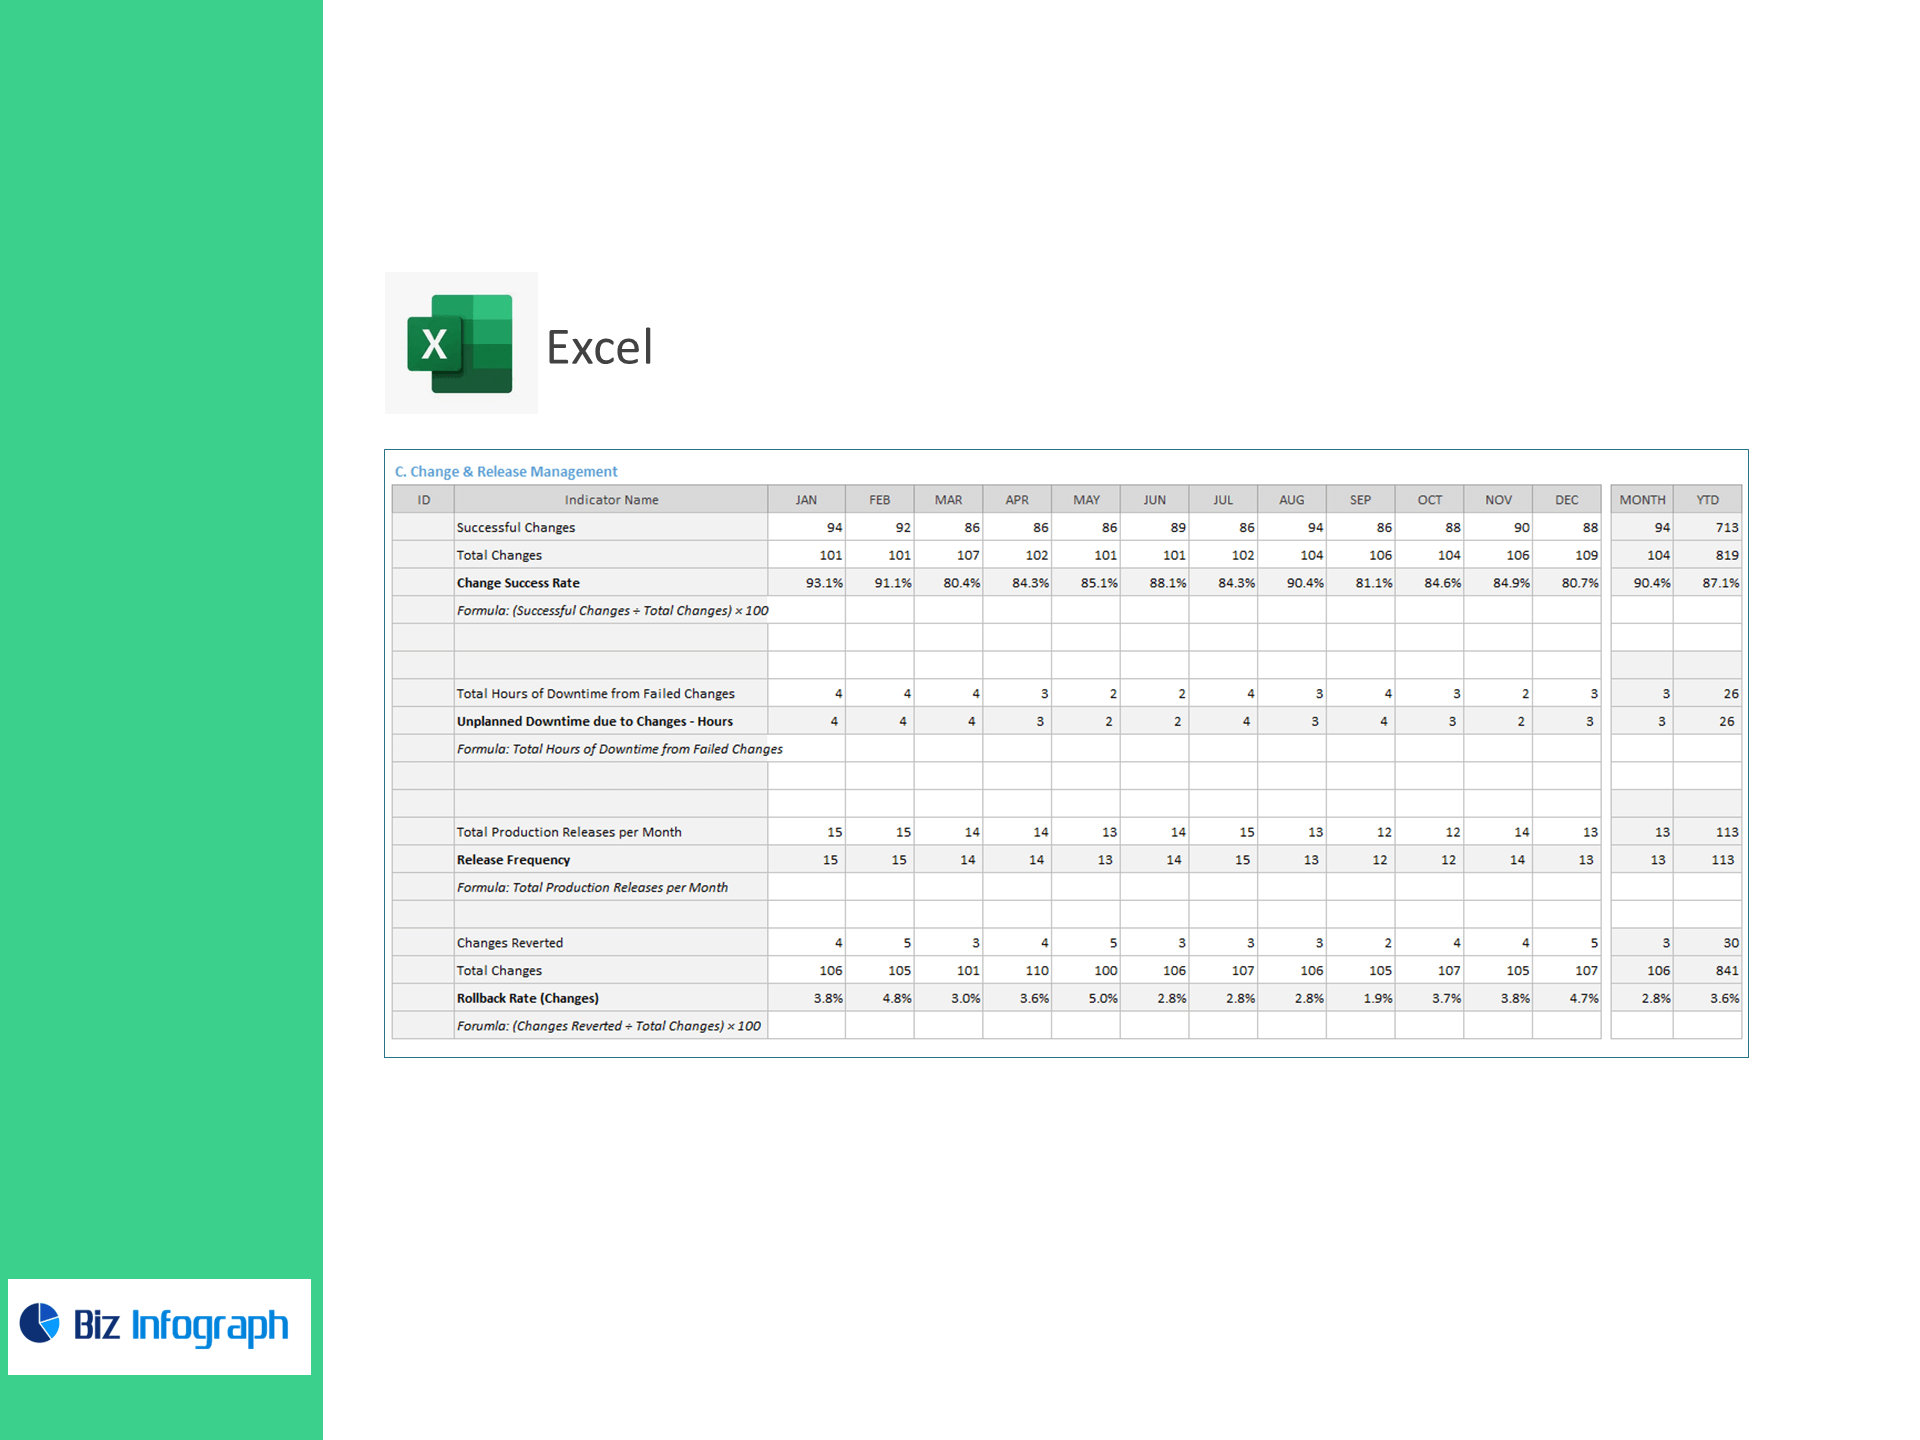
C) Change & Release Management
-
Change Success Rate (%)
-
Unplanned Downtime due to Changes (hrs)
-
Release Frequency (prod releases/month)
-
Rollback Rate (%)
Why teams choose this template
-
Operations at a glance: One view of tickets, uptime, MTTR/MTTD, and release risk.
-
Instant SLA reporting: Auto-calculate compliance and export PDF for stakeholders.
-
Root-cause ready: Drill into change-related downtime and rollback trends.
-
Excel-native, no macros: Paste CSVs from Jira/ServiceNow/Zendesk/New Relic—done.
-
Targets & alerts: Above/Below Target flags highlight hotspots by queue or service.
What’s inside
-
Executive Control Panel: Real-time KPI cards, trends, and traffic-light status.
-
Service Desk View: FRT, FCR, AHT, SLA charts by queue/priority.
-
Reliability View: Uptime, MTTD, MTTR, capacity usage with month-over-month deltas.
-
Change Analytics: Success/rollback rates, release cadence, change-caused downtime.
-
Data & Mapping Sheets: Drop your exports; formulas do the rest.
-
Quick-Start Guide with sample data and data-prep tips.
For ready-to-use Dashboard Templates: