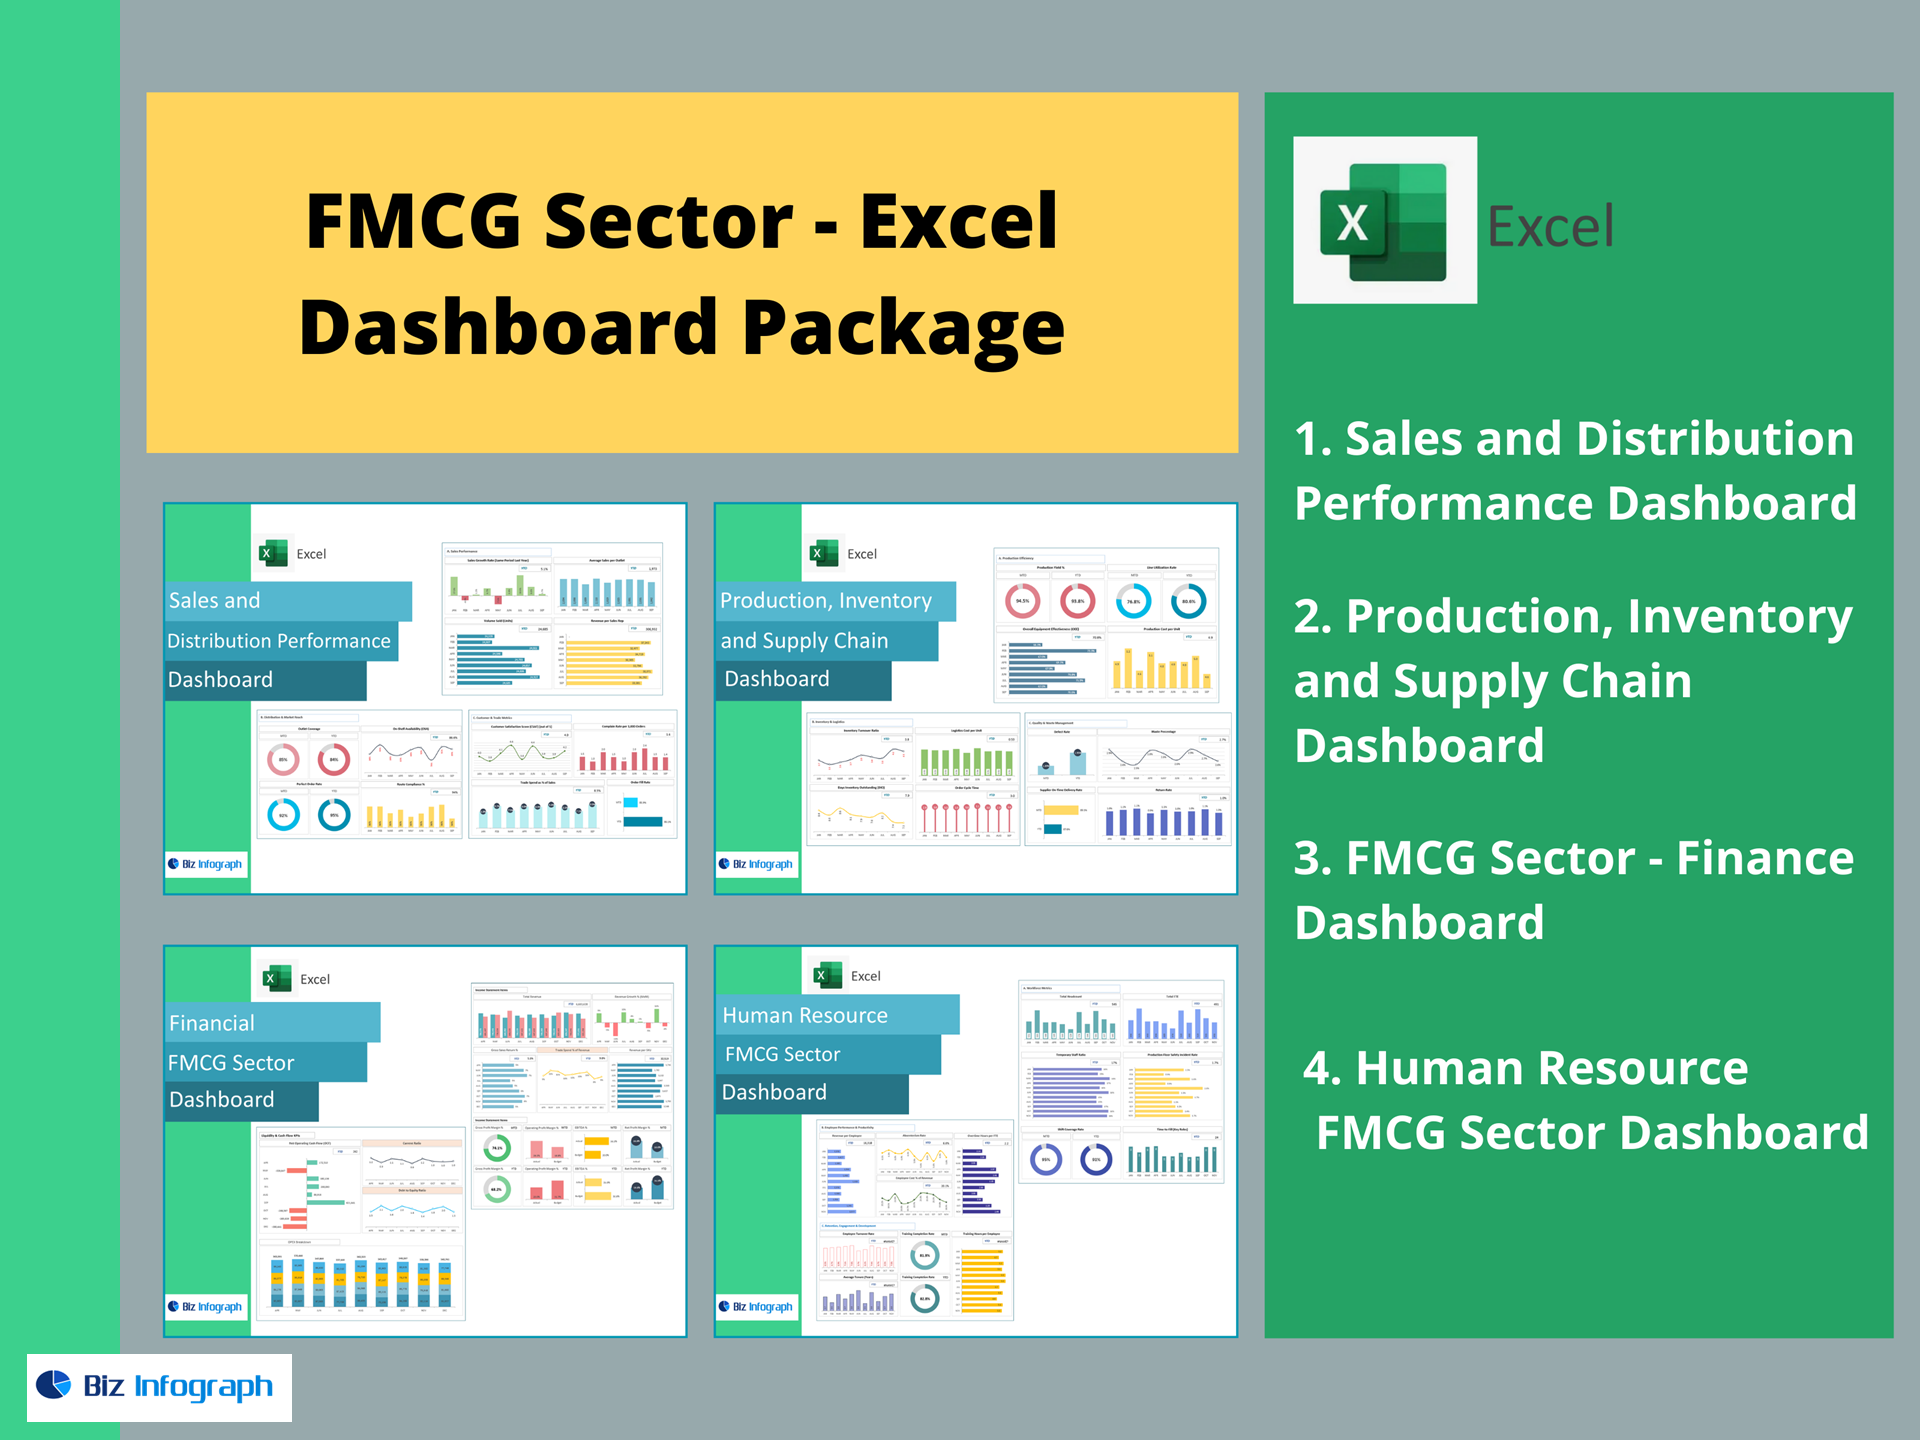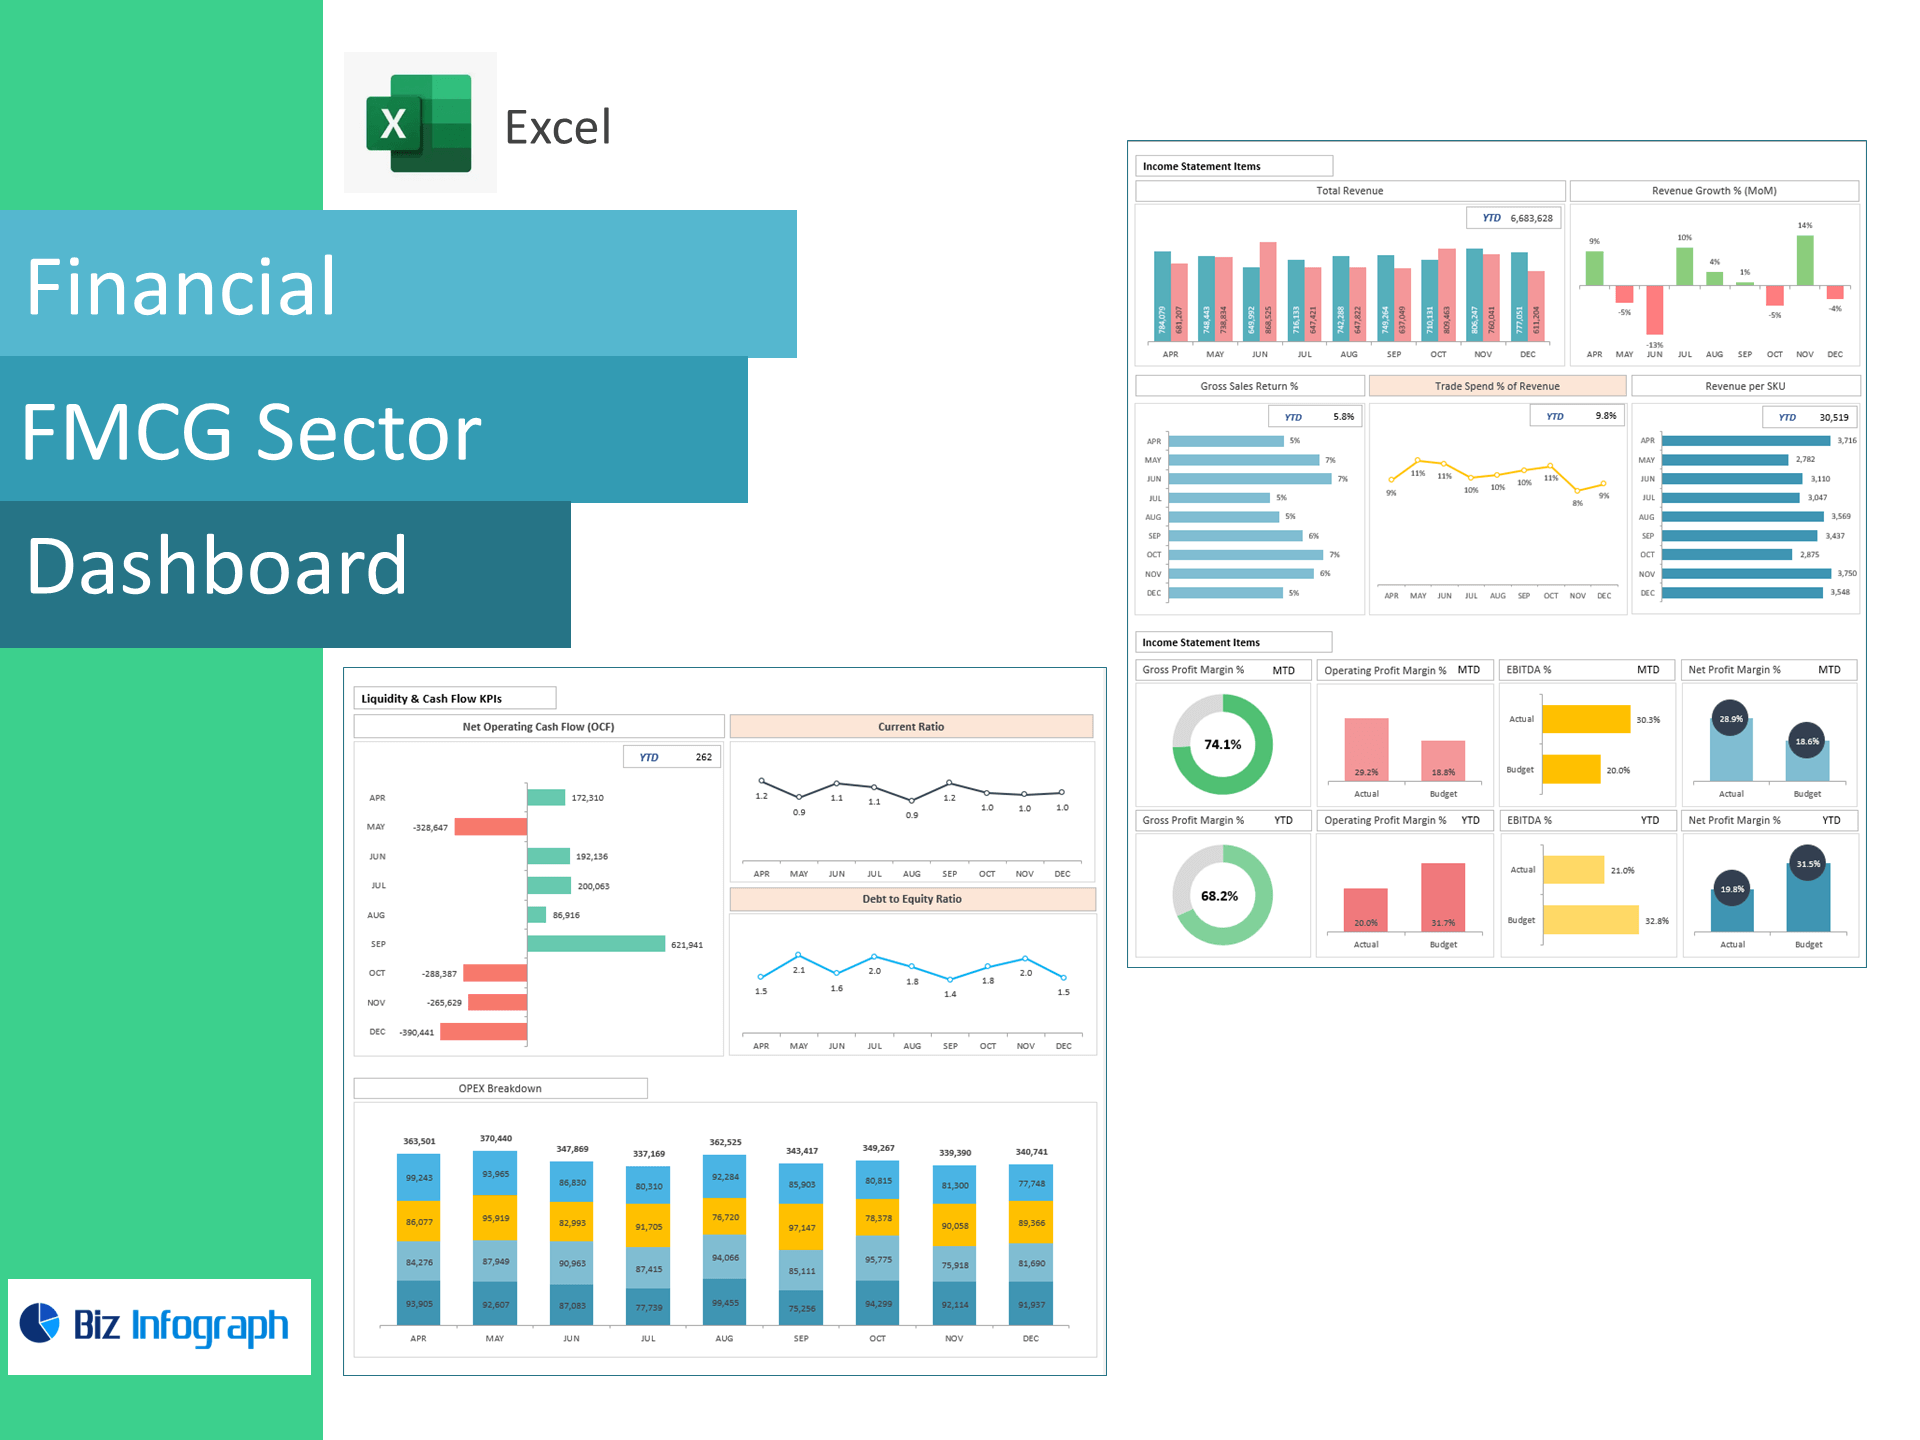
FMCG Sector Financial Dashboard — Excel Template
Track margin, trade spend, and SKU productivity in minutes. This ready-to-use Excel dashboard turns your monthly P&L and sales files into clean visuals for FMCG/CPG finance, sales finance, and category teams—no macros, no BI build.
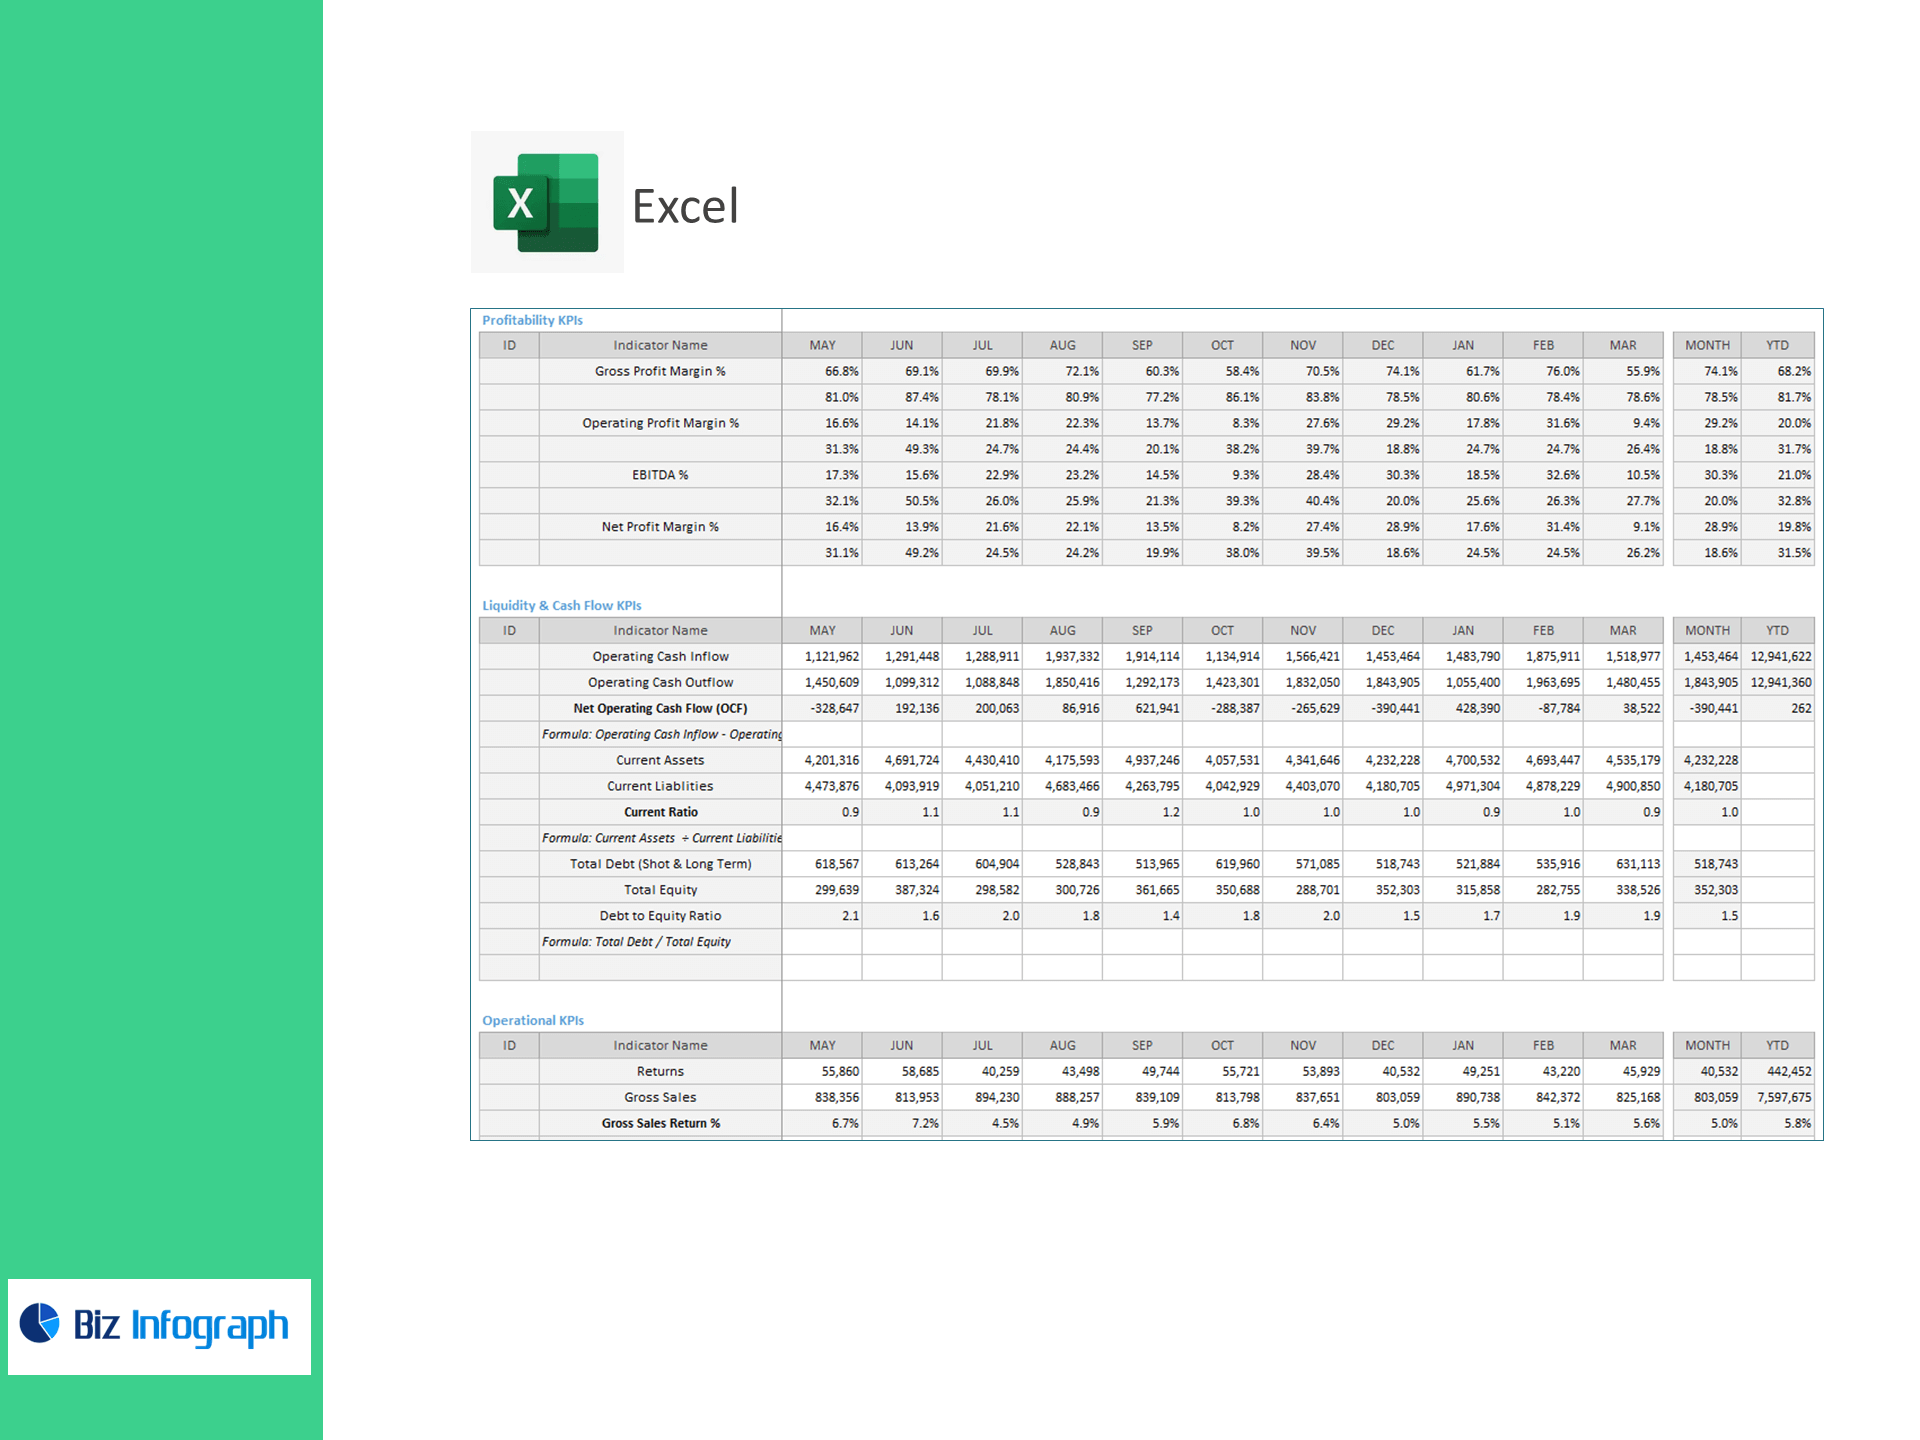
What it measures (prebuilt KPIs)
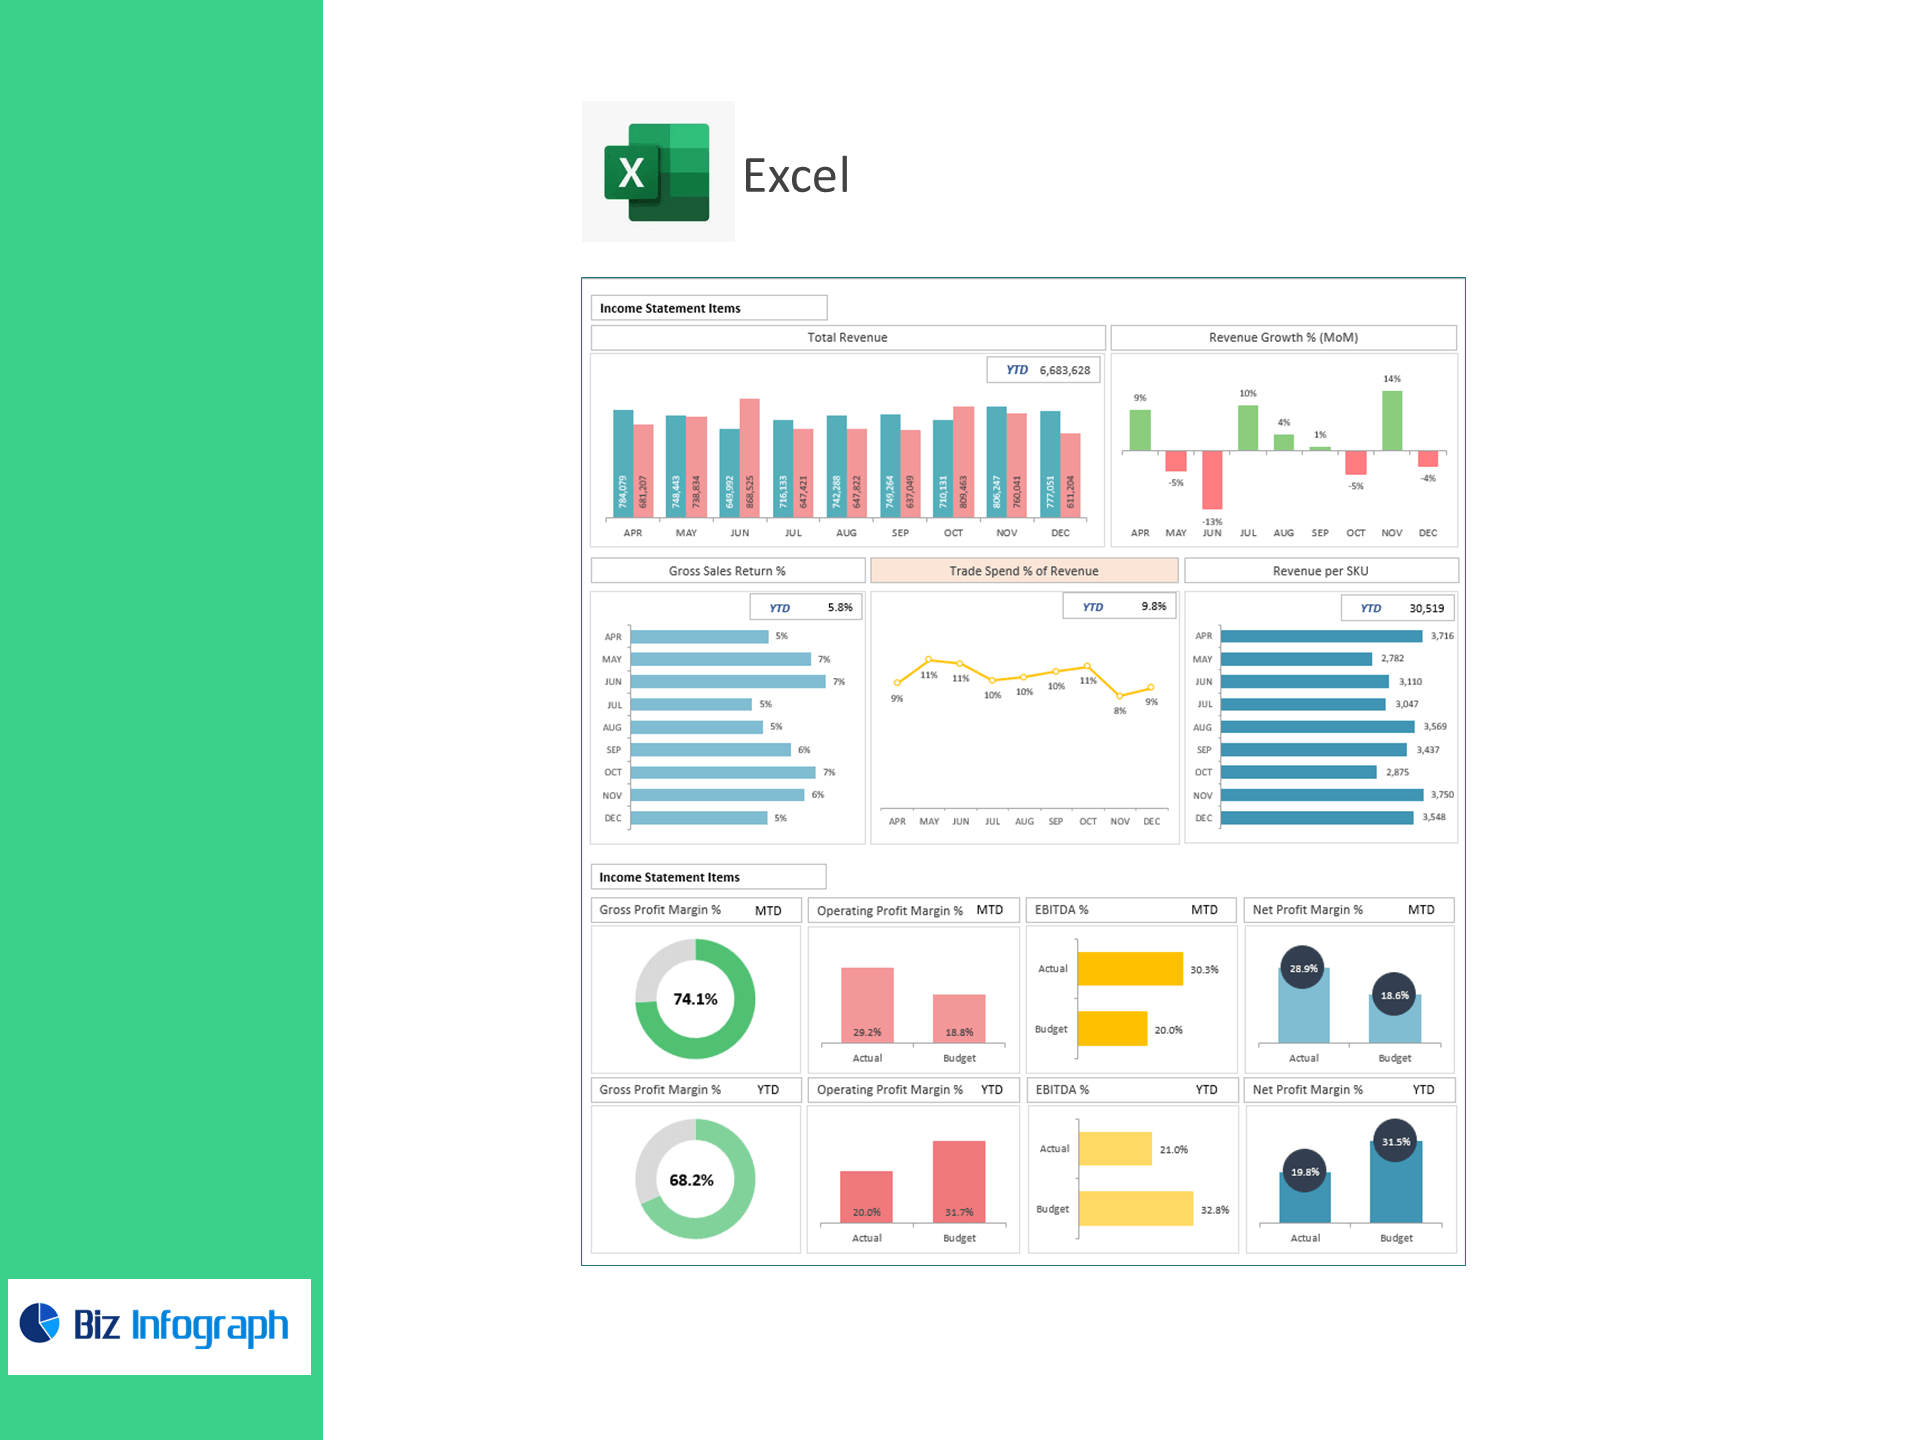
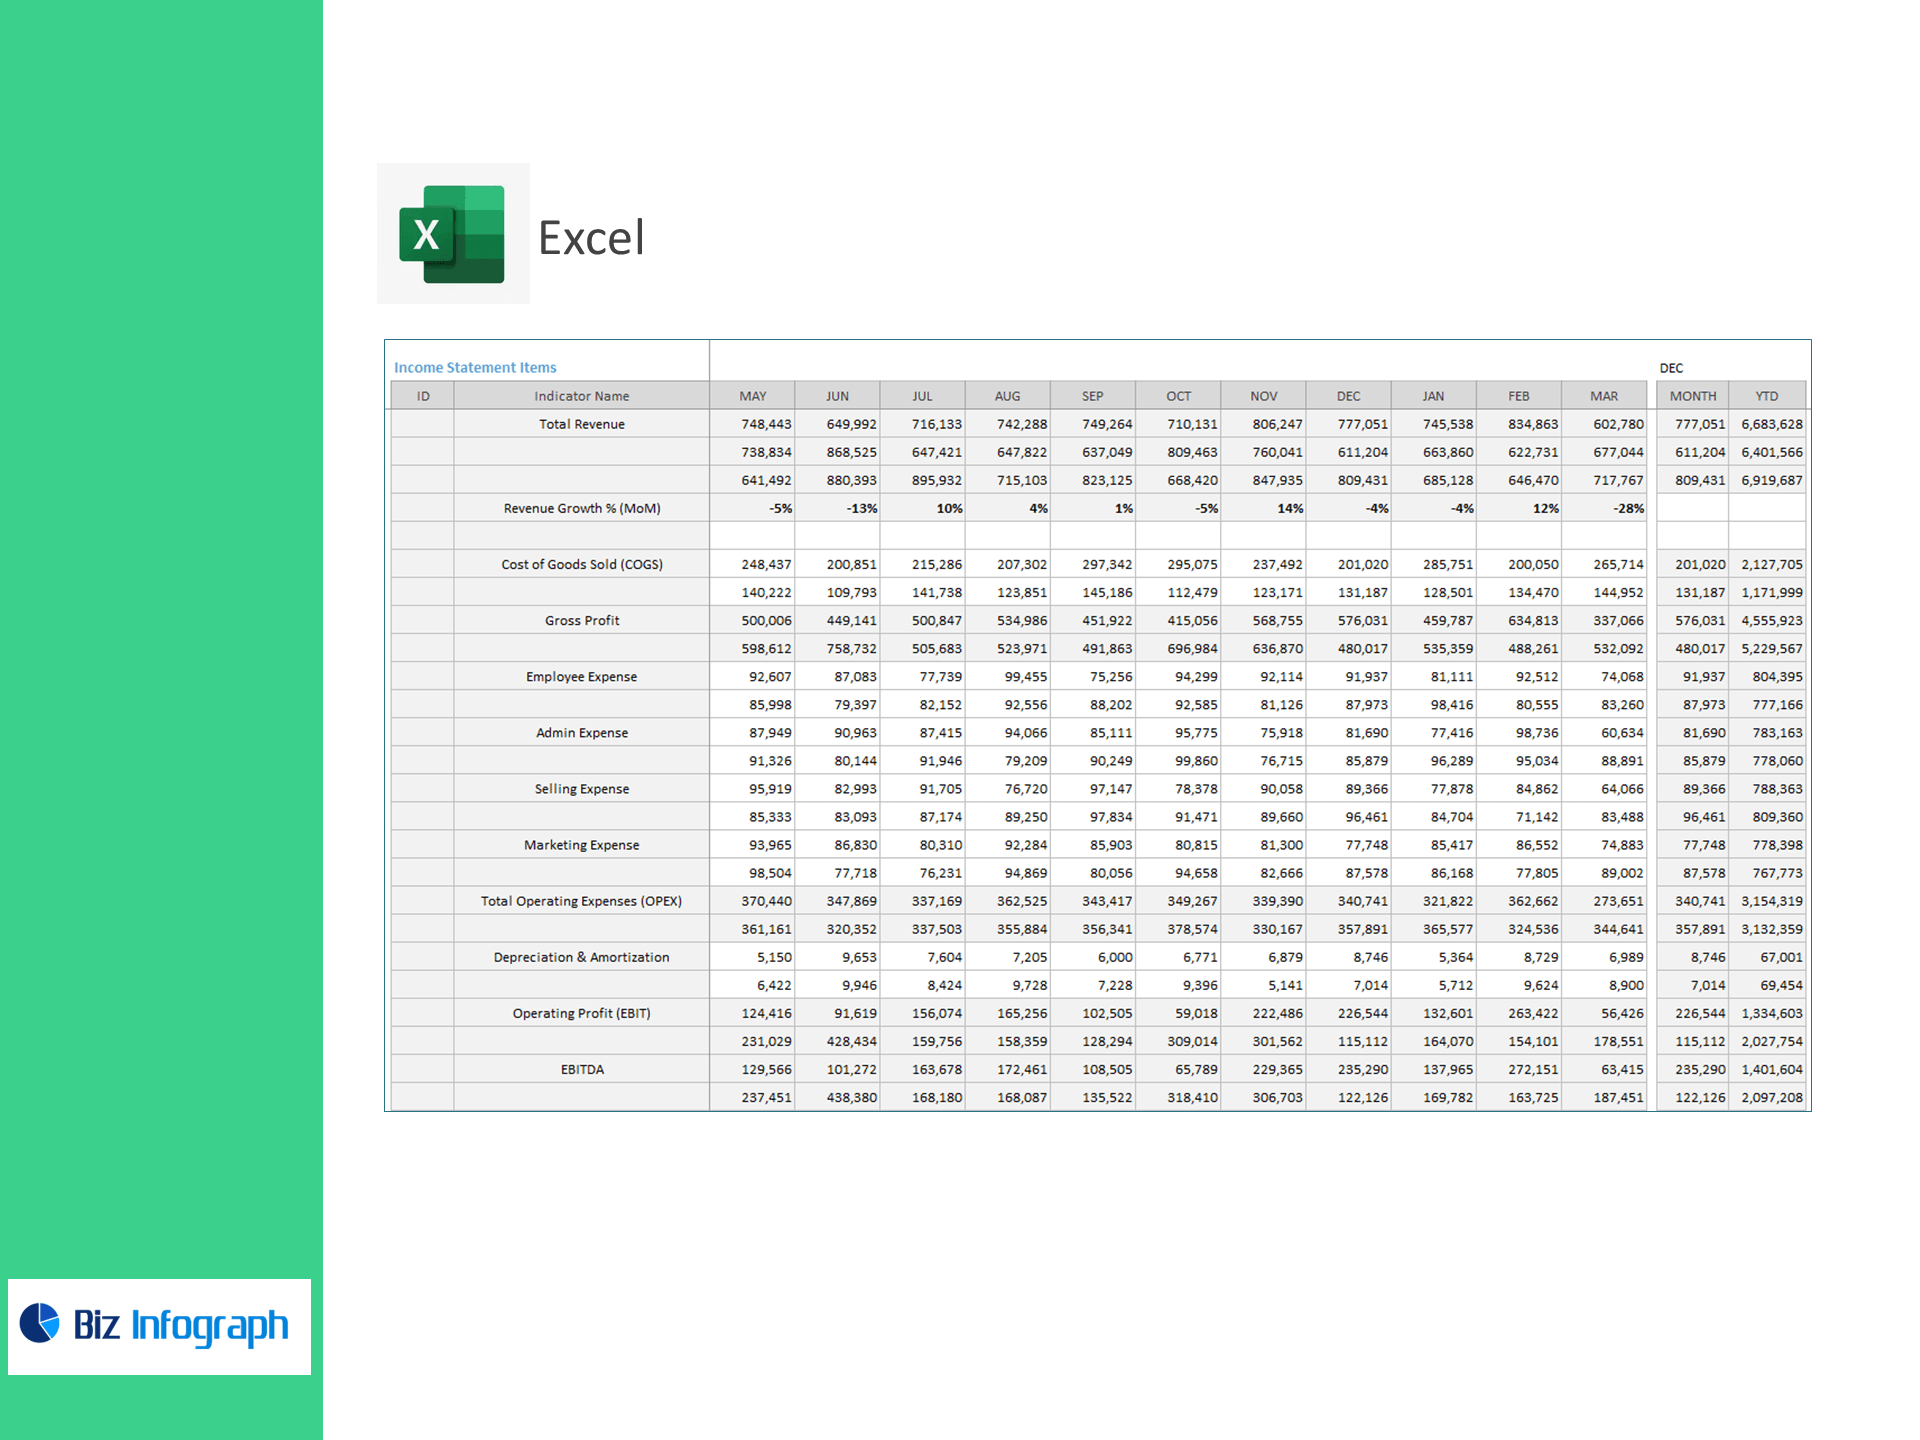
Income Statement & Profitability
-
Total Revenue, COGS, Gross Profit
-
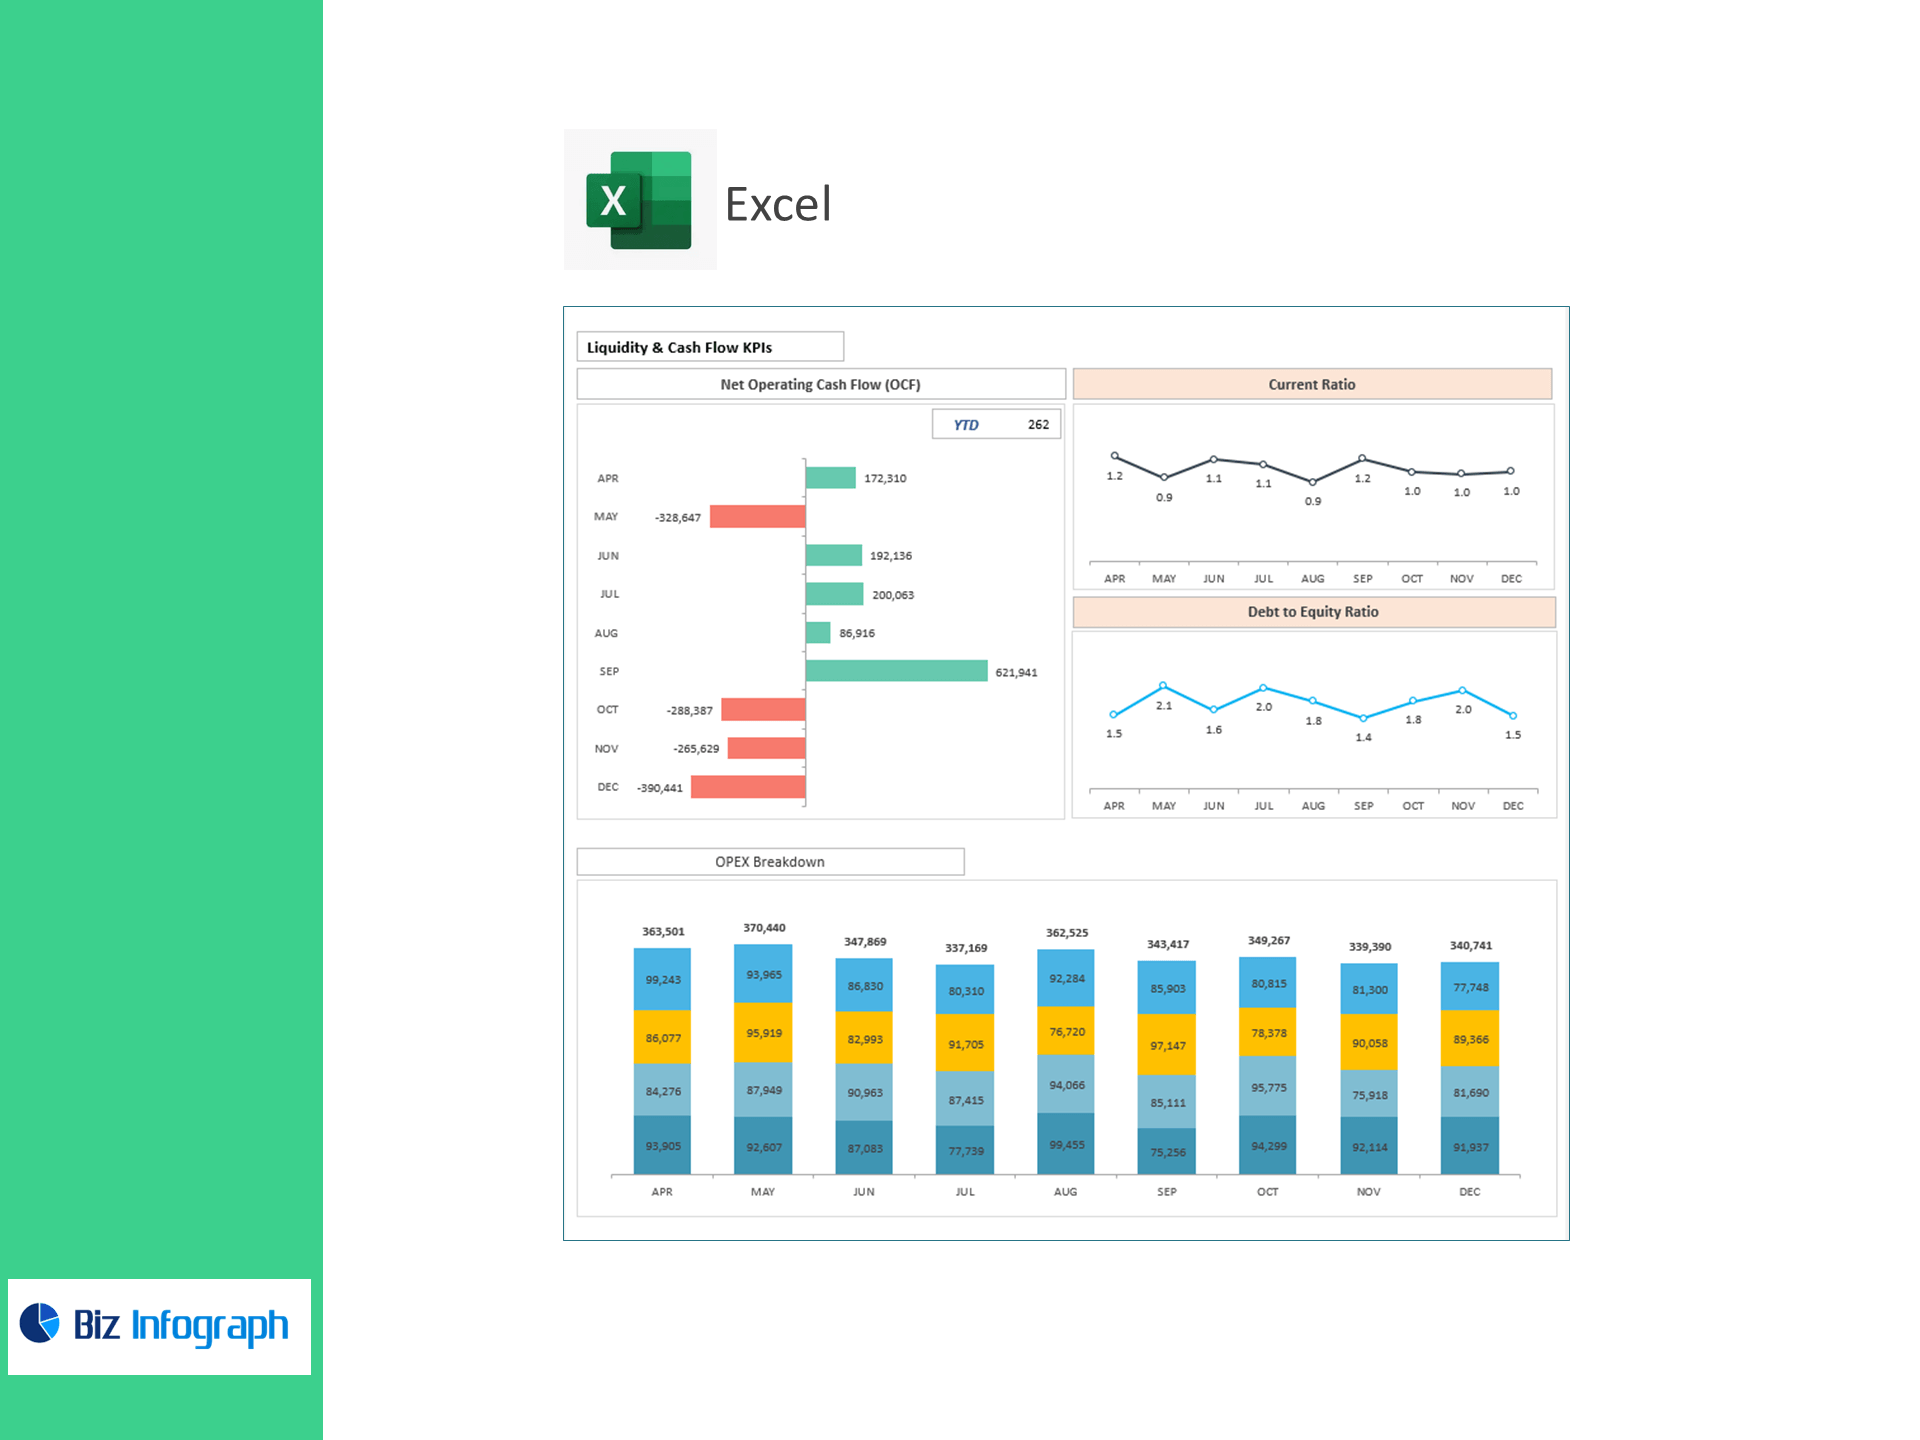
OPEX breakdown (Employee, Admin, Selling, Marketing), D&A
-
EBIT, EBITDA, Net Profit
-
Gross/Operating/EBITDA/Net Profit Margins %
Liquidity & Cash Flow
-
Operating Cash Inflow/Outflow, Net OCF
-
Current Ratio, Debt-to-Equity
FMCG Operational Finance
-
Returns & Gross Sales Return %
-
Promotions, Discounts, Allowances → Trade Spend % of Revenue
-
Active SKUs and Revenue per SKU for mix & tail analysis
Why it’s perfect for FMCG/CPG
-
Trade spend control: See promo leakage and discount drag vs. net revenue.
-
SKU rationalization: Rank long-tail SKUs by revenue and return rate.
-
Margin guardrails: Spot mix/COGS/OPEX impacts on gross and EBITDA quickly.
-
Board-ready visuals: KPI cards, trend lines, and variance callouts—export to PDF.
What’s inside
-
Executive dashboard (P&L + cash + trade spend + SKU KPIs)
-
Profitability & mix views, returns analysis, SKU productivity report
-
Data mapping sheet for quick copy-paste from ERP/export (CSV/XLSX)
-
Clean formulas only (Excel 365/2021, Win/Mac). Optional Power BI upgrade path.
For ready-to-use Dashboard Templates: