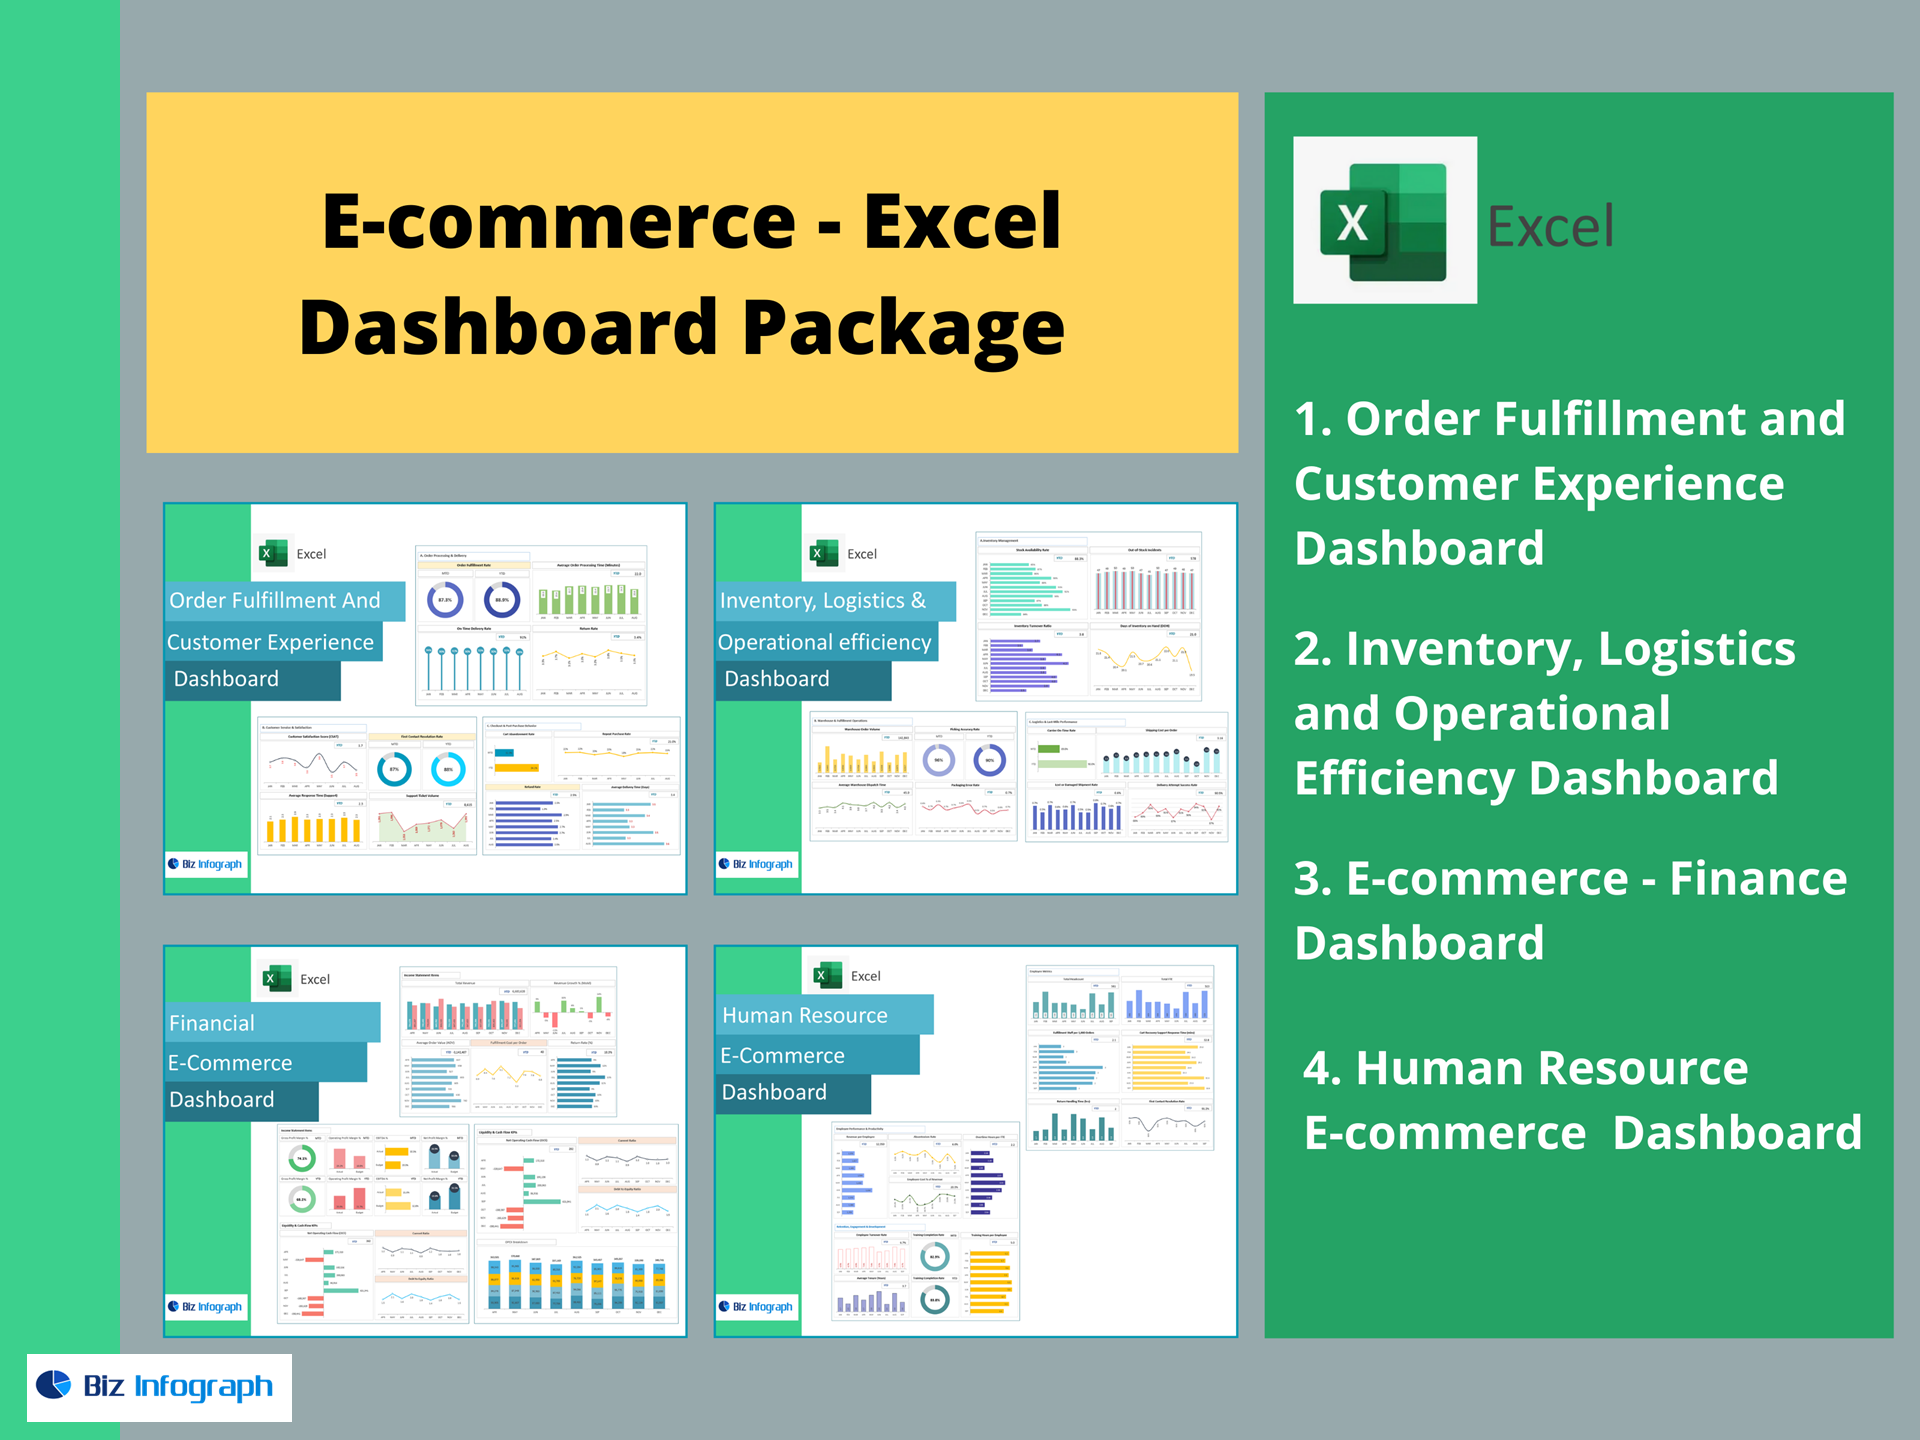
Order Fulfillment & Customer Experience Dashboard — Excel Template
Ship faster, resolve issues sooner, and boost repeat purchases—right in Excel. This template turns OMS, WMS, courier, and help-desk data into a live dashboard tracking Order Fulfillment Rate, Avg. Order Processing Time, On-Time Delivery, Return & Refund Rates, CSAT, Average Response Time, First Contact Resolution, Ticket Volume, Cart Abandonment, Repeat Purchase Rate, and Average Delivery Time—so you can raise NPS while lowering cost-to-serve.
Why teams choose this template
-
Ops + CX in one view: Connect warehouse speed with customer satisfaction and loyalty.
-
Actionable bottleneck alerts: Spot slow processing, late deliveries, rising returns, and high AHT instantly.
-
Excel-native: Paste your CSVs and go—no add-ins or BI setup required.
KPIs included (ready-made formulas)
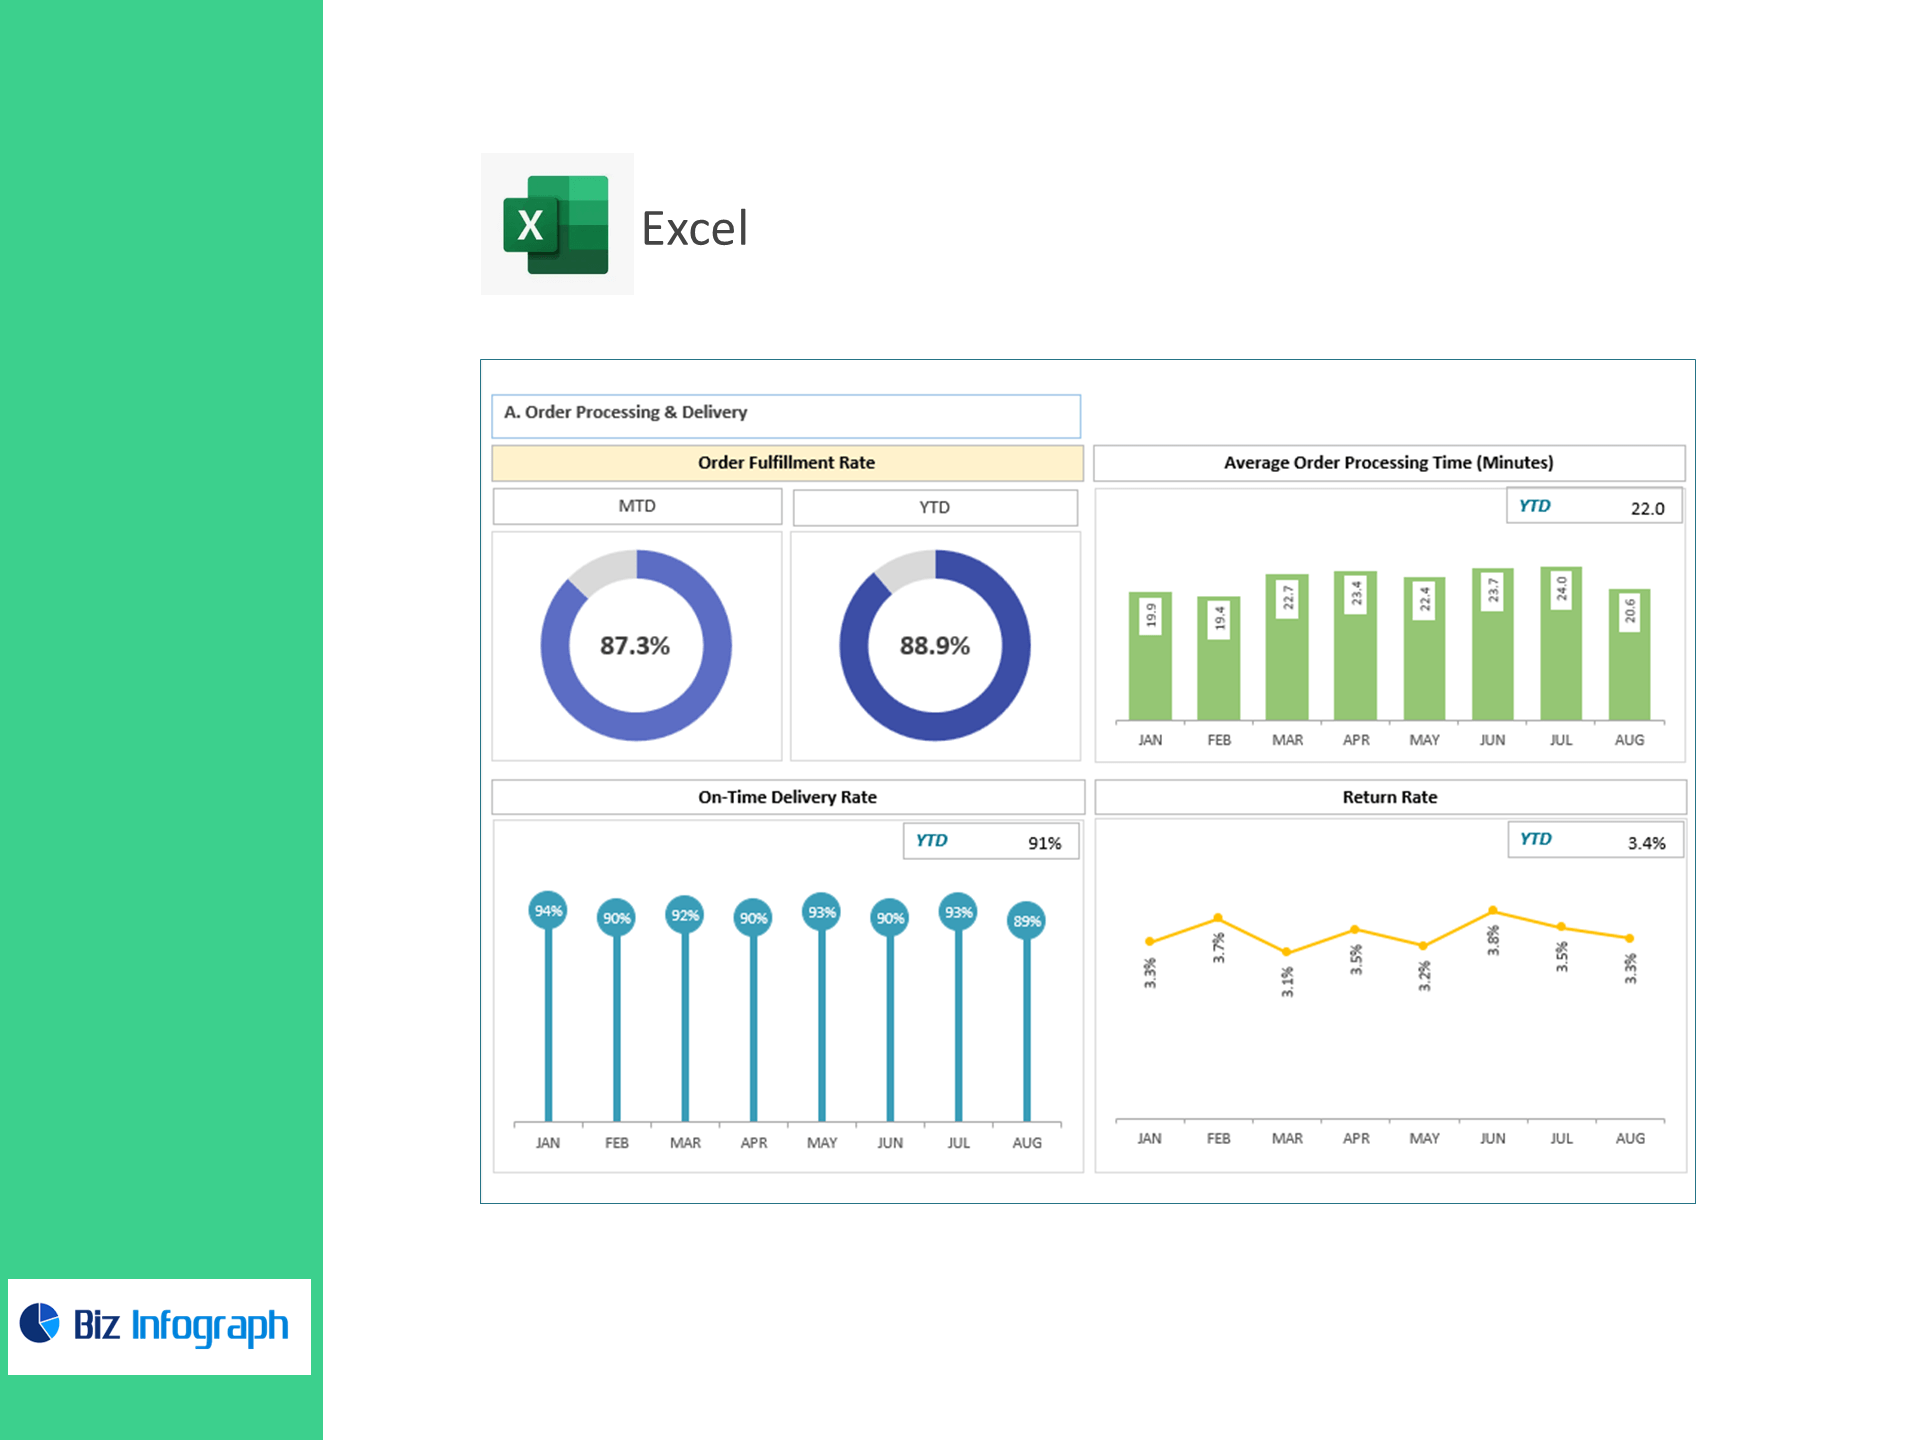
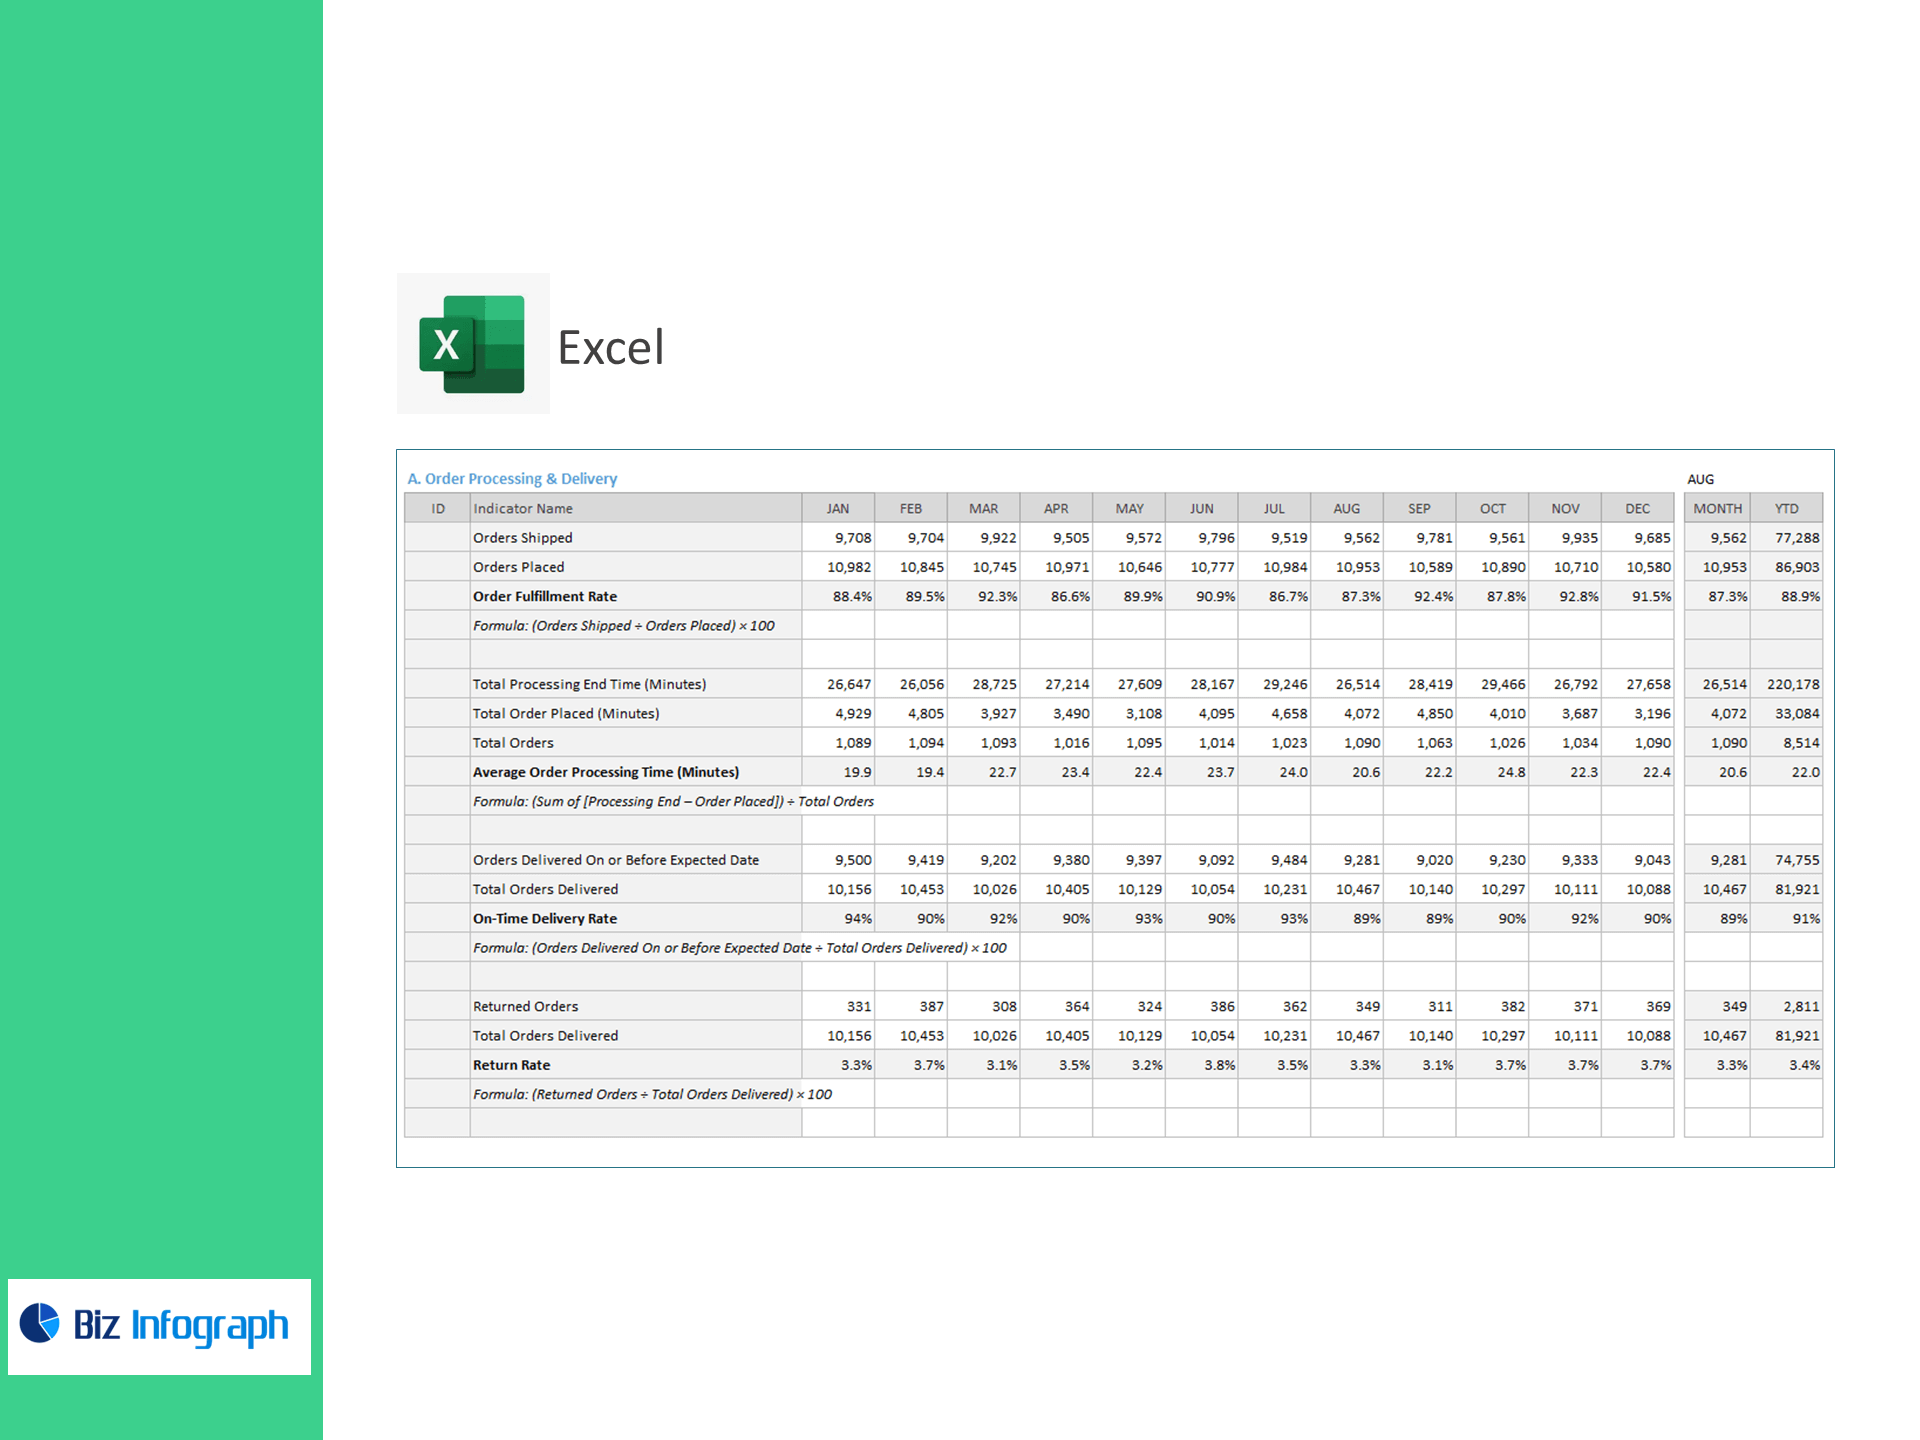
A) Order Processing & Delivery
-
Order Fulfillment Rate (%) = Orders Shipped ÷ Orders Placed × 100
-
Average Order Processing Time (min) = Σ(Processing End − Order Placed) ÷ Orders
-
On-Time Delivery Rate (%) = Delivered On/Before ETA ÷ Orders Delivered × 100
-
Return Rate (%) = Returned Orders ÷ Orders Delivered × 100
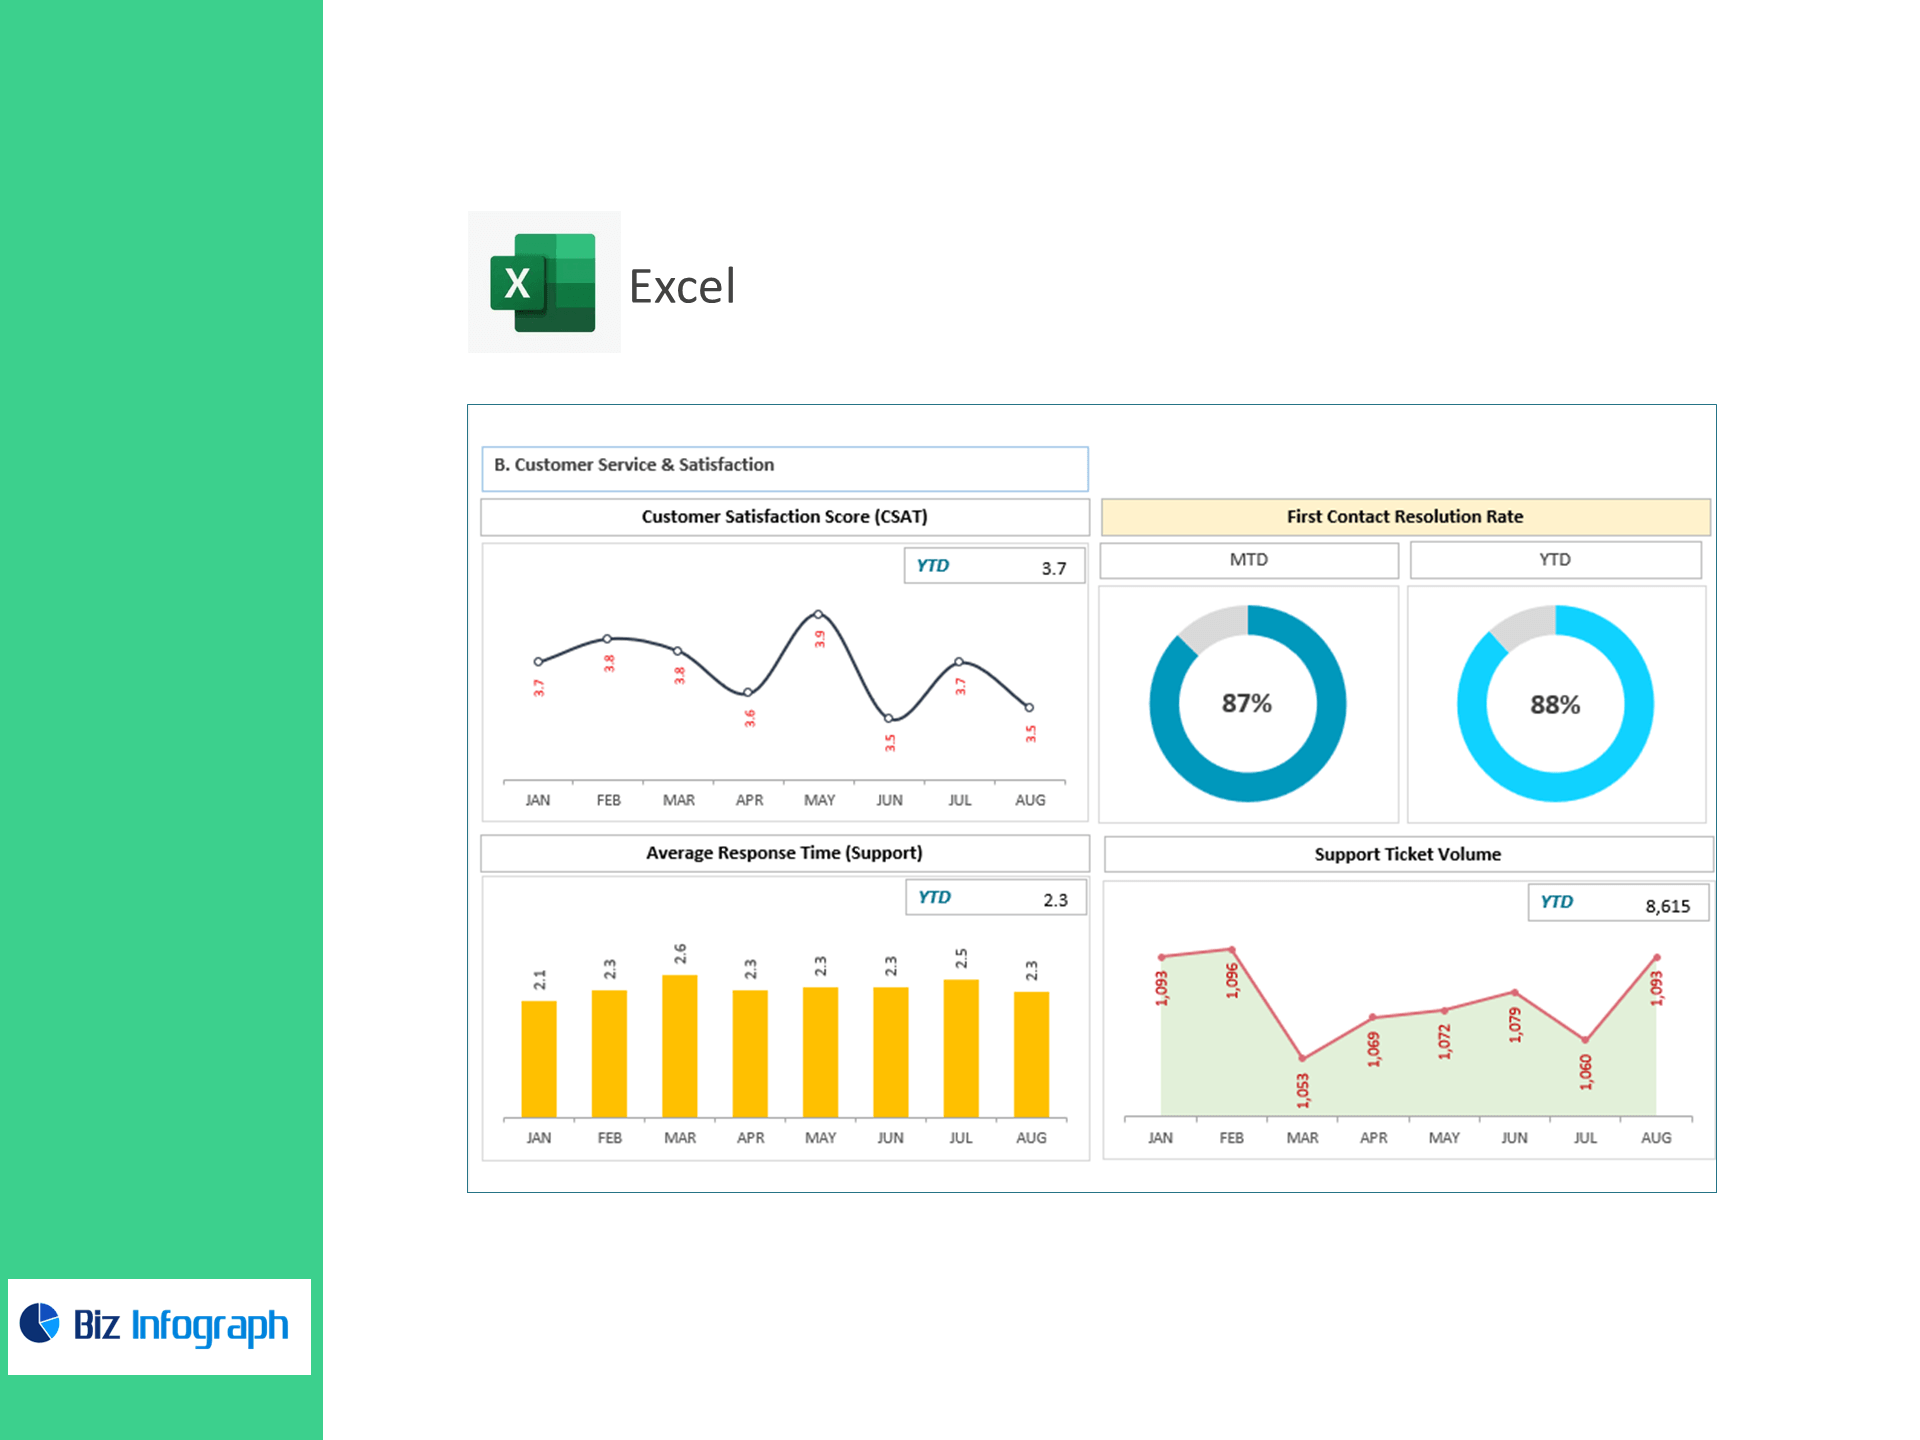
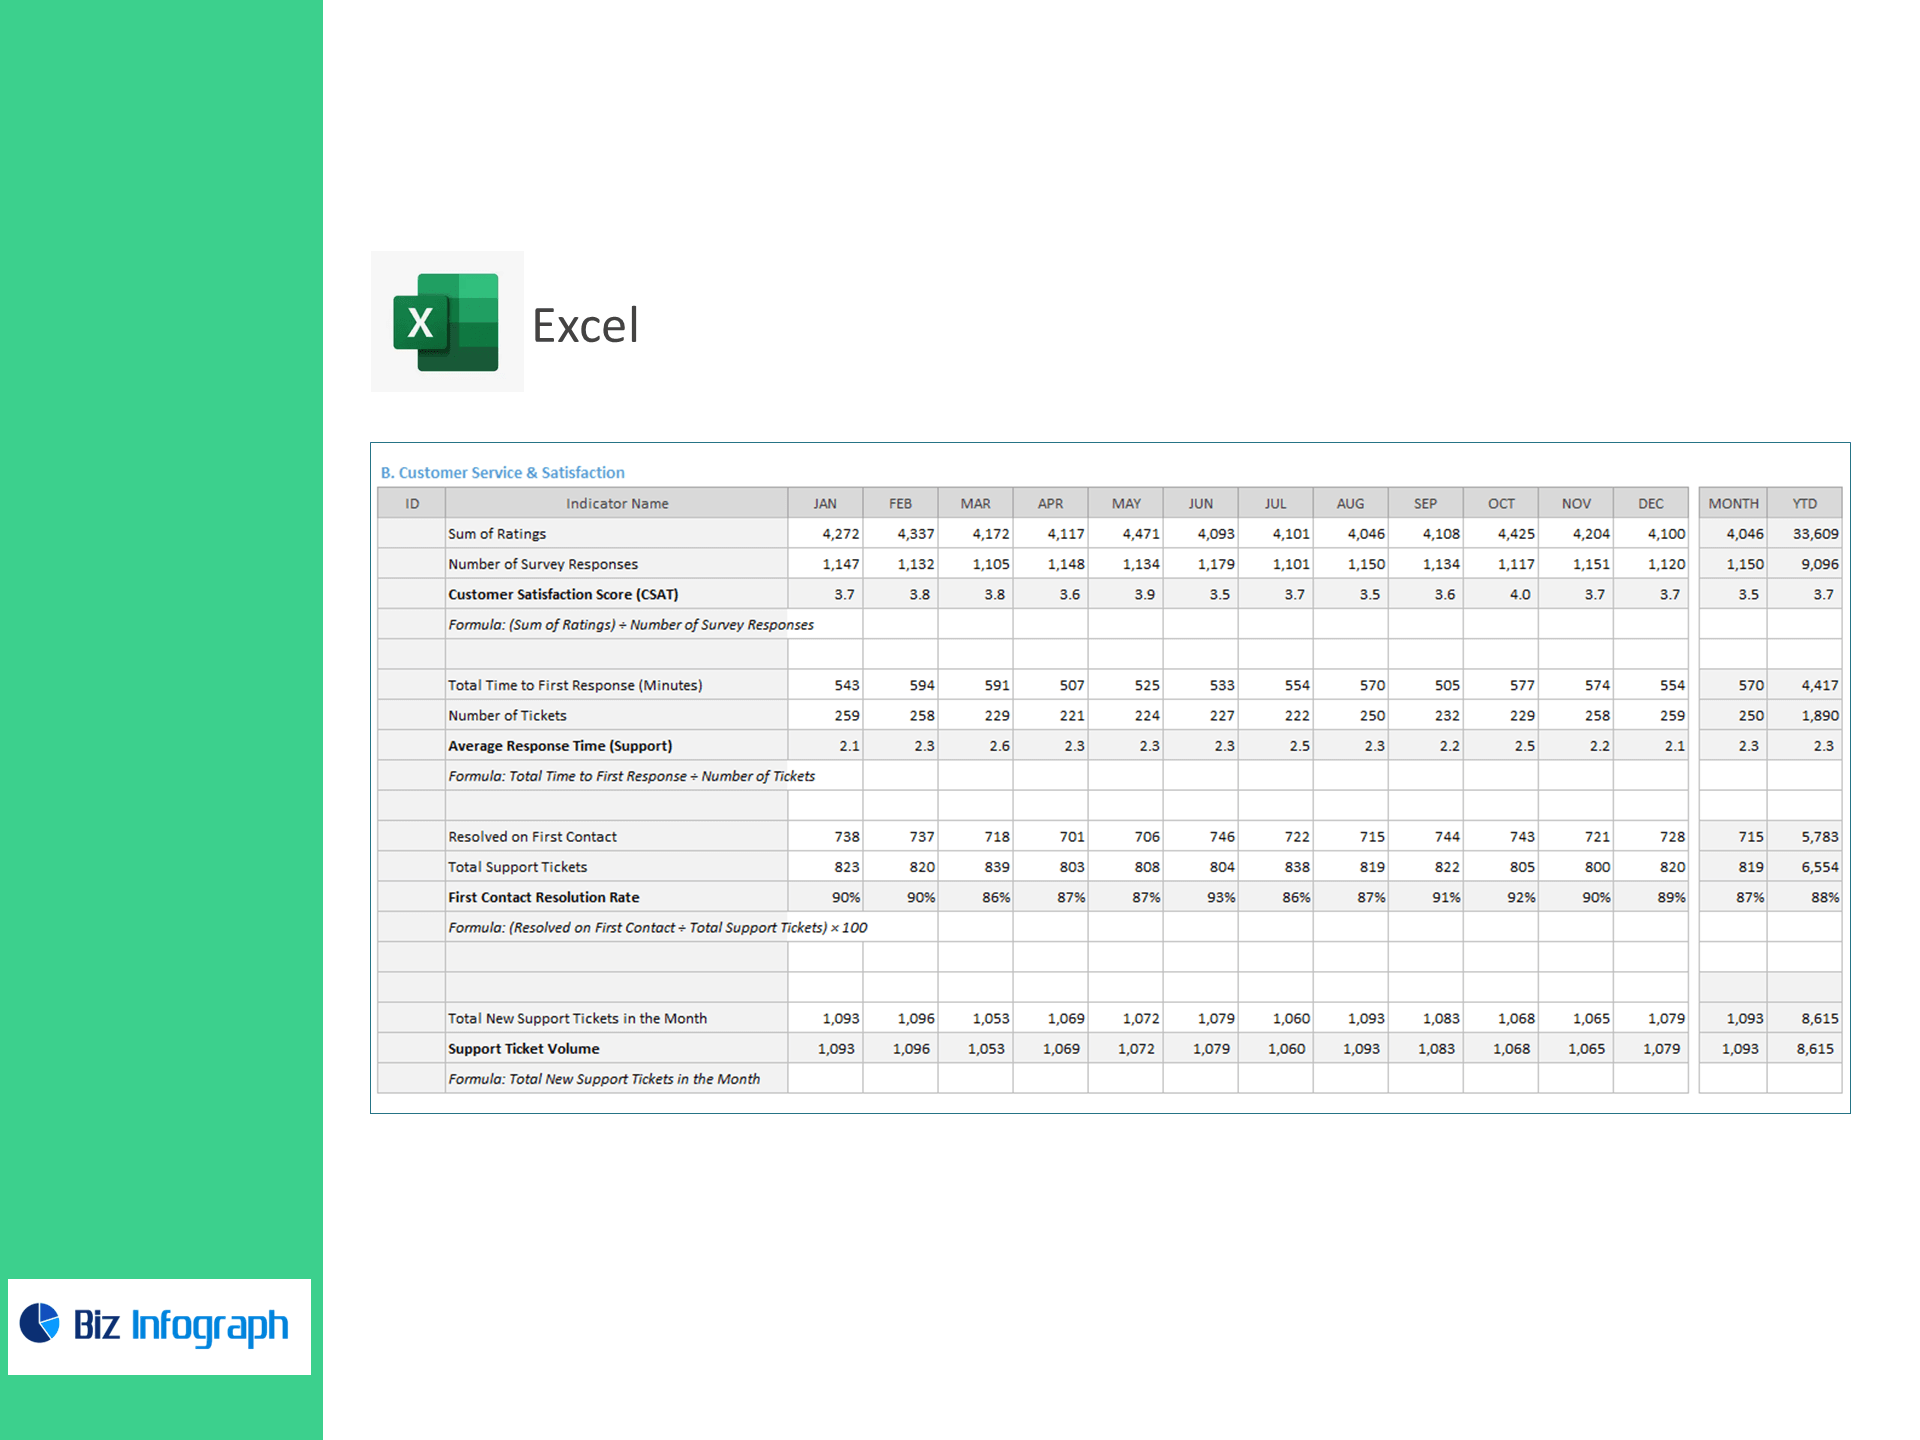
B) Customer Service & Satisfaction
-
Customer Satisfaction Score (CSAT) = Σ Ratings ÷ Survey Responses
-
Average Response Time (min) = Total Time to First Response ÷ Tickets
-
First Contact Resolution Rate (%) = Resolved on First Contact ÷ Support Tickets × 100
-
Support Ticket Volume = New Tickets in Month
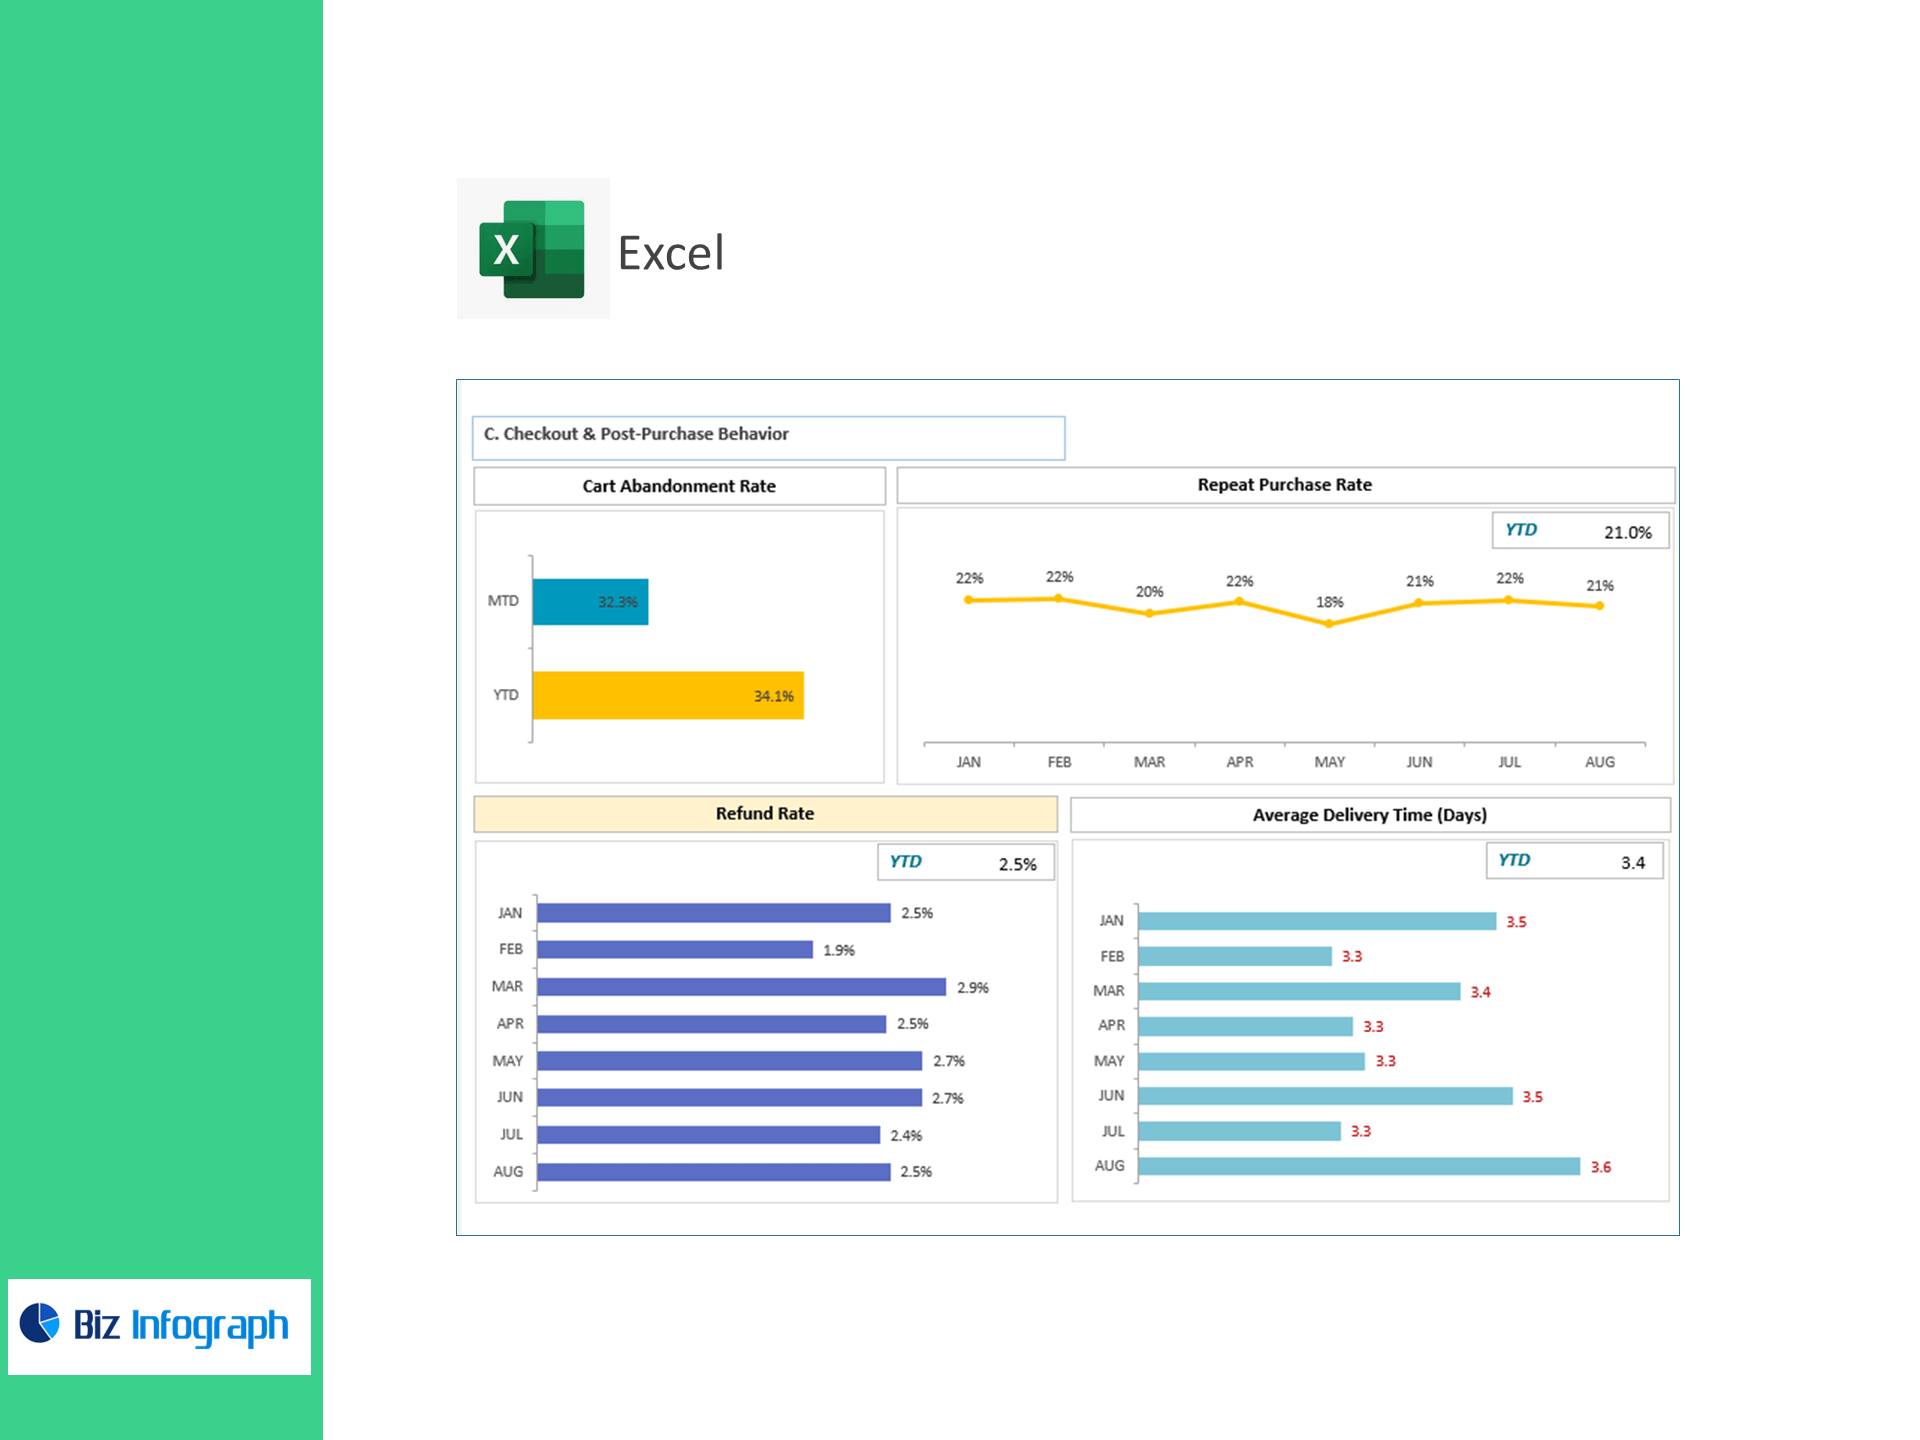
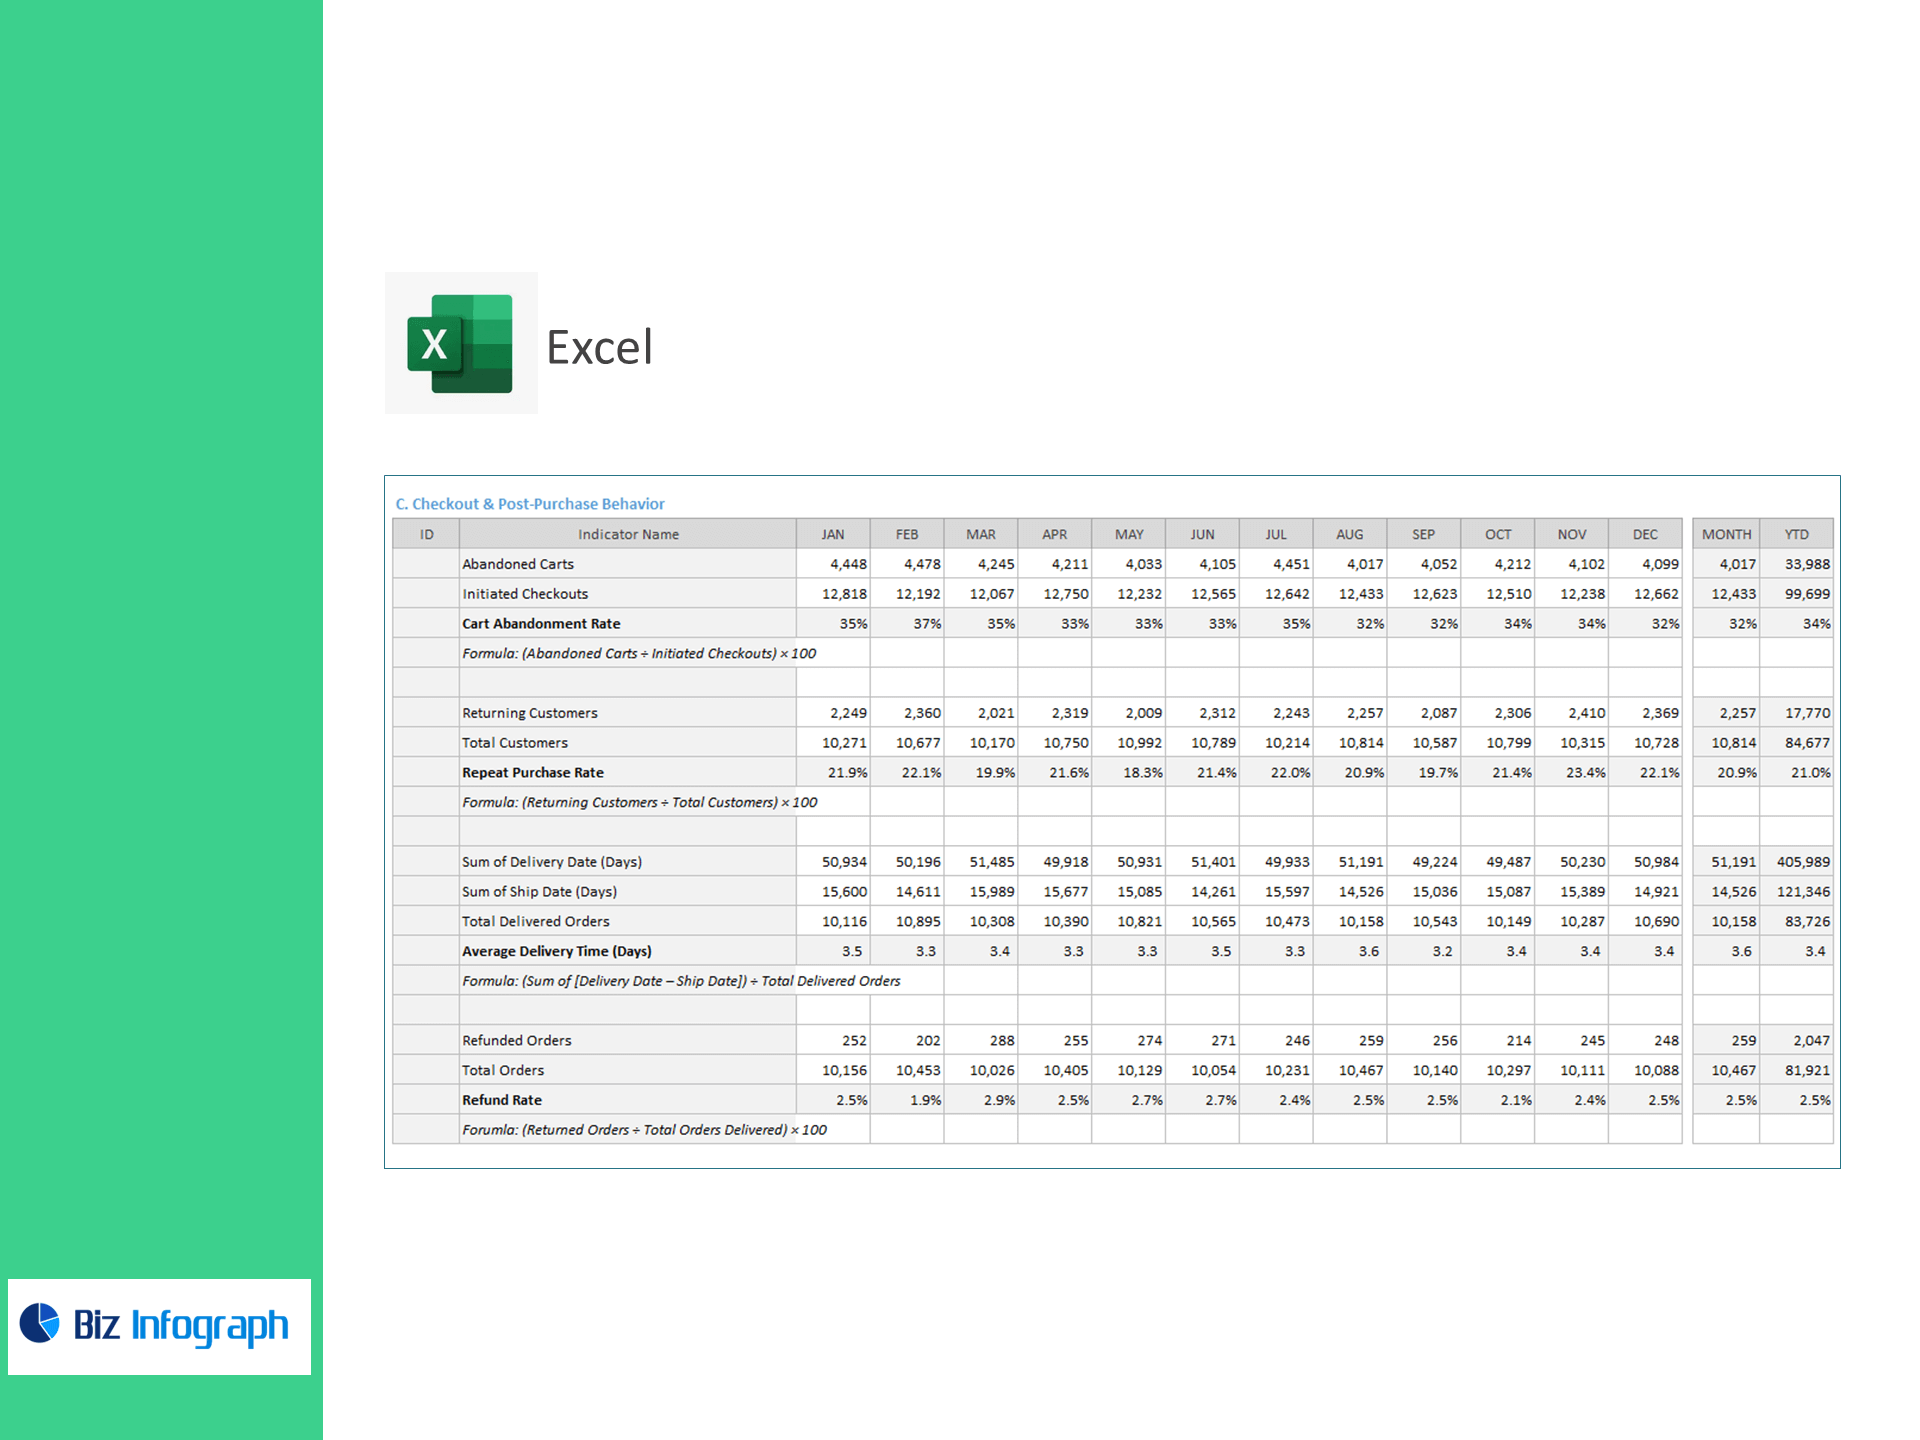
C) Checkout & Post-Purchase Behavior
-
Cart Abandonment Rate (%) = Abandoned Carts ÷ Initiated Checkouts × 100
-
Repeat Purchase Rate (%) = Returning Customers ÷ Total Customers × 100
-
Average Delivery Time (days) = Σ(Delivery Date − Ship Date) ÷ Delivered Orders
-
Refund Rate (%) = Refunded Orders ÷ Total Orders × 100
What’s inside
-
Executive Dashboard: Tiles & trends for fulfillment, processing time, on-time %, returns/refunds, CSAT, AHT, FCR, tickets, abandonment, repeats, and delivery time—with variance to target.
-
Operations Panel: Processing SLAs by warehouse, carrier, or region.
-
CX Command Center: Response & resolution metrics by queue/agent with backlog heatmaps.
-
Checkout Insights: Abandonment and repeat-rate analysis by device/channel.
-
Targets & Assumptions: Enter KPI targets; automatic Above/Below Target flags.
-
Clean Data Sheets: Import-ready tables for orders, shipments, deliveries, returns, surveys, and tickets.
How it works
-
Paste exports from your store, WMS/3PL, courier portals, survey tool, and help-desk.
-
Set reporting period and KPI targets.
-
Review visuals to remove bottlenecks, improve delivery reliability, and lift loyalty.
Benefits
-
Fewer delays & churn: Improve on-time delivery and FCR to raise CSAT.
-
Higher conversion & LTV: Reduce cart abandonment and increase repeat purchase rate.
-
Lower costs: Cut processing time, refunds/returns, and unnecessary contacts.
-
Board-ready reporting: Clear formulas and trendlines for fast decisions.
For ready-to-use Dashboard Templates: