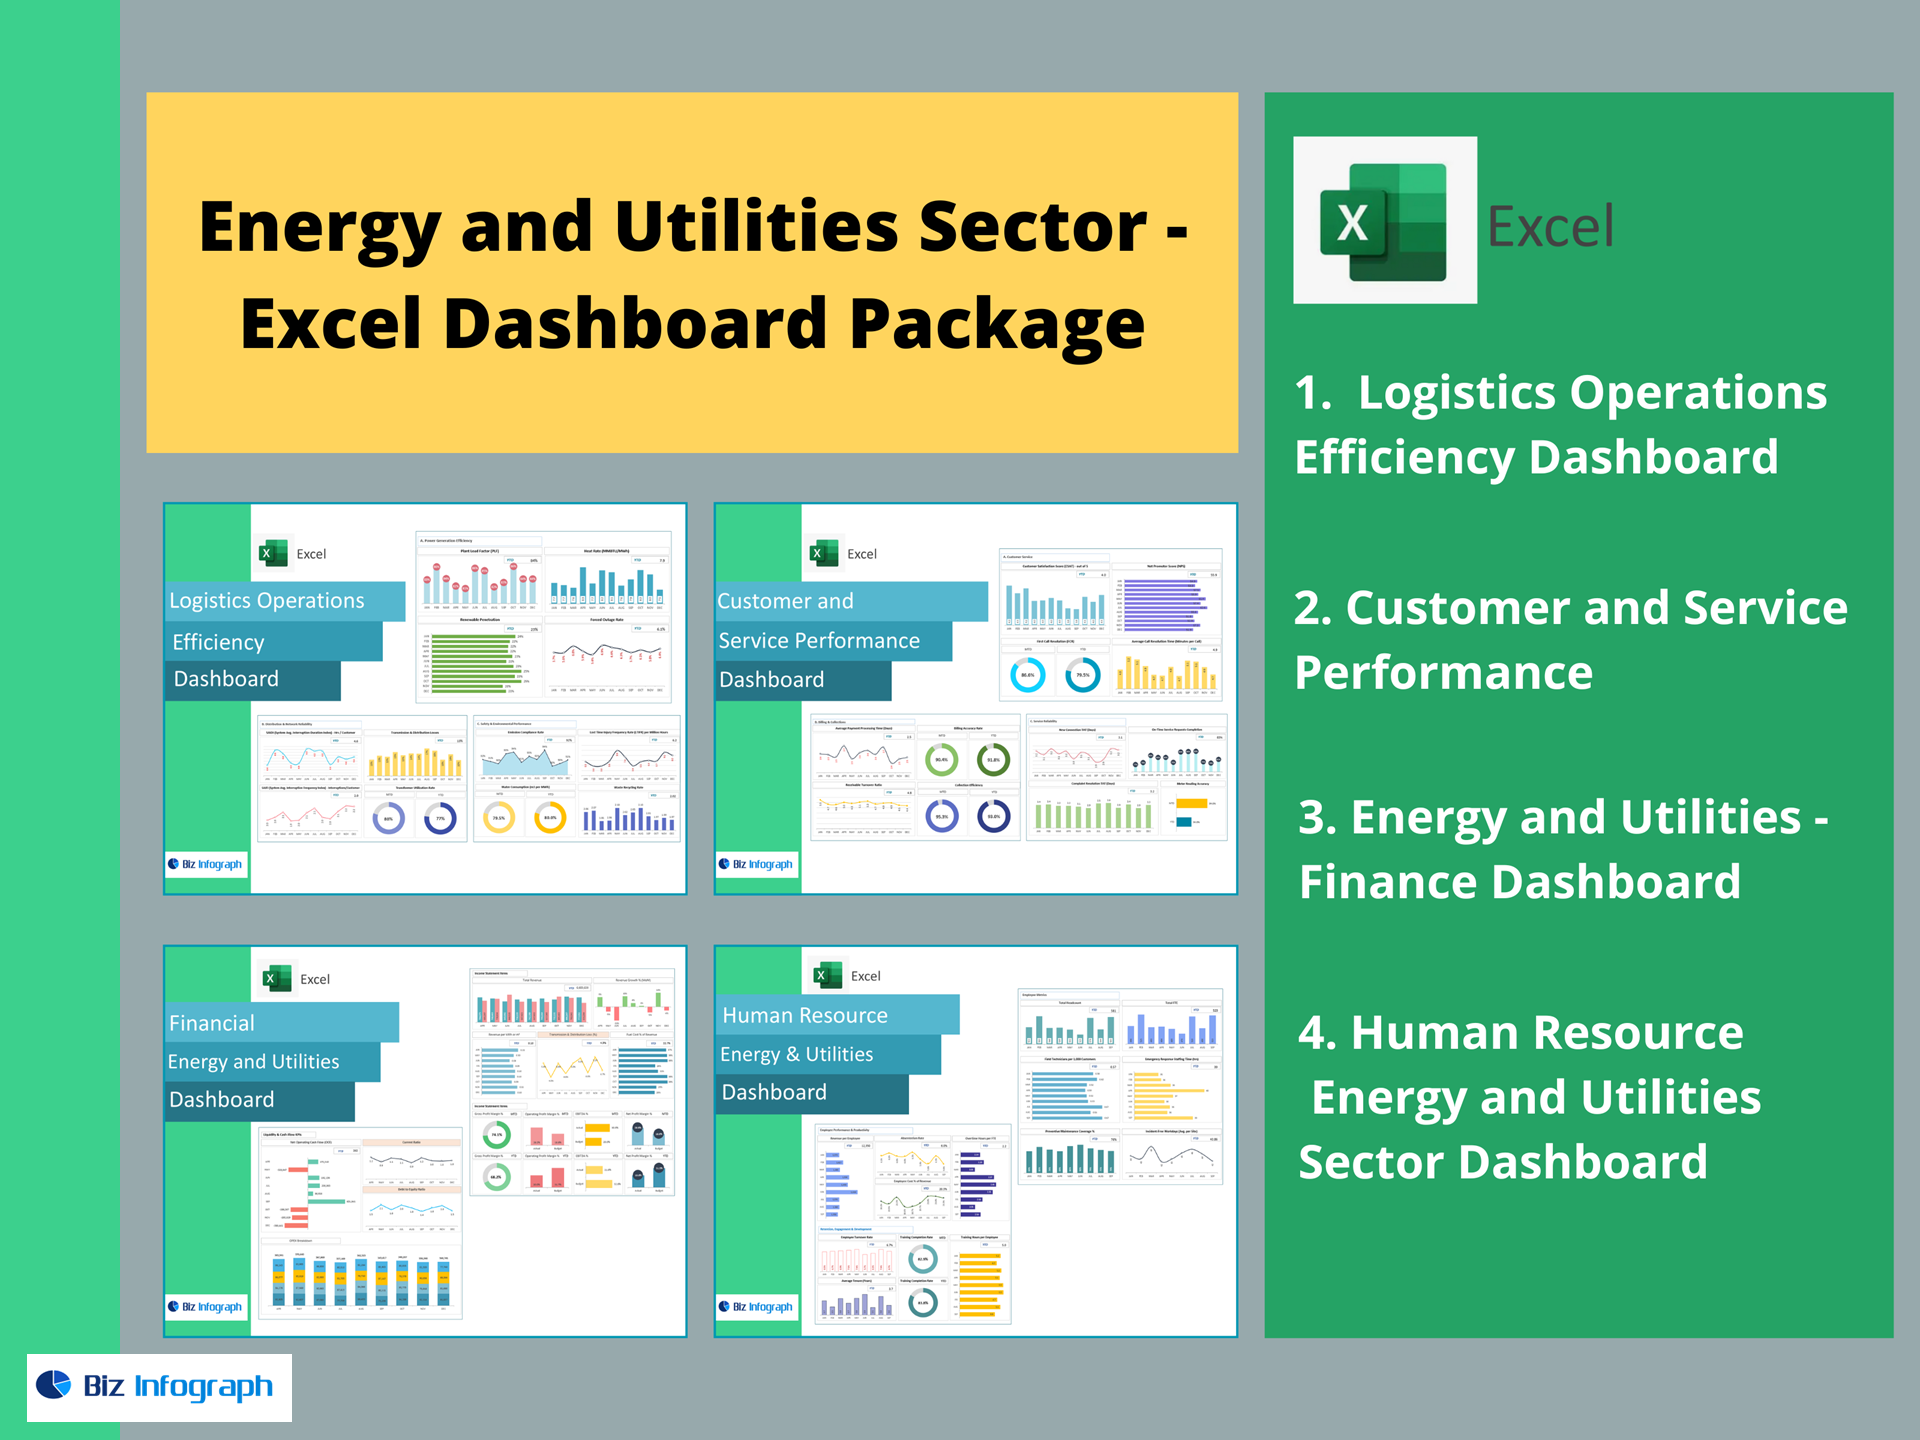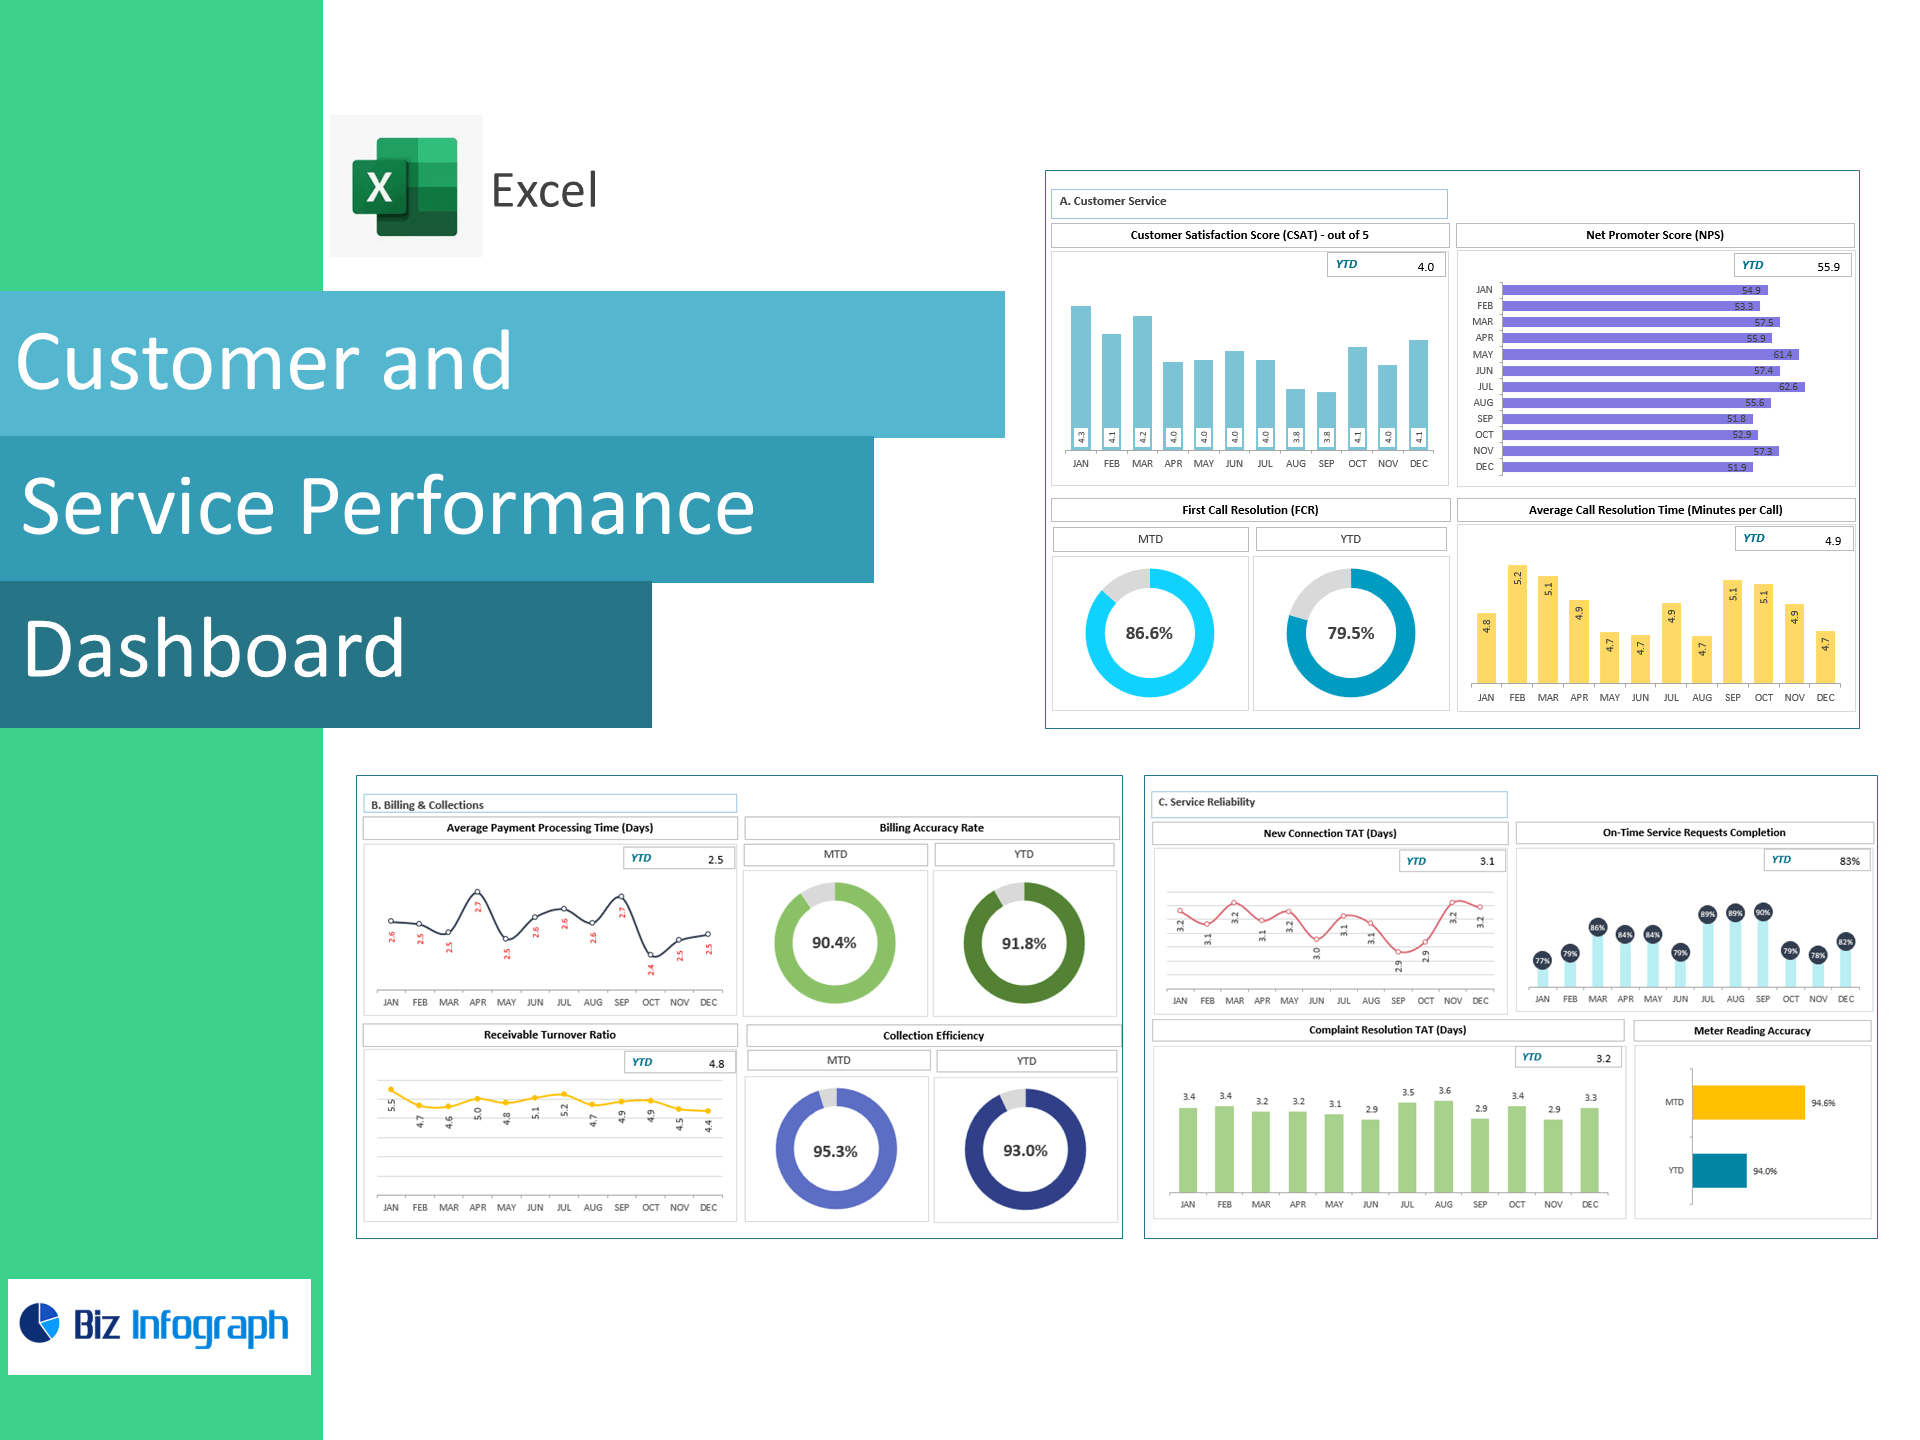
Customer & Service Performance Dashboard — Excel Template
Give your ops, finance, and CX teams one place to watch customer satisfaction, billing accuracy, collections, and service reliability. This plug-and-play Excel dashboard turns raw data from surveys, contact centers, billing, and field service into decision-ready KPIs—no macros, no add-ins.
Who it’s for
Customer Service Managers, Billing & Collections leads, Operations Directors, and CFO/FP&A teams that want end-to-end customer and service performance tracking without building a model from scratch.
What you get
-
Interactive dashboard (Excel 2016+ Win/Mac) with filters for site, team, product, and period
-
Clean Data tabs for surveys, calls, bills, payments, A/R, activations, complaints, meters, and work orders
-
Targets & RAG (red/amber/green), MoM/YoY trends, and variance-to-goal cards
-
Print-ready views for QBRs and exec/board packs
KPIs Included (with formulas)
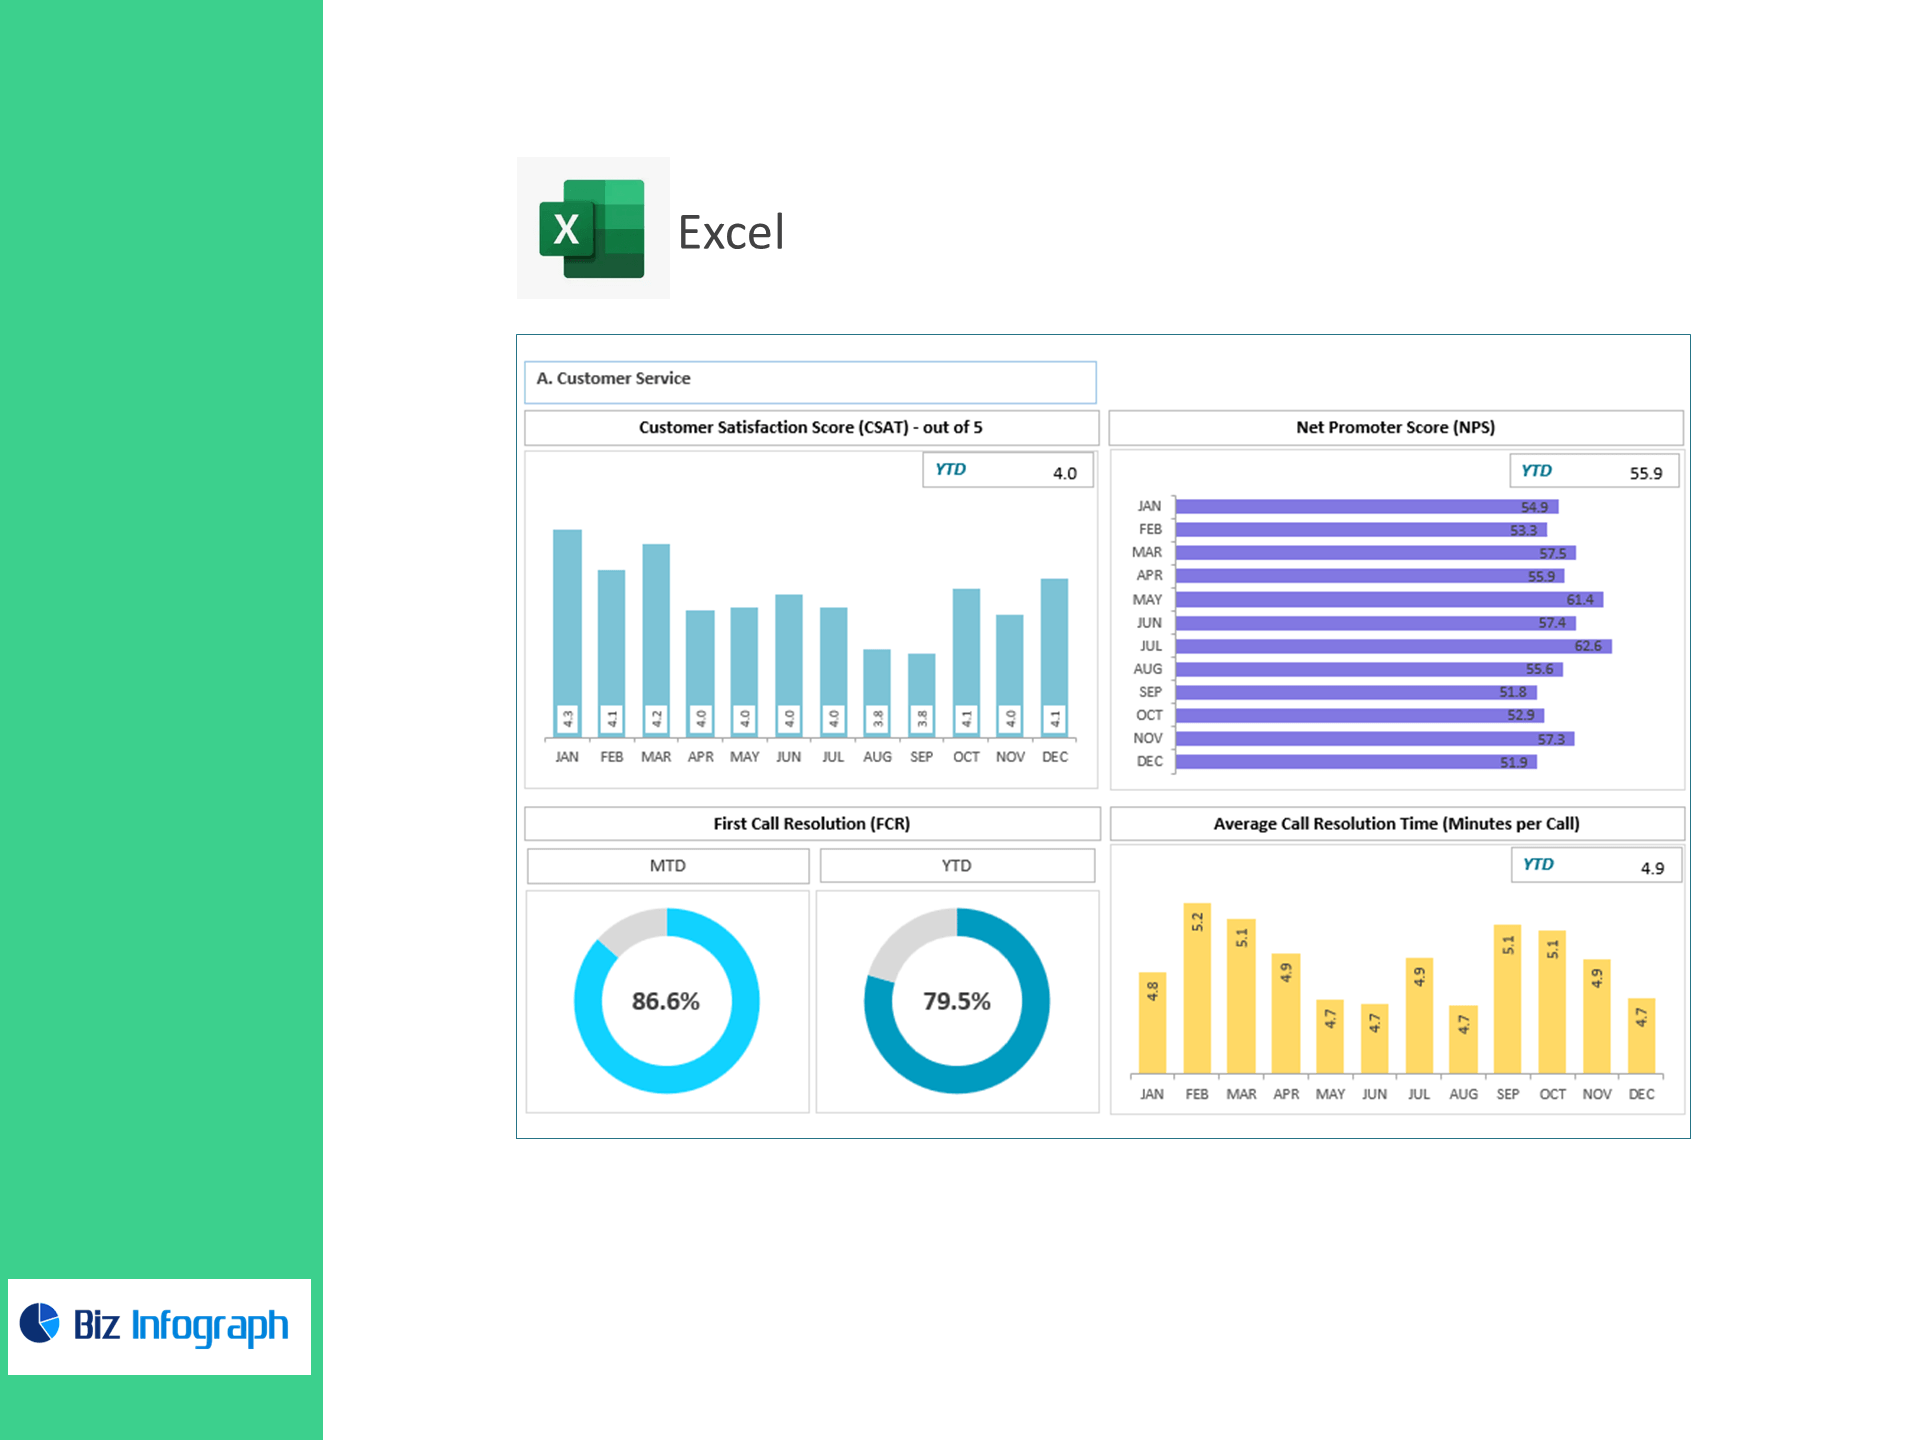
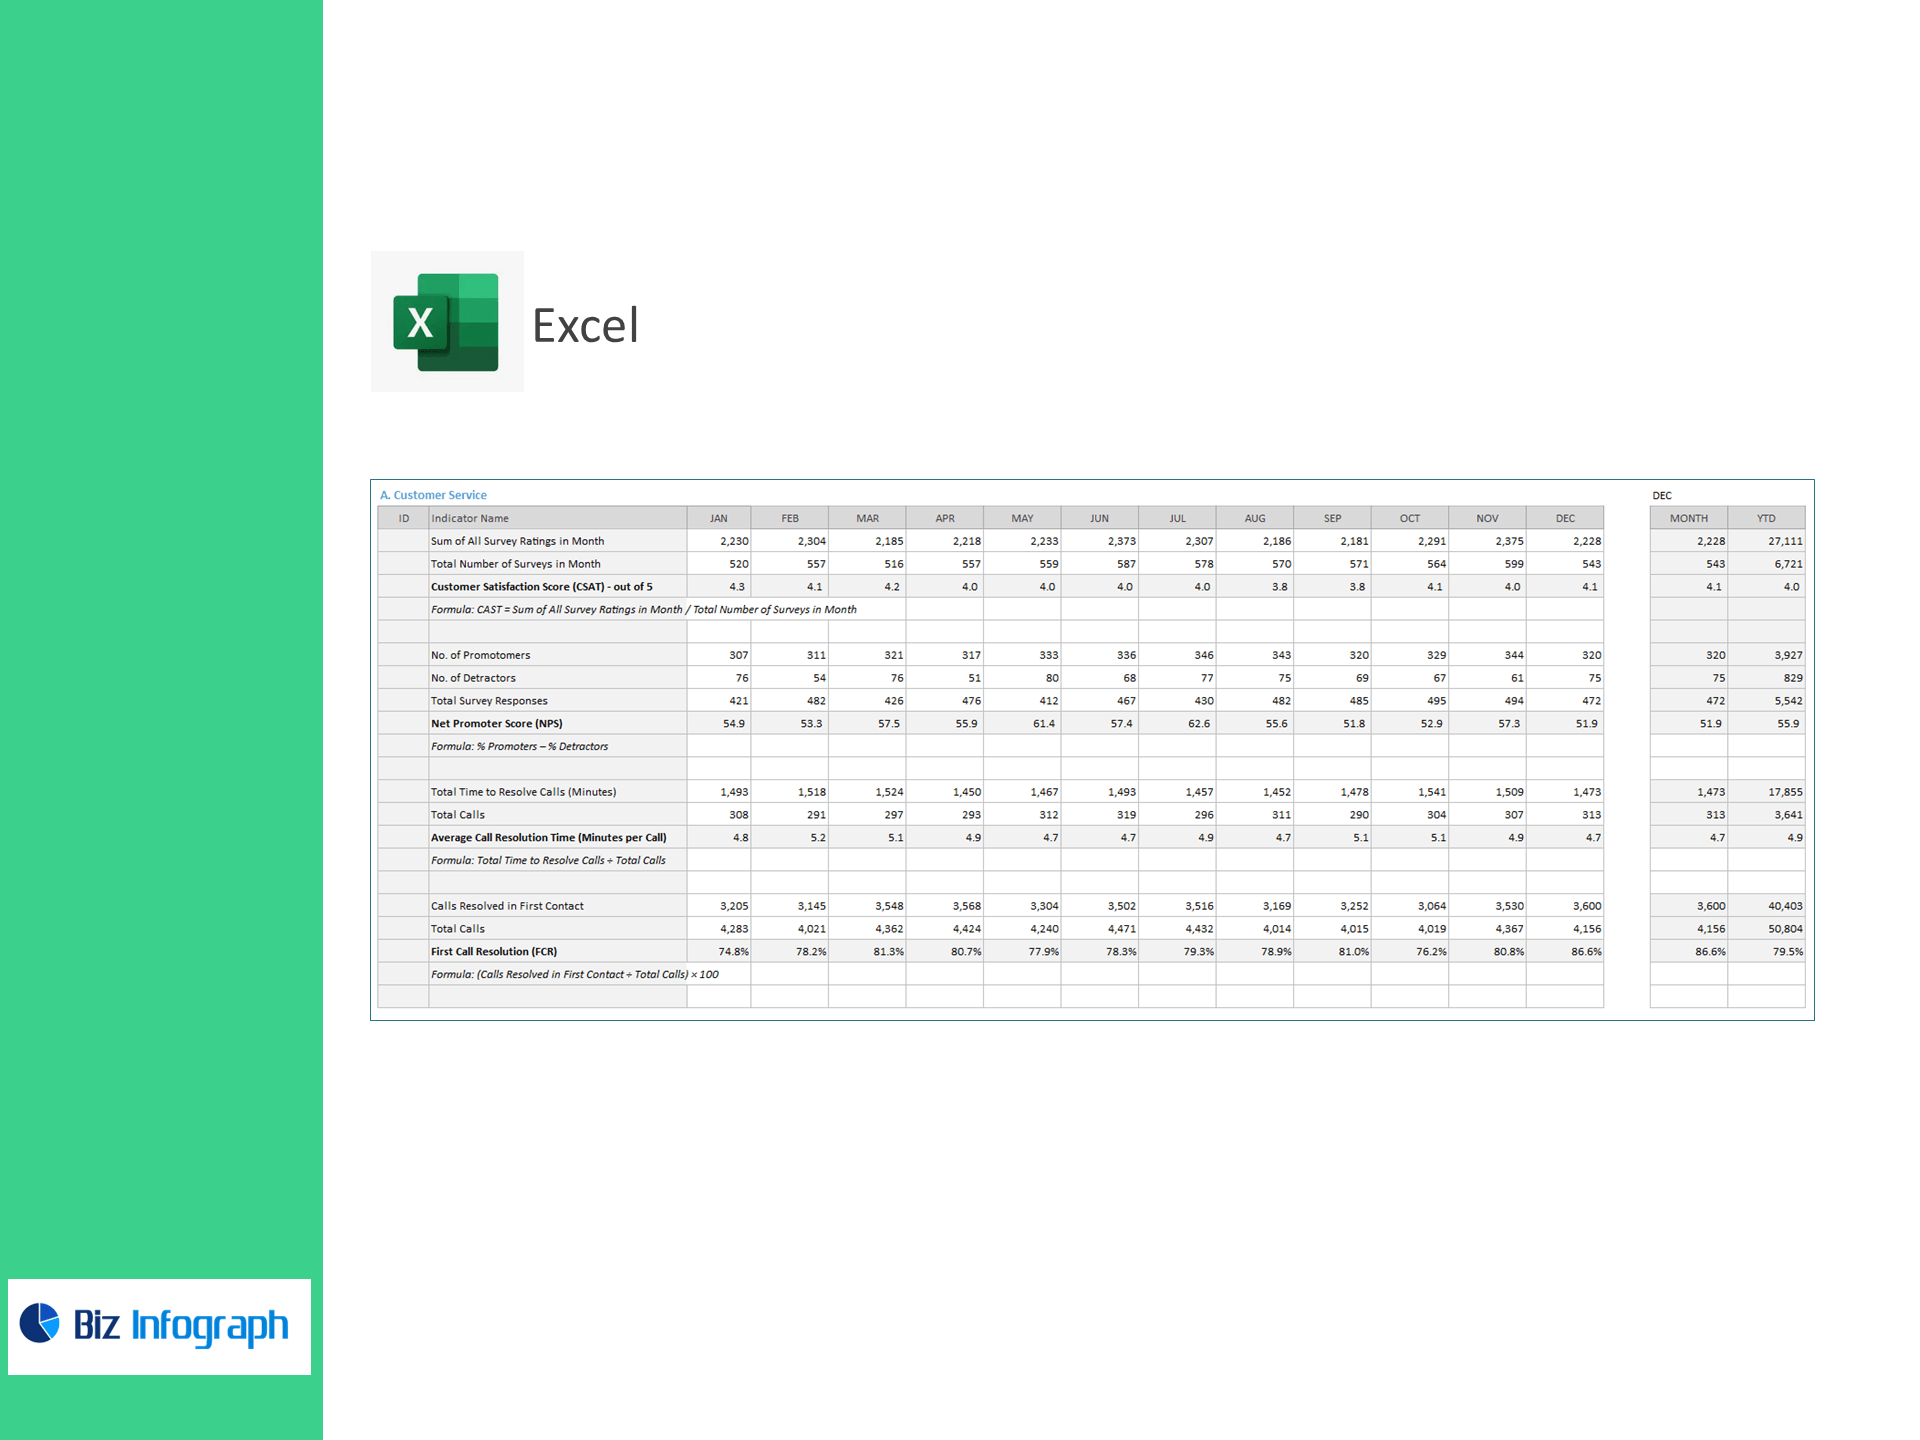
A) Customer Service
-
Customer Satisfaction Score (CSAT) (out of 5)
CSAT = Sum of All Survey Ratings in Month ÷ Total Number of Surveys in Month -
Net Promoter Score (NPS)
NPS = % Promoters – % Detractors -
Average Call Resolution Time (min/call)
Total Time to Resolve Calls ÷ Total Calls -
First Call Resolution (FCR) %
(Calls Resolved in First Contact ÷ Total Calls) × 100
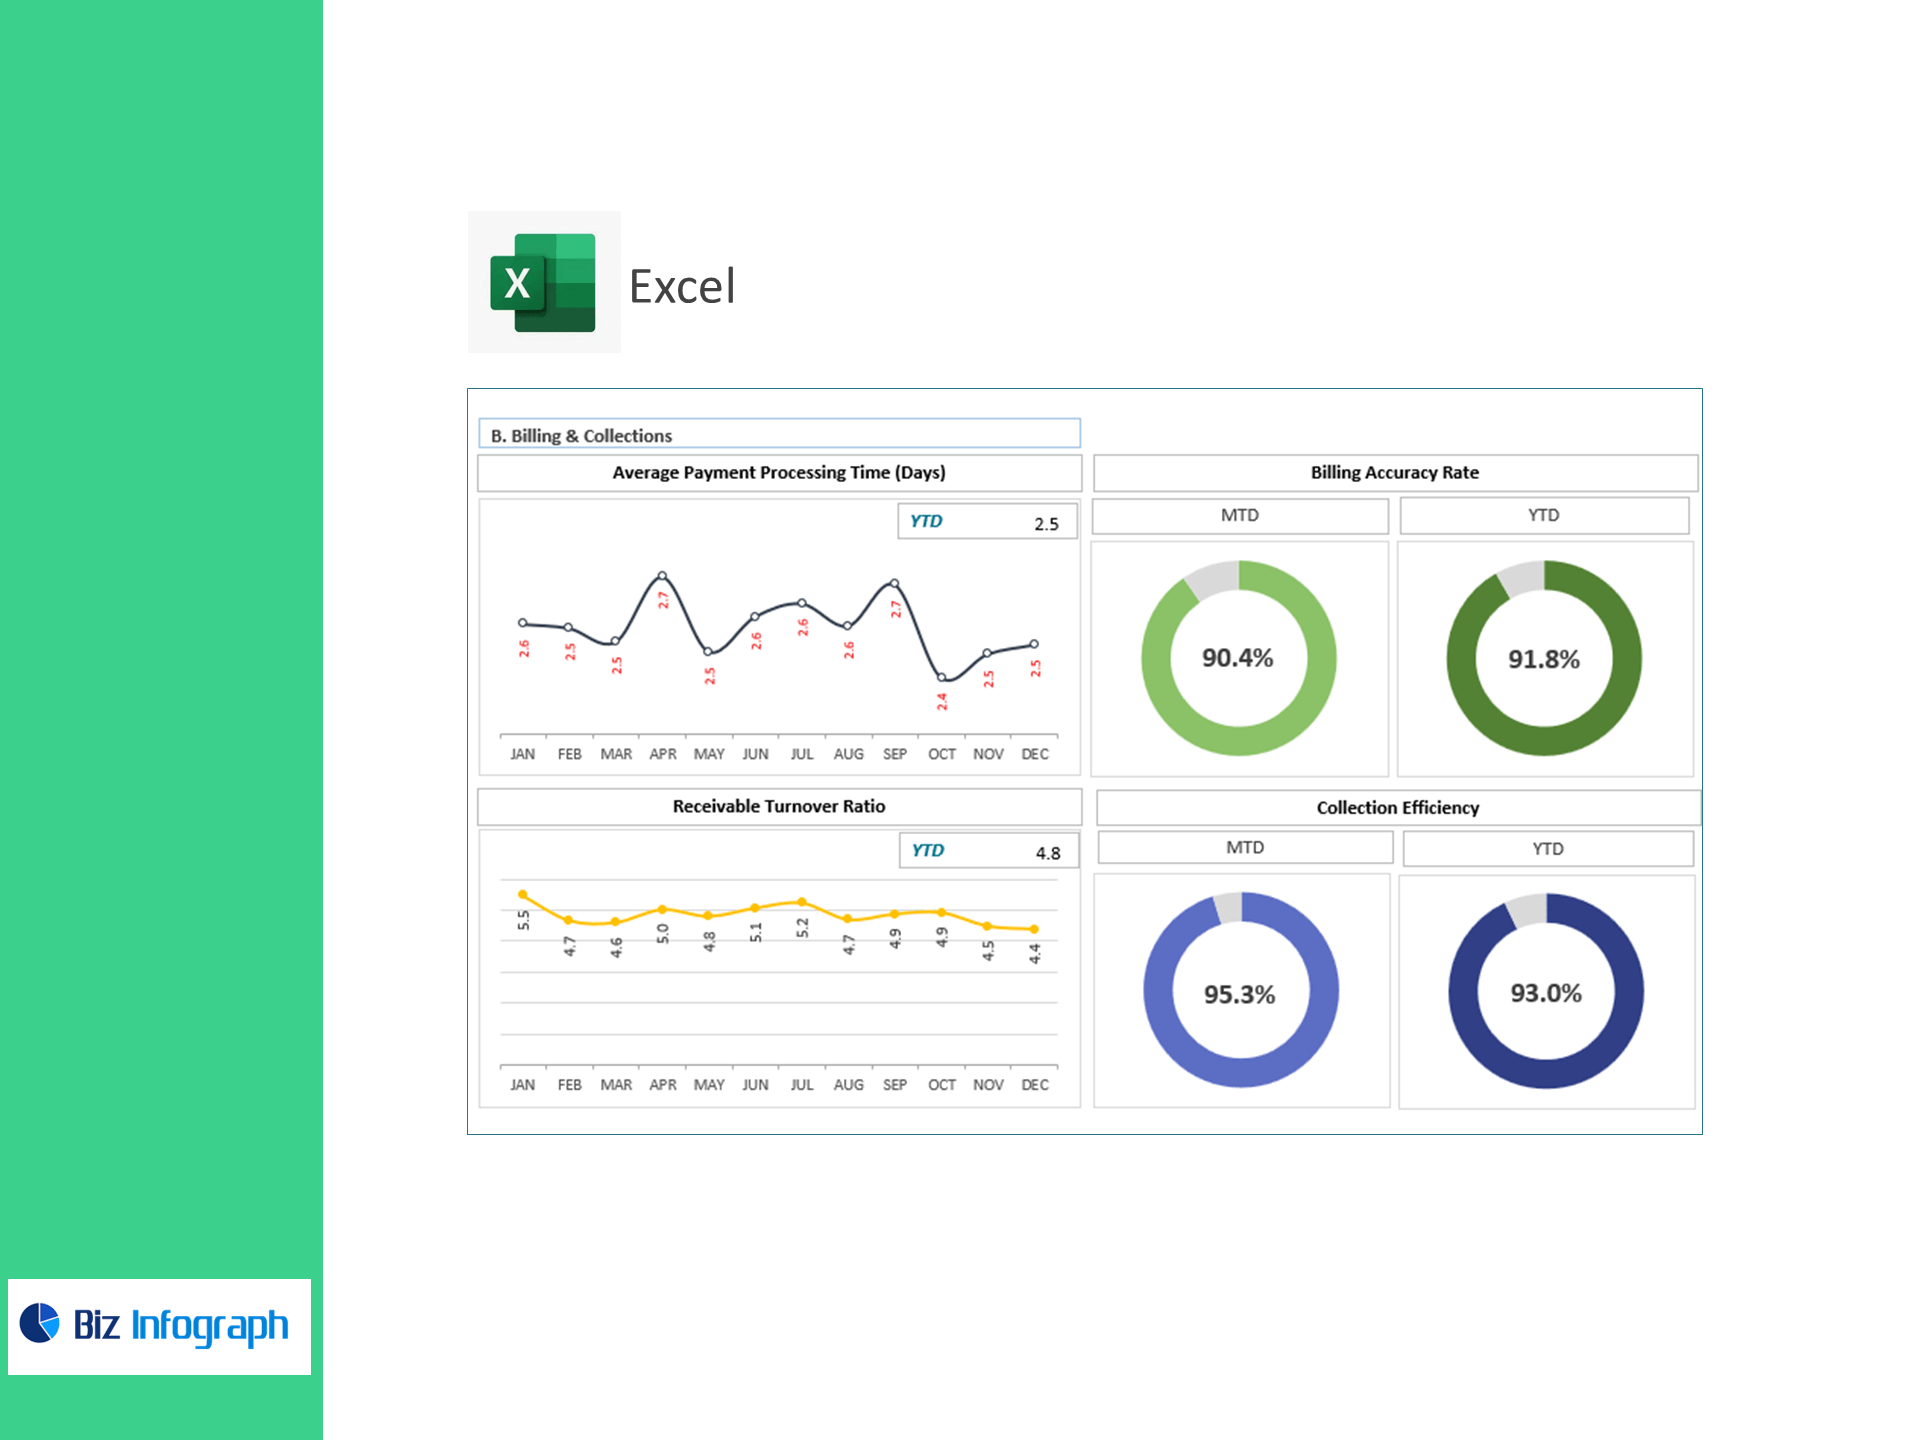
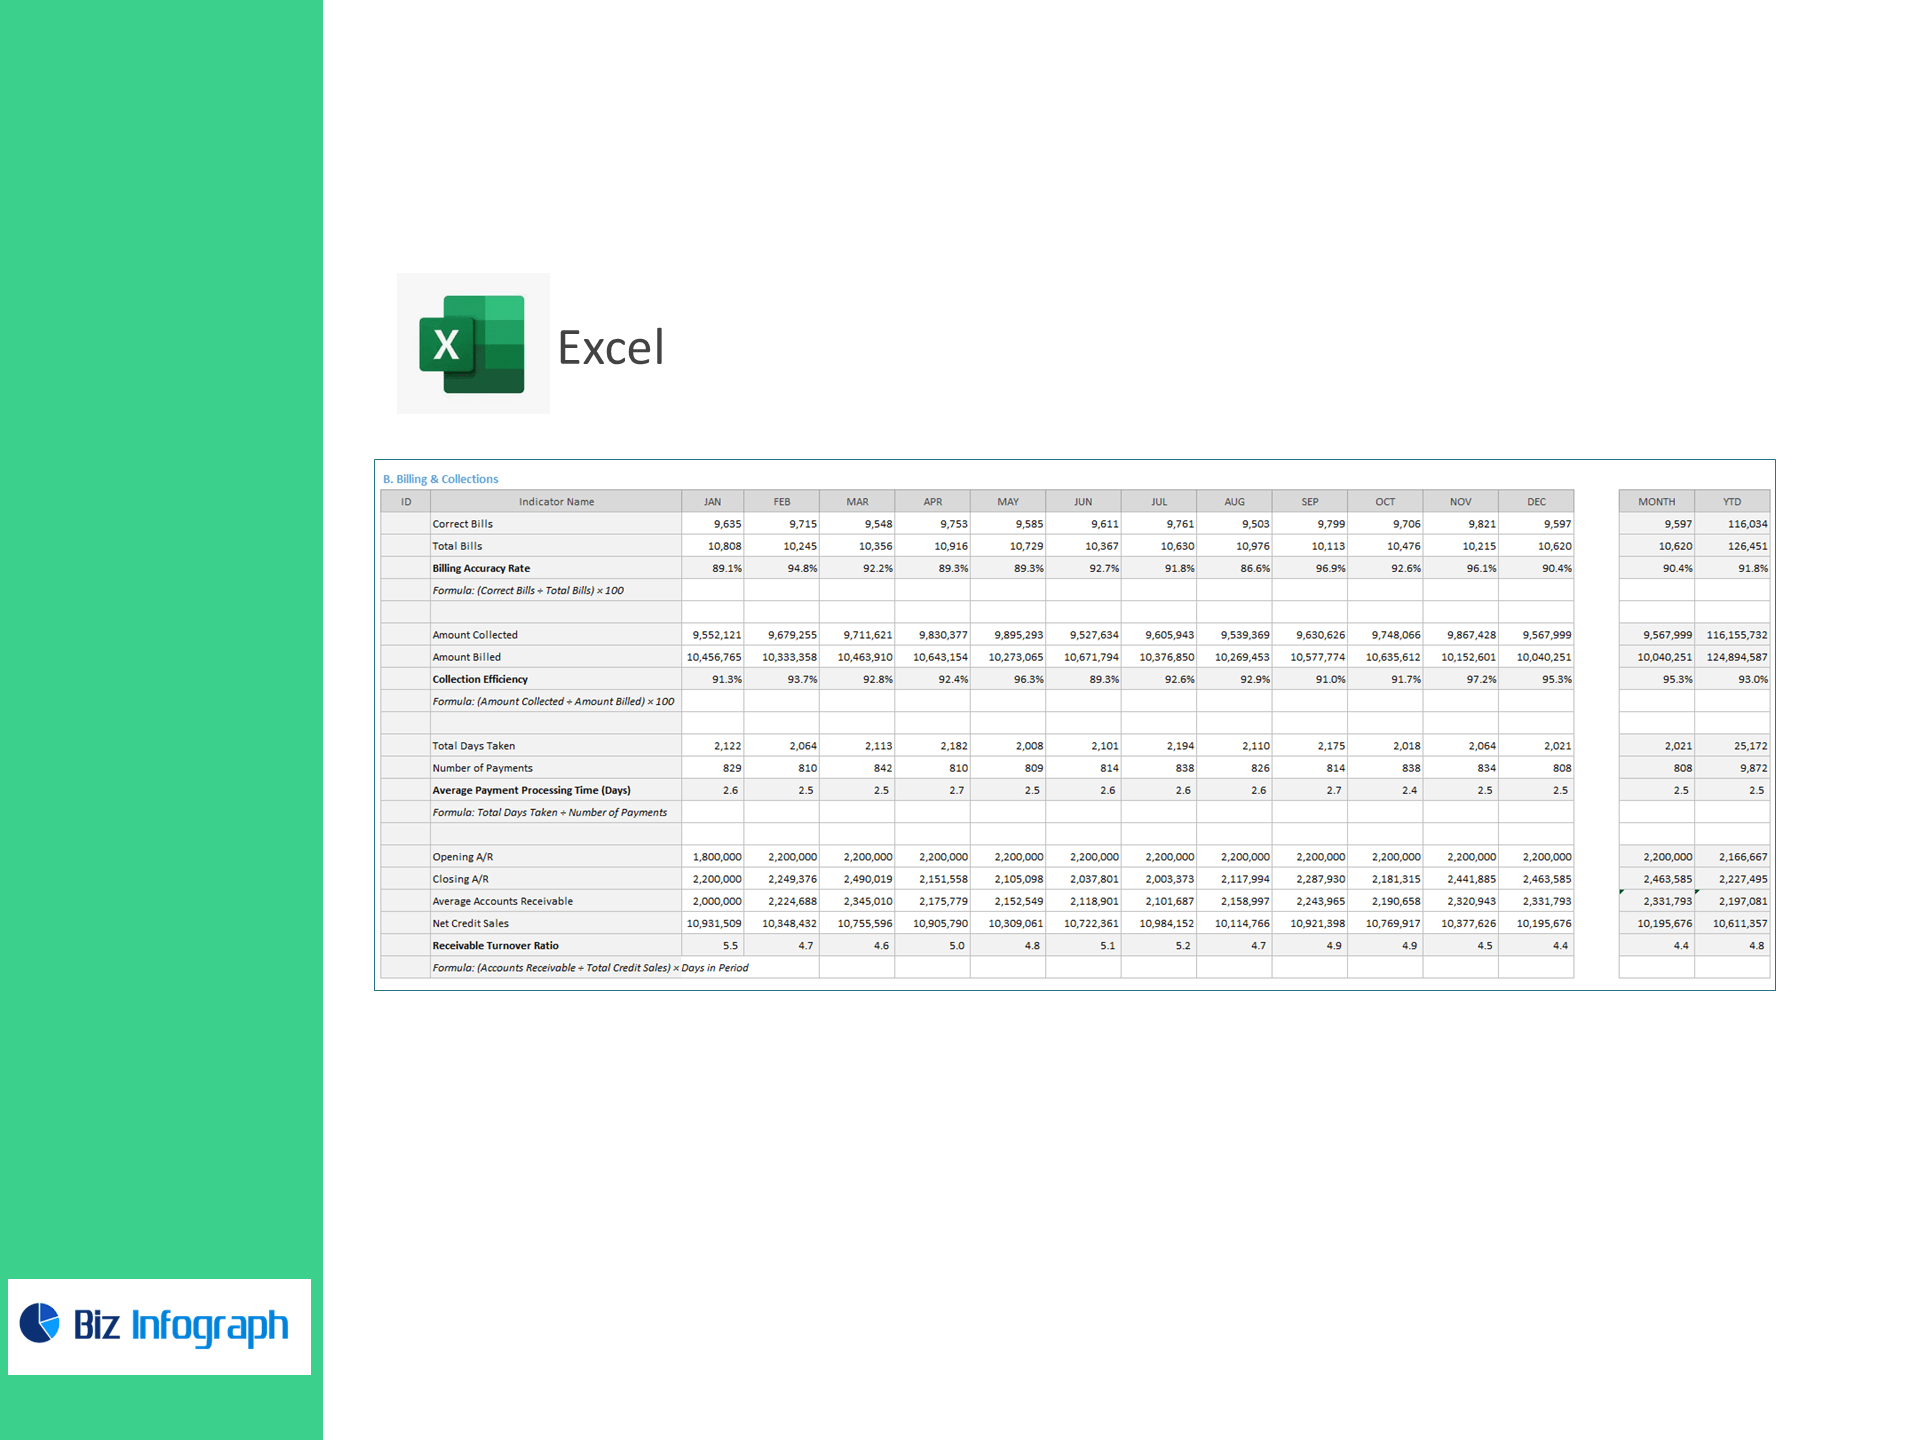
B) Billing & Collections
-
Billing Accuracy Rate %
(Correct Bills ÷ Total Bills) × 100 -
Collection Efficiency %
(Amount Collected ÷ Amount Billed) × 100 -
Average Payment Processing Time (days)
Total Days Taken ÷ Number of Payments -
Receivable Turnover (Days) (per provided method)
(Average Accounts Receivable ÷ Net Credit Sales) × Days in Period
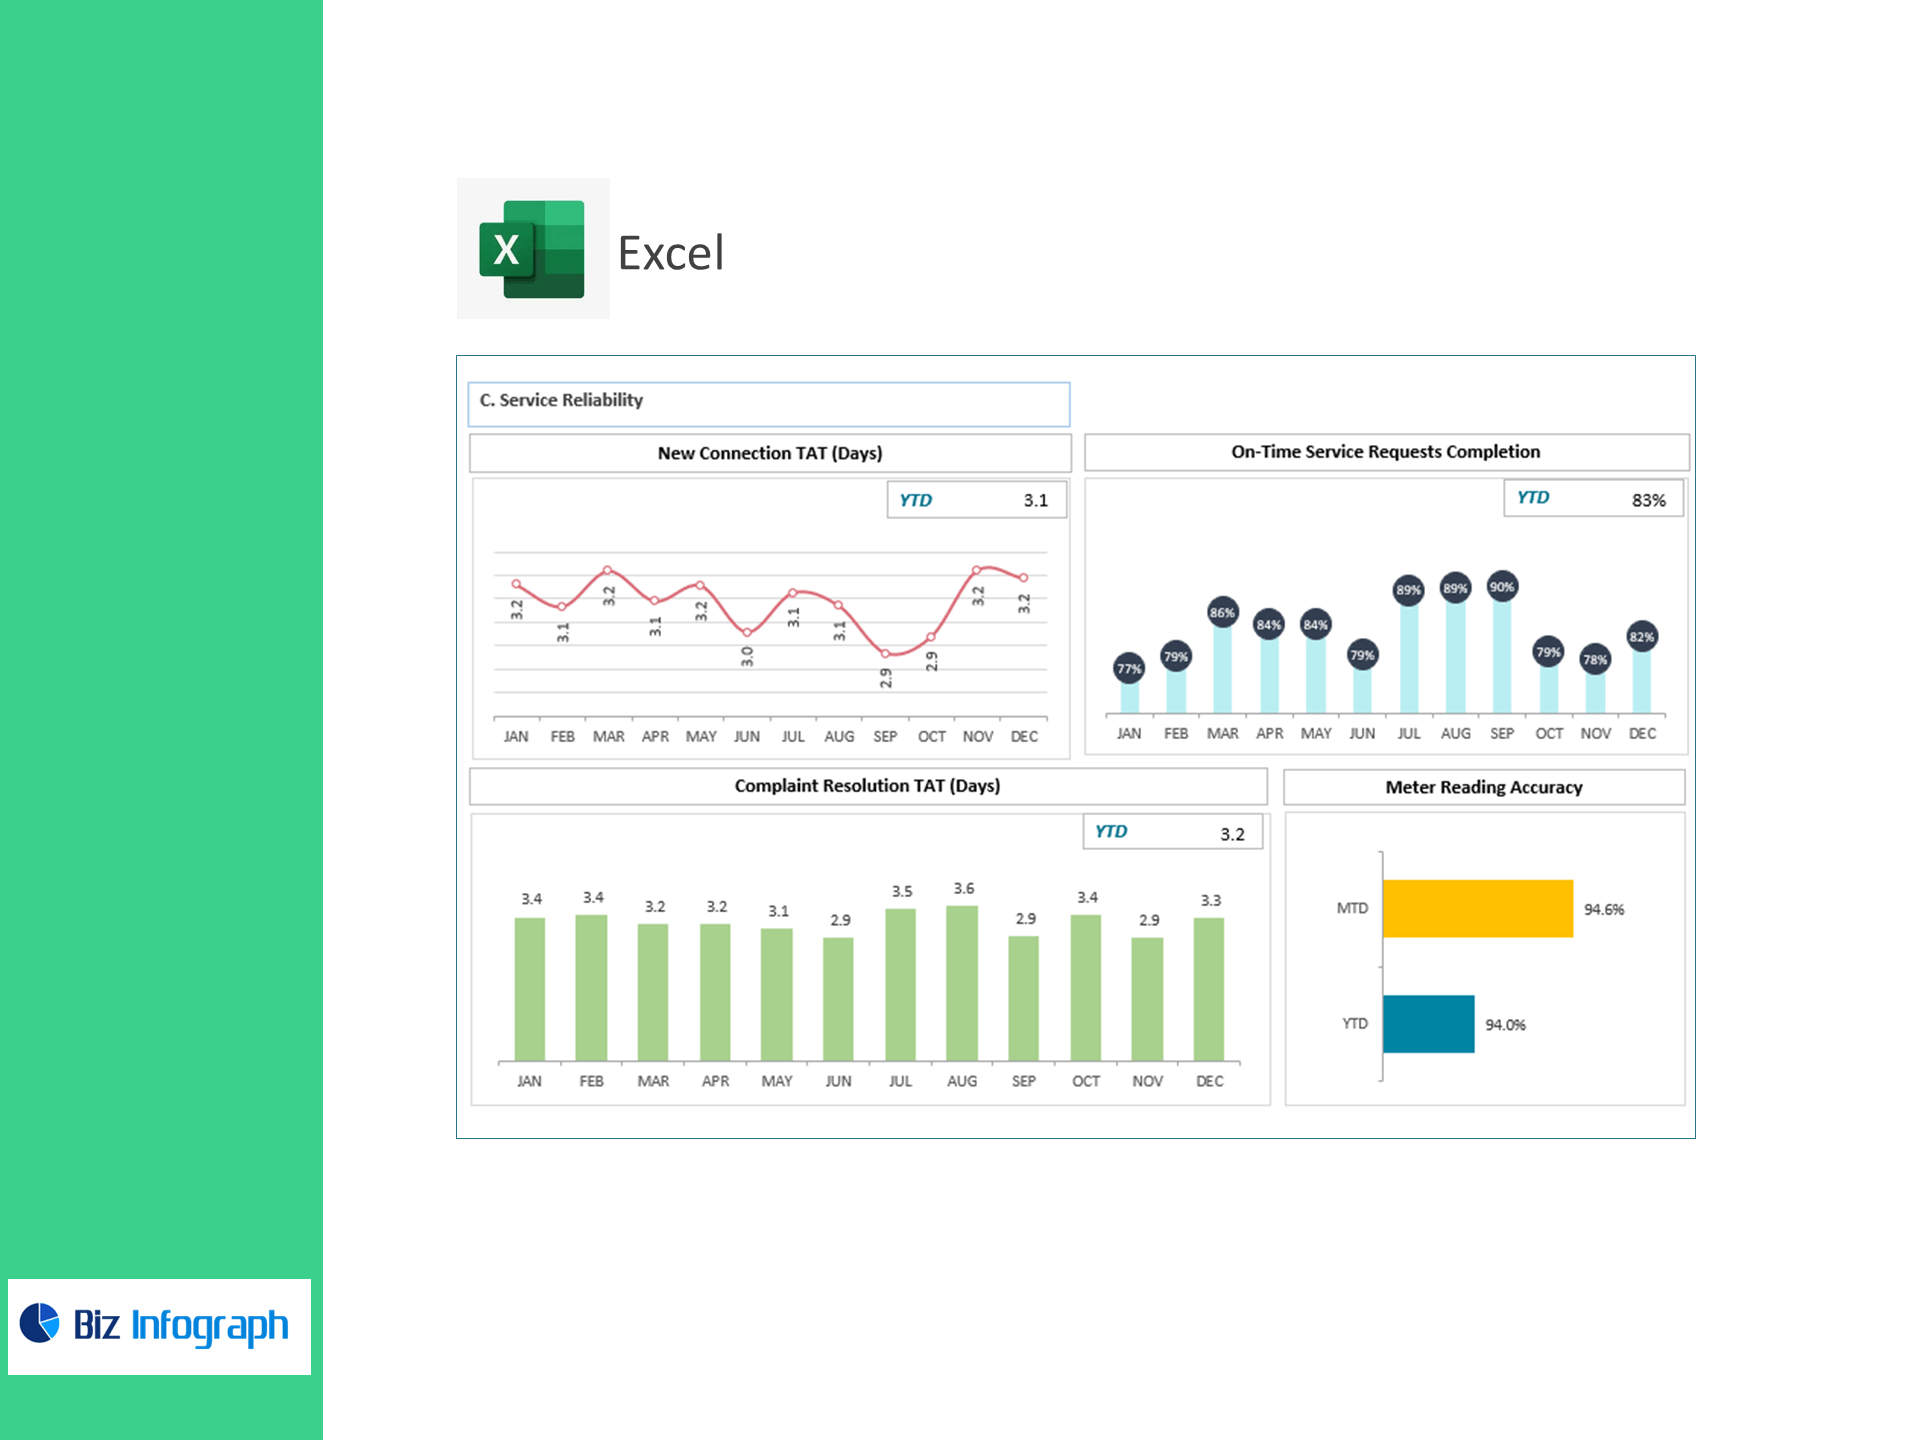
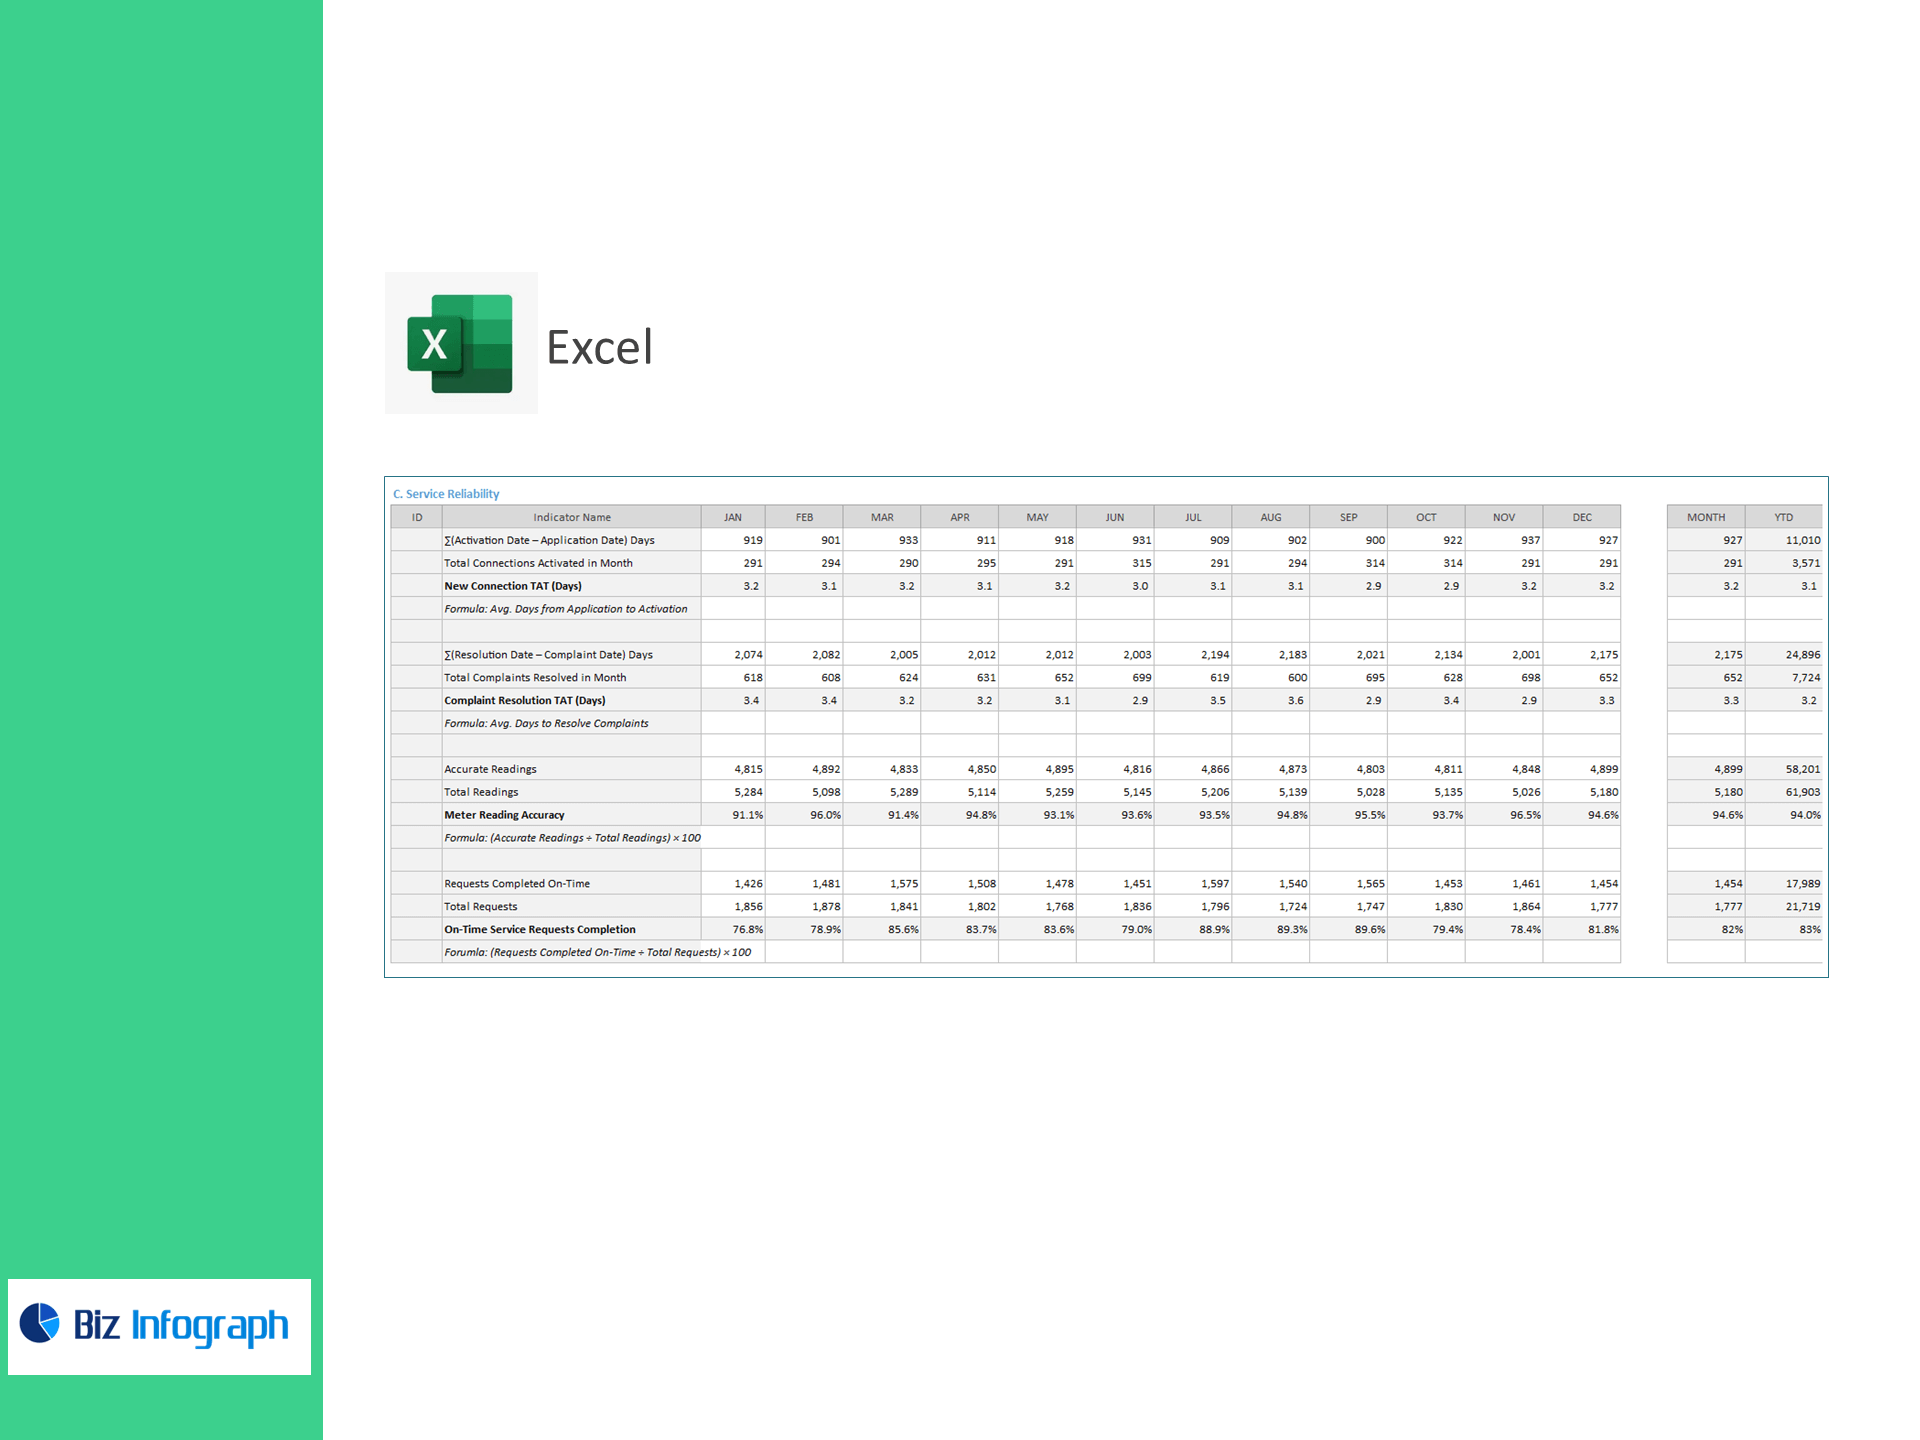
C) Service Reliability
-
New Connection TAT (days)
Average Days from Application to Activation -
Complaint Resolution TAT (days)
Average Days from Complaint to Resolution -
Meter Reading Accuracy %
(Accurate Readings ÷ Total Readings) × 100 -
On-Time Service Requests Completion %
(Requests Completed On-Time ÷ Total Requests) × 100
Why teams choose this template
-
See the full journey: link CSAT/NPS with FCR and resolution time to pinpoint friction.
-
Protect cash: track billing accuracy, collection efficiency, and A/R days in one view.
-
Speed up service: monitor activation and complaint TAT to maintain SLAs.
-
Trust the numbers: transparent, editable KPI formulas and error checks.
What’s inside the workbook
-
Executive Overview: headline KPIs with trend lines and target deltas
-
Operational drilldowns: channel/queue analysis, issue categories, dispute causes
-
A/R & Collections module: cohort views, promise-to-pay vs. collected
-
Settings & Thresholds: targets, segments, and business calendar
-
Documentation tab: plain-English KPI definitions & setup steps
For ready-to-use Dashboard Templates: