HR Hospitality & Tourism Dashboard — Excel Template
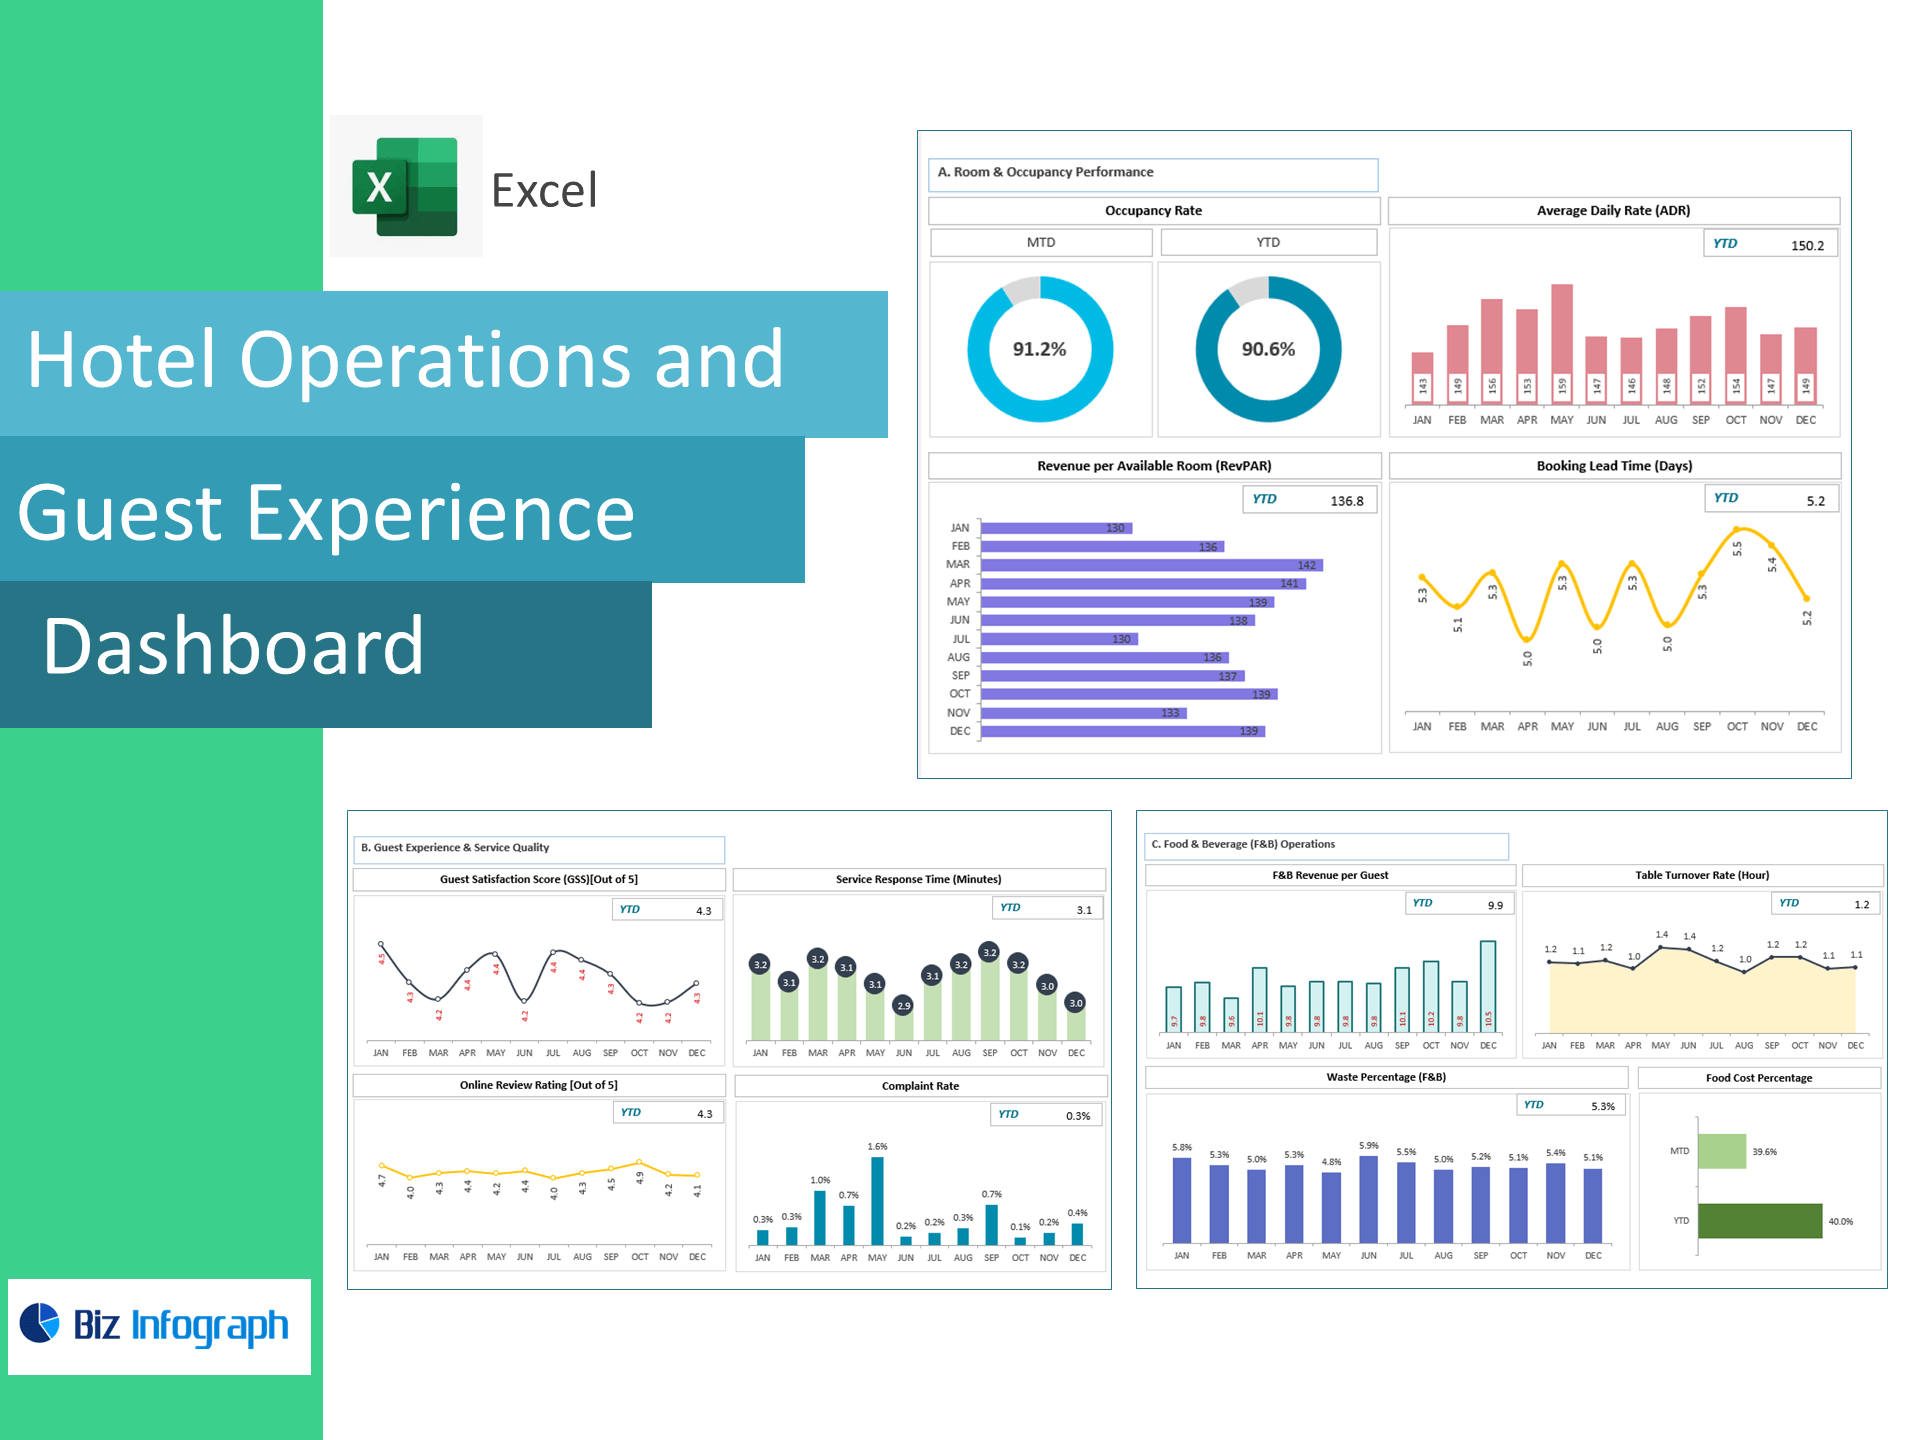
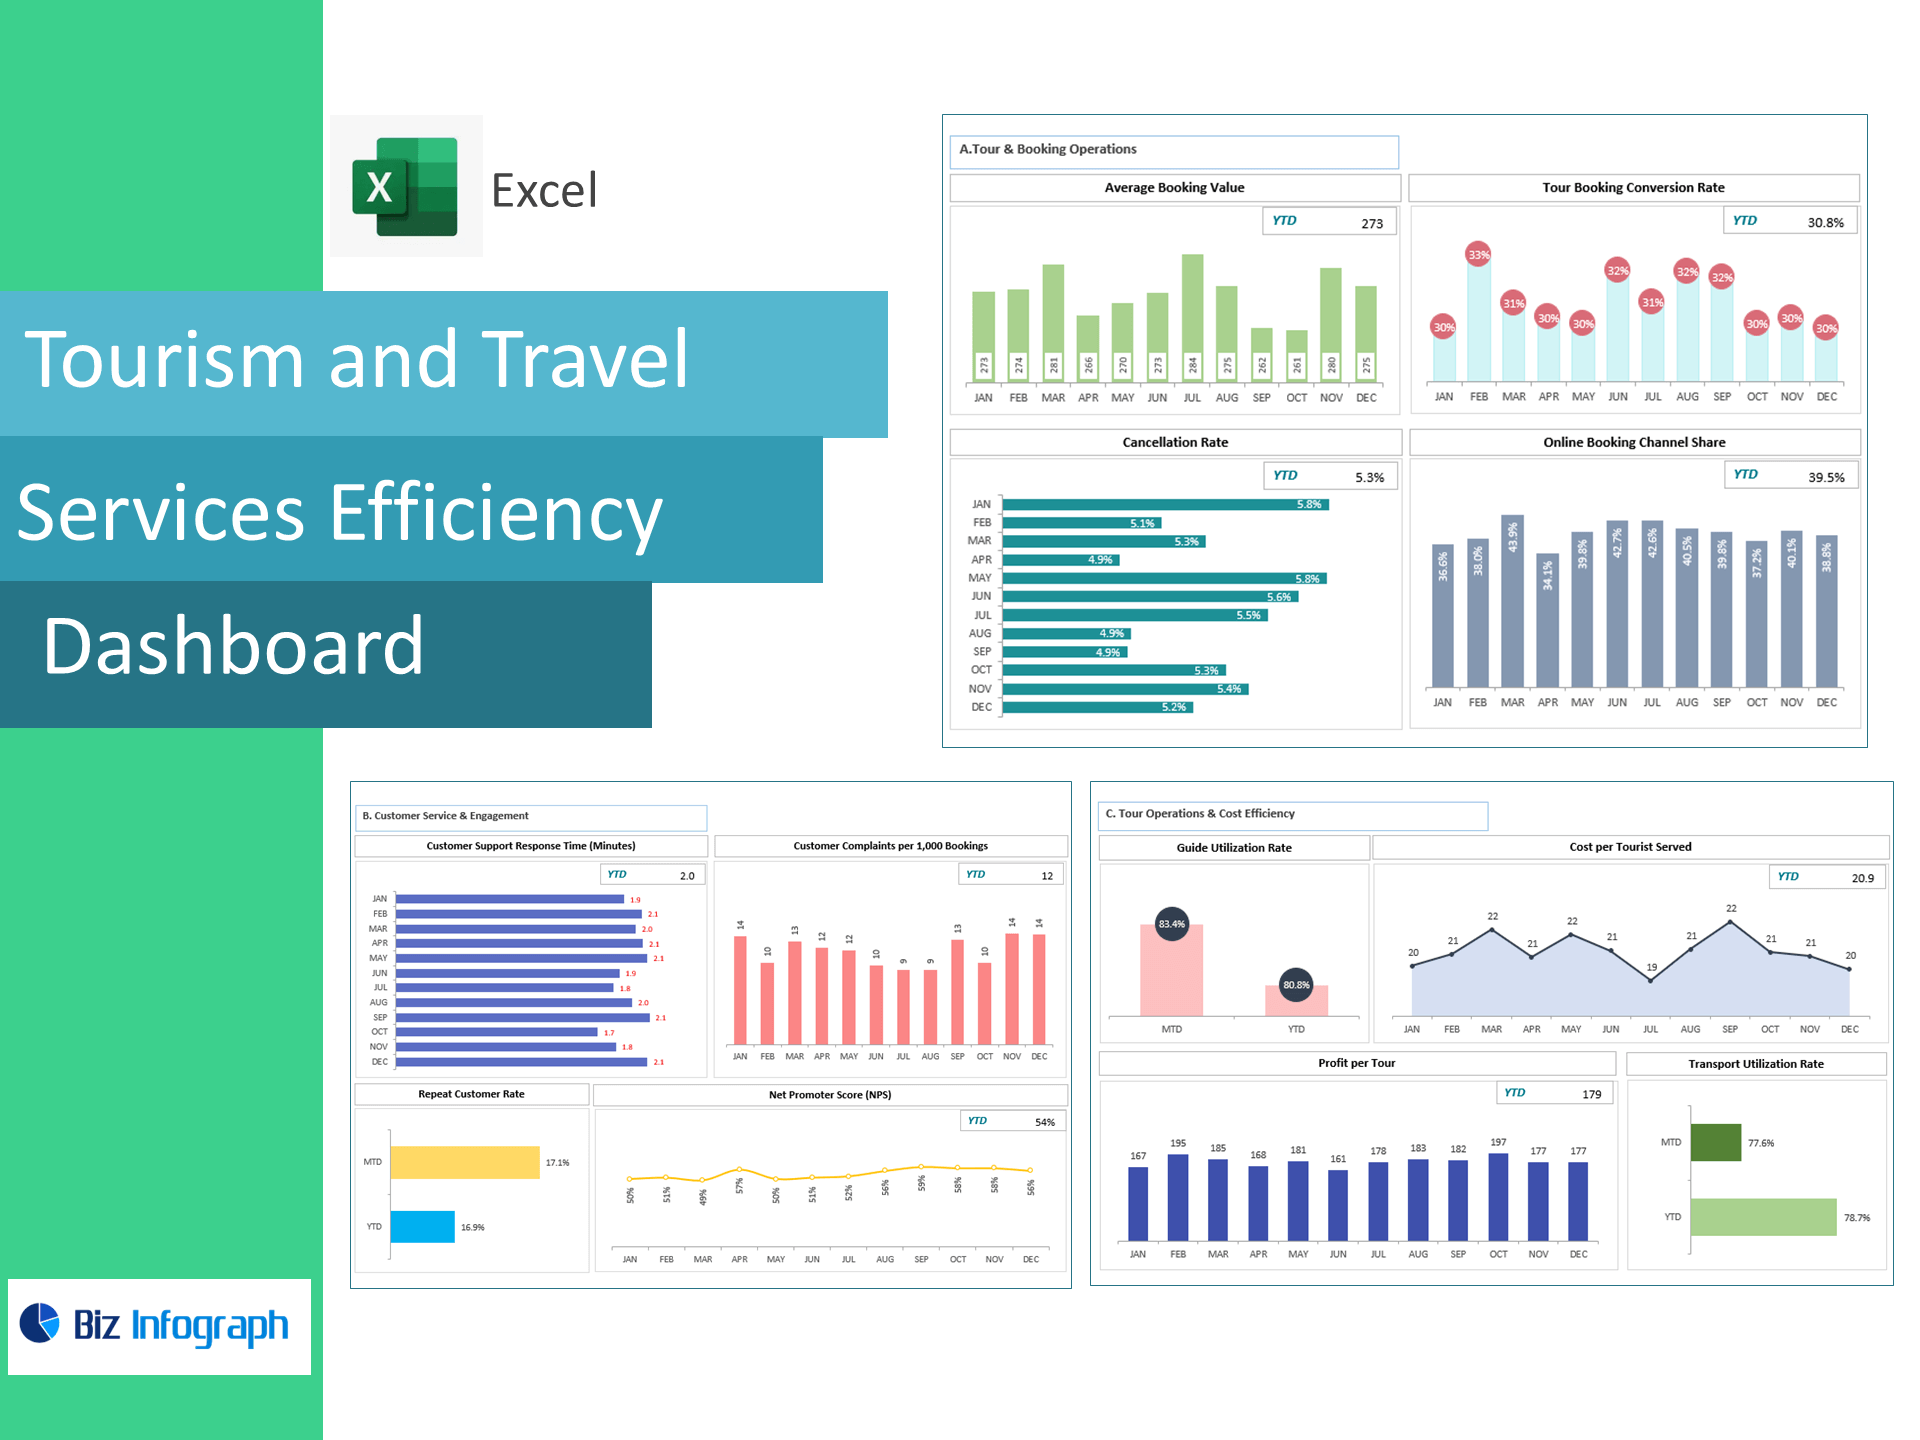
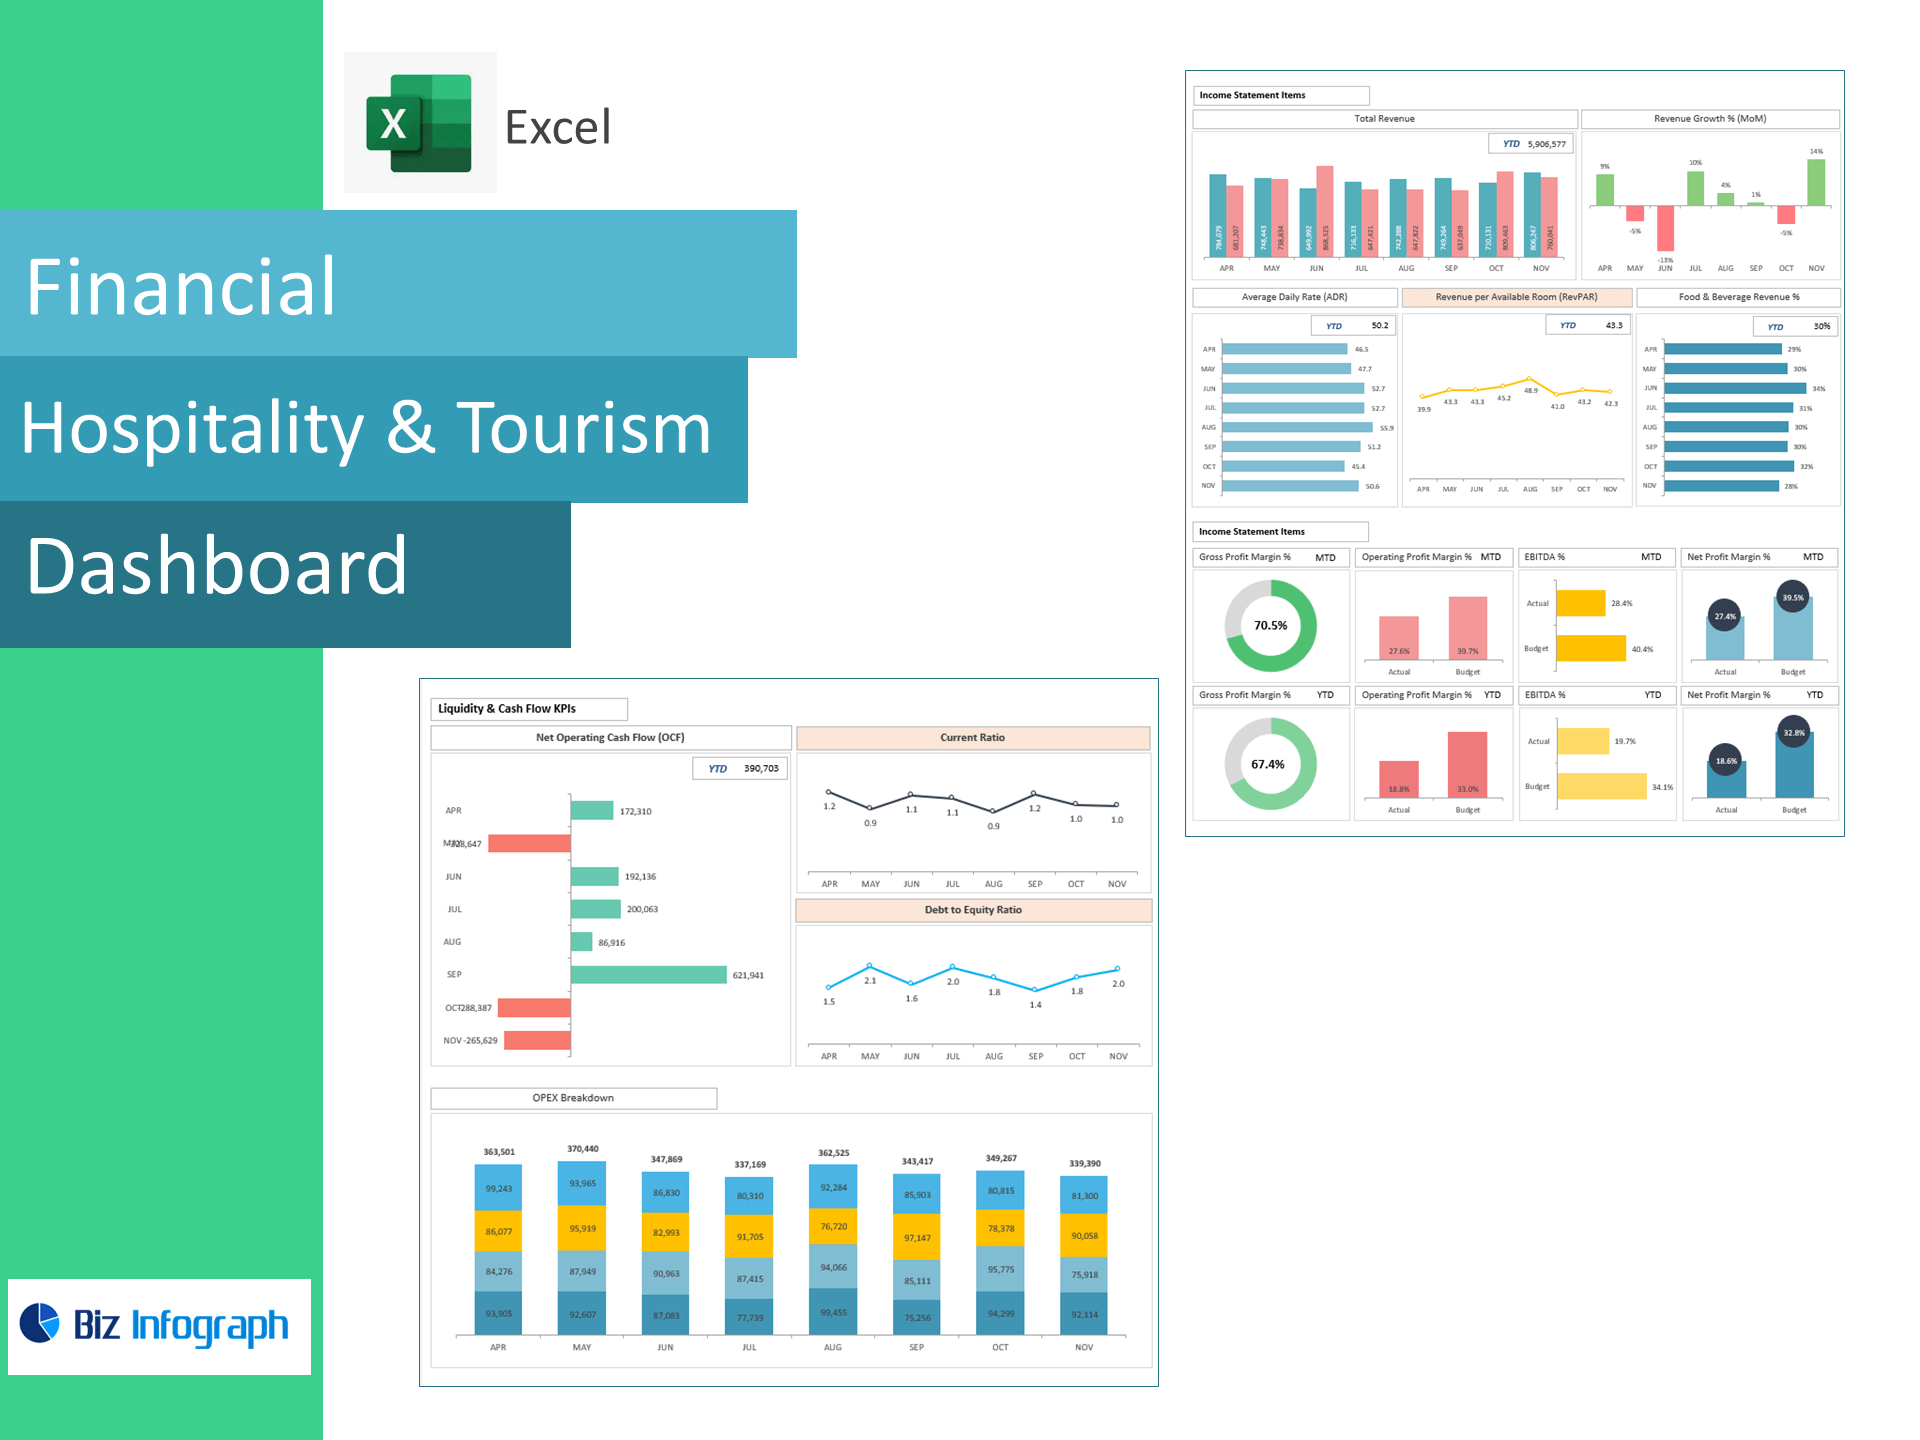
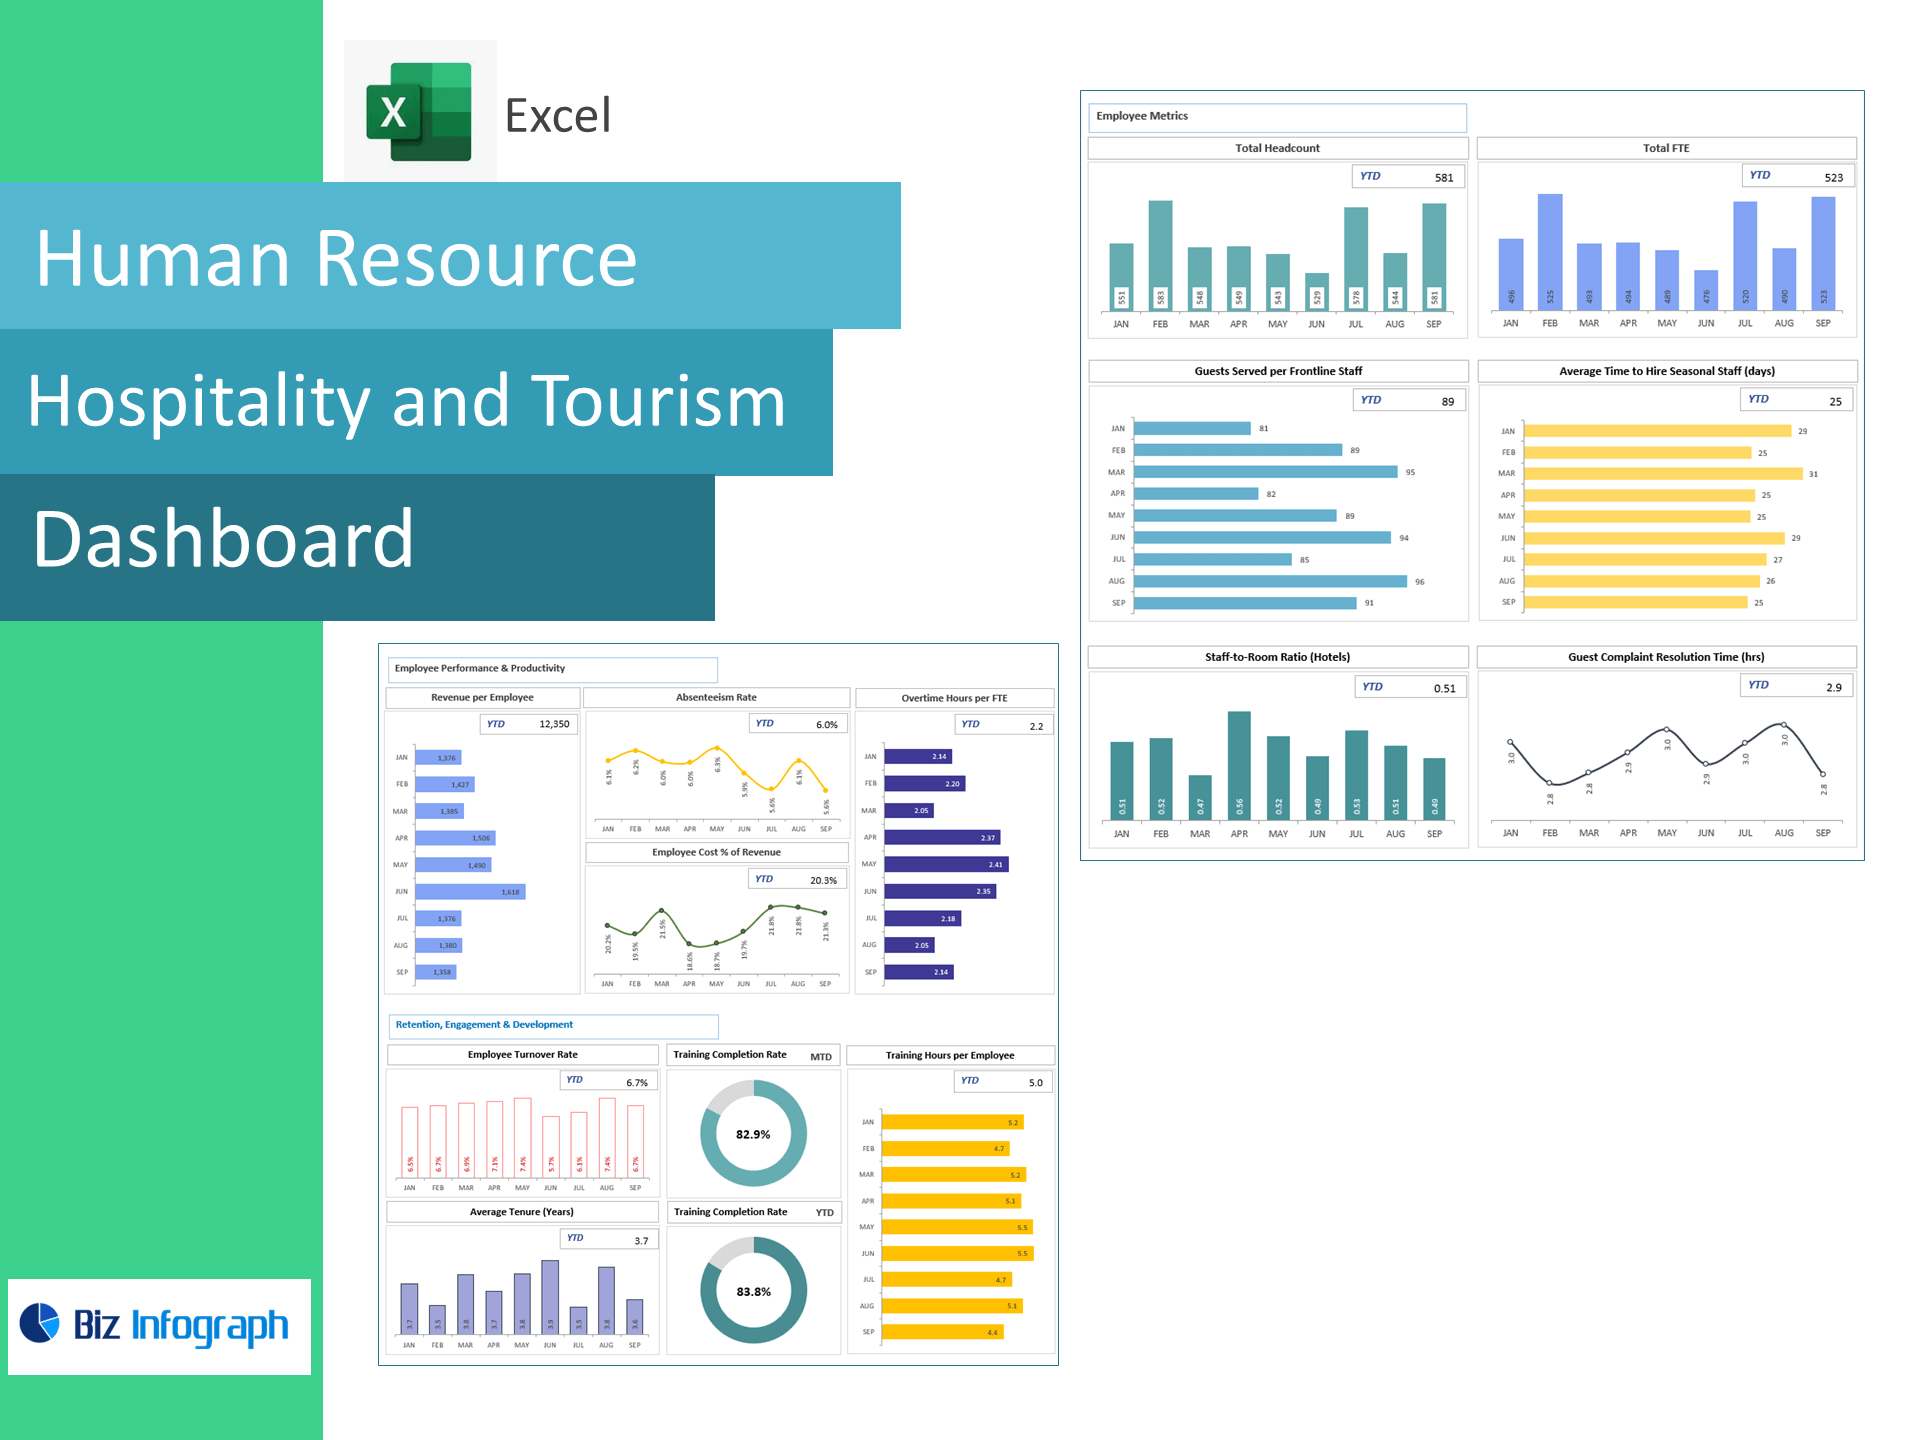
Staff smarter, resolve guest issues faster, and cut labor waste—directly in Excel. Purpose-built for hotels, resorts, and attractions, this template turns HRIS, PMS and service logs into a live dashboard tracking Guests per Frontline Staff, Time to Hire Seasonal Staff, Staff-to-Room Ratio, Guest Complaint Resolution Time, Revenue per Employee, Absenteeism, Overtime Hours per FTE, Employee Cost % of Revenue, Turnover, Average Tenure, Training Completion Rate, and Training Hours per Employee—so you can align workforce capacity with guest demand.
Why operators choose this template
-
Workforce + service in one view: See how staffing levels impact complaint resolution and guest experience.
-
Seasonality ready: Monitor time-to-hire and ramp seasonal teams before peak periods.
-
Cost control: Track OT/FTE, absences, and employee cost % of revenue to protect margins.
-
Excel-native: Paste your CSVs and go—no add-ins or BI setup required.
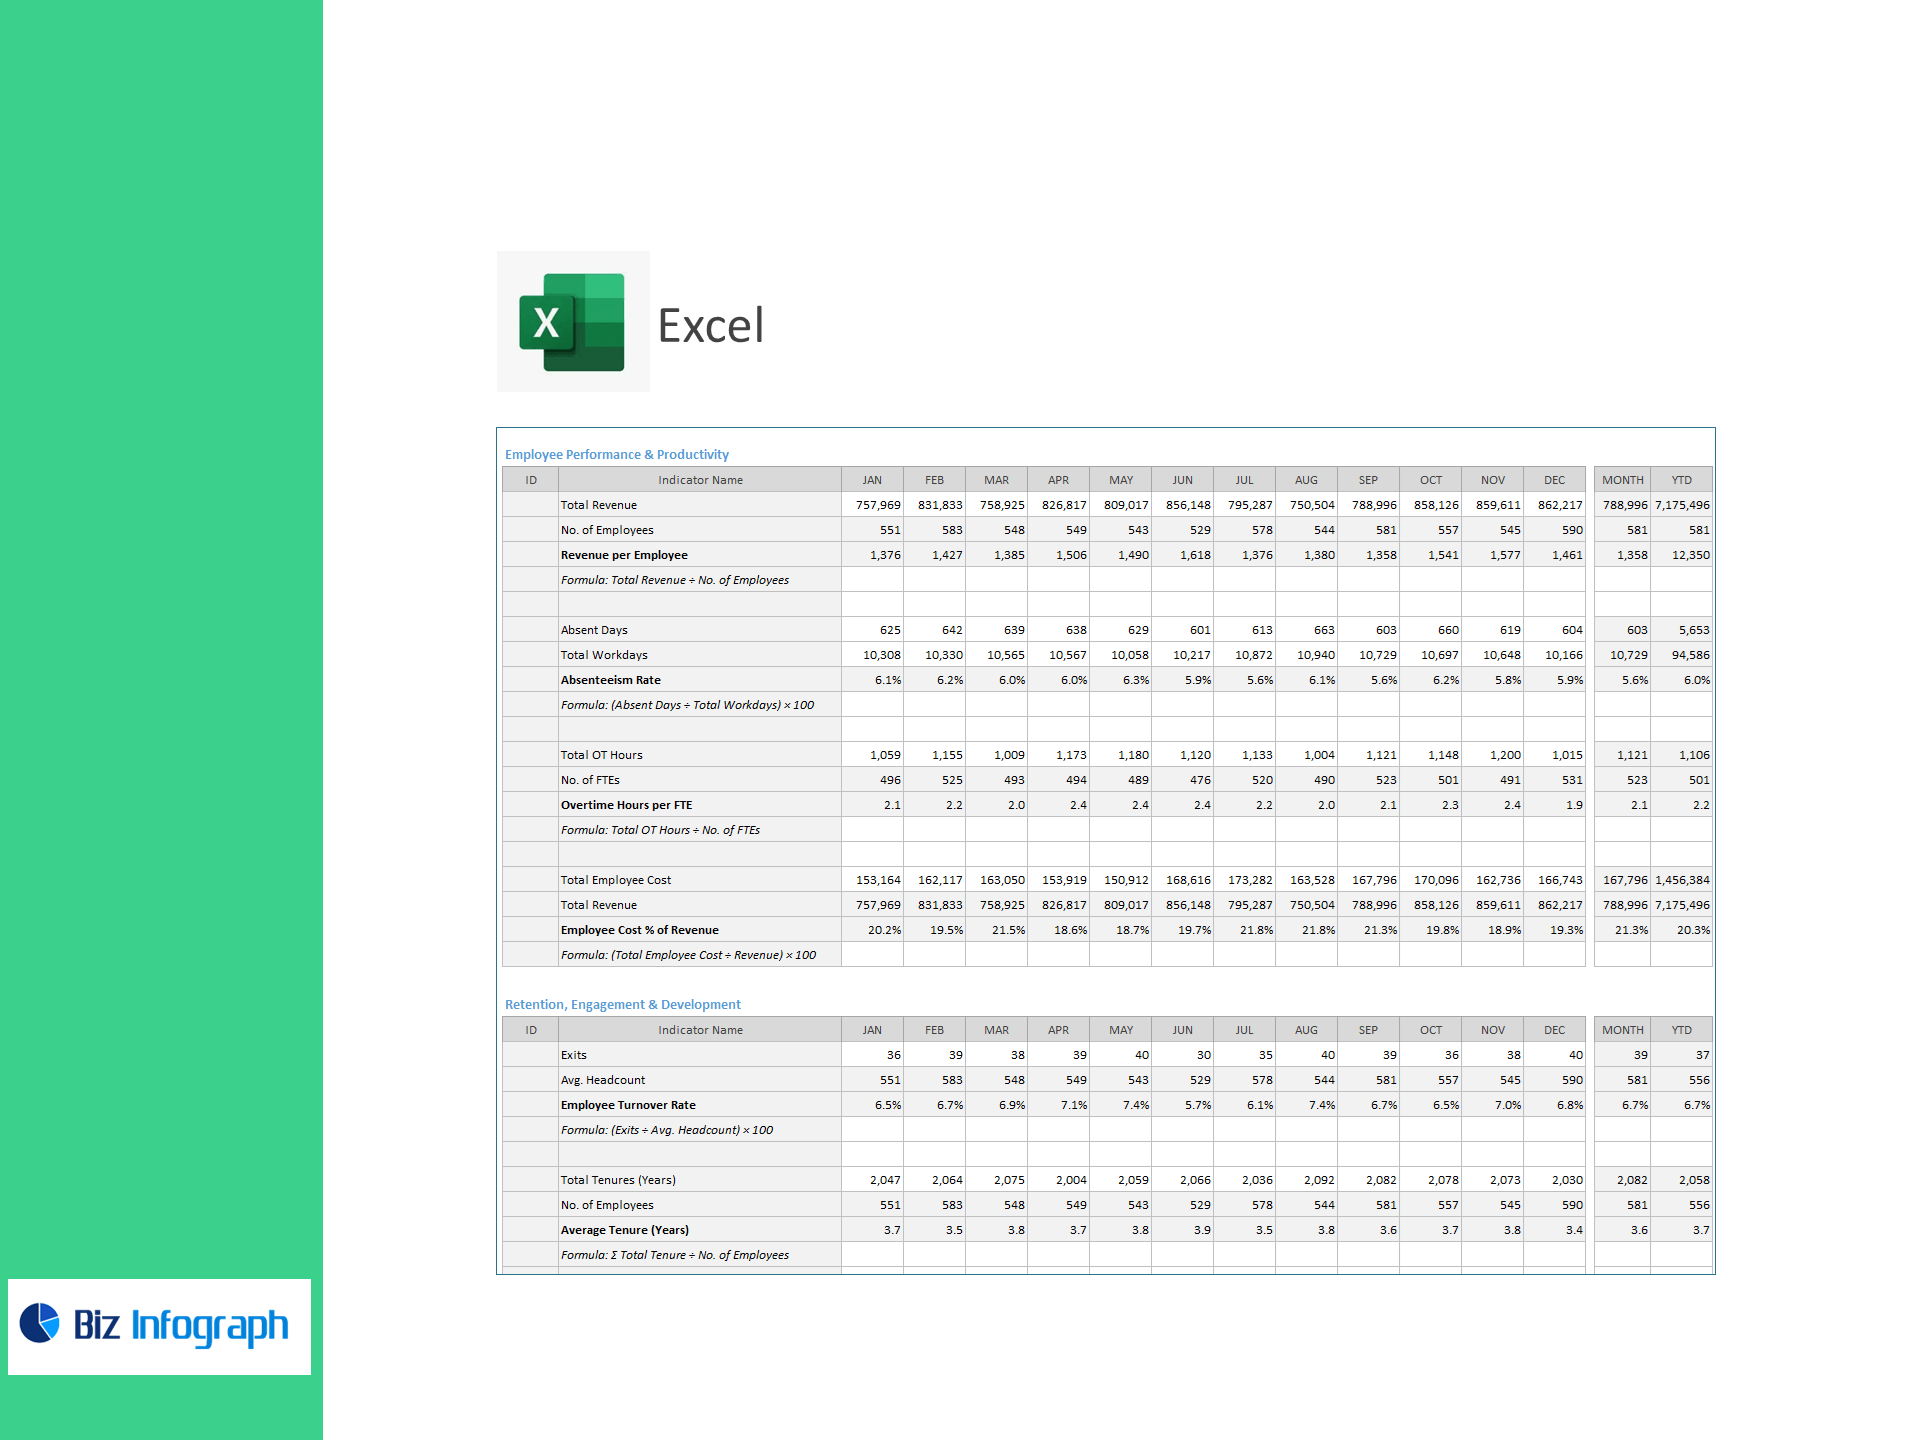
KPIs included (ready-made formulas)
-
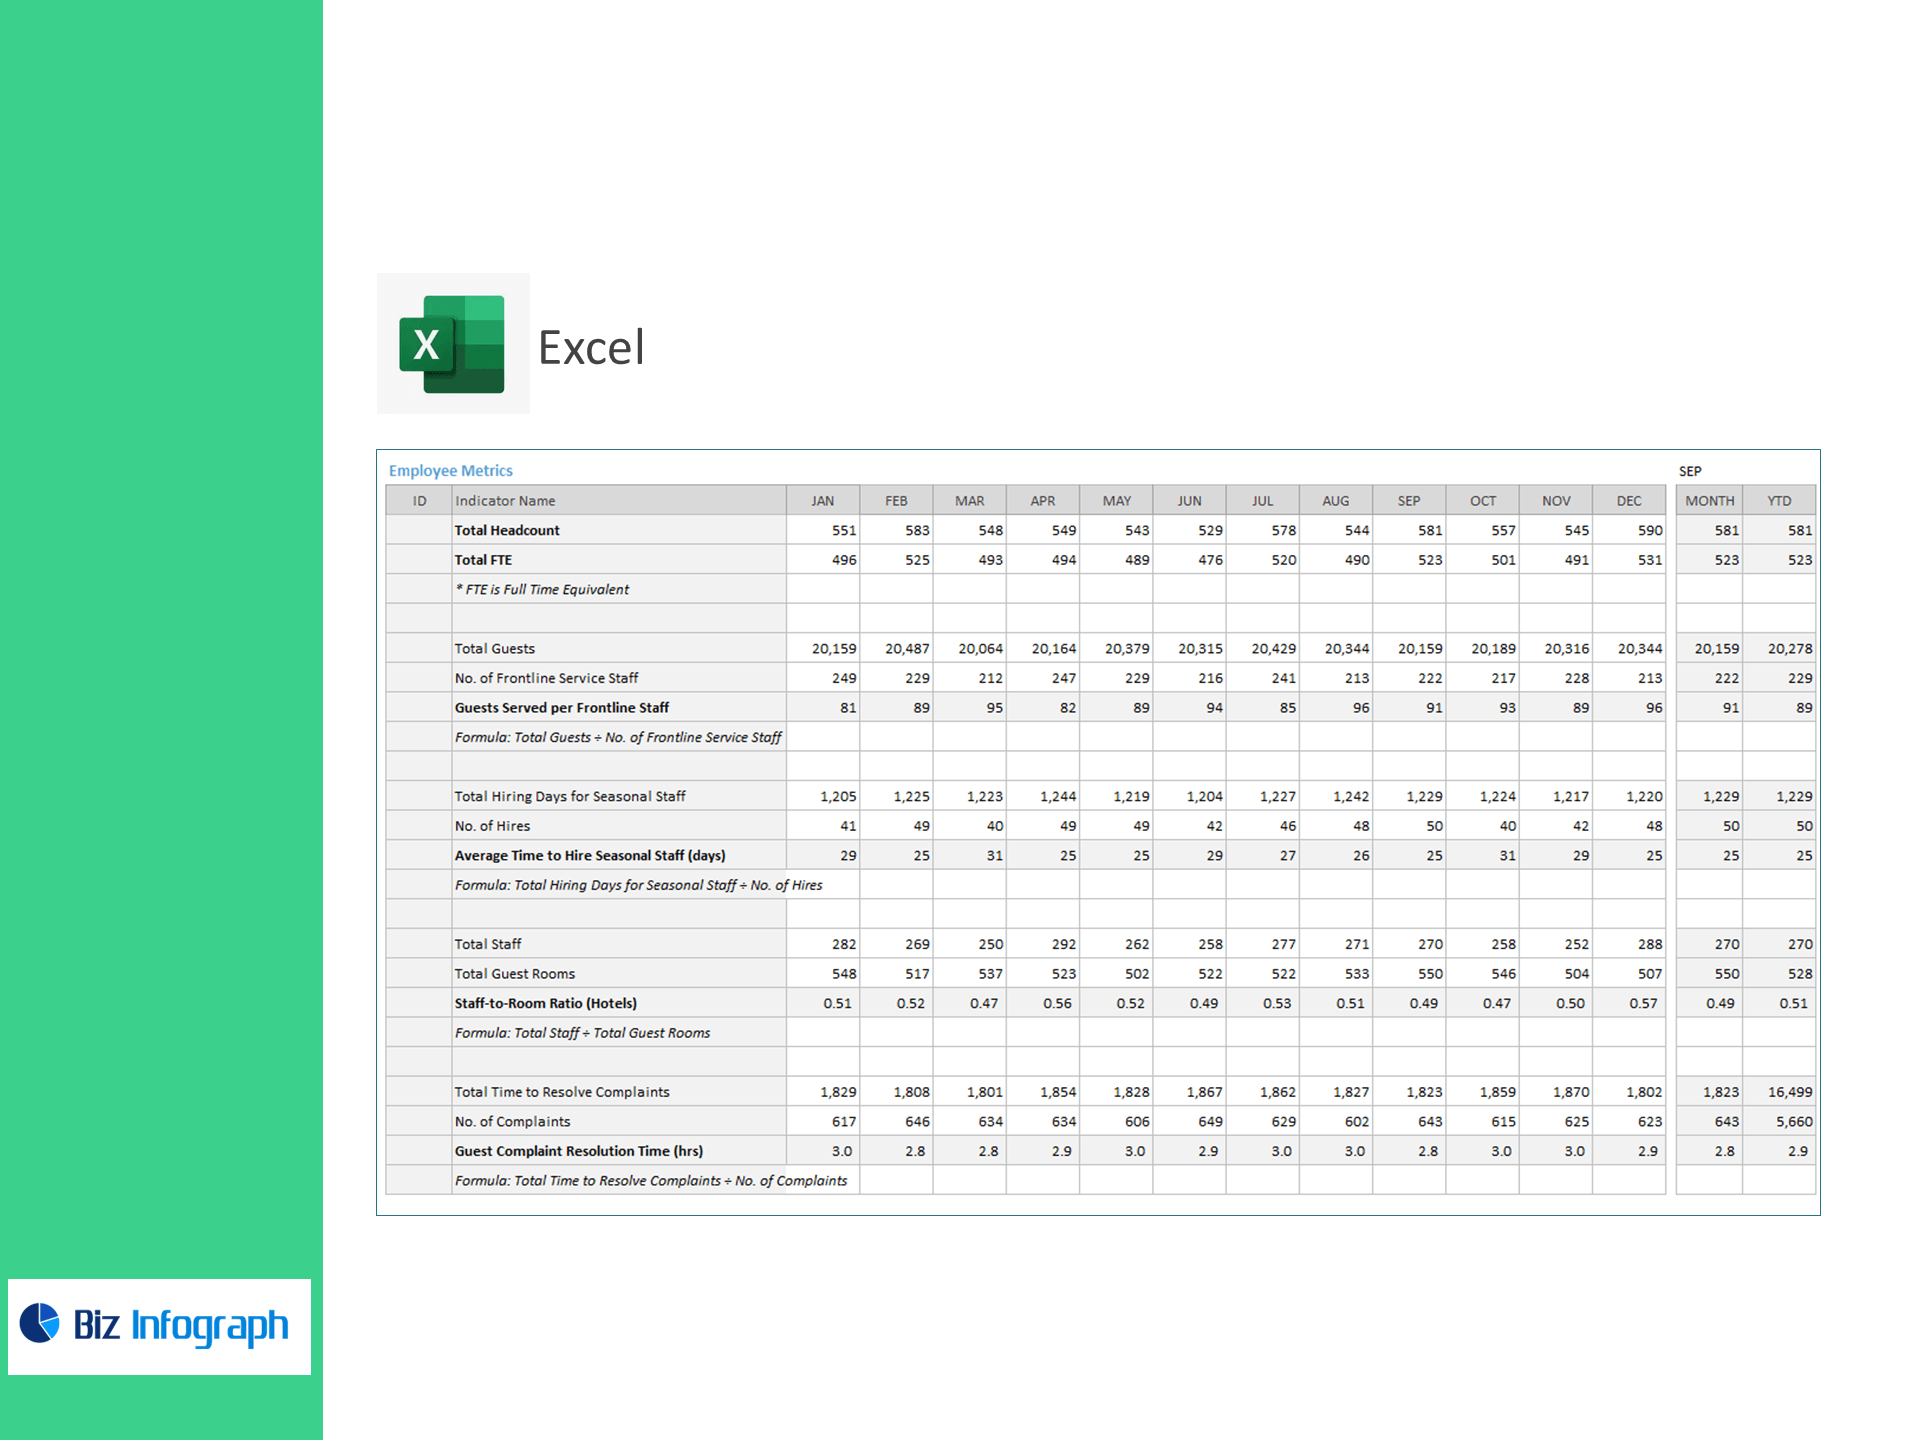
Guests per Frontline Staff = Total Guests ÷ Frontline Staff
-
Avg. Time to Hire Seasonal Staff (days) = Total Hiring Days ÷ # Hires
-
Staff-to-Room Ratio = Total Staff ÷ Guest Rooms
-
Guest Complaint Resolution Time (hrs) = Total Time to Resolve ÷ # Complaints
-
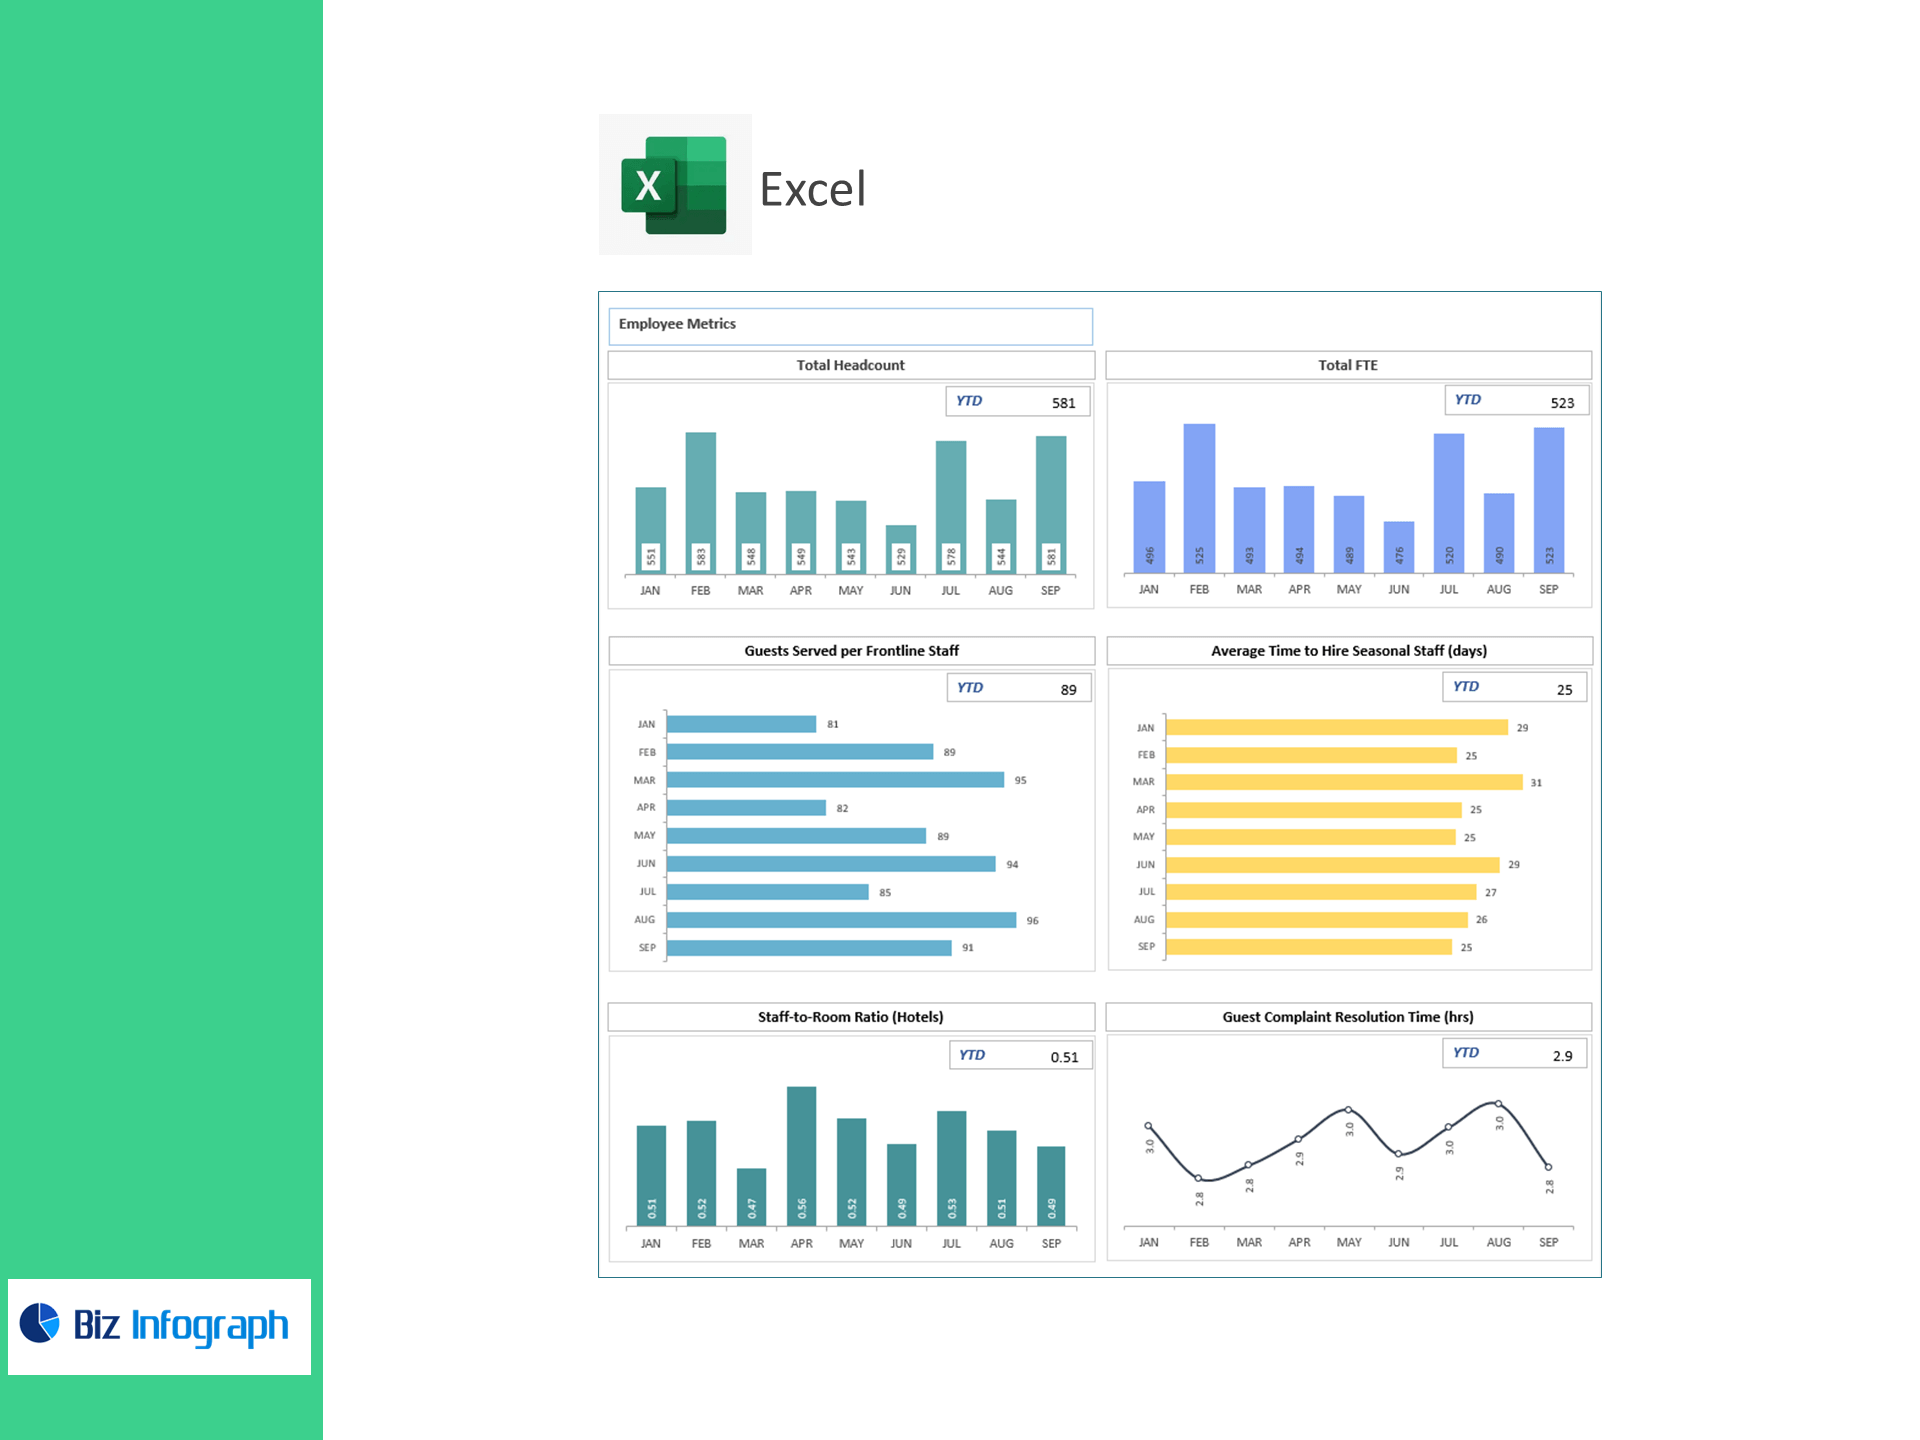
Revenue per Employee = Total Revenue ÷ Employees
-
Absenteeism Rate (%) = Absent Days ÷ Workdays × 100
-
Overtime Hours per FTE = Total OT Hours ÷ FTEs
-
Employee Cost % of Revenue = Total Employee Cost ÷ Revenue × 100
-
Employee Turnover Rate (%) = Exits ÷ Avg. Headcount × 100
-
Average Tenure (years) = Σ Tenure ÷ Employees
-
Training Completion Rate (%) = Completed ÷ Assigned Trainings × 100
-
Training Hours per Employee = Total Training Hours ÷ Employees
What’s inside
-
Executive Dashboard: Tiles & trends for staffing density, hiring speed, resolution time, productivity, cost %, turnover, tenure, and training— with variance to target.
-
Service Desk Panel: Complaint volumes and SLA performance by property/department.
-
Workforce Health: OT and absence hotspots, shift/site comparisons, and seasonality view.
-
Targets Sheet: Enter KPI targets; automatic Above/Below Target flags.
-
Clean Data Tables: Import-ready sheets for headcount/FTE, hiring, rooms, complaints, hours/OT, payroll cost, and training logs.
Benefits
-
Improve guest experience: Cut resolution time and ensure adequate frontline coverage.
-
Lower labor waste: Reduce OT/FTE and absenteeism; right-size staffing by room count.
-
Retain talent: Track turnover, tenure, and training to build resilient teams.
-
Decide faster: Board-ready visuals with transparent, audit-friendly formulas.
For ready-to-use Dashboard Templates: