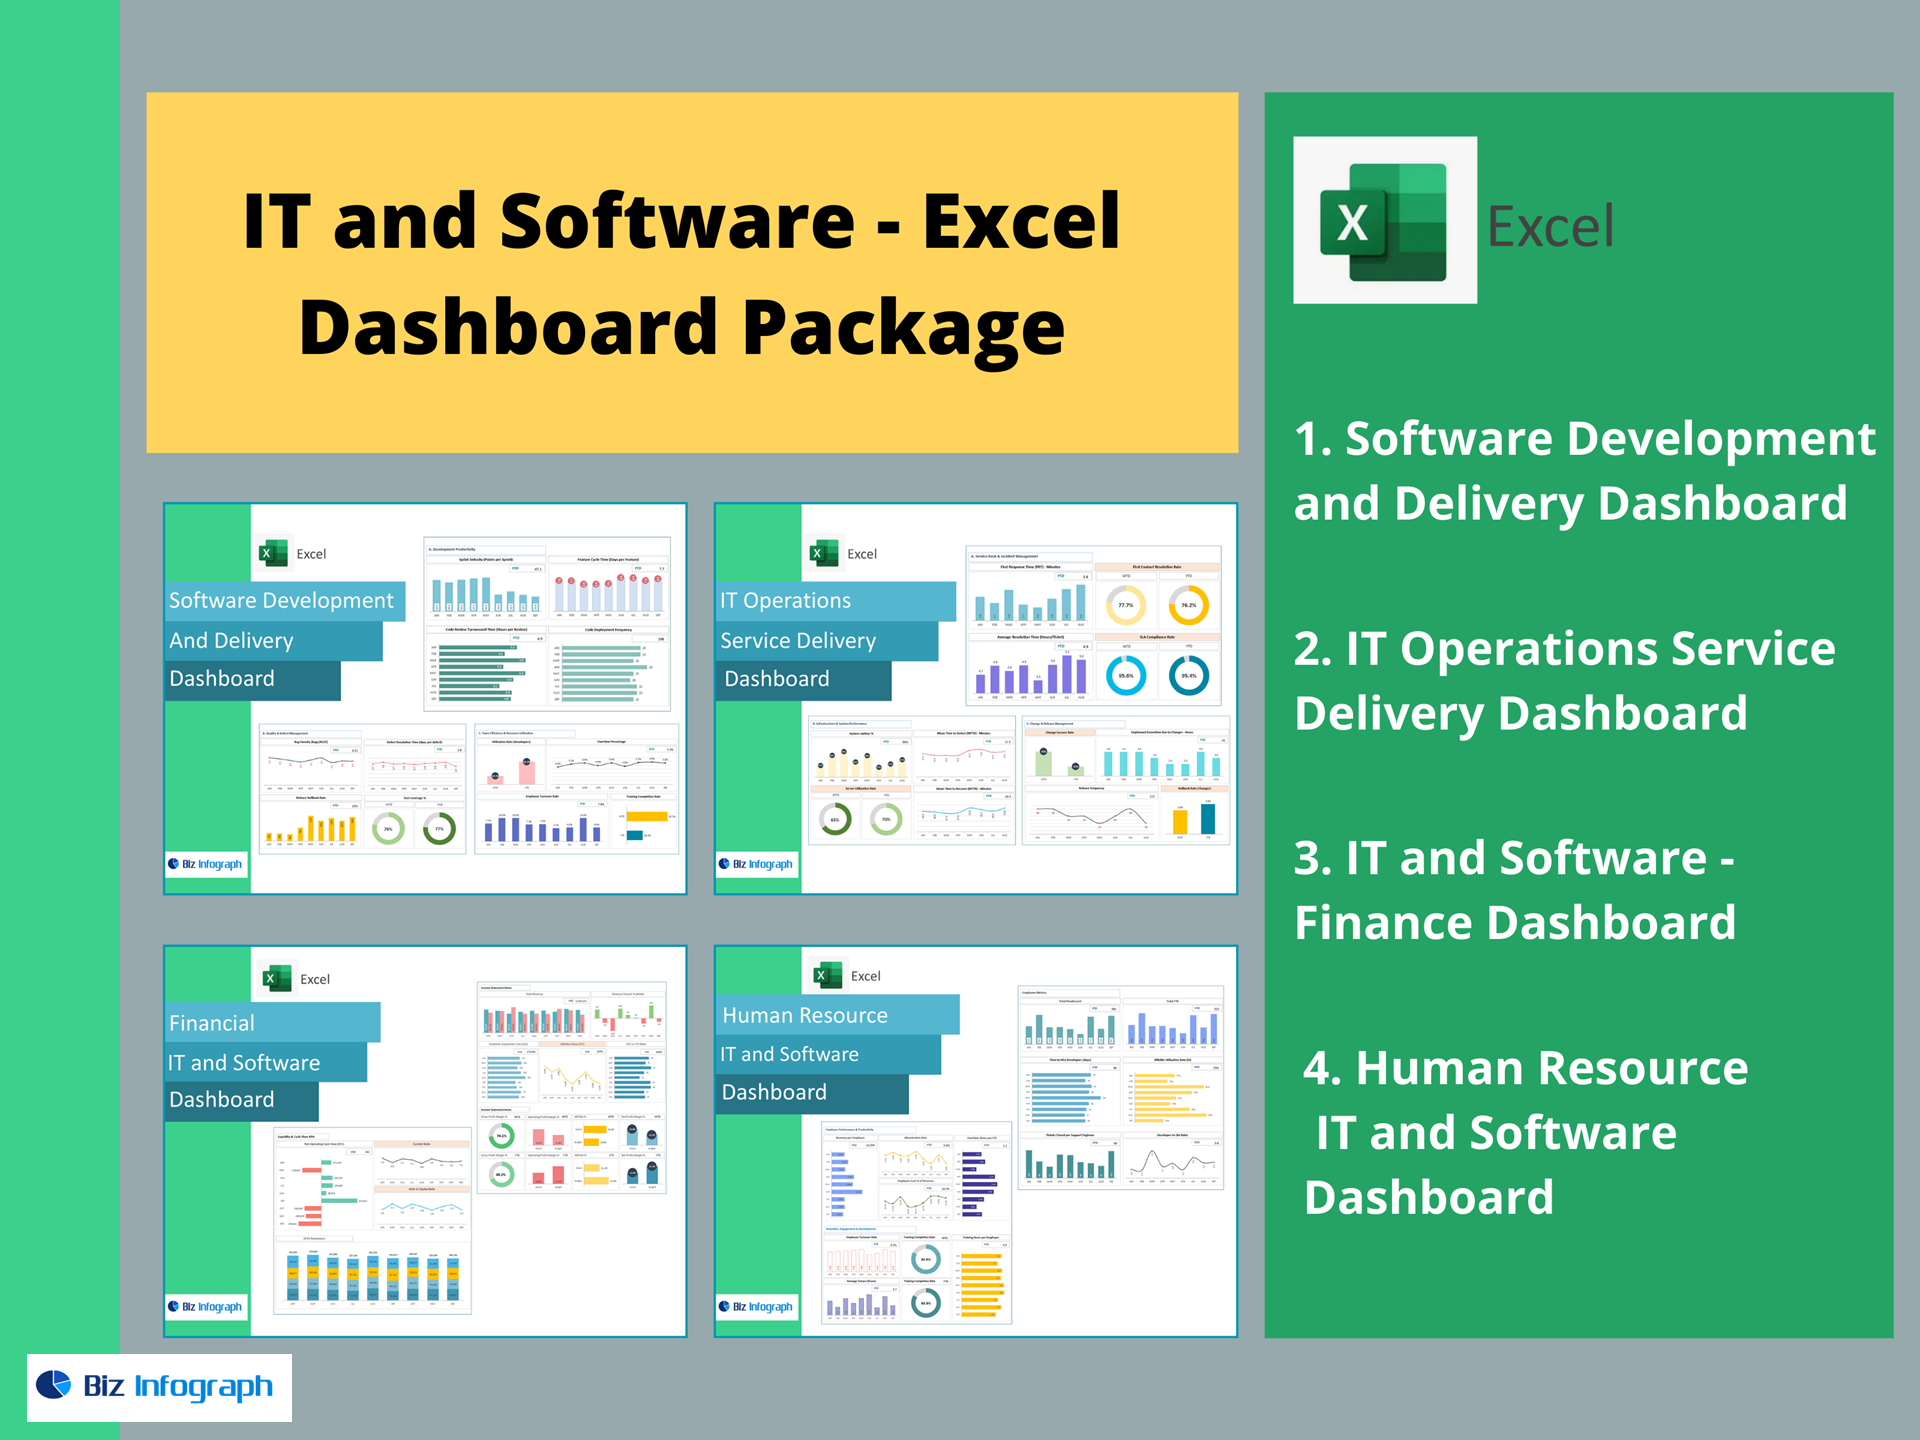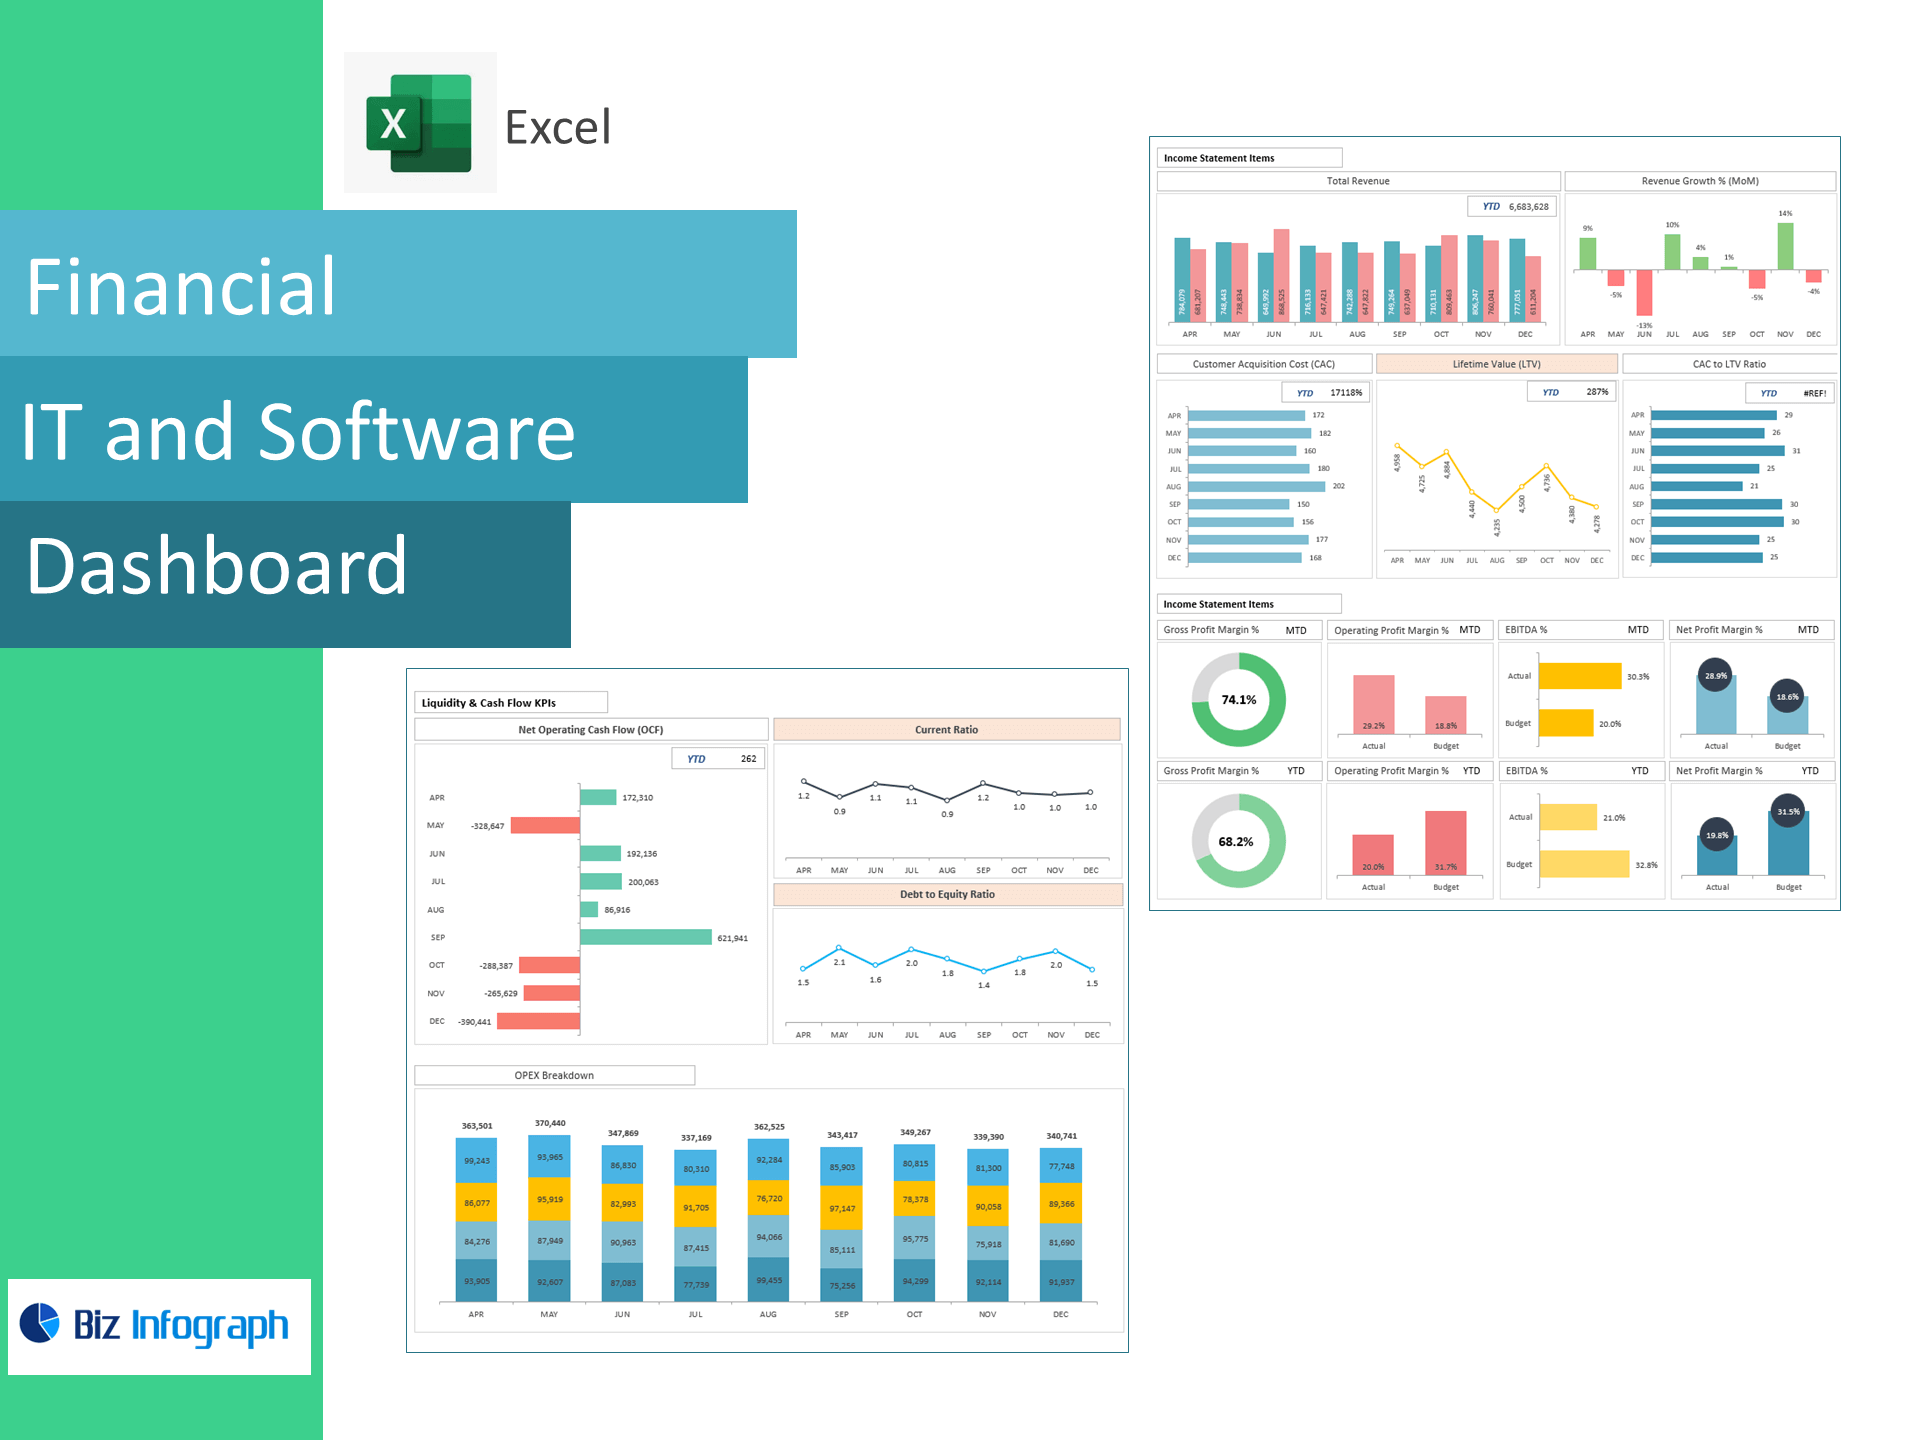
IT & Software Financial Dashboard — Excel Template
Track SaaS revenue, margins, cash flow, and unit economics in one clean Excel dashboard. This ready-to-use template converts your finance exports into live visuals for Total Revenue, MoM Growth, COGS, Gross Profit, OPEX & OPEX Breakdown, EBITDA, EBIT, Net Profit, Gross/Operating/EBITDA/Net Margins, Operating Cash Flow, Current Ratio, Debt-to-Equity, plus core SaaS metrics: CAC, ARPU, LTV, and CAC:LTV Ratio.
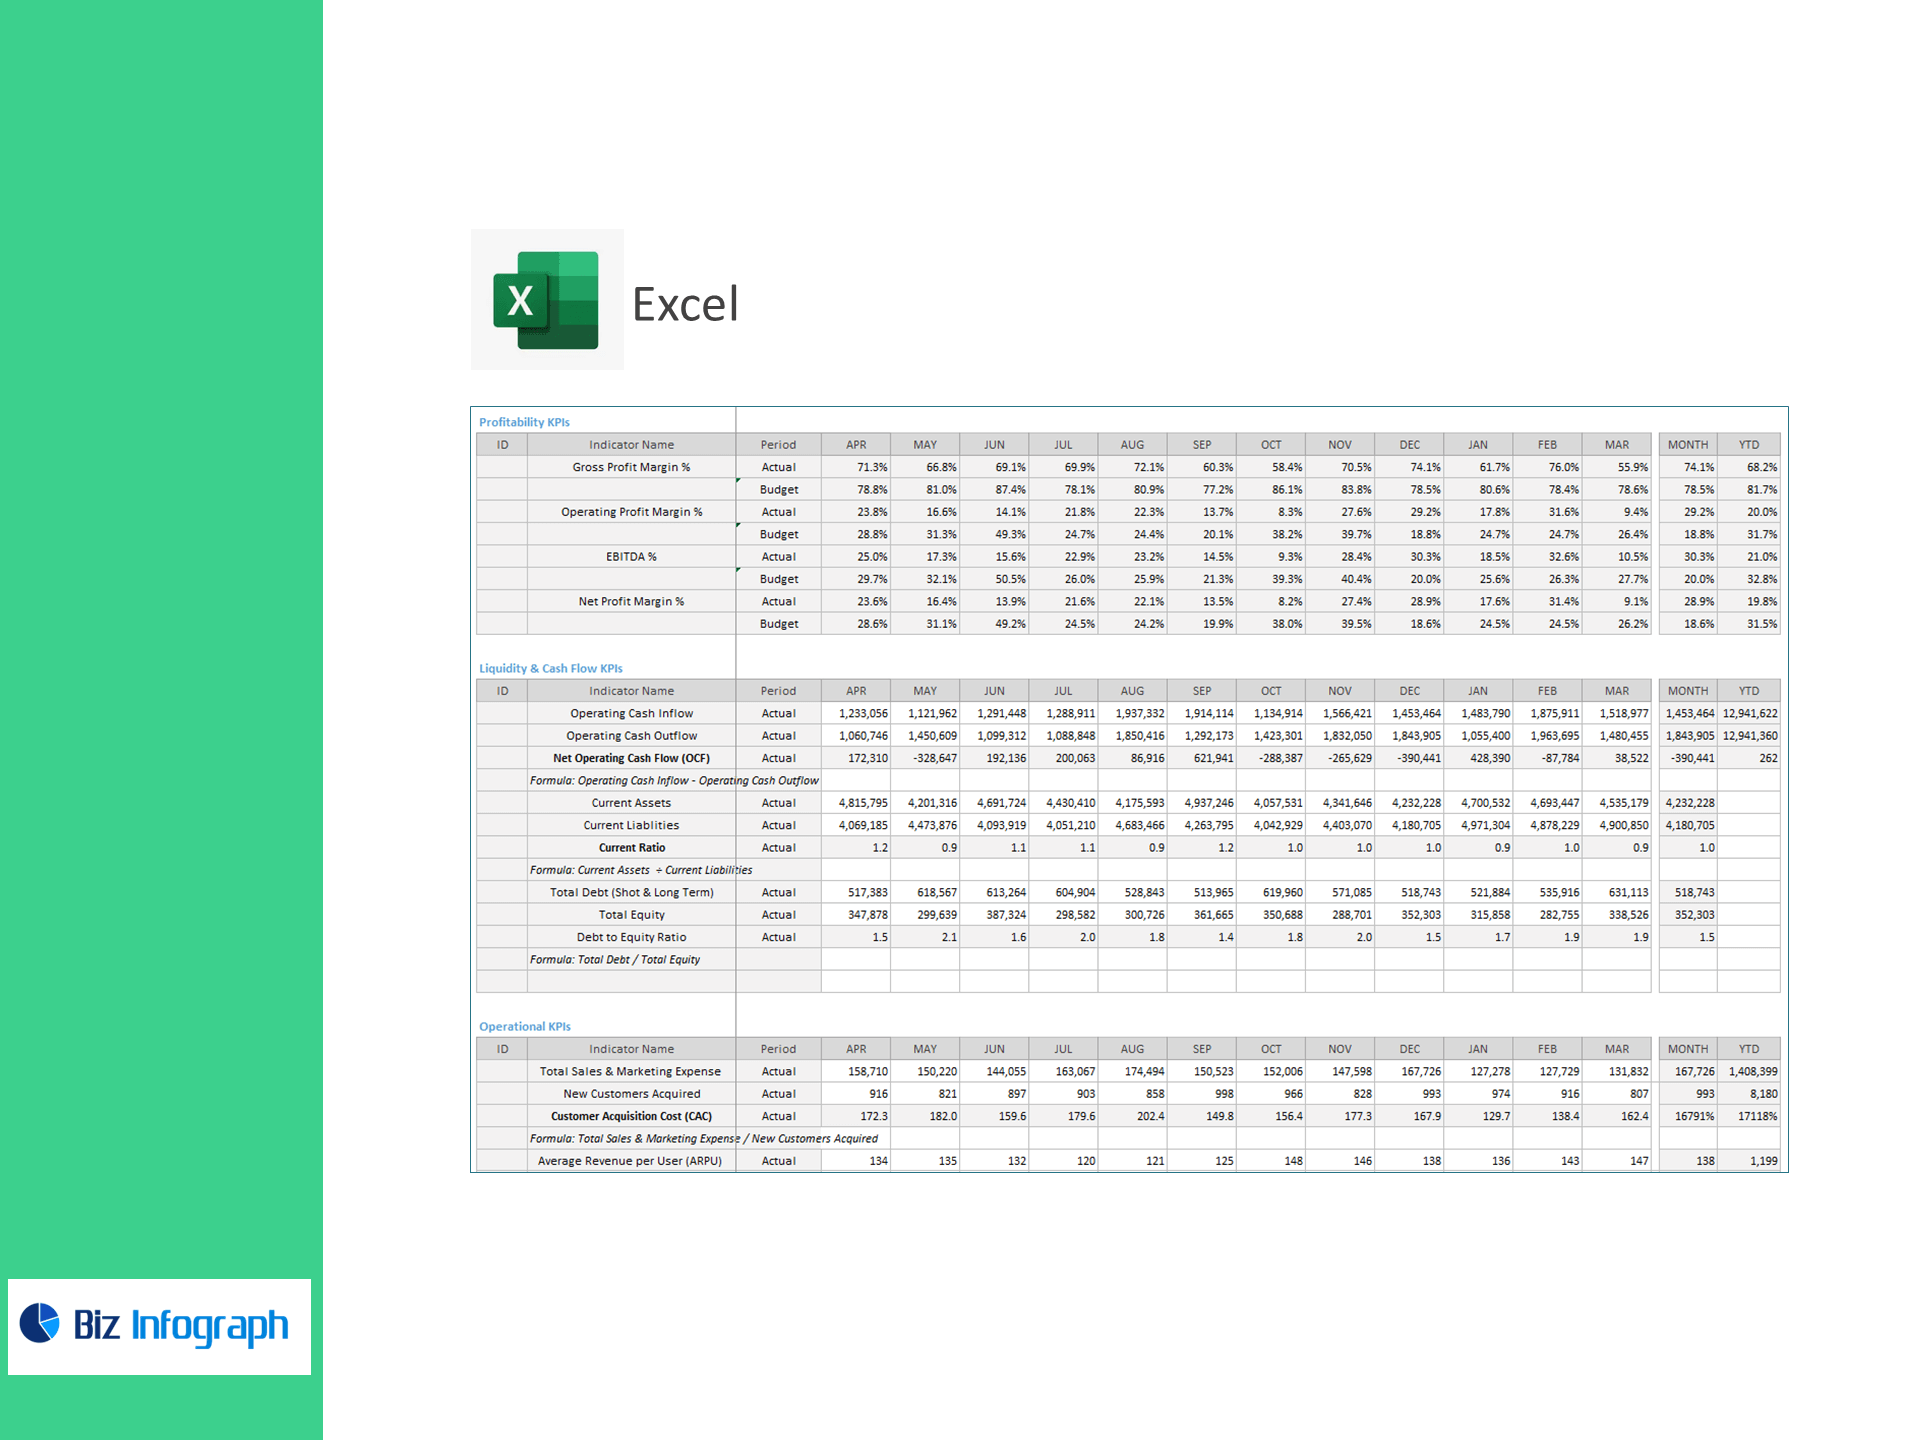
What you’ll monitor (prebuilt KPIs & formulas)
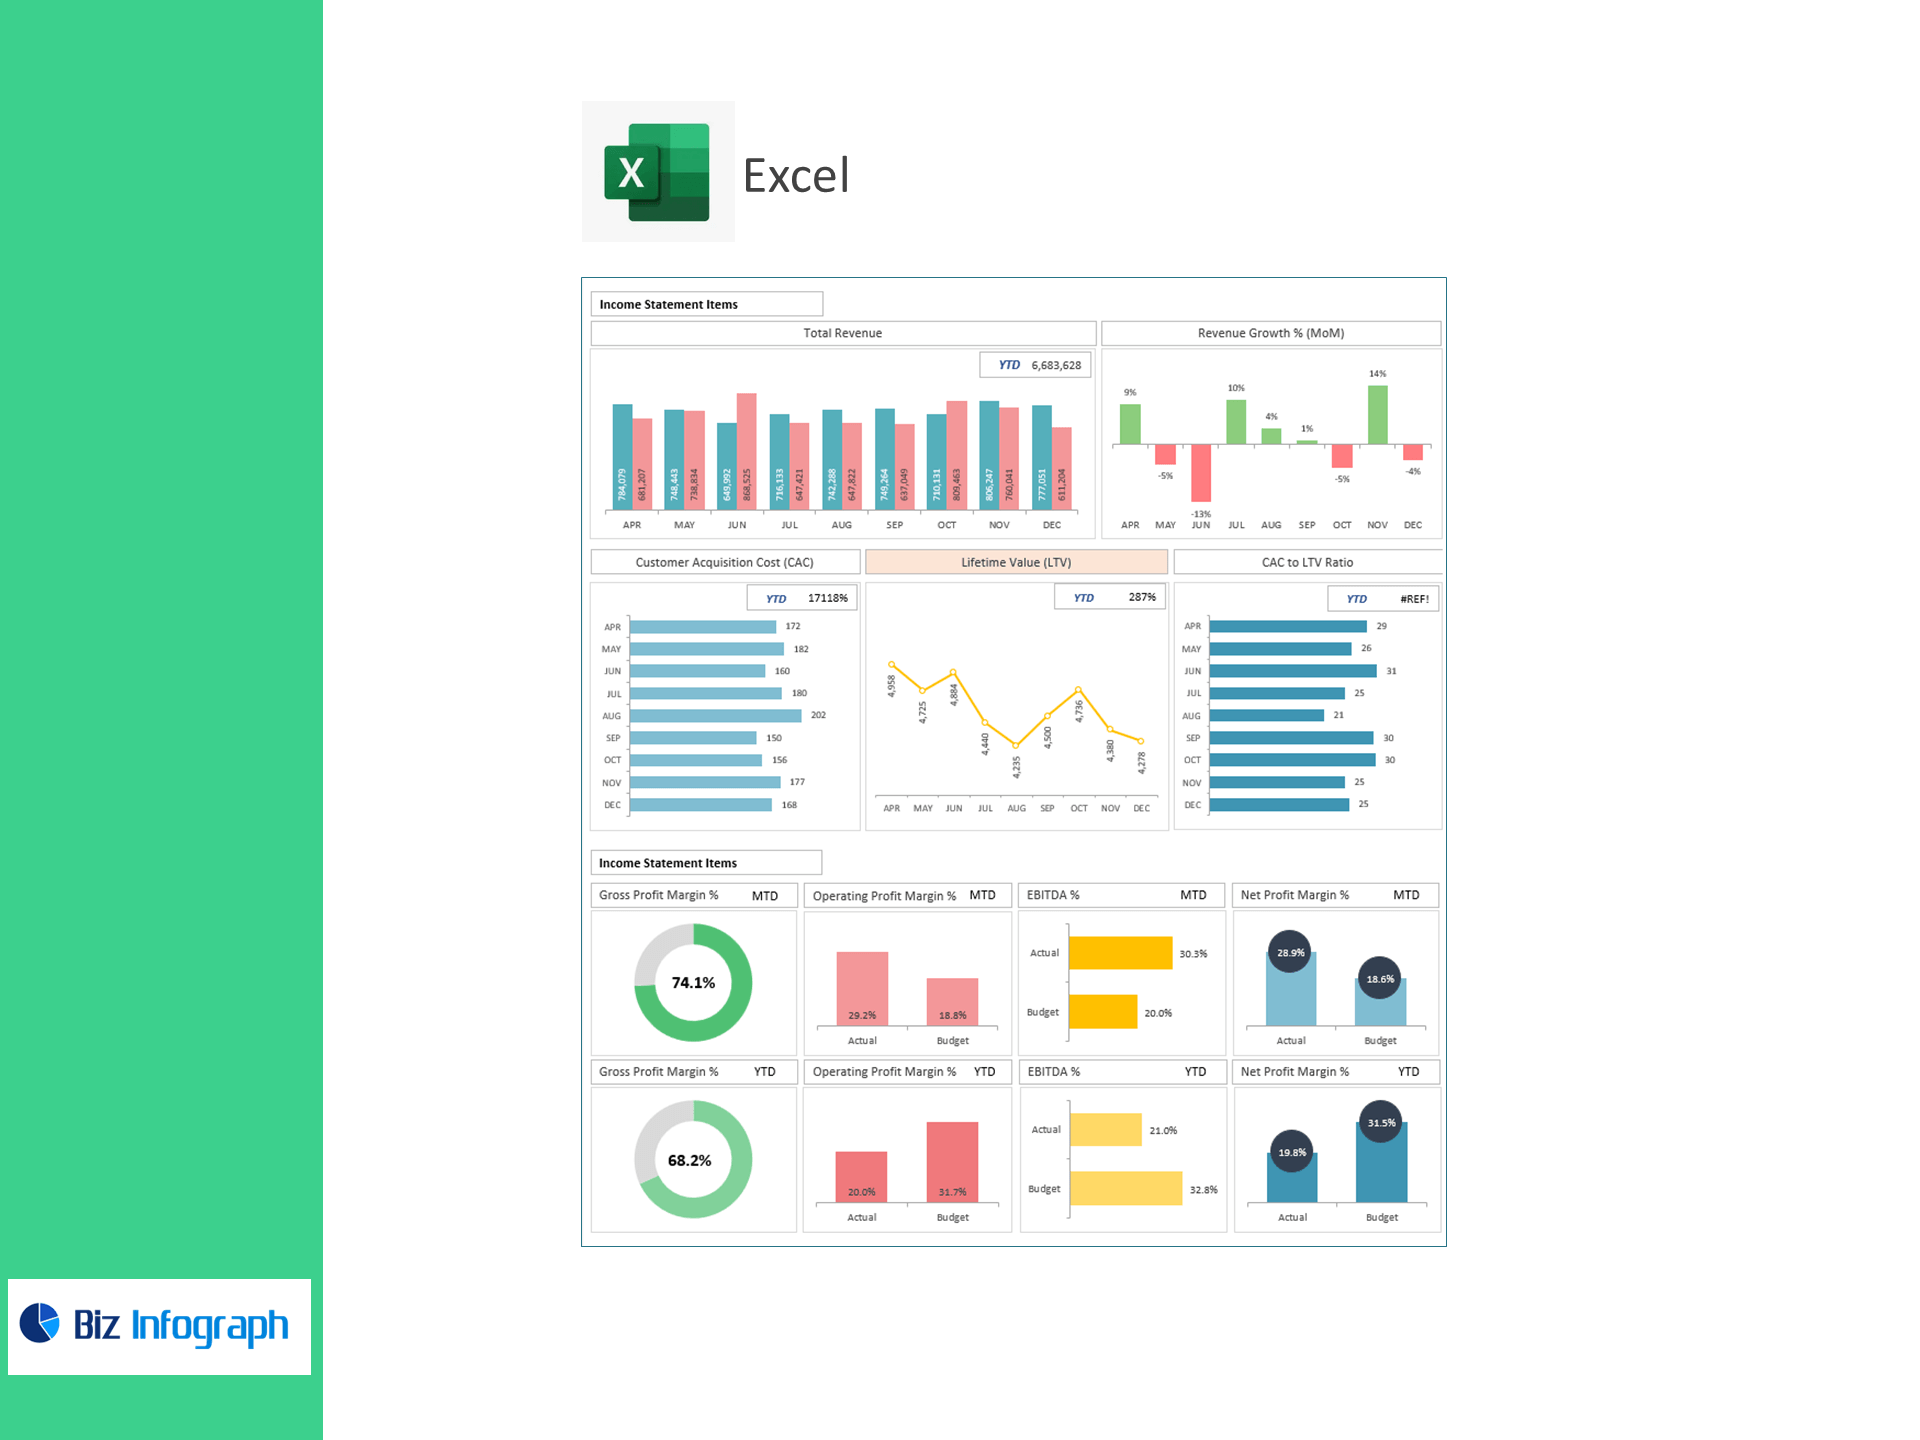
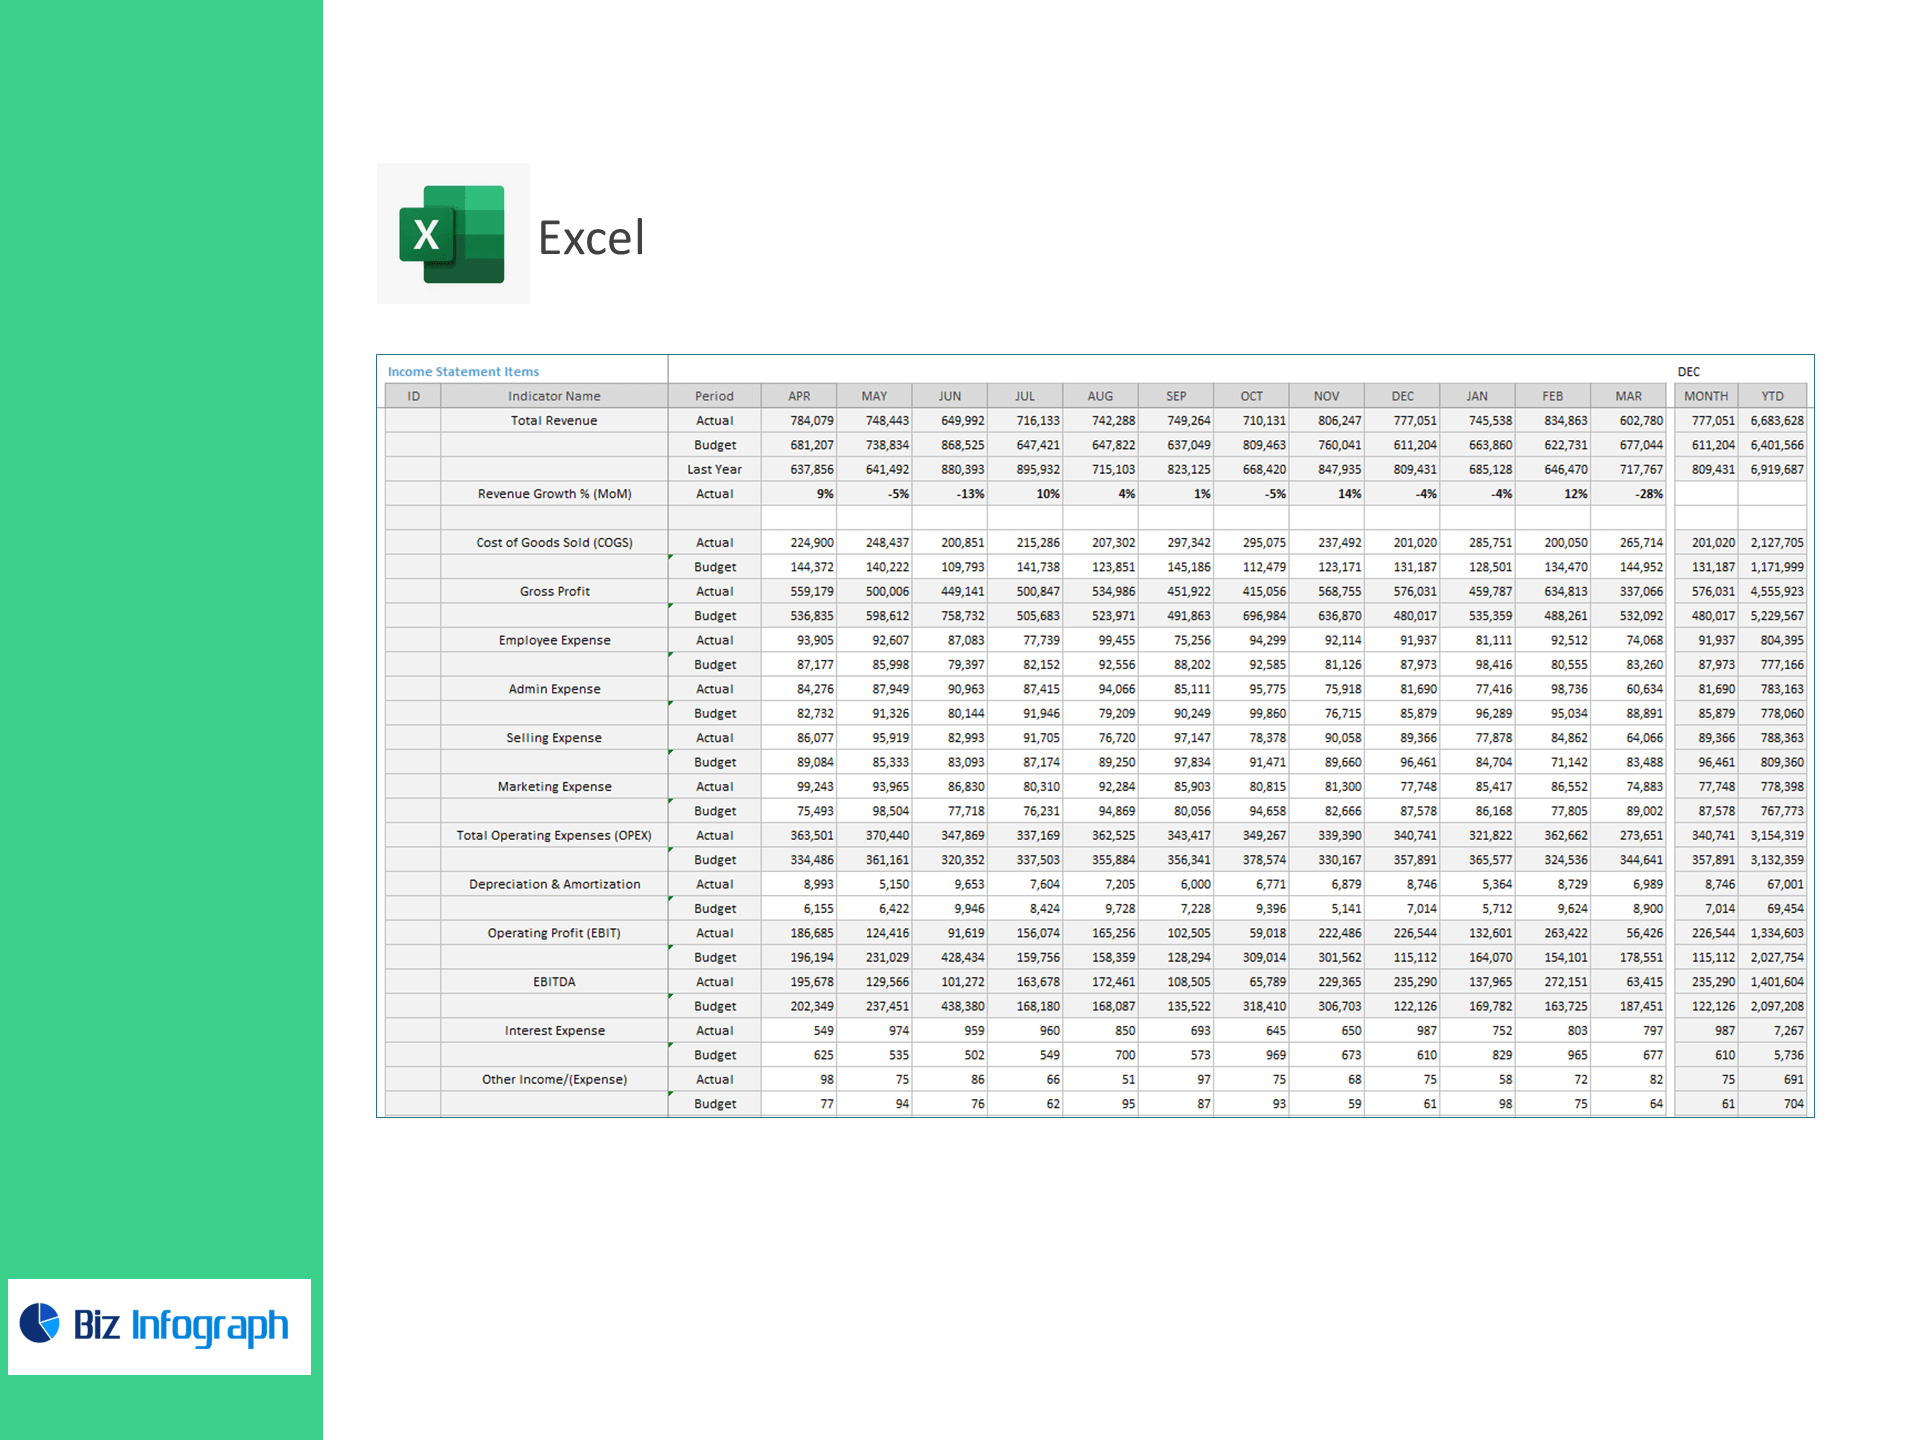
Income Statement & Profitability
-
Total Revenue, Revenue Growth % (MoM)
-
COGS, Gross Profit
-
Employee, Admin, Selling, Marketing Expense
-
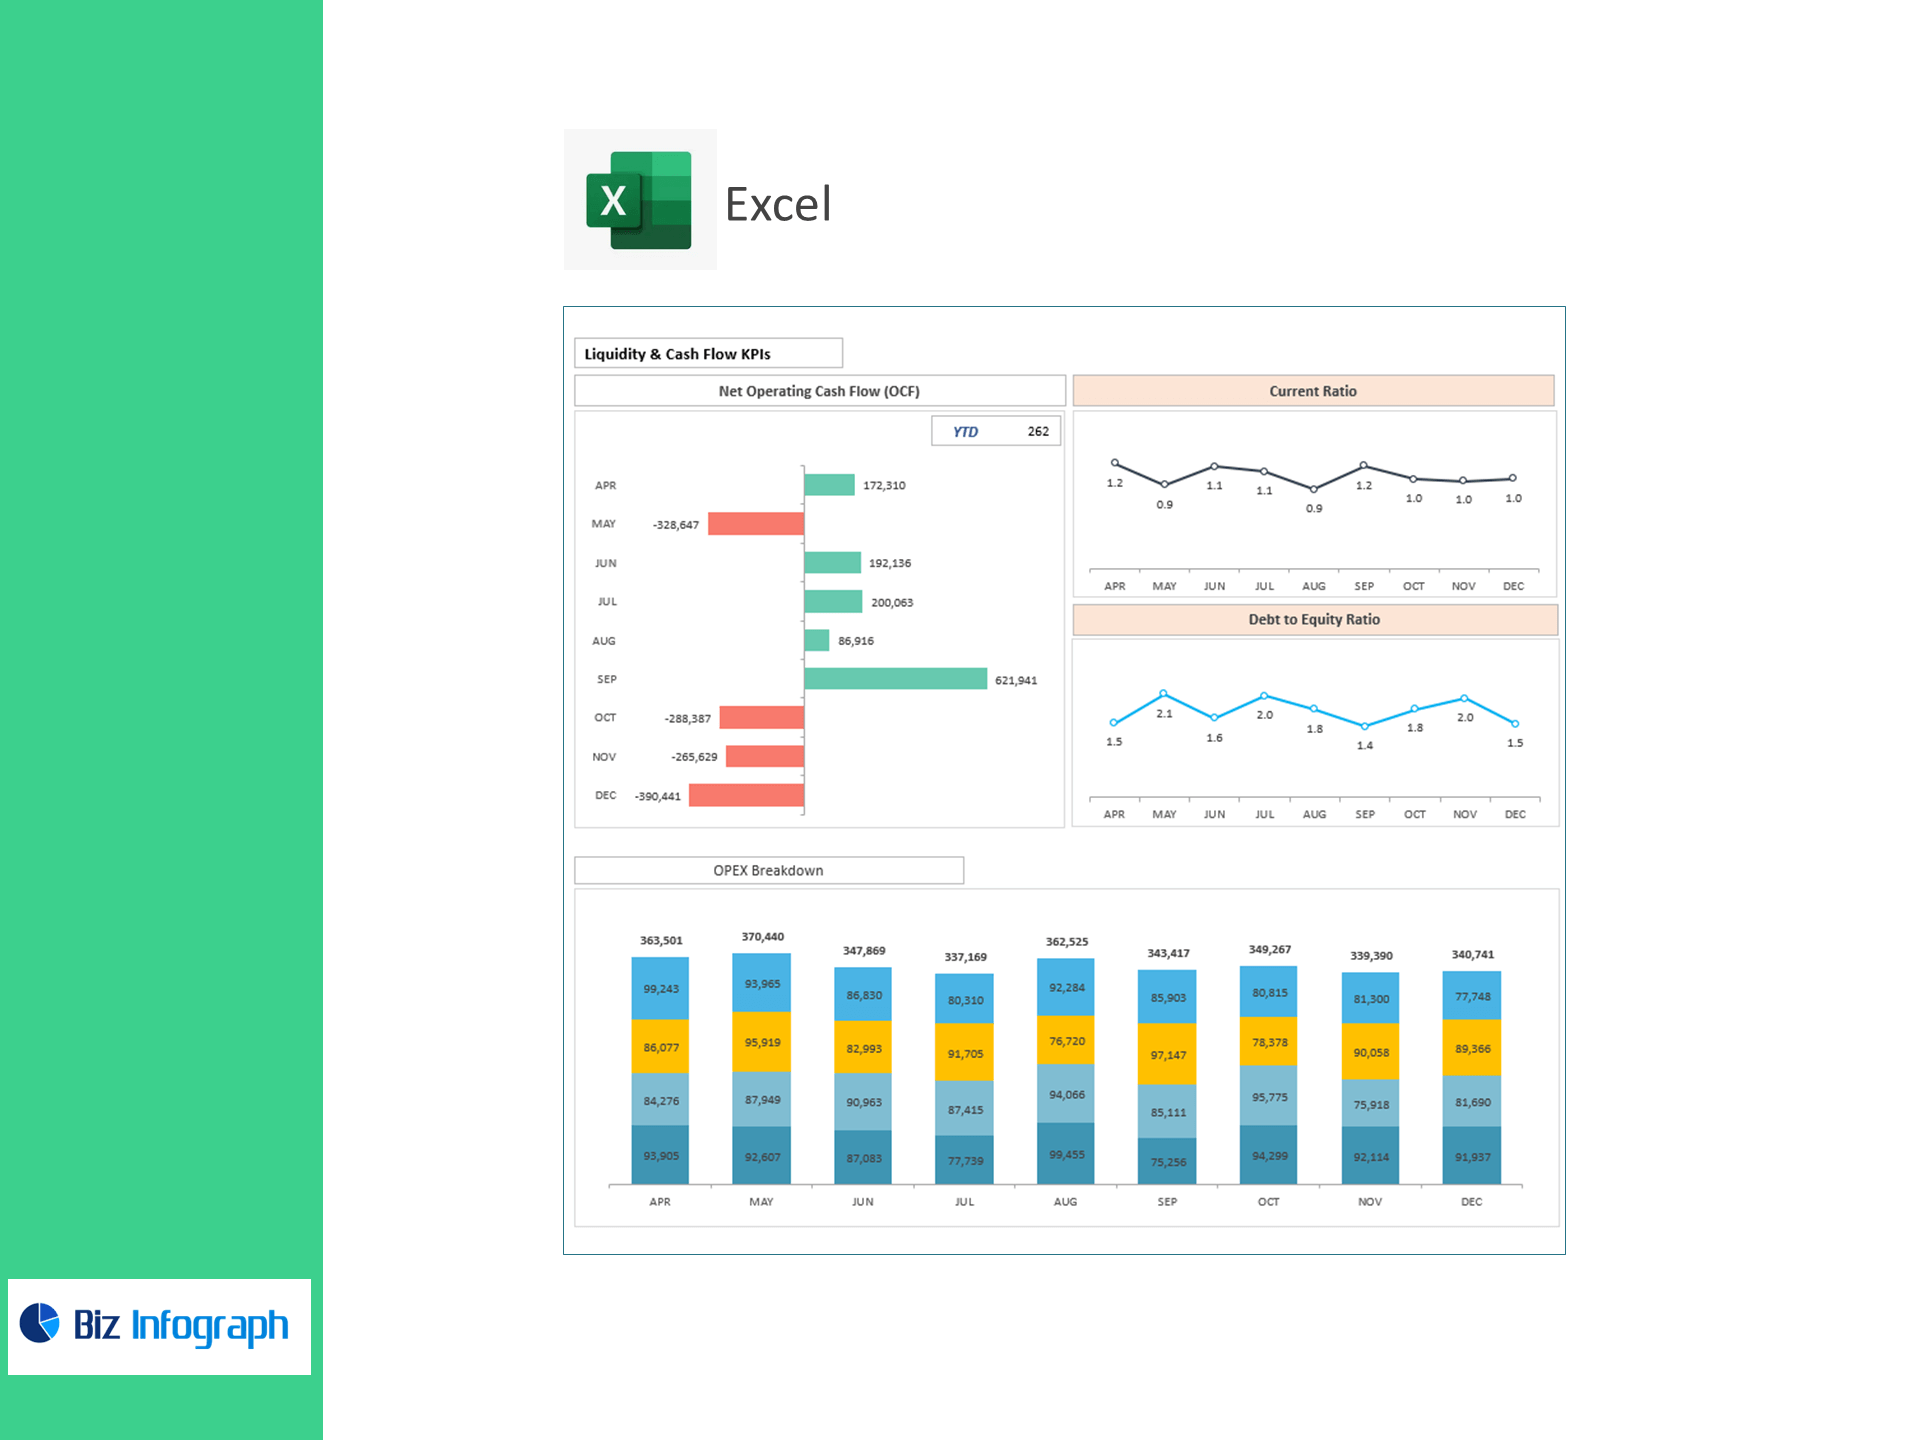
Total OPEX & OPEX Breakdown
-
Depreciation & Amortization, EBIT, EBITDA, Net Profit
-
Gross/Operating/EBITDA/Net Profit Margin %
Liquidity & Capital Structure
-
Operating Cash Inflow/Outflow → Net OCF
-
Current Ratio = Current Assets ÷ Current Liabilities
-
Debt to Equity = Total Debt ÷ Total Equity
SaaS Unit Economics
-
Customer Acquisition Cost (CAC) = Sales & Marketing Expense ÷ New Customers
-
ARPU (Average Revenue per User)
-
Average Customer Lifespan
-
Lifetime Value (LTV) = ARPU × Avg Lifespan
-
CAC:LTV Ratio = LTV ÷ CAC
Why finance & RevOps teams use it
-
Investor-ready view: Tie GAAP results to SaaS unit economics in one worksheet.
-
Margin & OPEX control: Instantly see which cost buckets compress EBITDA.
-
Cash clarity: Track Net Operating Cash Flow alongside profitability.
-
Excel-native: Paste CSVs—no macros, add-ins, or coding.
What’s inside
-
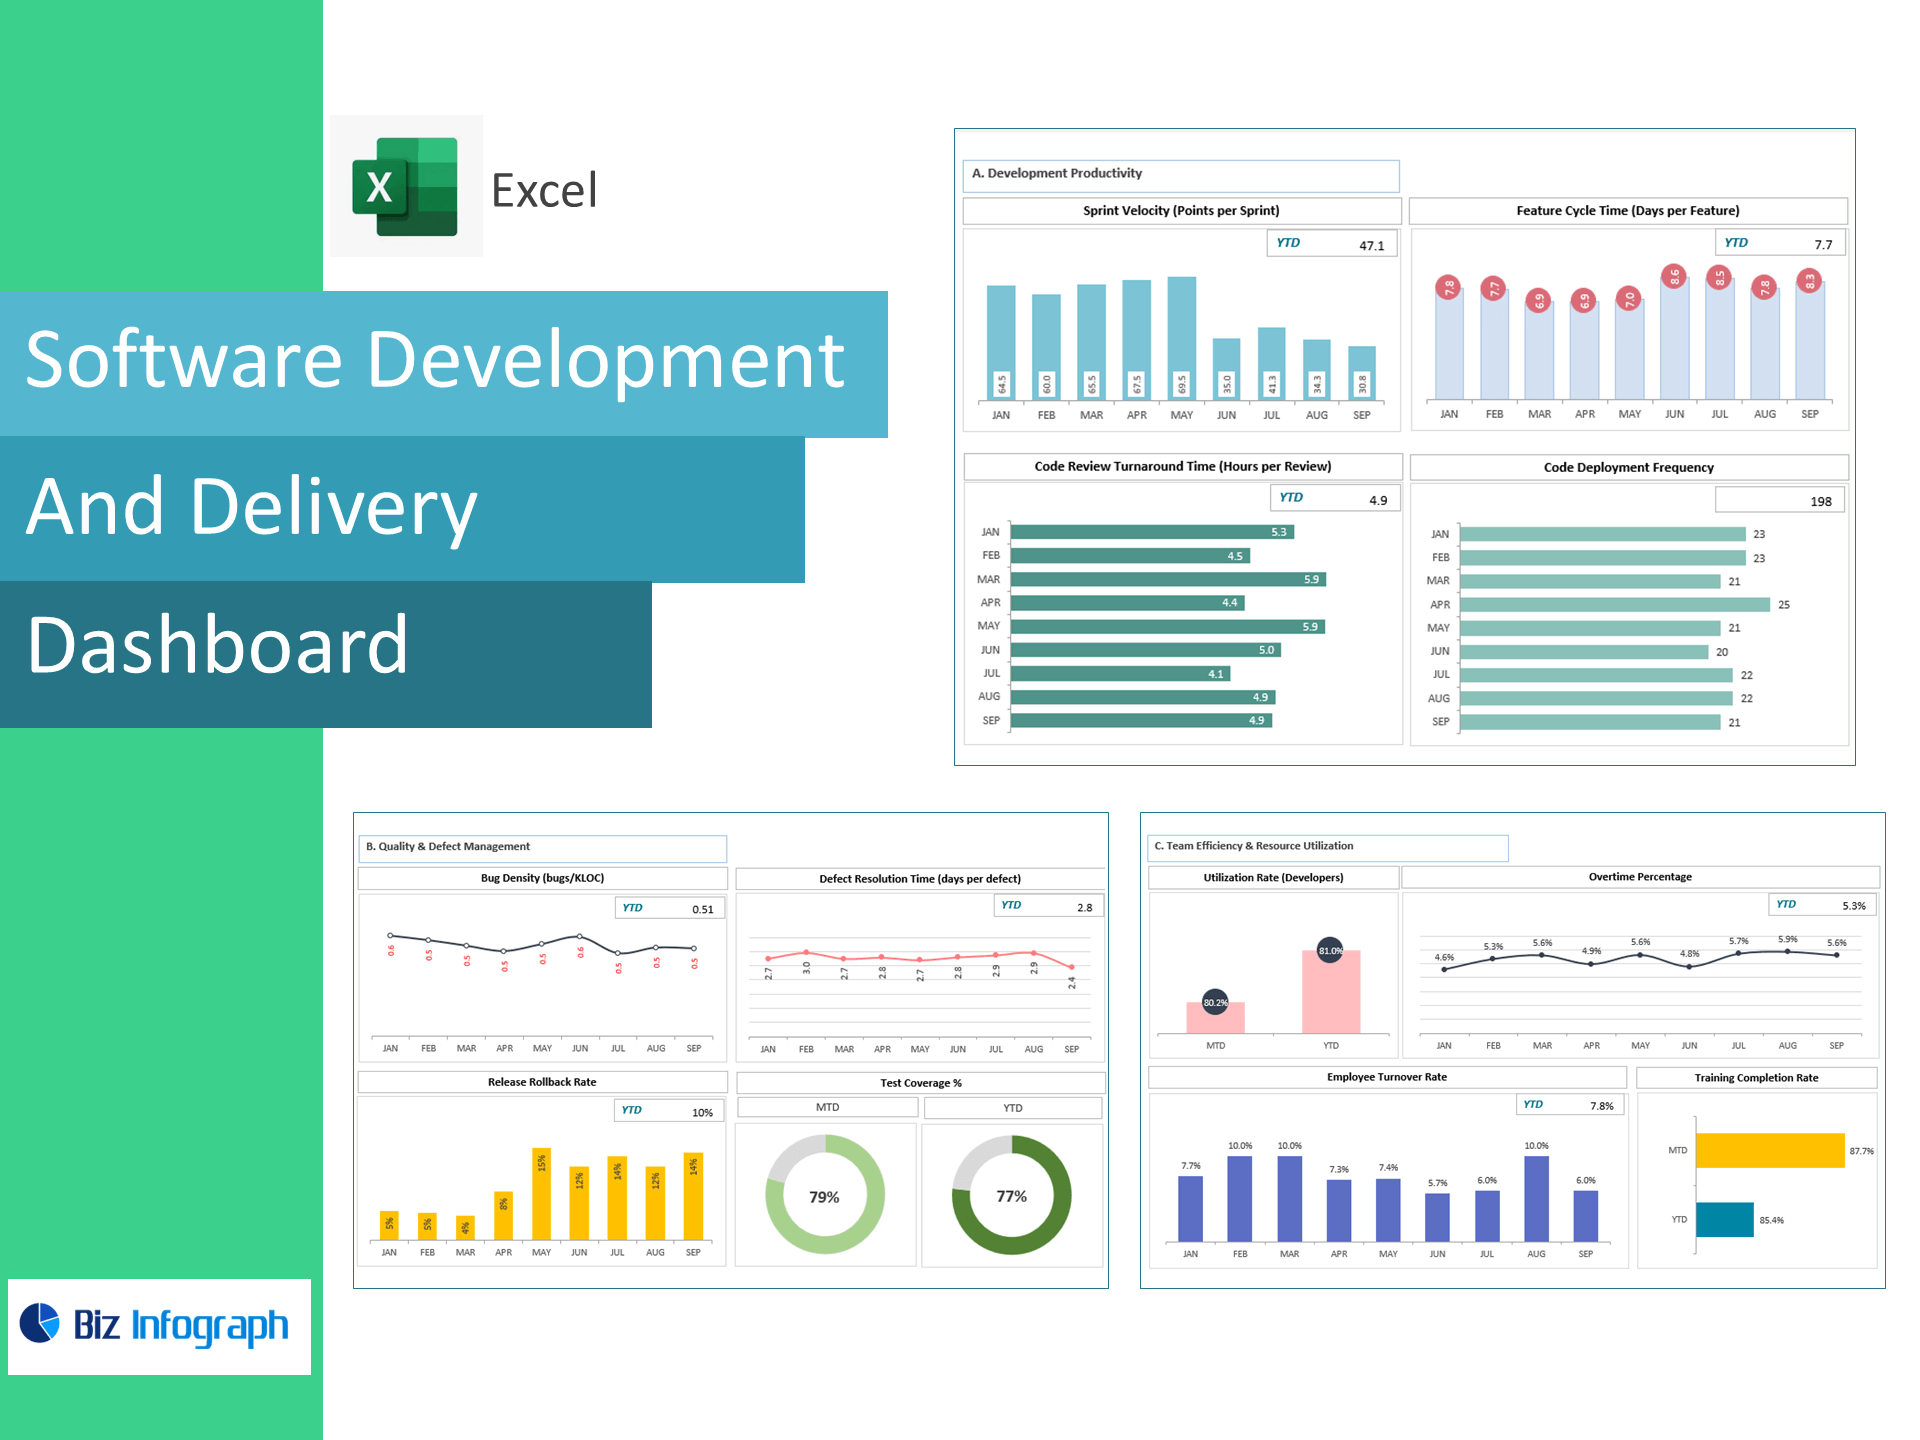
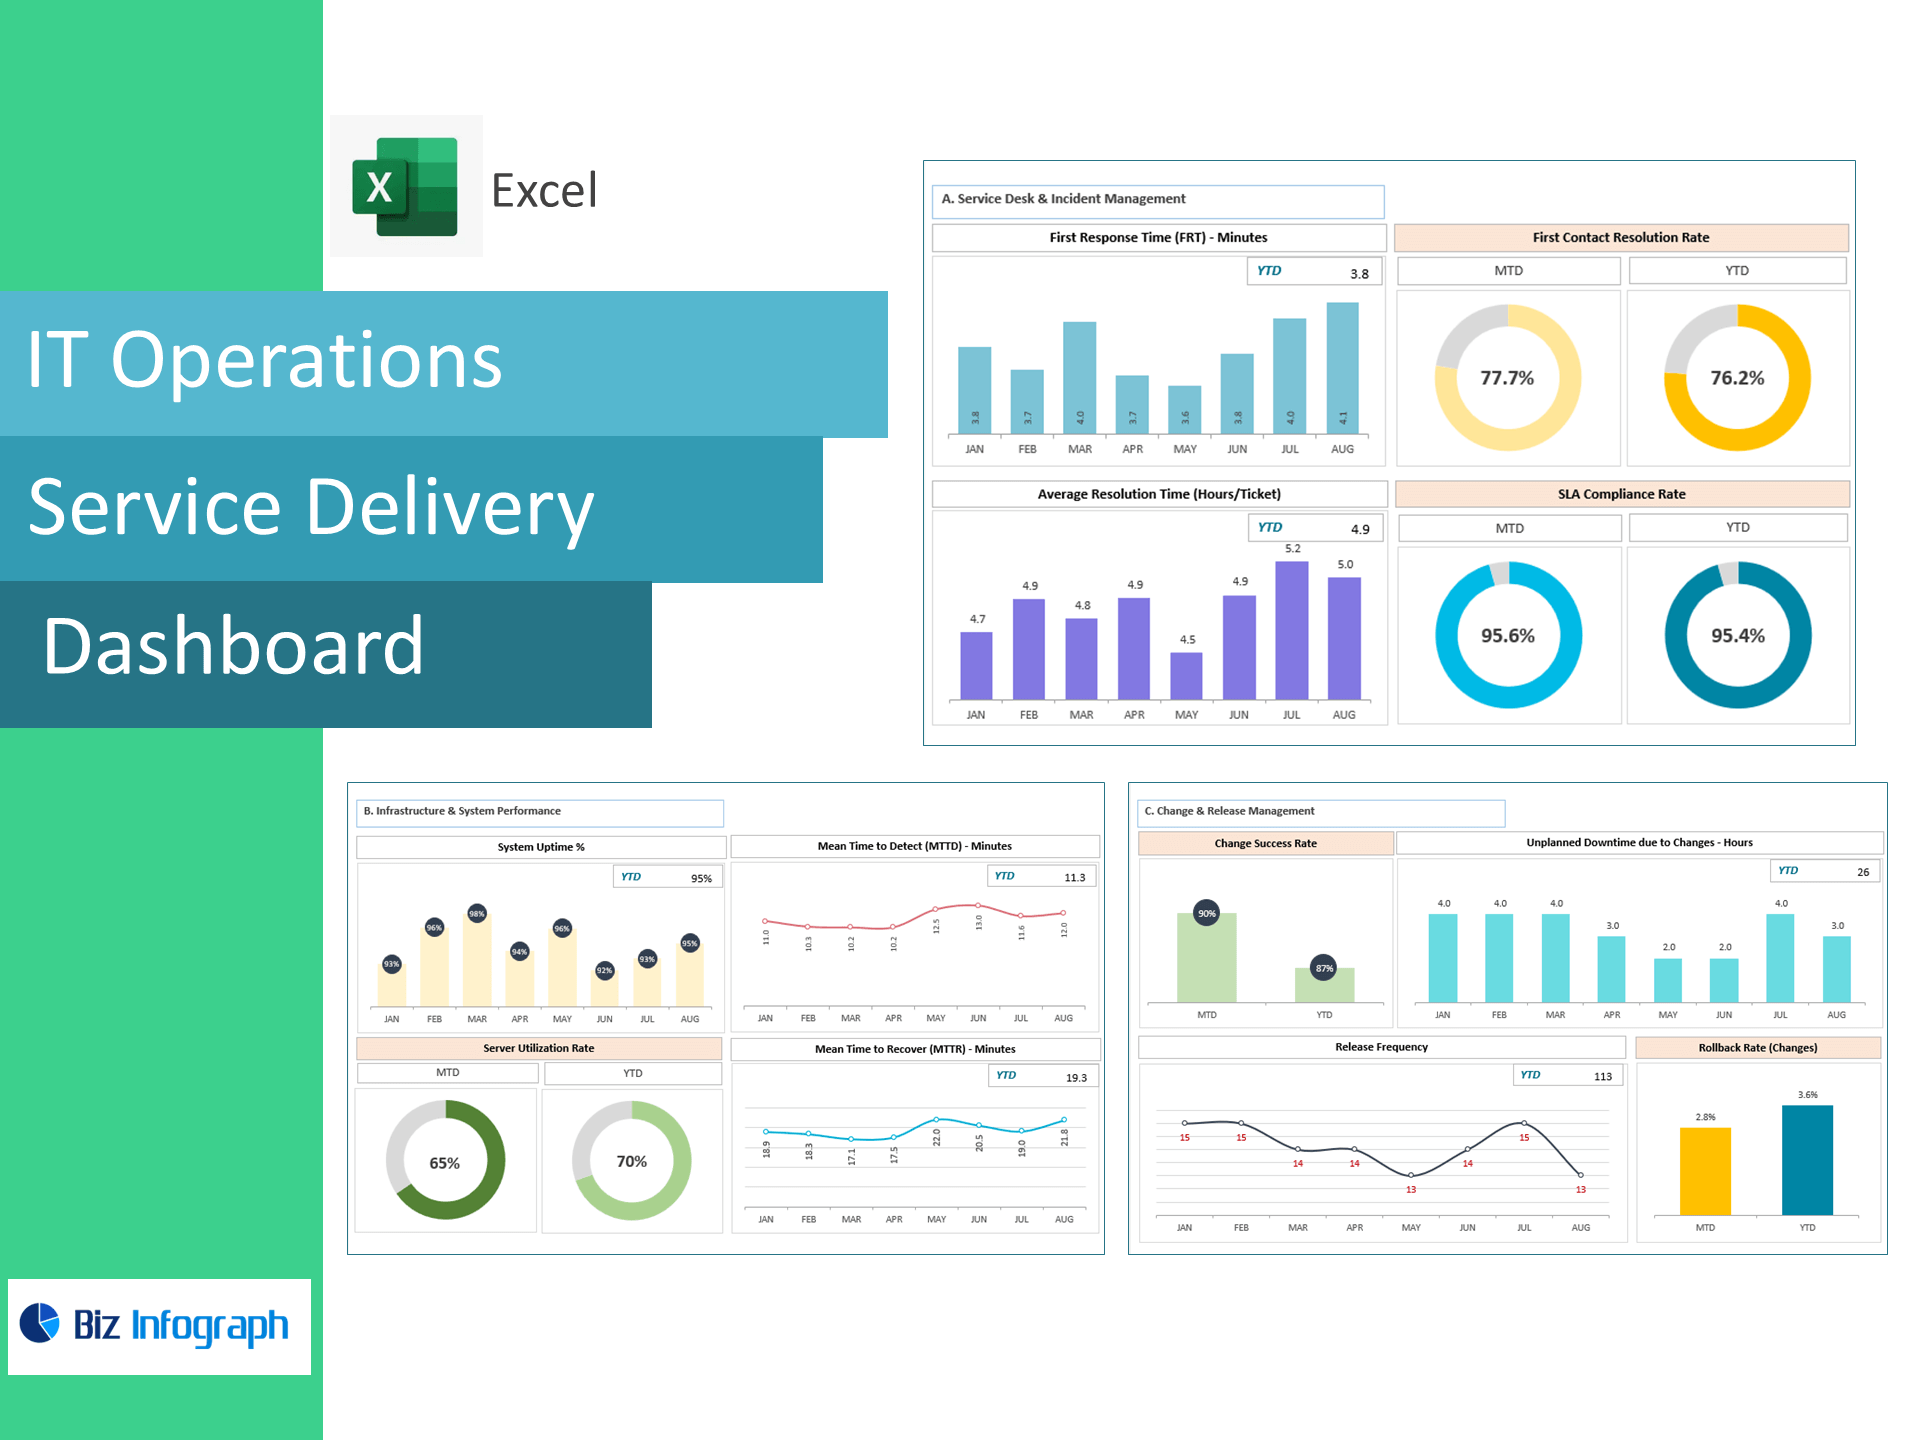
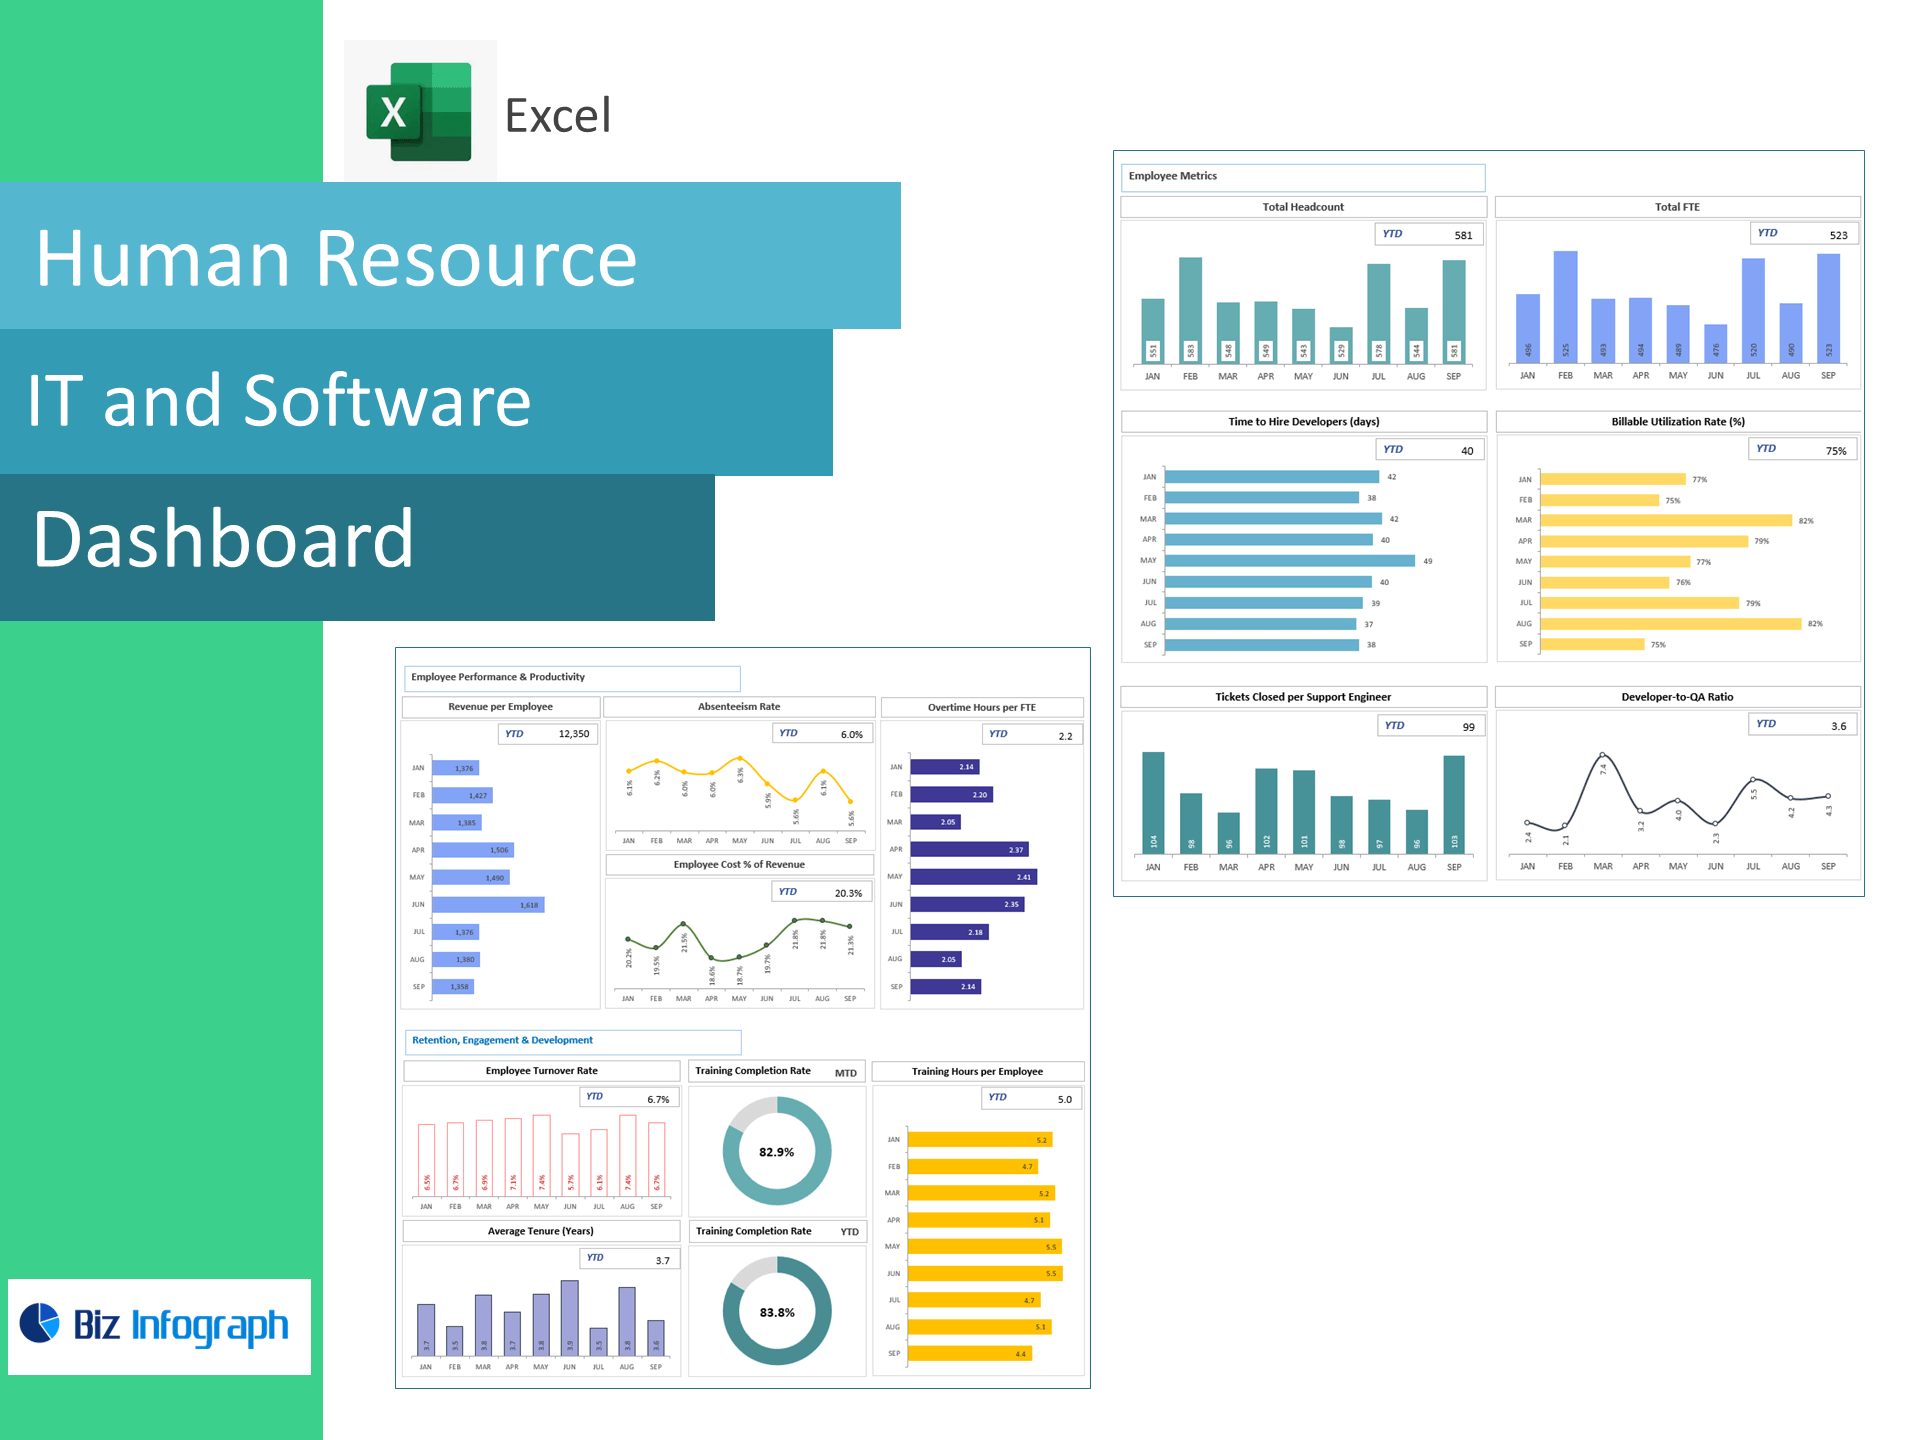
Executive Dashboard: Revenue, margins, OPEX mix, EBITDA, cash flow, CAC/LTV cards with Above/Below-Target flags.
-
SaaS Metrics Panel: CAC, ARPU, LTV trends and cohort-ready tables.
-
Income Statement & Cash View: Month-over-month and YTD with sparklines.
-
Assumptions & Data Tables: Drop in GL exports and new-customer counts.
-
Quick-Start Guide with sample data.
For ready-to-use Dashboard Templates: