Employee Turnover Dashboard: HR Dashboard for Workforce Termination Analytics
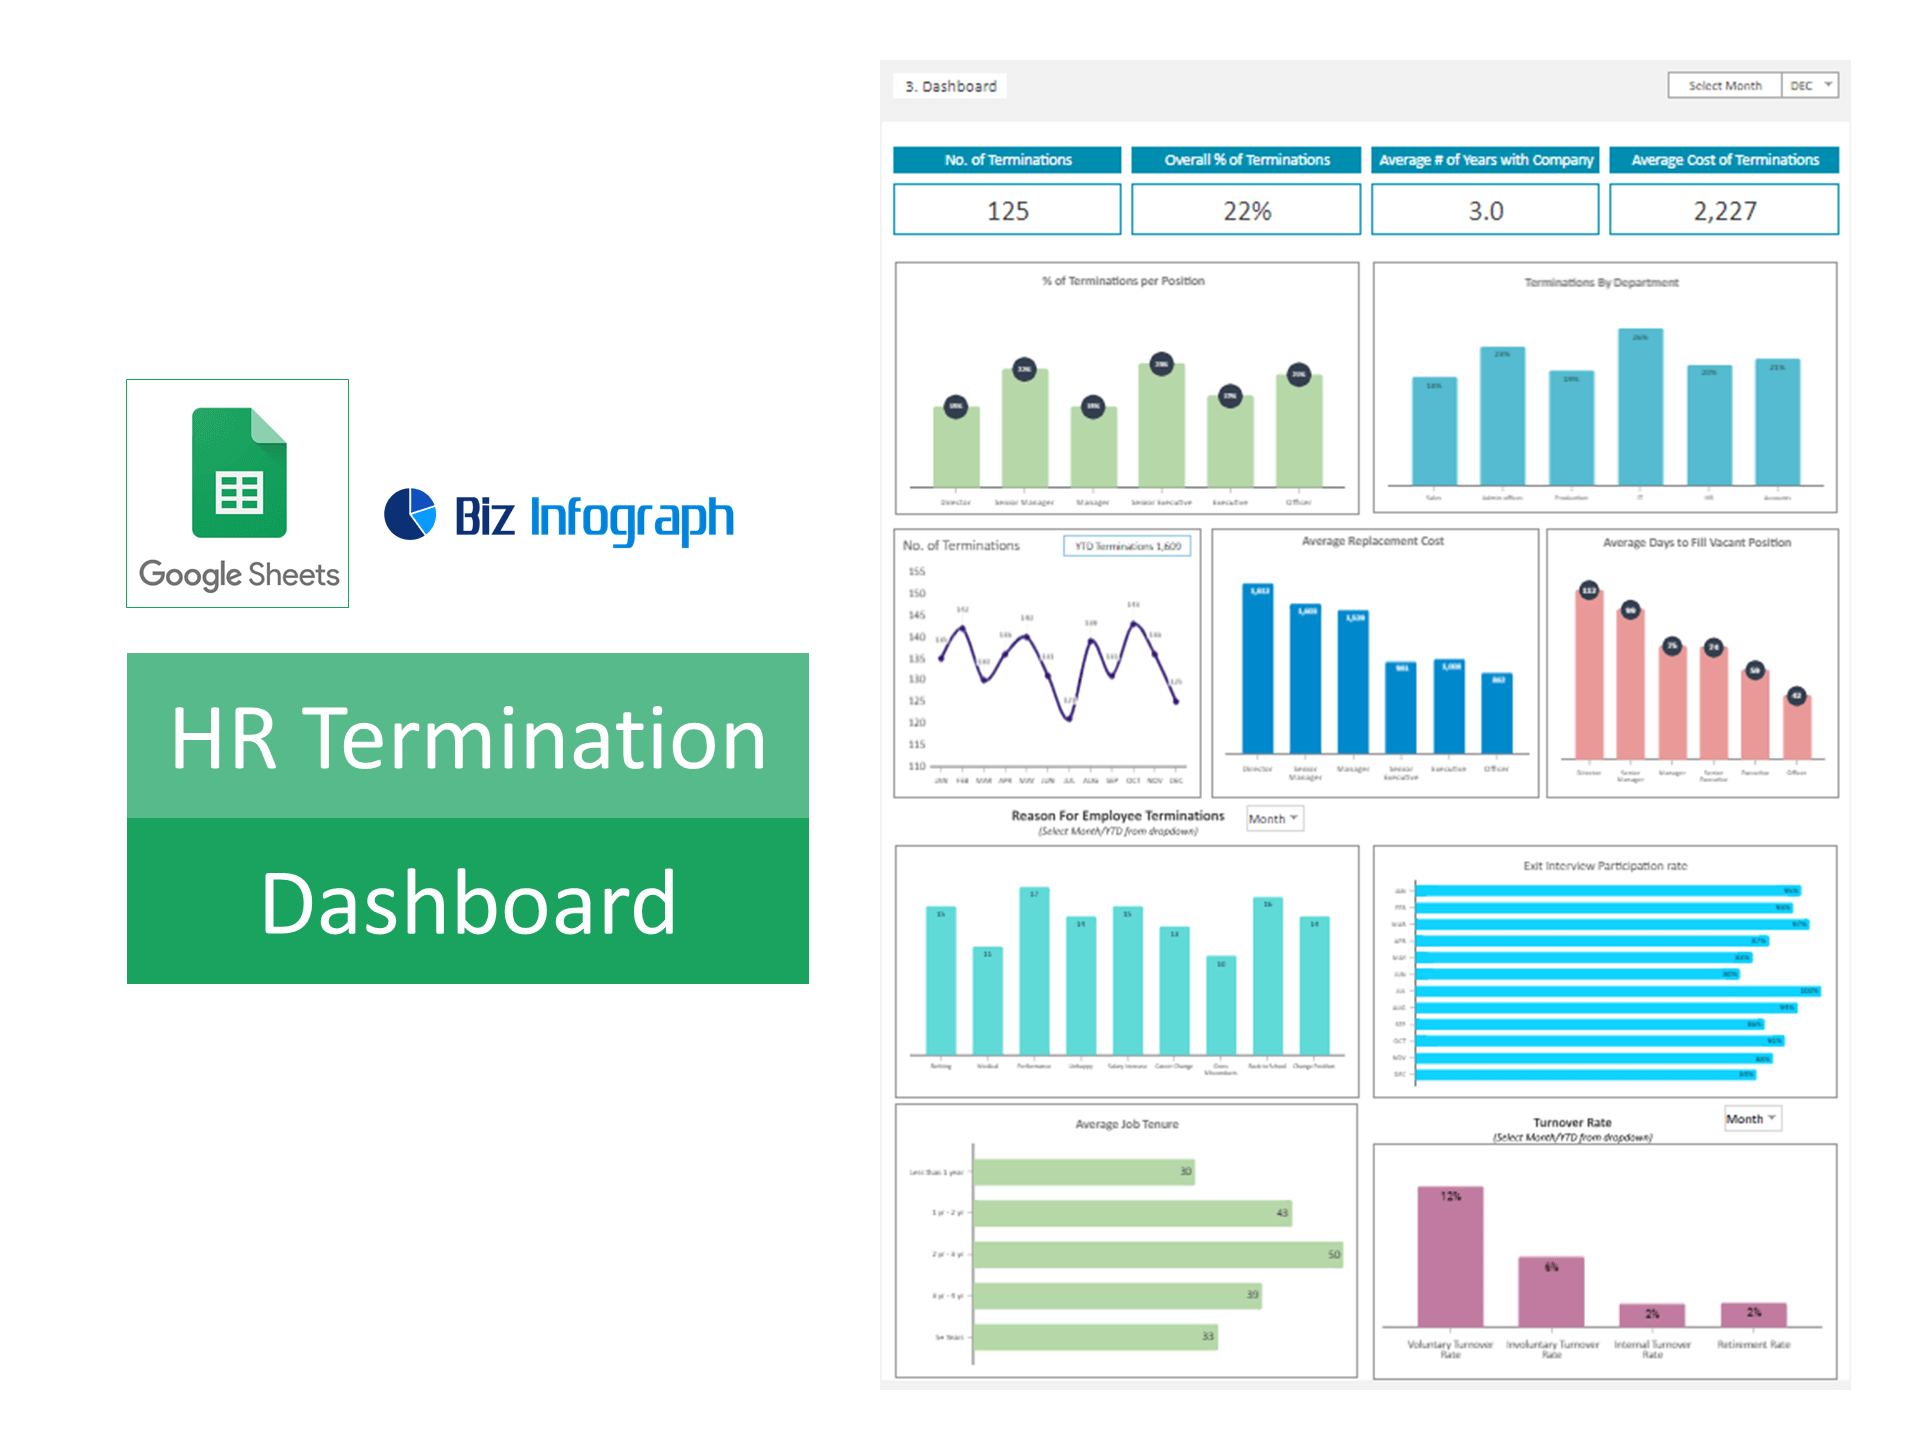
HR Termination Dashboard Excel Template and Google Sheets
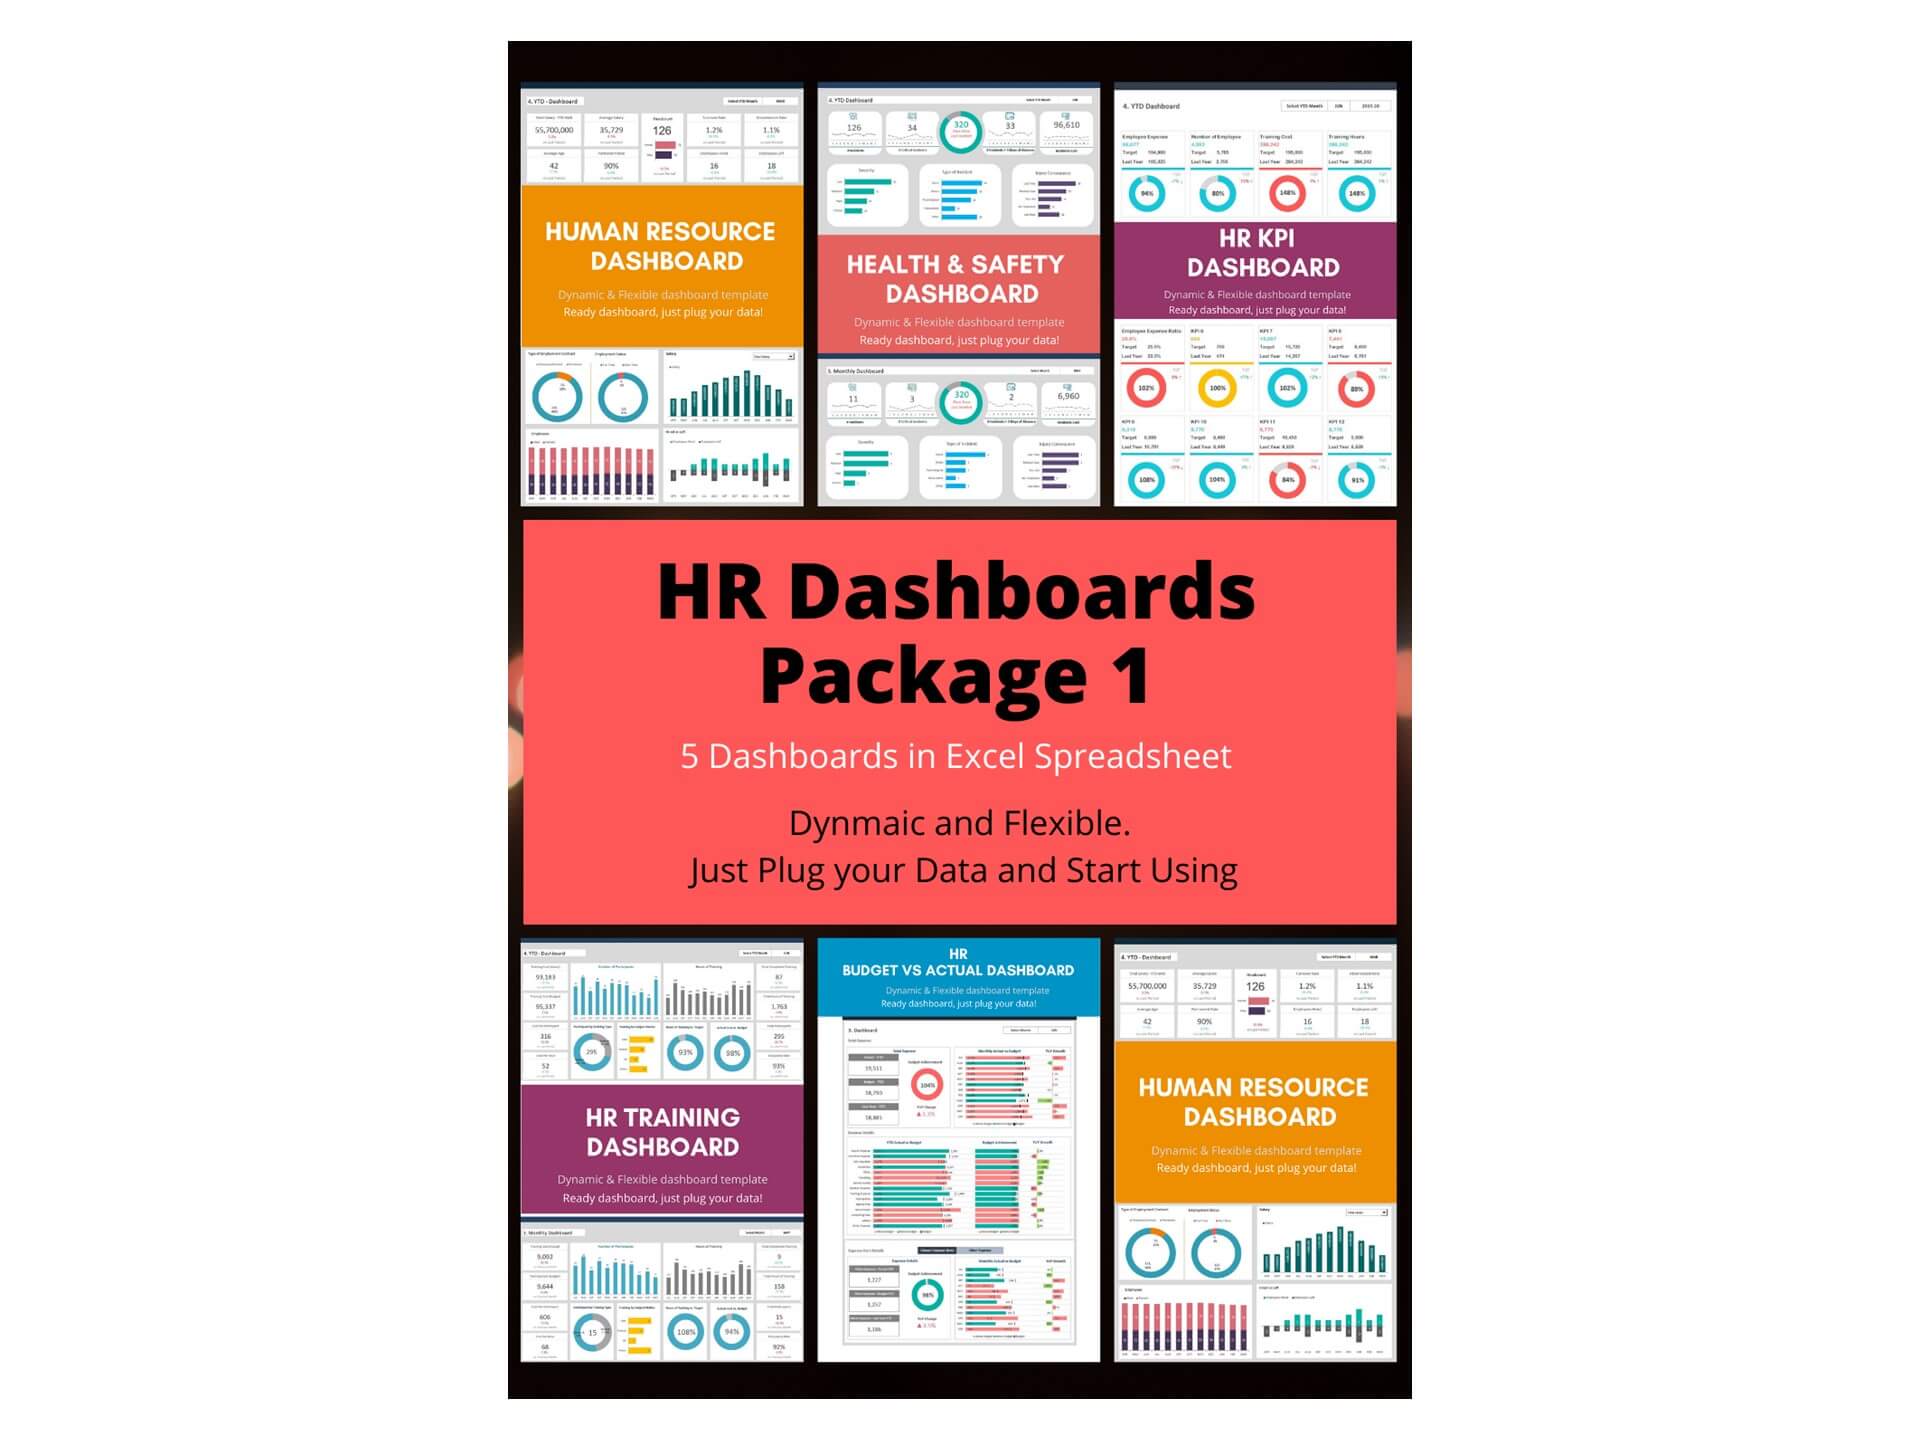
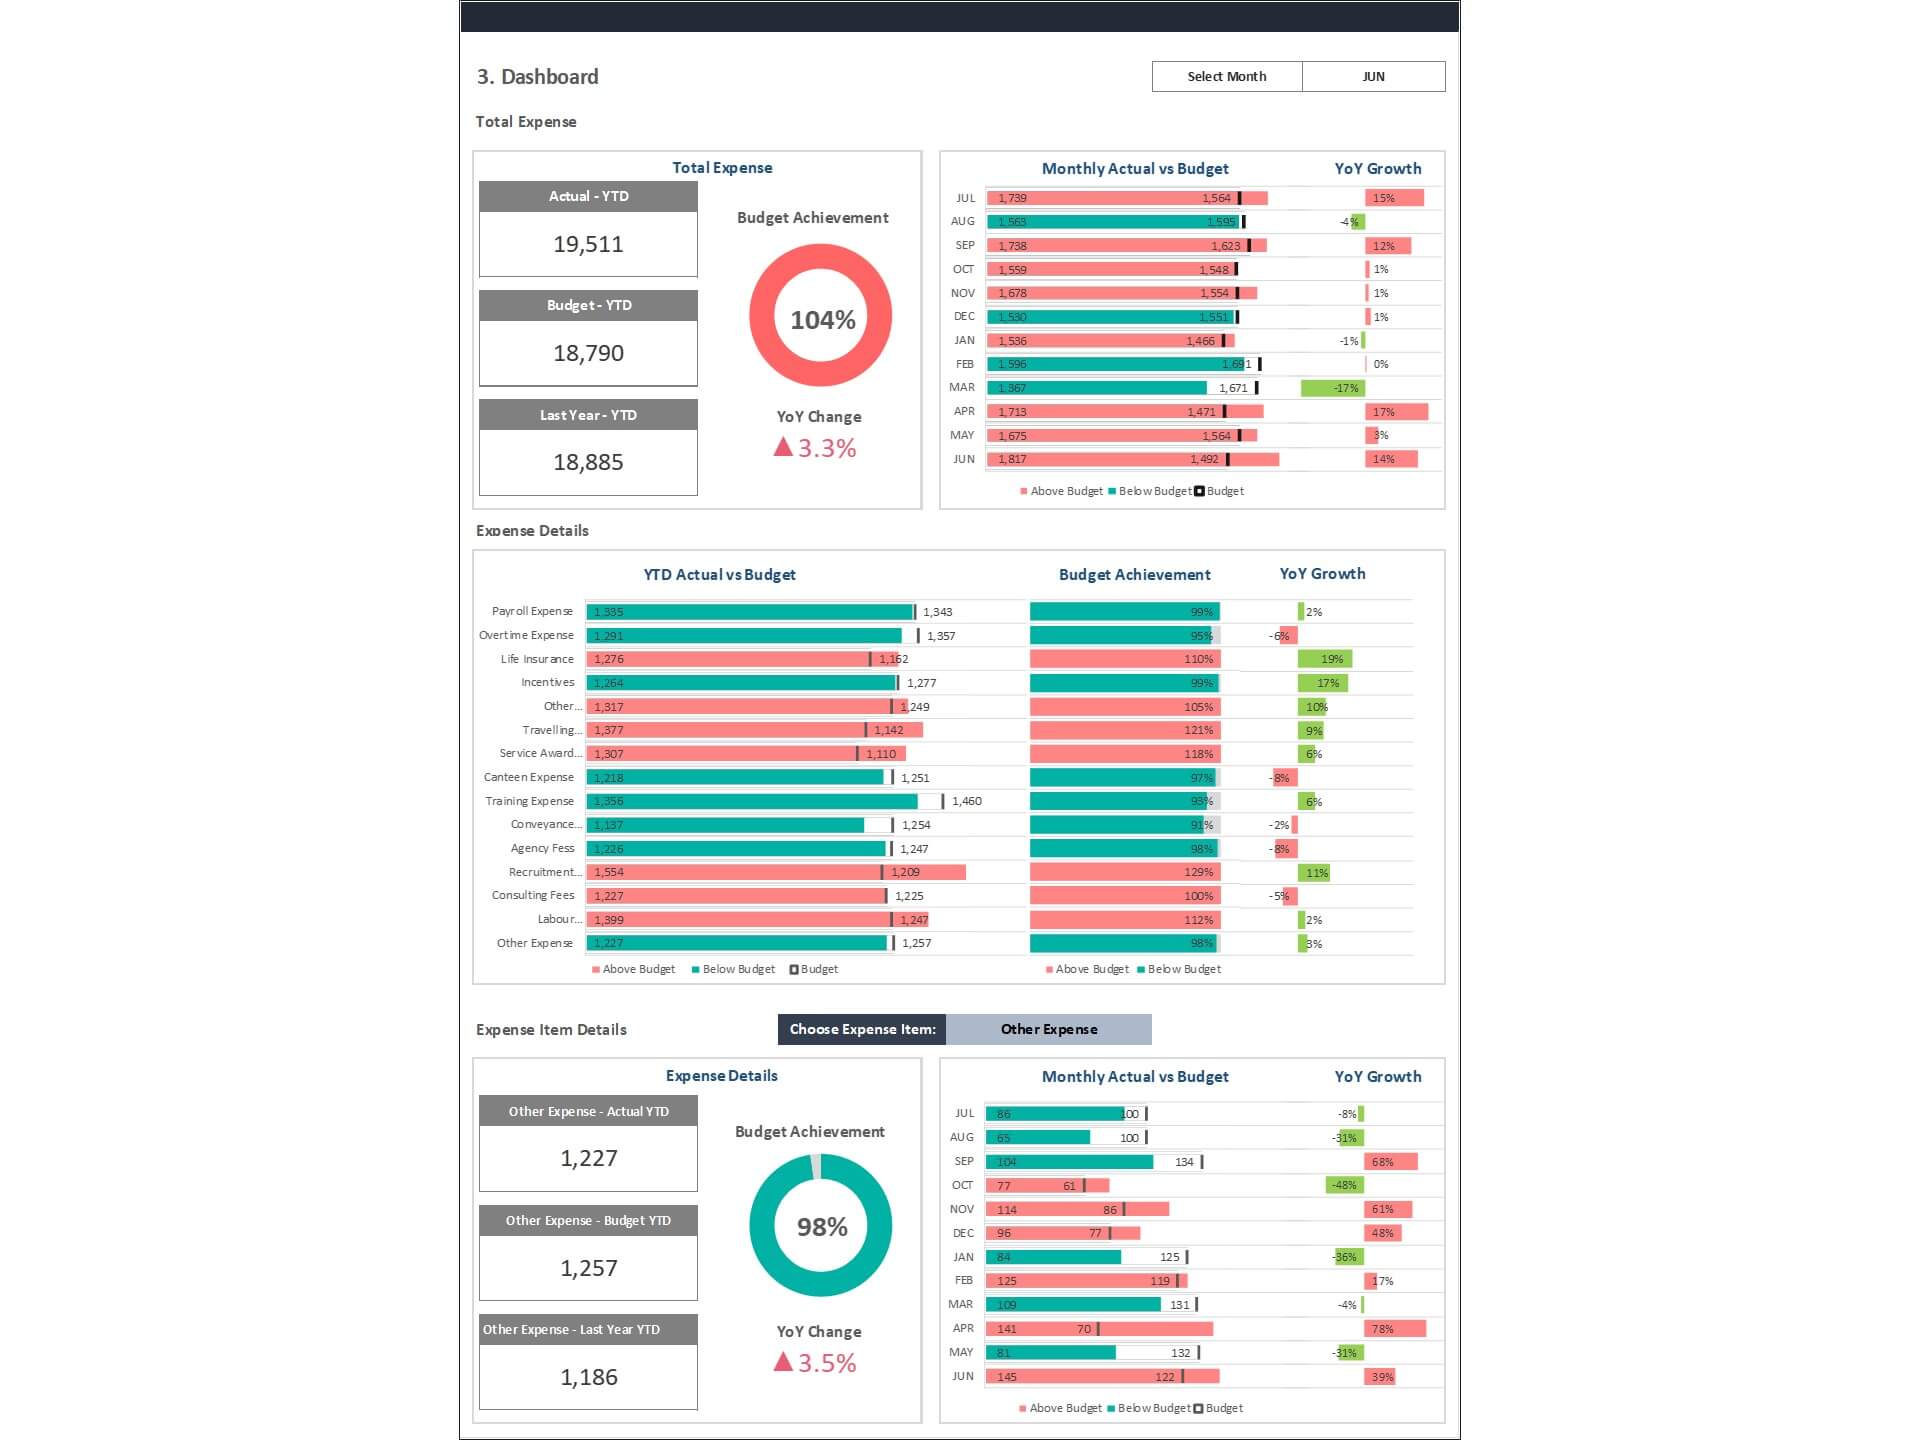
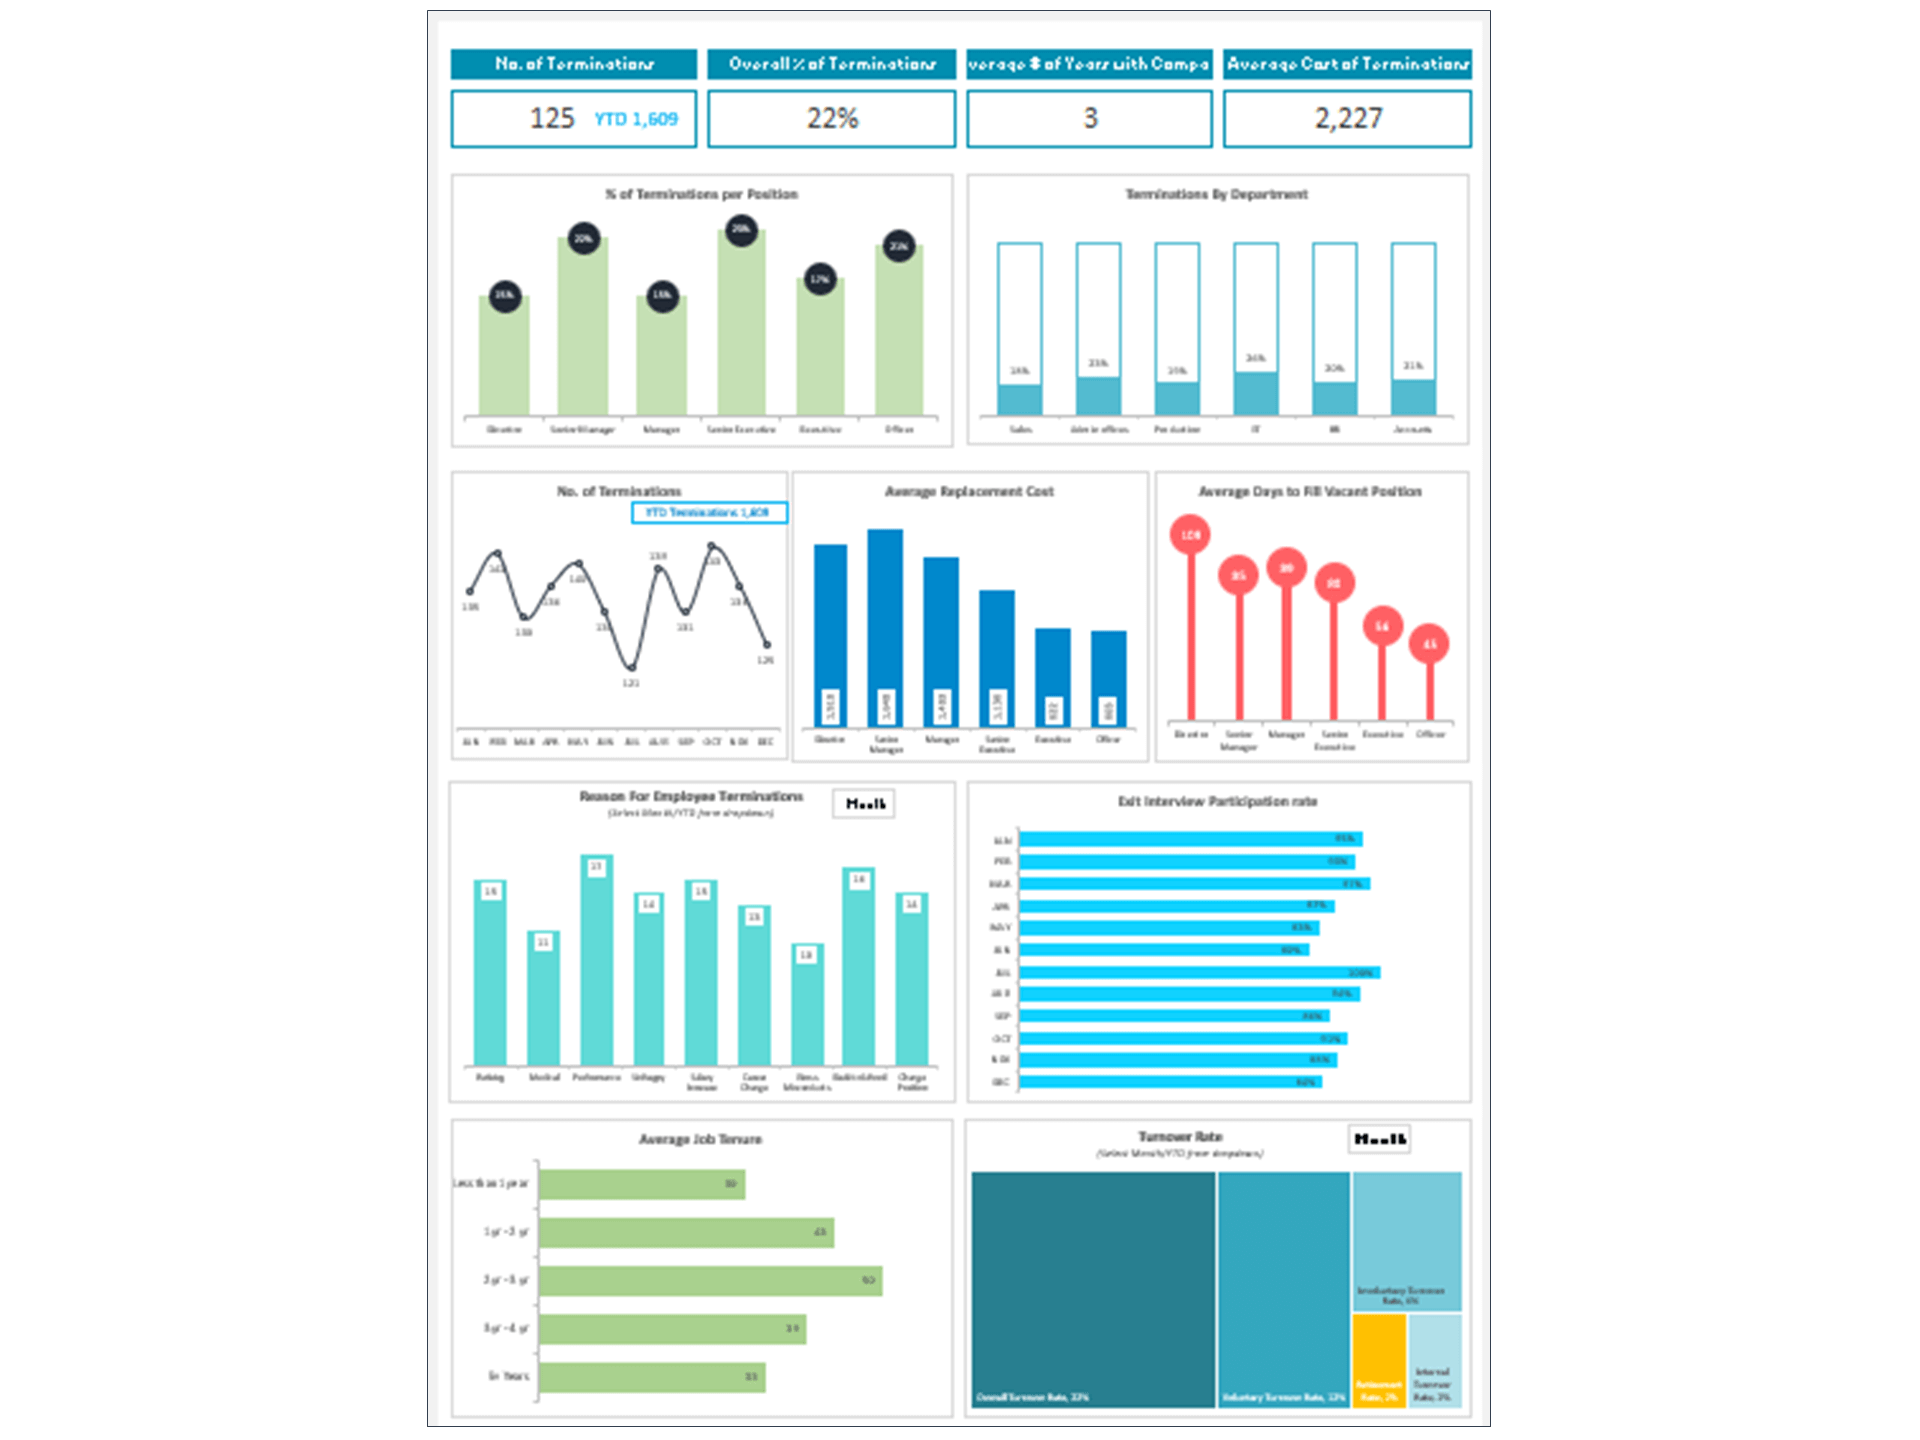
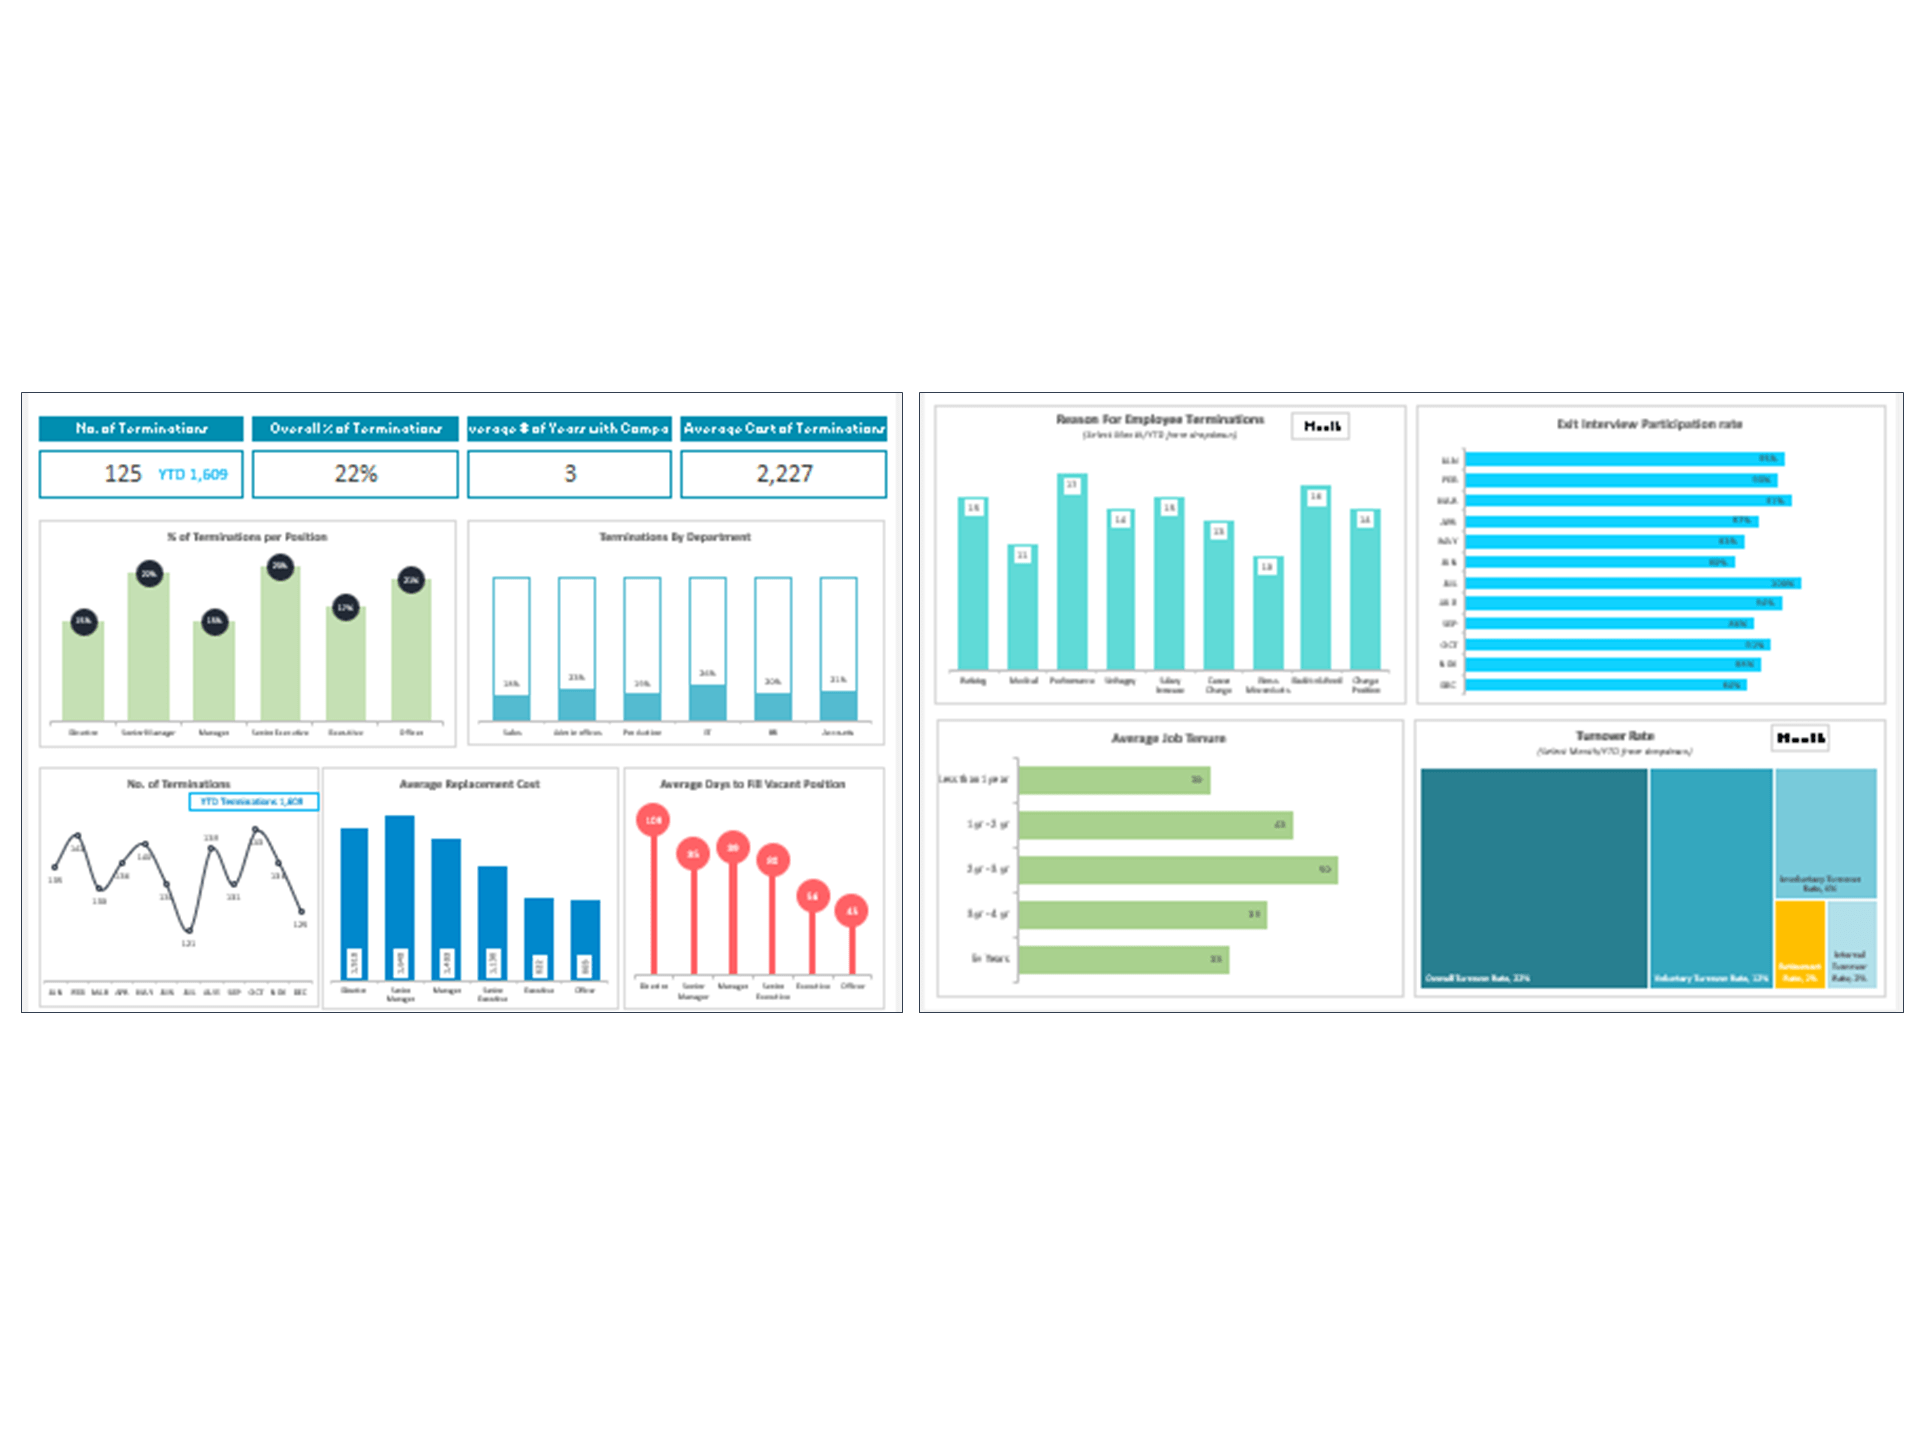
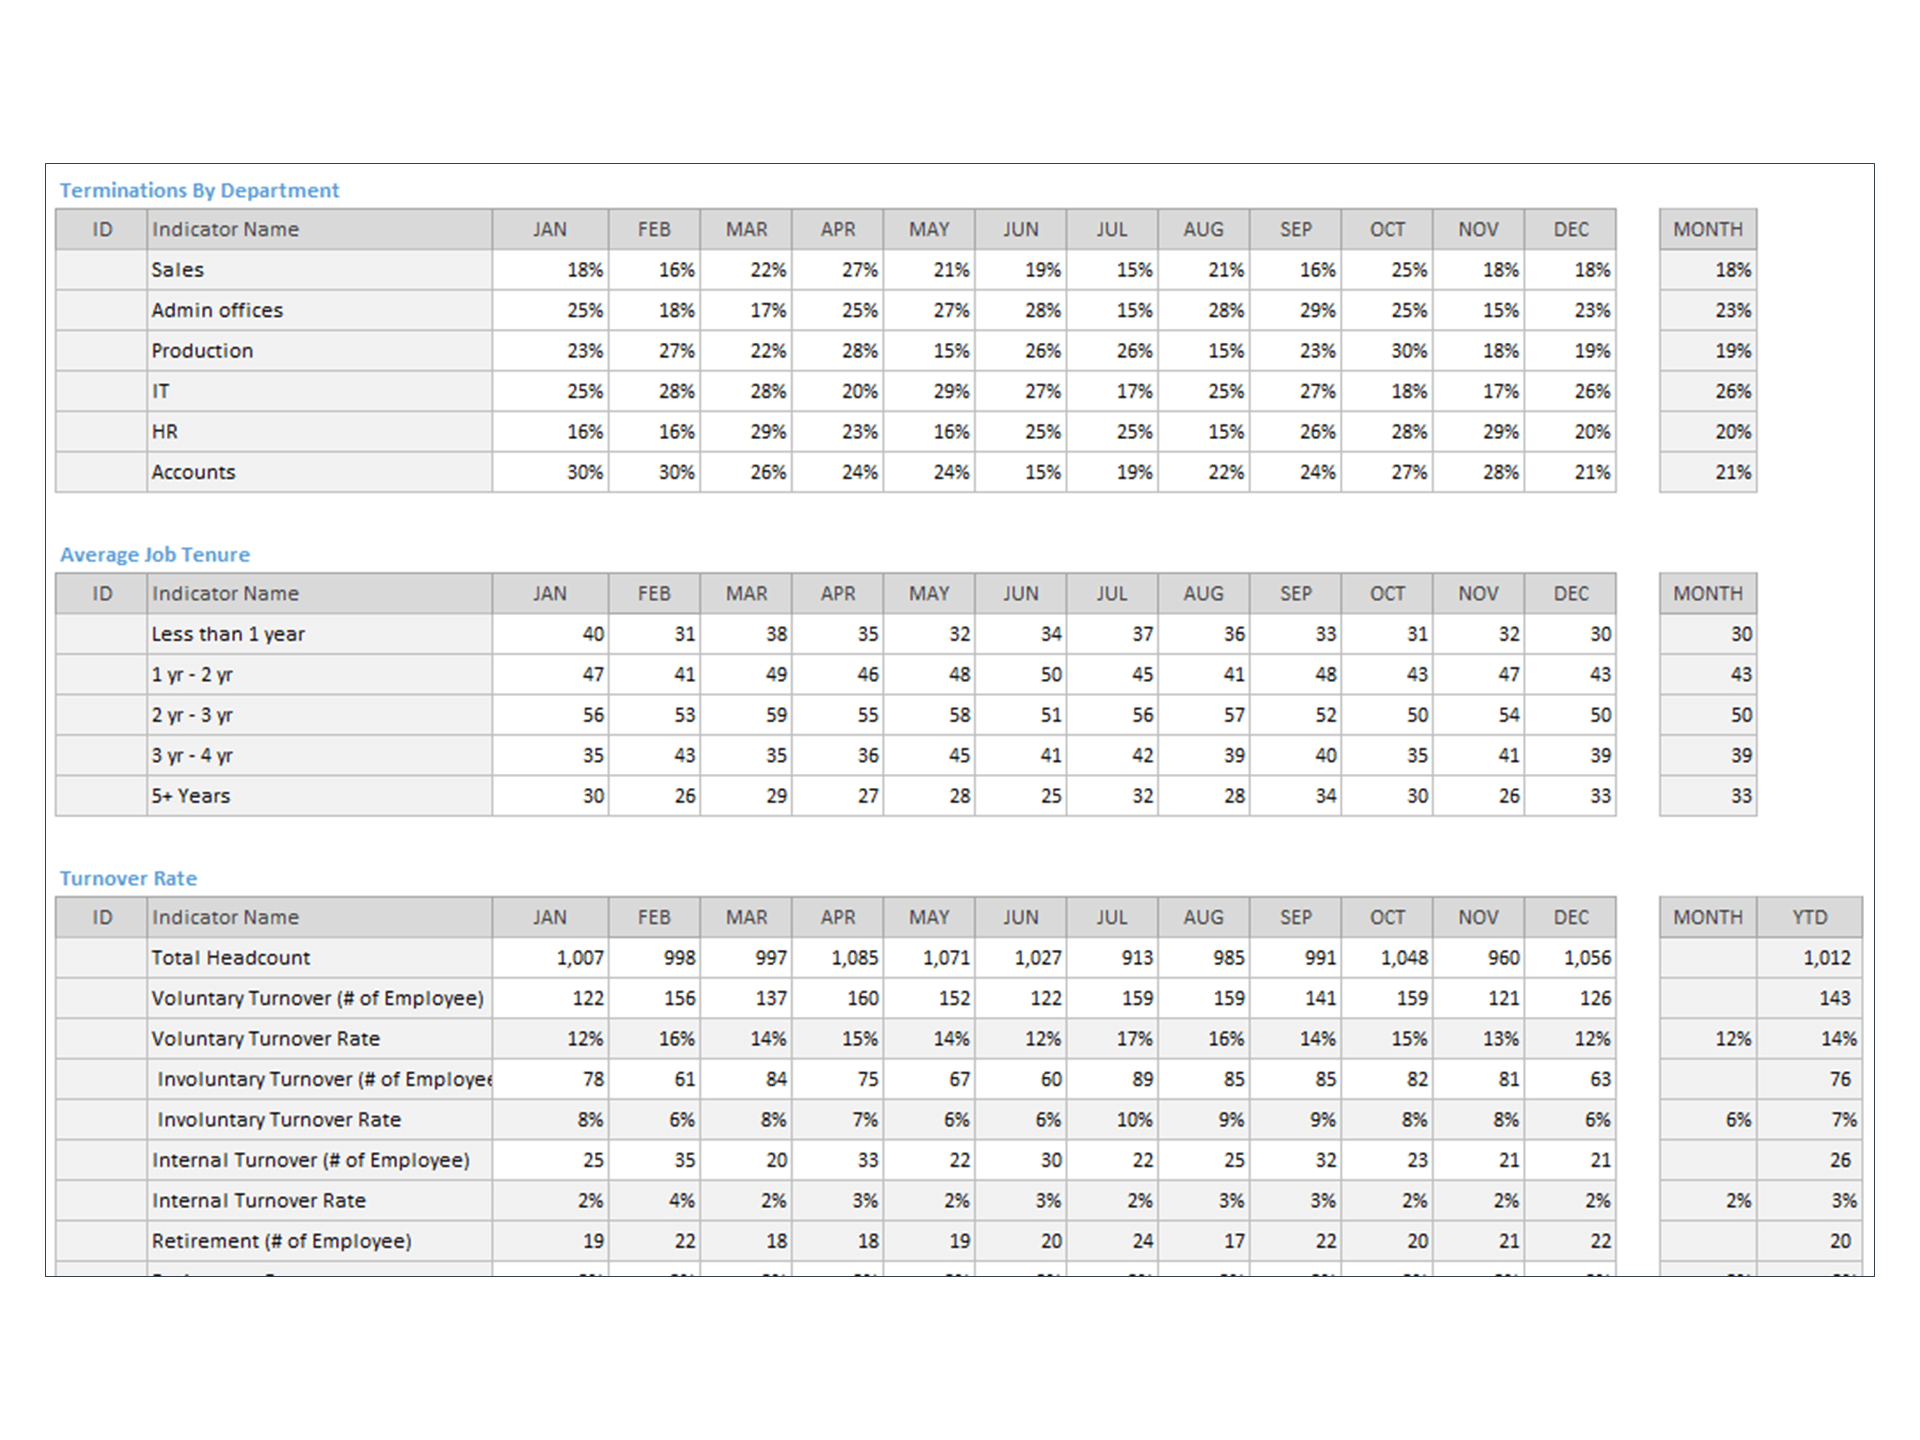
Employee Turnover Dashboard - Termination Dashboard is an Excel spreadsheet (Google Sheets Dashboard) that is perfect for tracking HR Termination indicators.
The HR Termination Dashboard Excel Template is a practical tool designed to help Human Resource teams monitor and analyze employee exits effectively. This Termination Template provides clear insights into employee turnover, resignation trends, department-level exits, and termination reasons, helping organizations understand workforce movement.
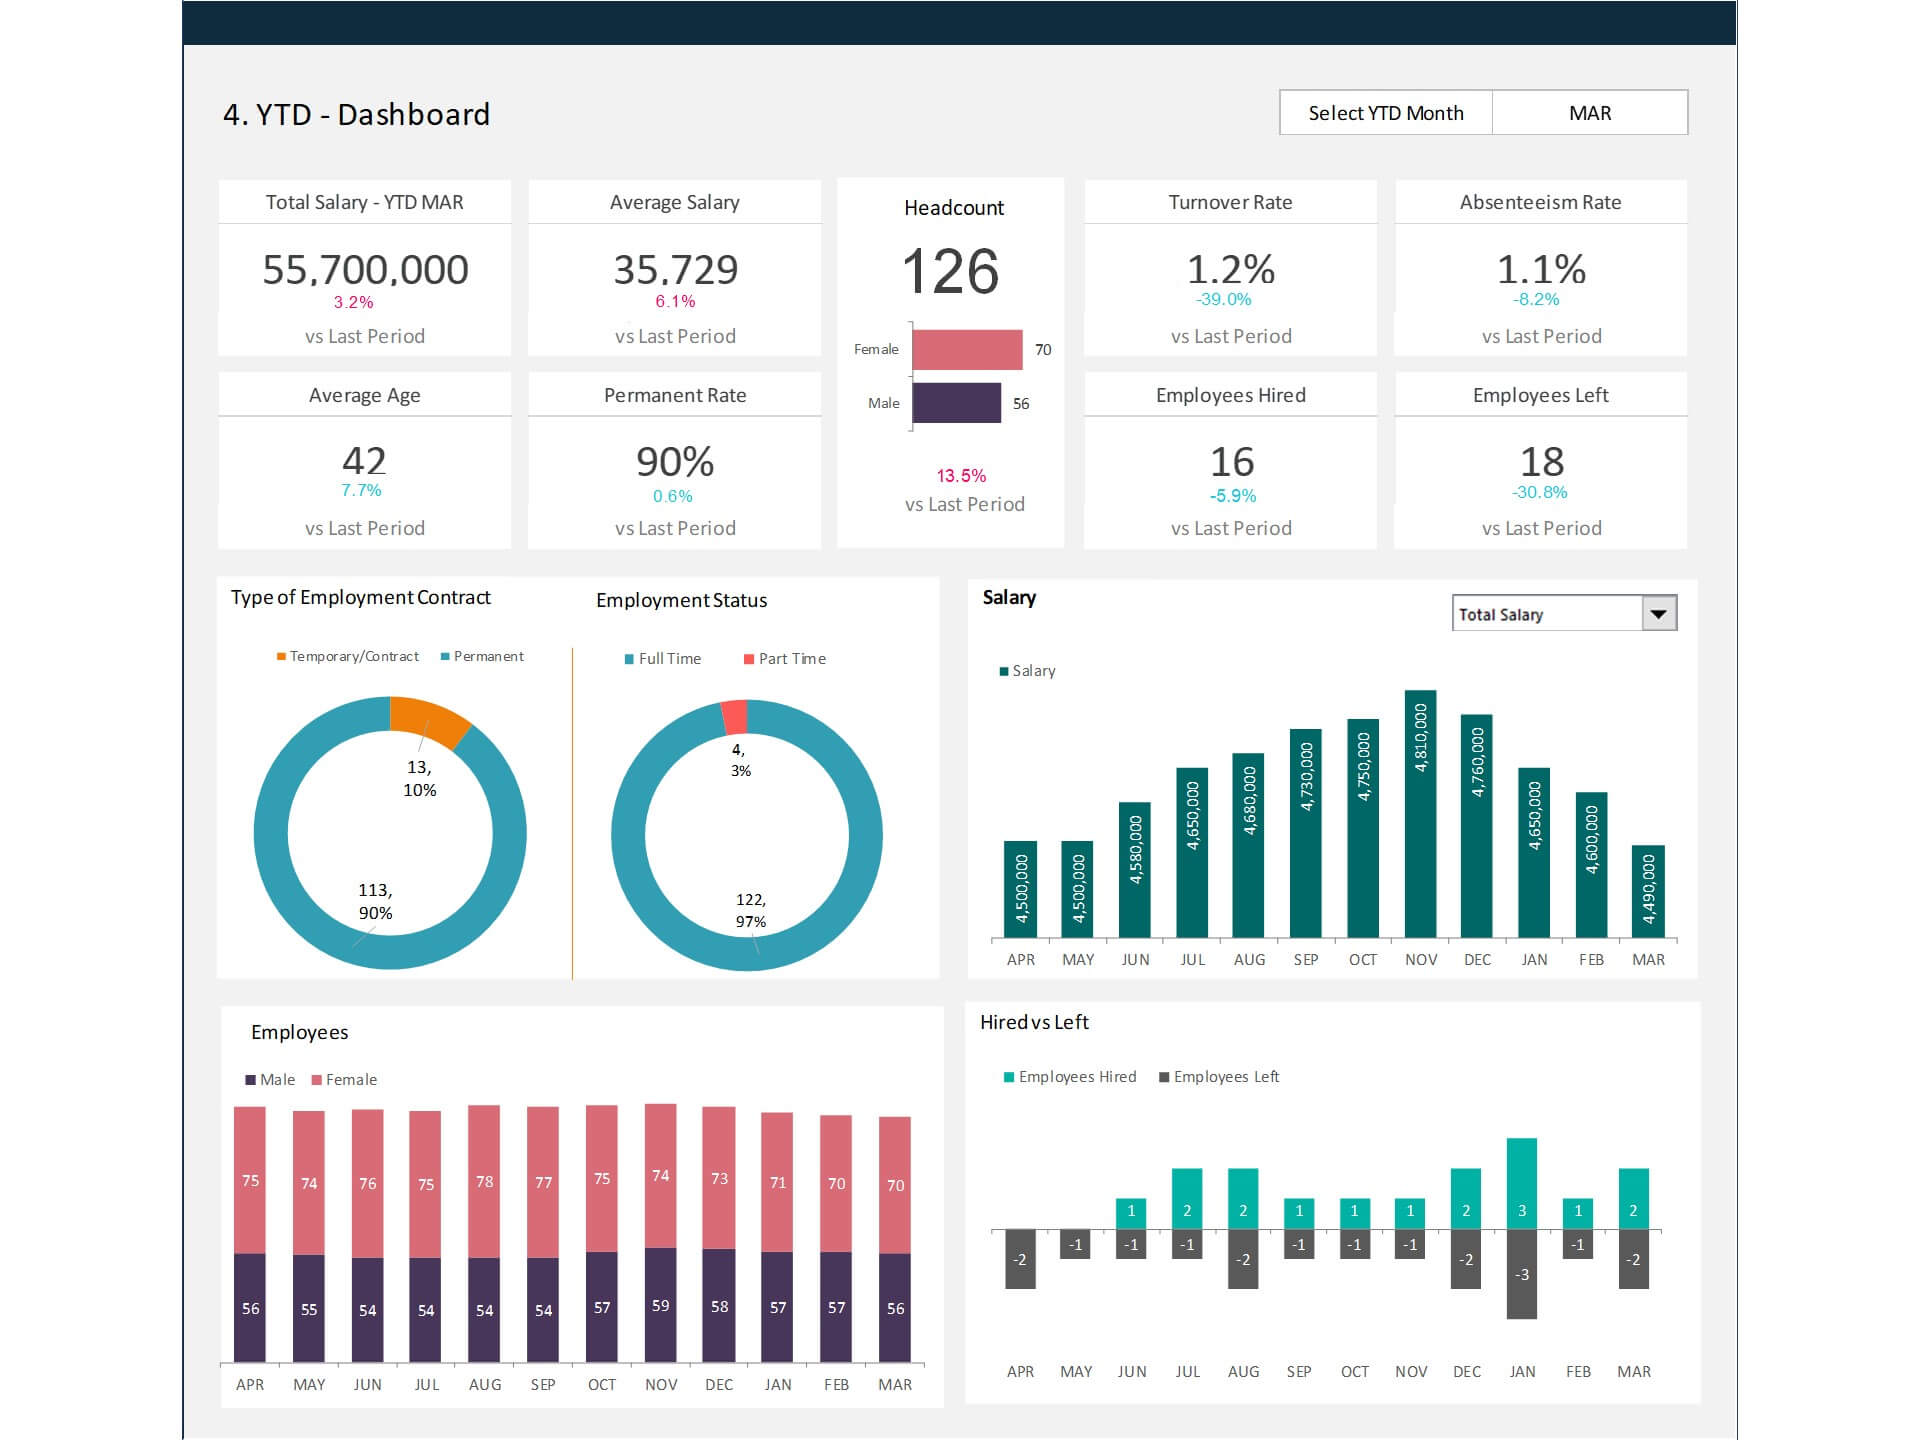
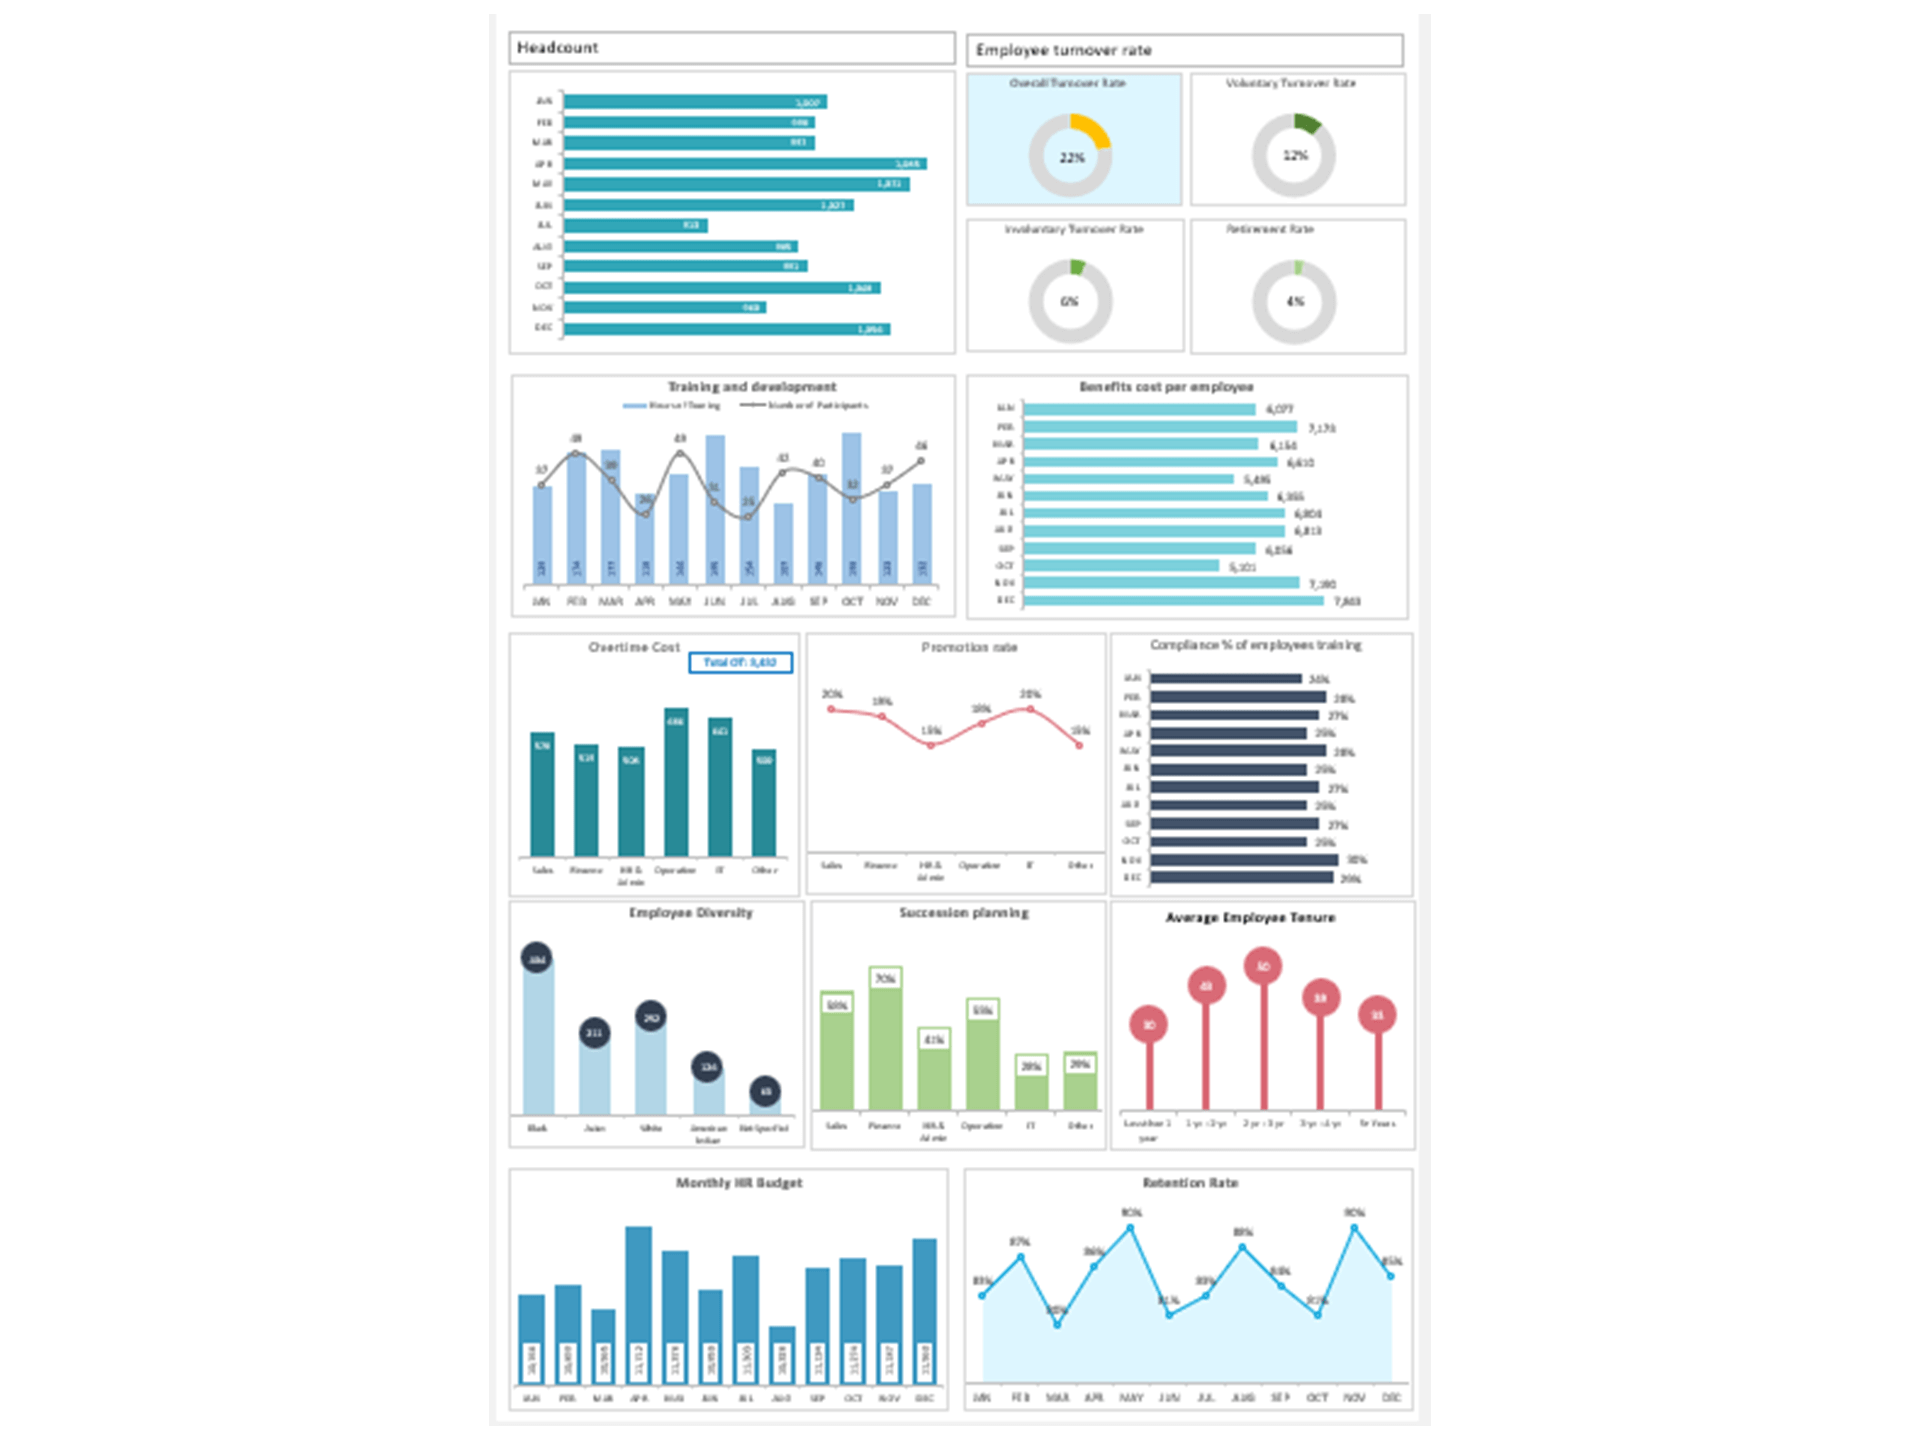
The HR Termination dashboard allows HR managers to track important Termination KPI metrics such as turnover rate, voluntary vs involuntary terminations, average tenure at exit, and monthly termination trends. By presenting these metrics visually, the dashboard functions as an effective HR KPI Dashboard that supports better workforce planning and retention strategies.
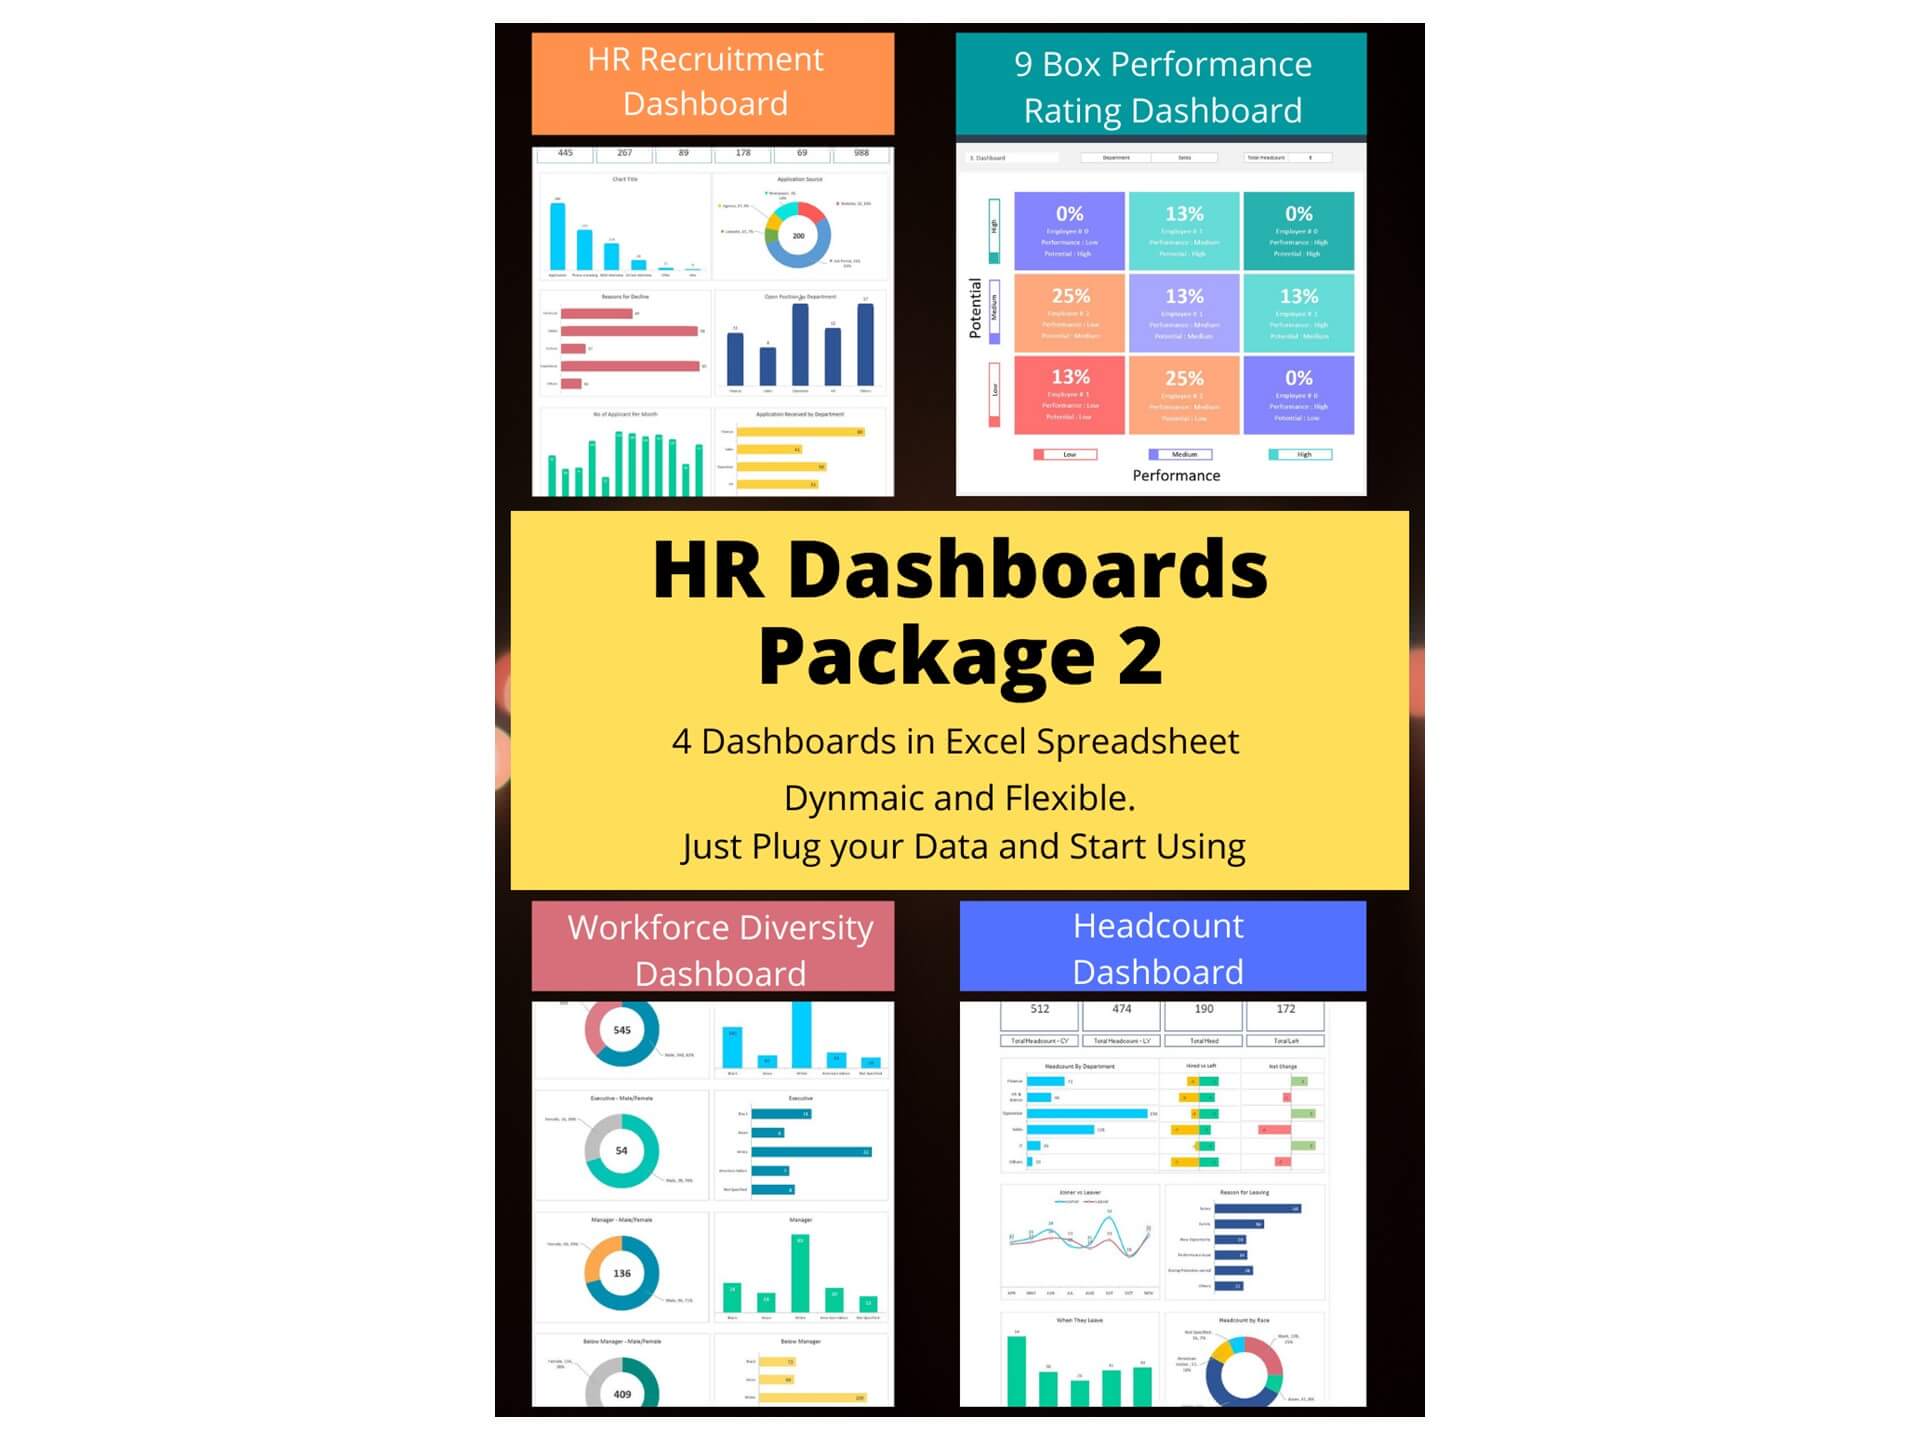
As part of a comprehensive HR Dashboard Package, the template helps organizations identify patterns in employee departures and address potential workplace issues. The dashboard can also be adapted for Google Sheets, allowing HR teams to collaborate and update data in real time.
The Foundation of Employee Turnover Dashboards
Dashboard Basics in HR Analytics
Understanding the basics of HR analytics dashboards is crucial for effectively monitoring and managing employee turnover. These dashboards serve as a central platform for aggregating, visualizing, and analyzing HR data, enabling professionals to track key performance indicators (KPIs) such as turnover rate, employee tenure, and attrition. By consolidating data in an easily digestible format, human resource dashboards empower teams to identify trends and patterns, facilitating proactive workforce management and strategic decision-making.
Gaining Insights from Analyzing Turnover Data
Analyzing turnover data through HR dashboards provides invaluable insights into the reasons behind employee departures, helping organizations to identify underlying issues such as job dissatisfaction, lack of growth opportunities, or cultural misfits. By delving into this data, HR professionals can develop targeted strategies to improve employee retention, enhance engagement, and build a more resilient and satisfied workforce, ultimately contributing to the organization's overall health and productivity.
Key Metrics for an Employee Turnover Dashboard
Understanding Attrition Rates and Organizational Impact
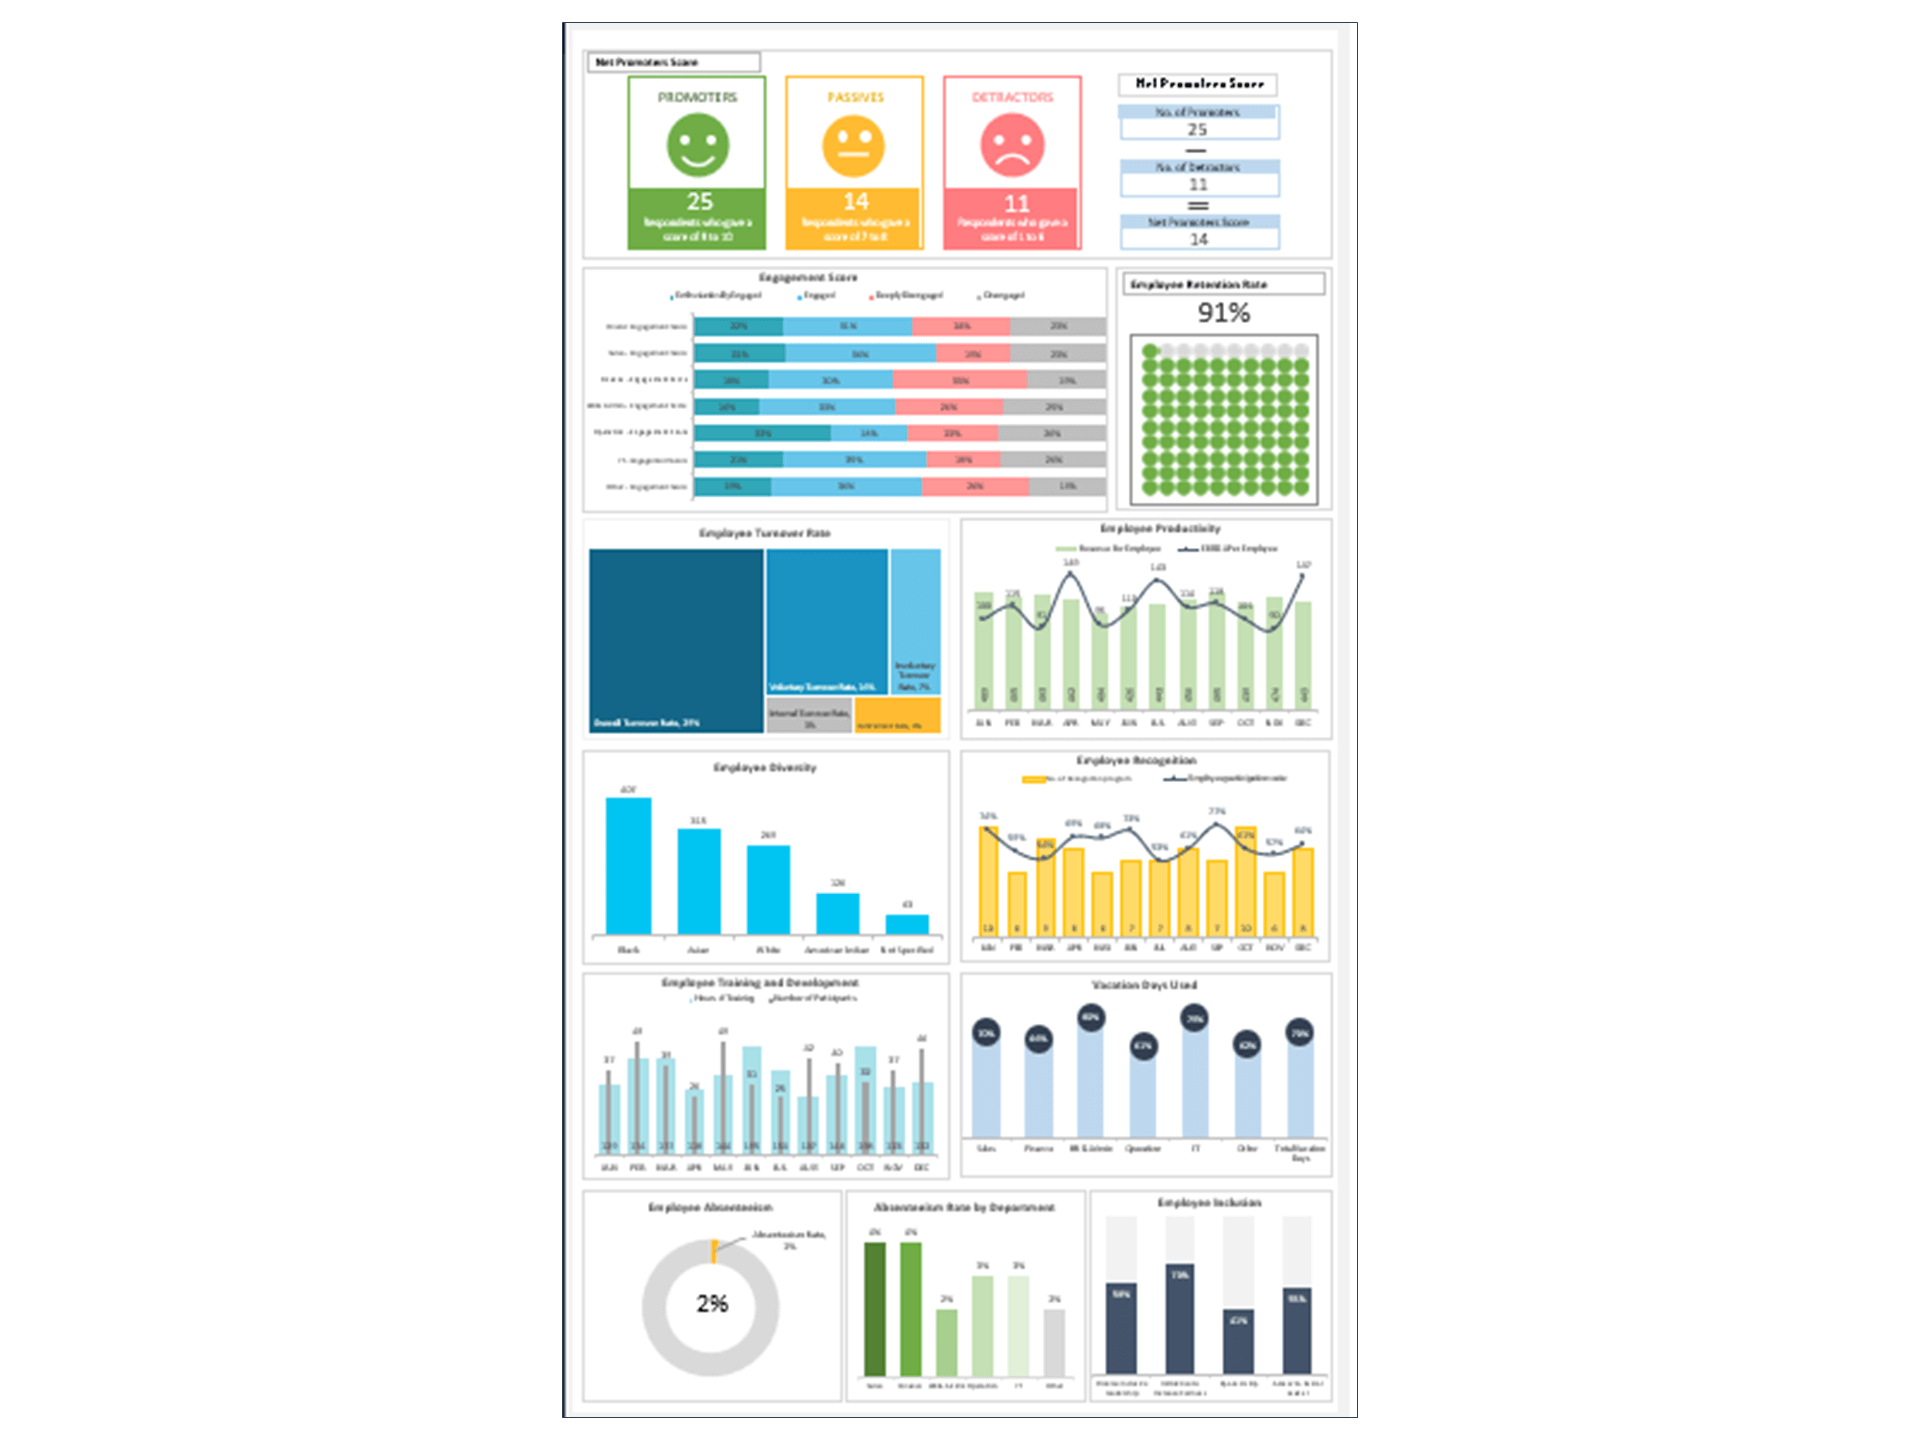
Attrition rates are a critical metric for any HR dashboard, offering clear insights into the health of an organization's workforce and number of employees. High attrition rates can signal underlying problems within the company culture, management practices, or employee satisfaction levels. Understanding these rates and their impact on the organization is essential for HR professionals to implement effective retention strategies and maintain a stable, engaged workforce.
Enhance Employee Retention by Analyzing Employee Tenure
Employee tenure metrics provide a snapshot of workforce stability and long-term engagement. Analyzing tenure helps HR teams to understand people analytics including career progression within the company, identify potential stagnation points, and develop strategies to enhance job satisfaction and career development opportunities. This focus on tenure can lead to more personalized employee experiences and improved retention rates.
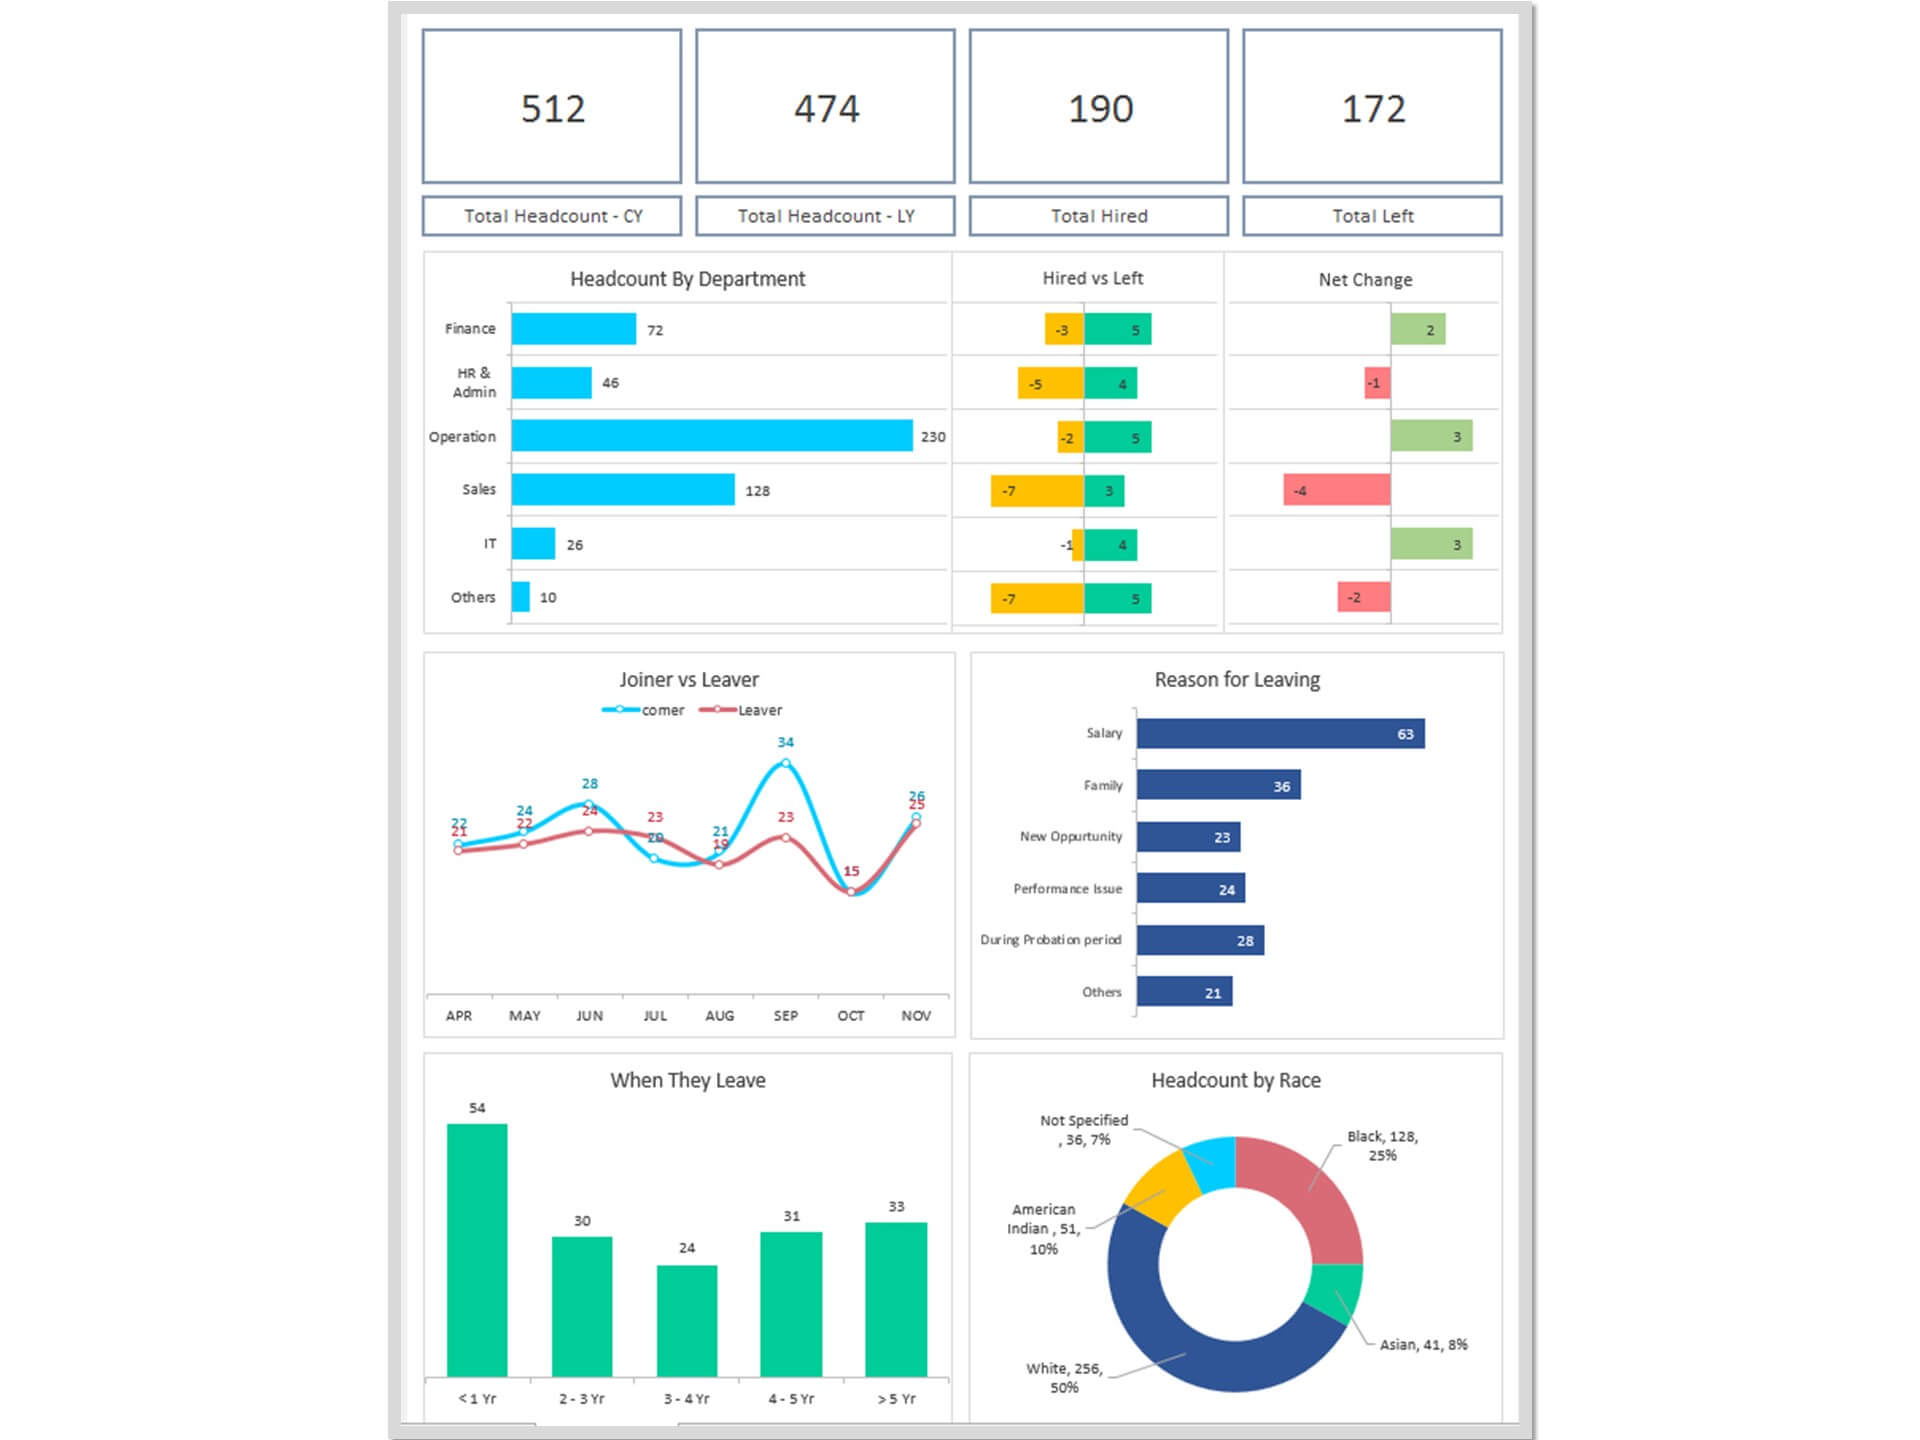
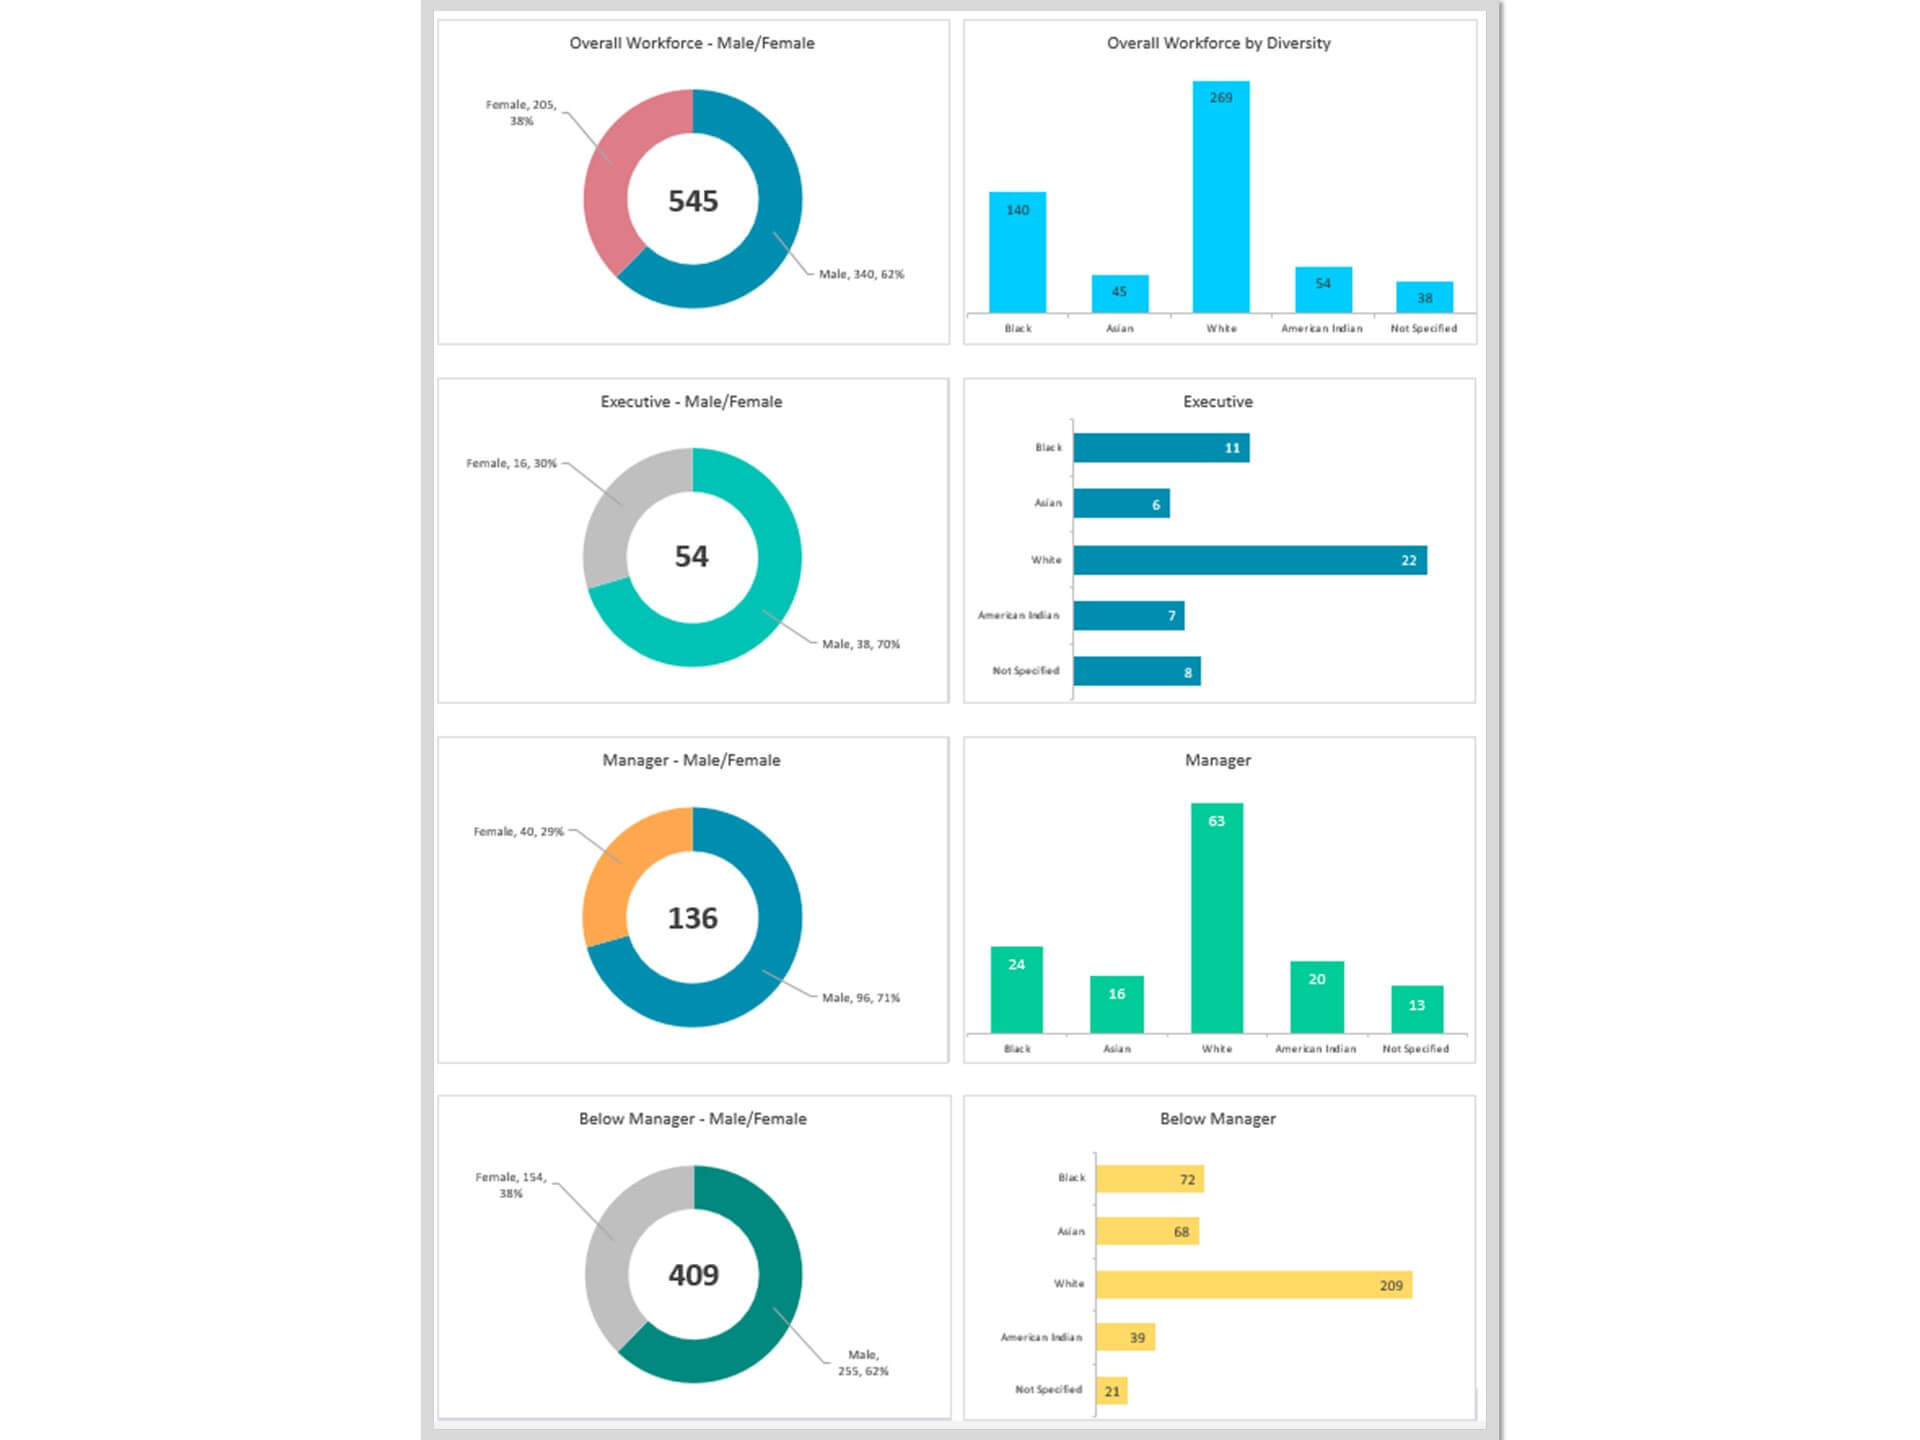
The Importance of Tracking Headcount Fluctuations
Monitoring headcount fluctuations is vital for understanding staffing levels, planning for future recruitment needs, and assessing the effectiveness of retention strategies. Regular analysis of headcount data helps HR departments adjust their strategies in real-time, ensuring the organization can efficiently manage workforce changes without impacting operational capacity.
Crafting an Employee Turnover Dashboard Using Excel
Selecting the Right Excel Template for Turnover Analysis
Choosing the appropriate Excel template is the first step in creating an effective turnover dashboard. The right template will offer customizable features to track and analyze key turnover metrics, such as attrition rates, employee tenure, demographic details, and reasons of why people leave the company. Excel's versatility allows HR professionals to tailor their dashboard to the unique needs of their organization, making it a powerful tool for in-depth turnover analysis.
Building Interactive Dashboards with Excel for User Engagement
Creating interactive dashboards in Excel enhances user engagement by allowing HR professionals and stakeholders to explore data through filters, slicers, and drill-down capabilities. This interactivity facilitates a deeper understanding of turnover trends and patterns, enabling users to quickly identify areas of concern and opportunities for improvement.
HR Dashboard Examples of Excel-Based for Turnover
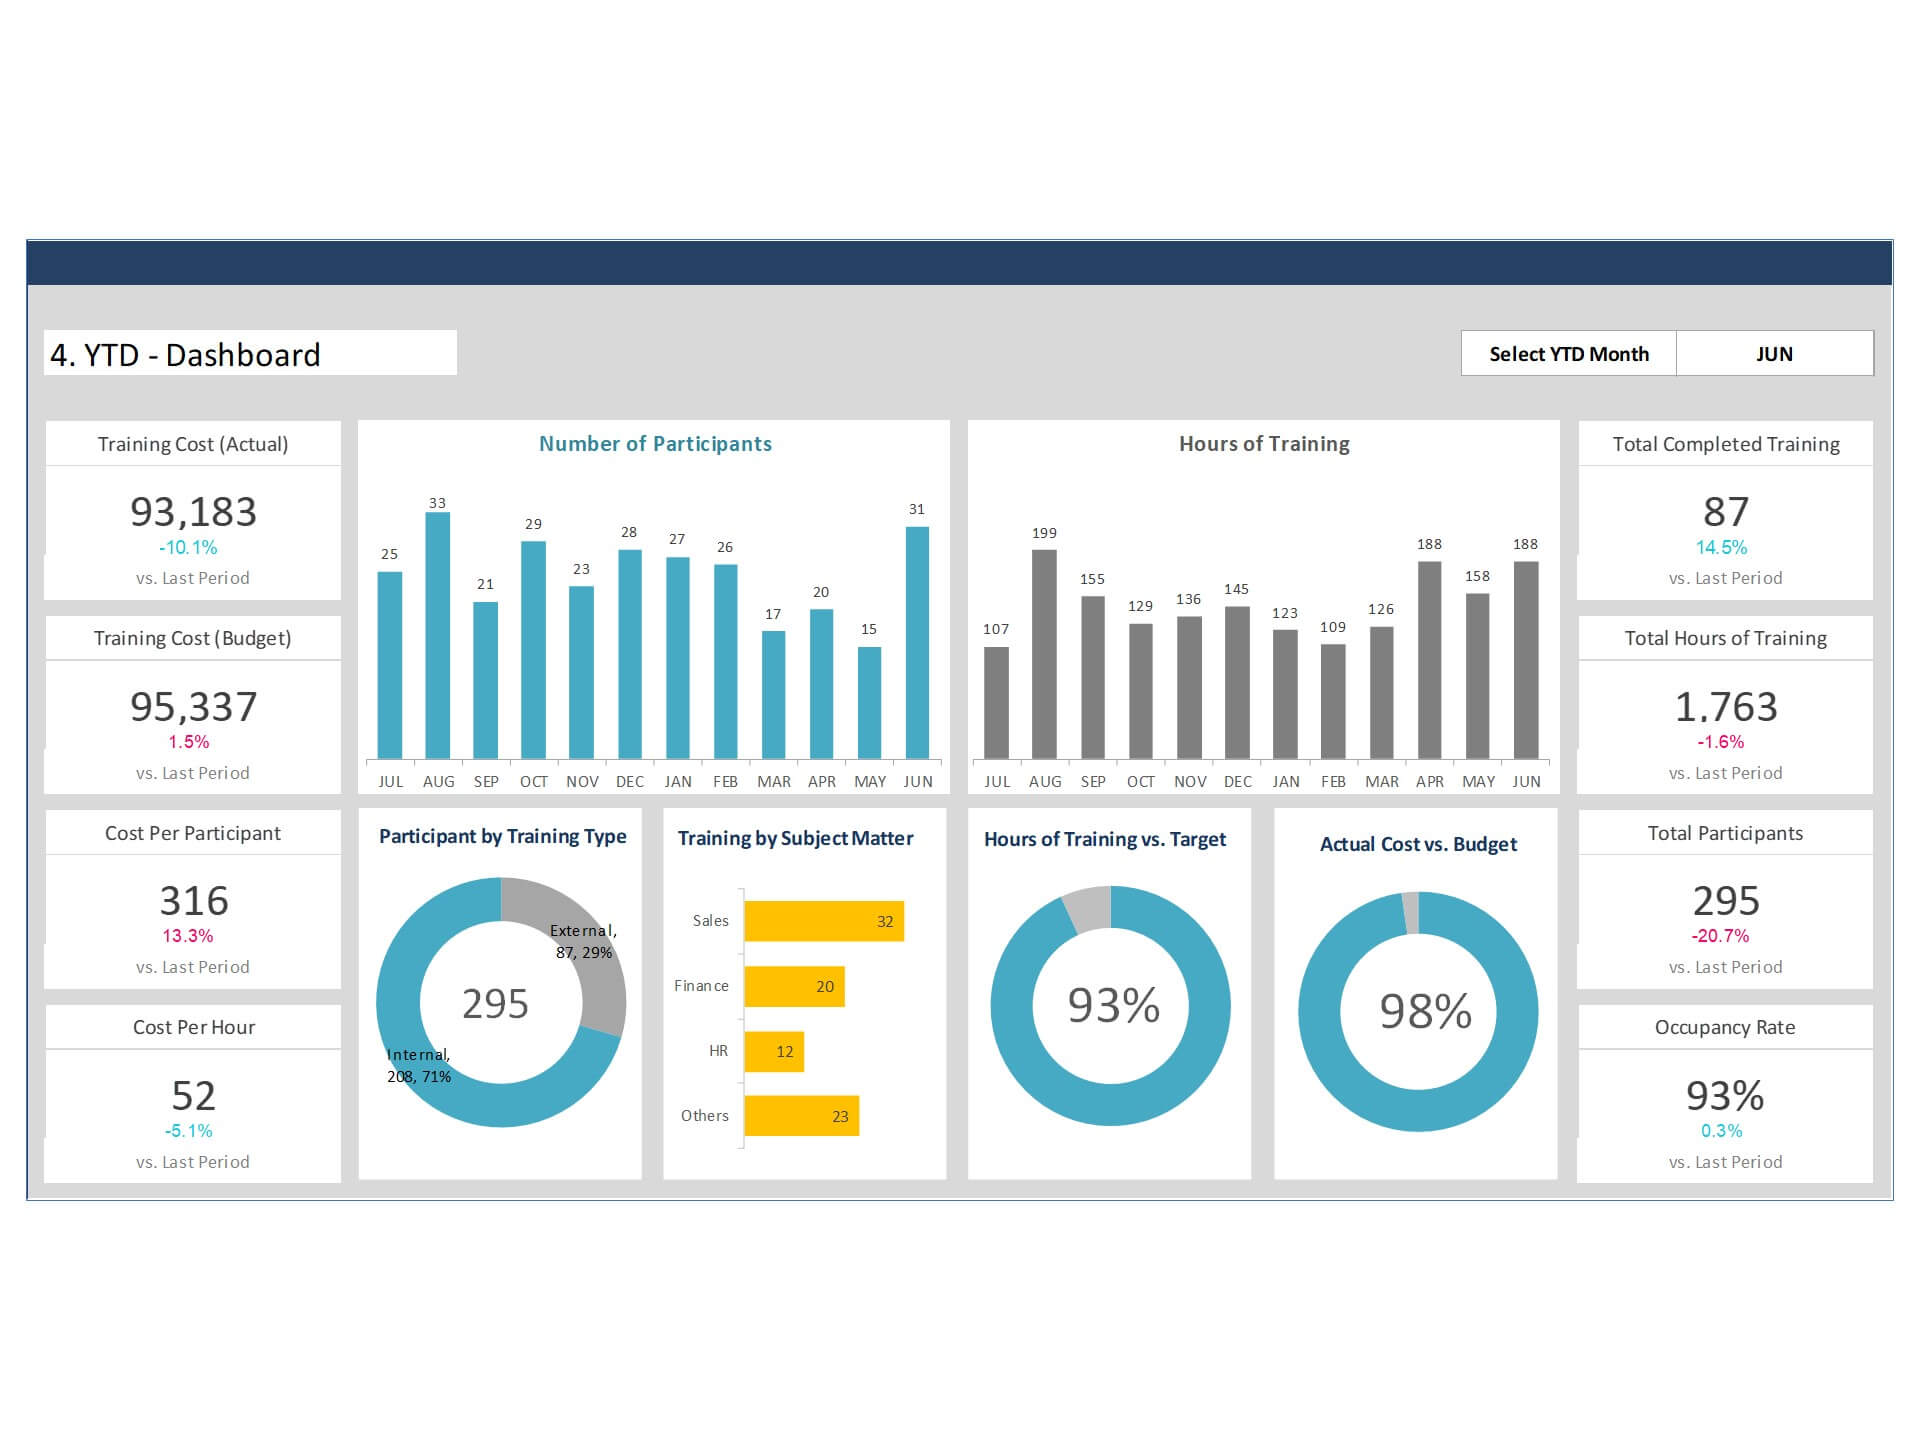
Excel Dashboard Demo: Visualizing Turnover Data
An Excel dashboard demo can effectively showcase how to visualize turnover data, providing a practical example of how to structure and present key metrics. This visual representation helps HR teams and stakeholders quickly grasp the significance of turnover trends, making it easier to discuss and address underlying issues.
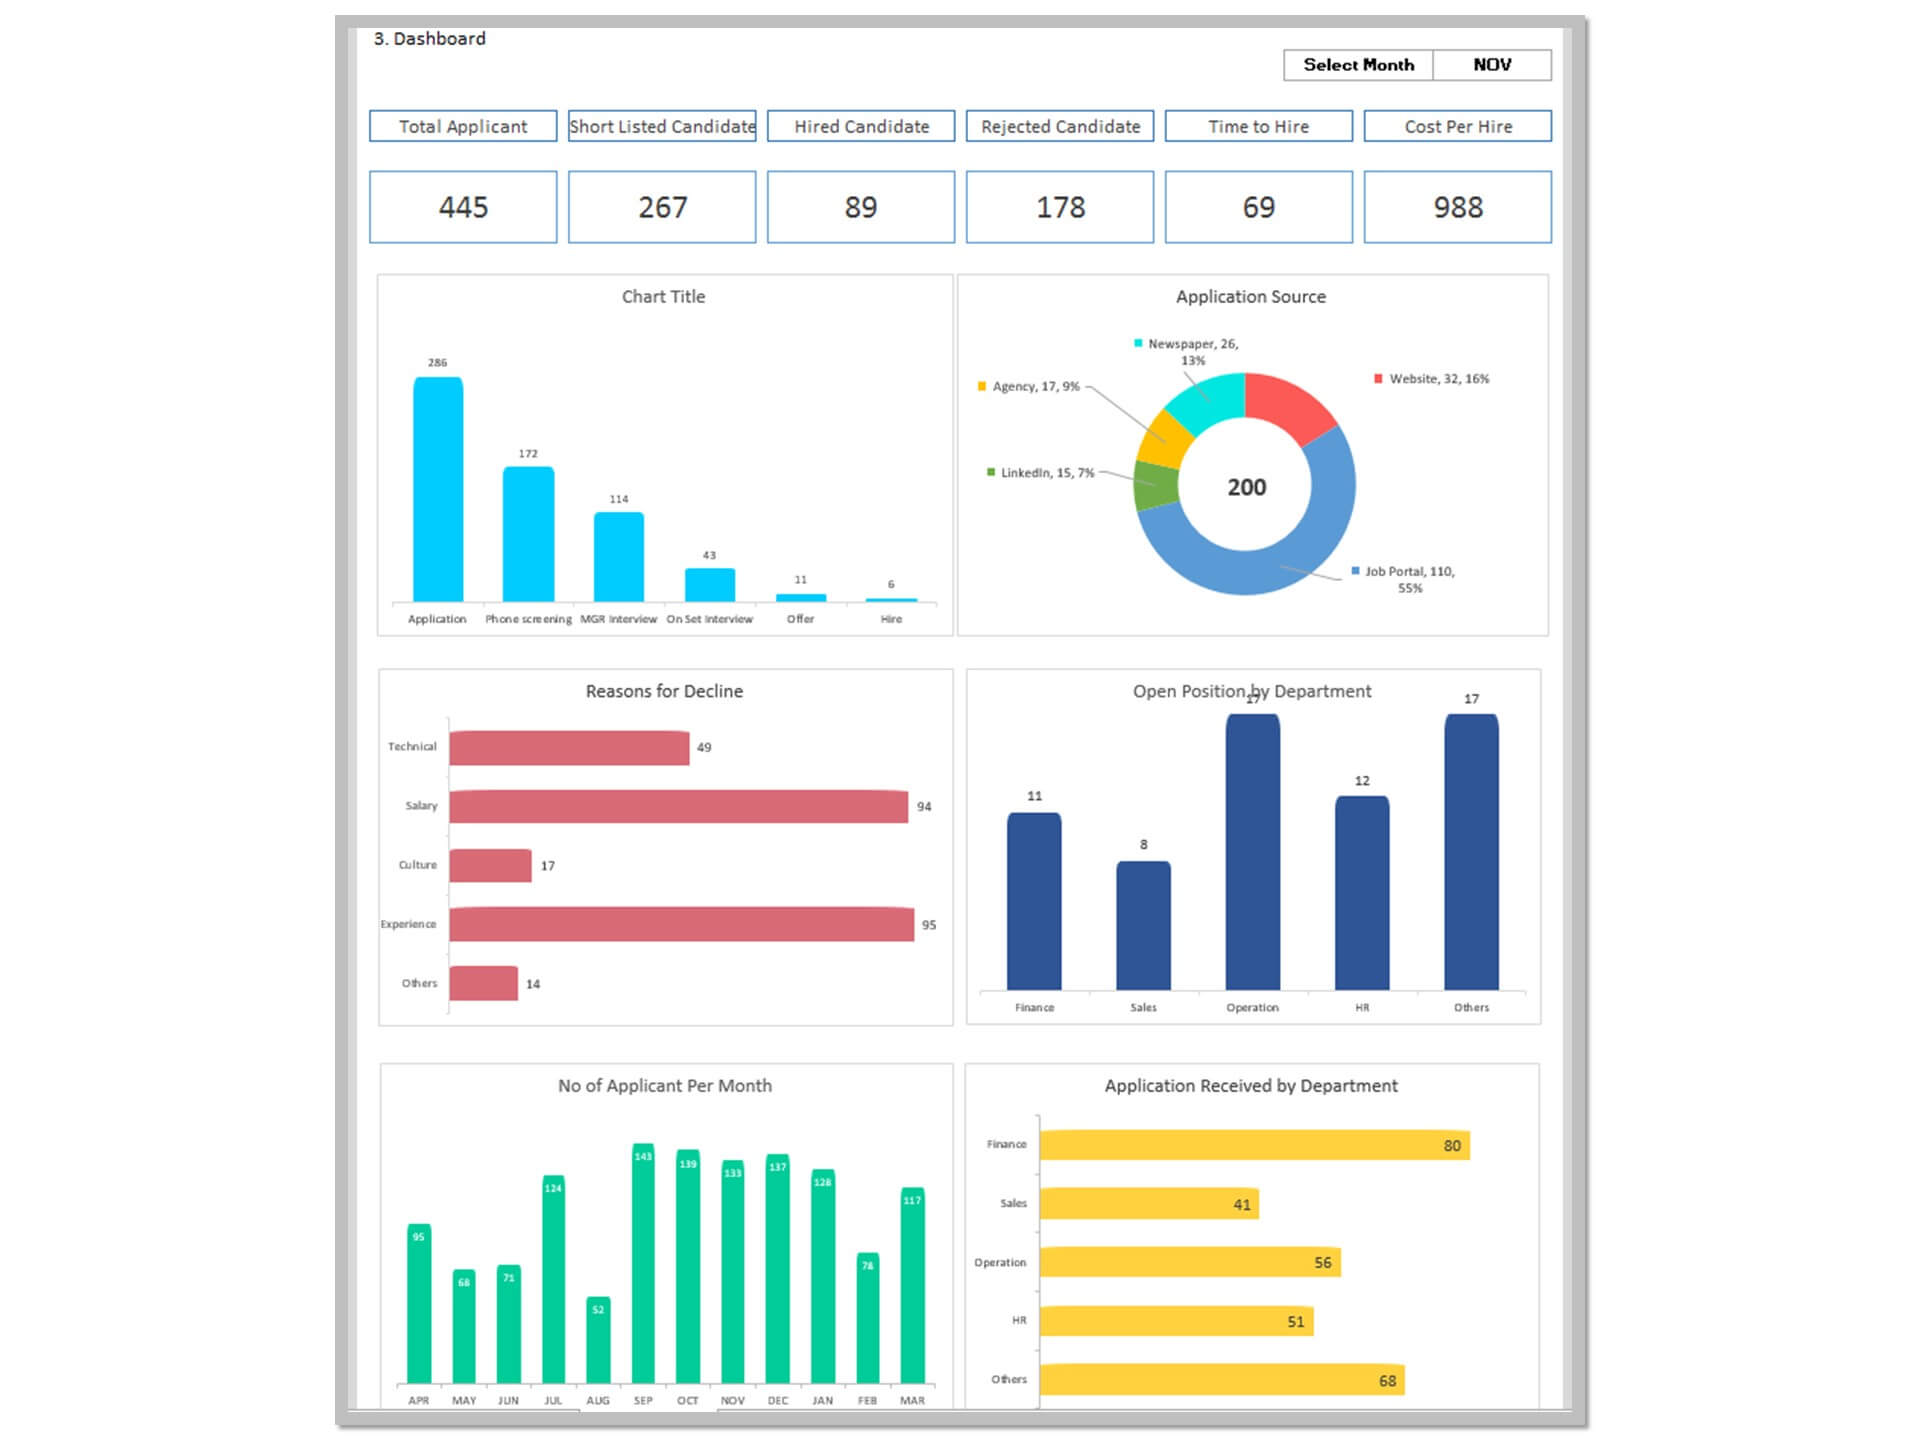
An Excel Attrition Dashboard in Action
A detailed case study of an Excel-based attrition dashboard in action can illustrate the dashboard's impact on real-world HR challenges. By examining the strategies implemented based on dashboard insights, organizations can learn how to better manage employee turnover, enhance retention efforts, and improve overall workforce satisfaction.
Leveraging Advanced Analytics with Excel for Turnover Insights
Applying Excel's BI Capabilities for In-Depth Workforce Analysis
Excel's Business Intelligence (BI) capabilities, such as Power Query and Power Pivot, enable HR professionals to perform in-depth human capital analysis. These tools can handle large datasets, automate data processing, and reveal complex insights into turnover patterns, helping organizations to develop more effective, data-driven HR strategies to recruit and manage the demographics.
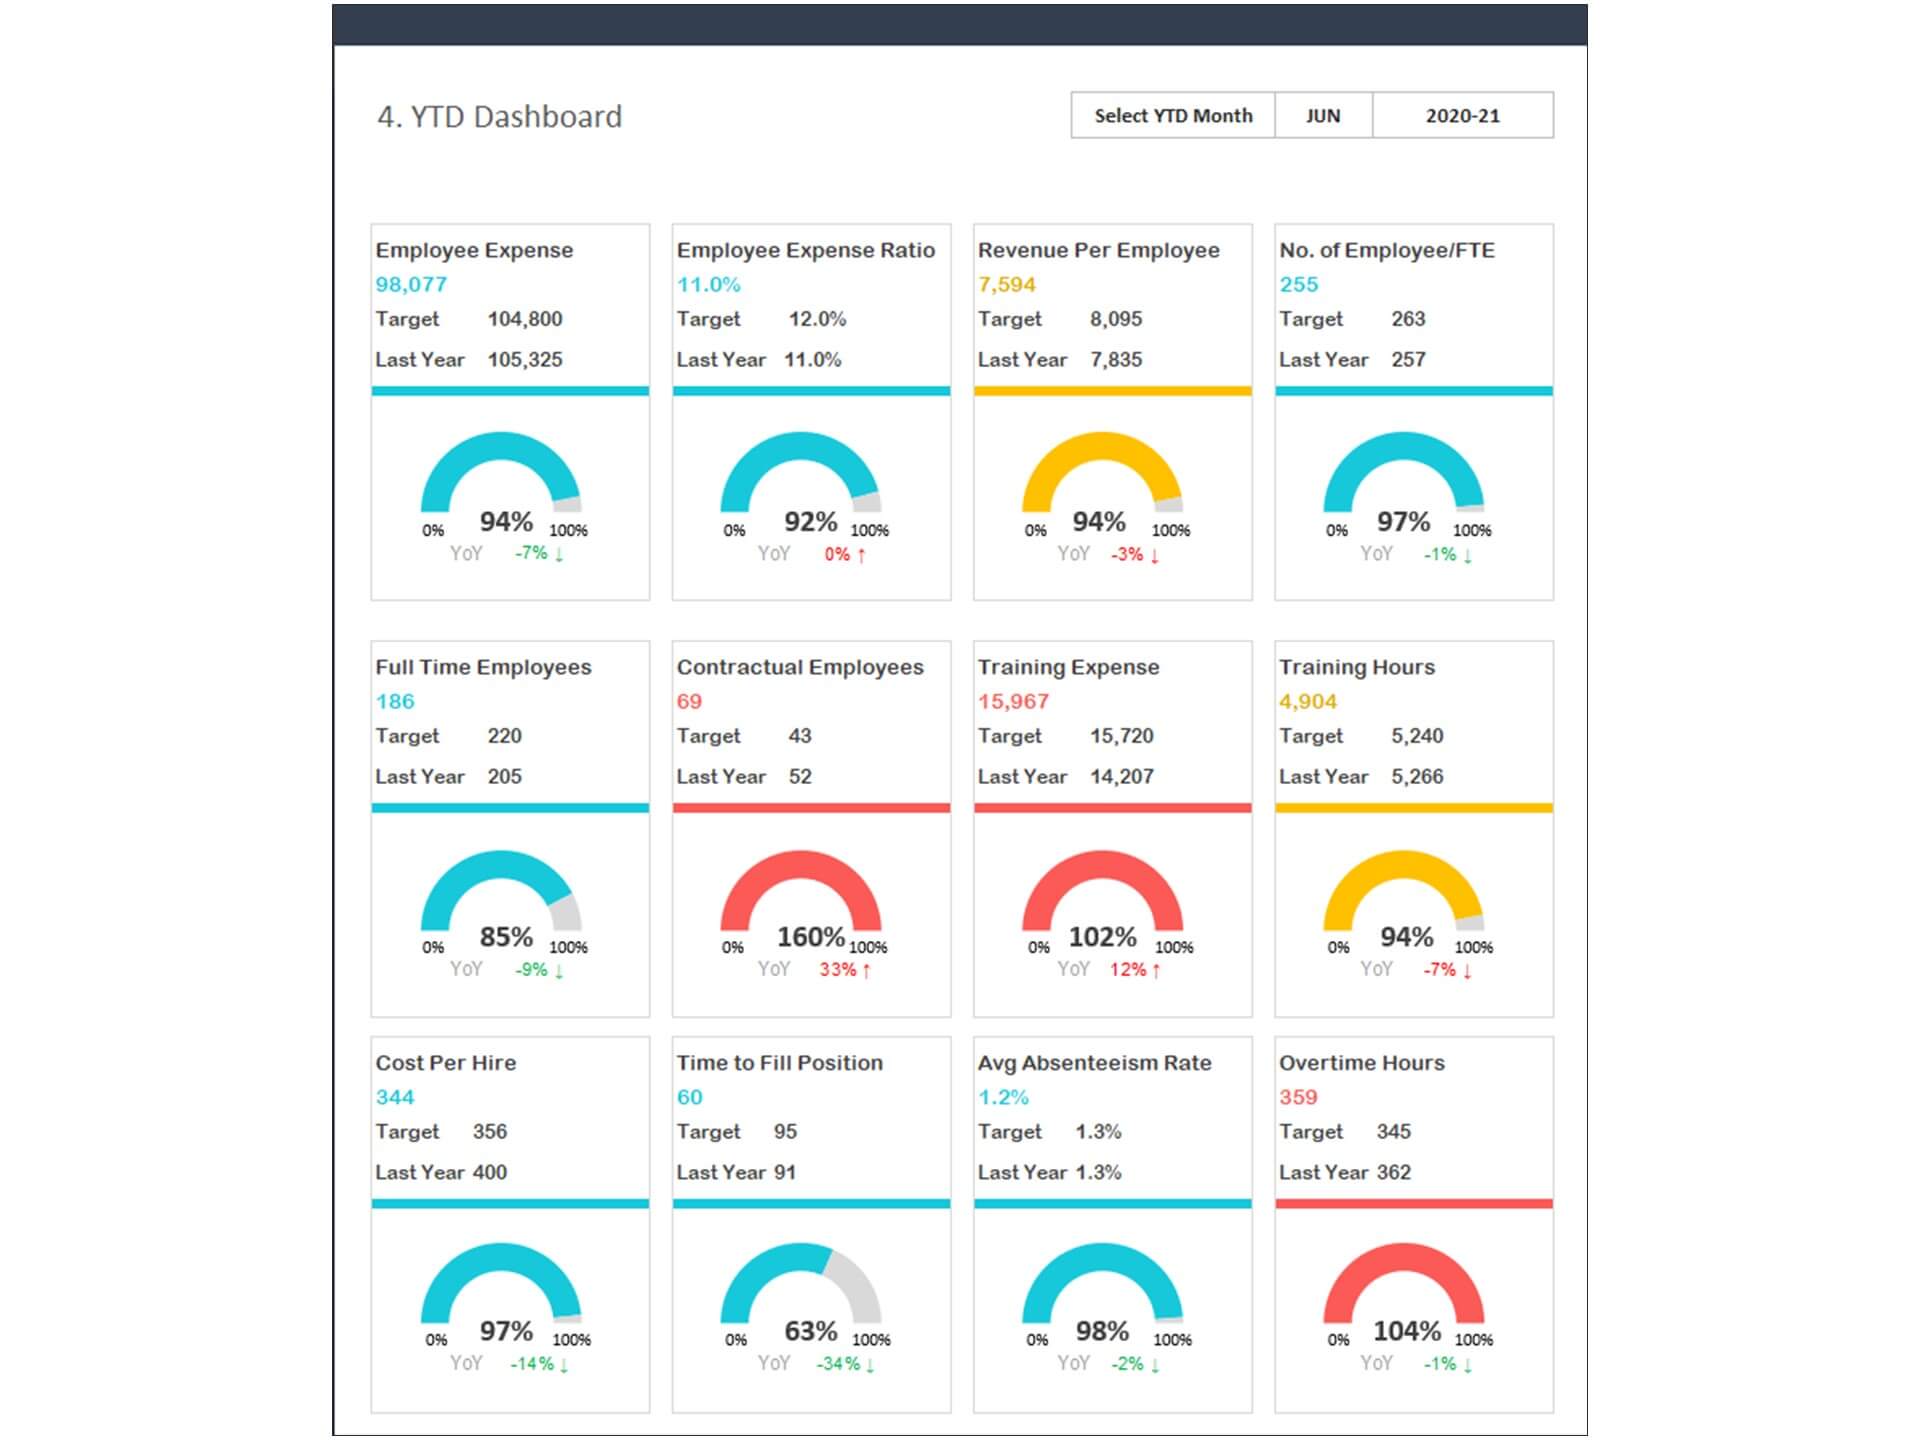
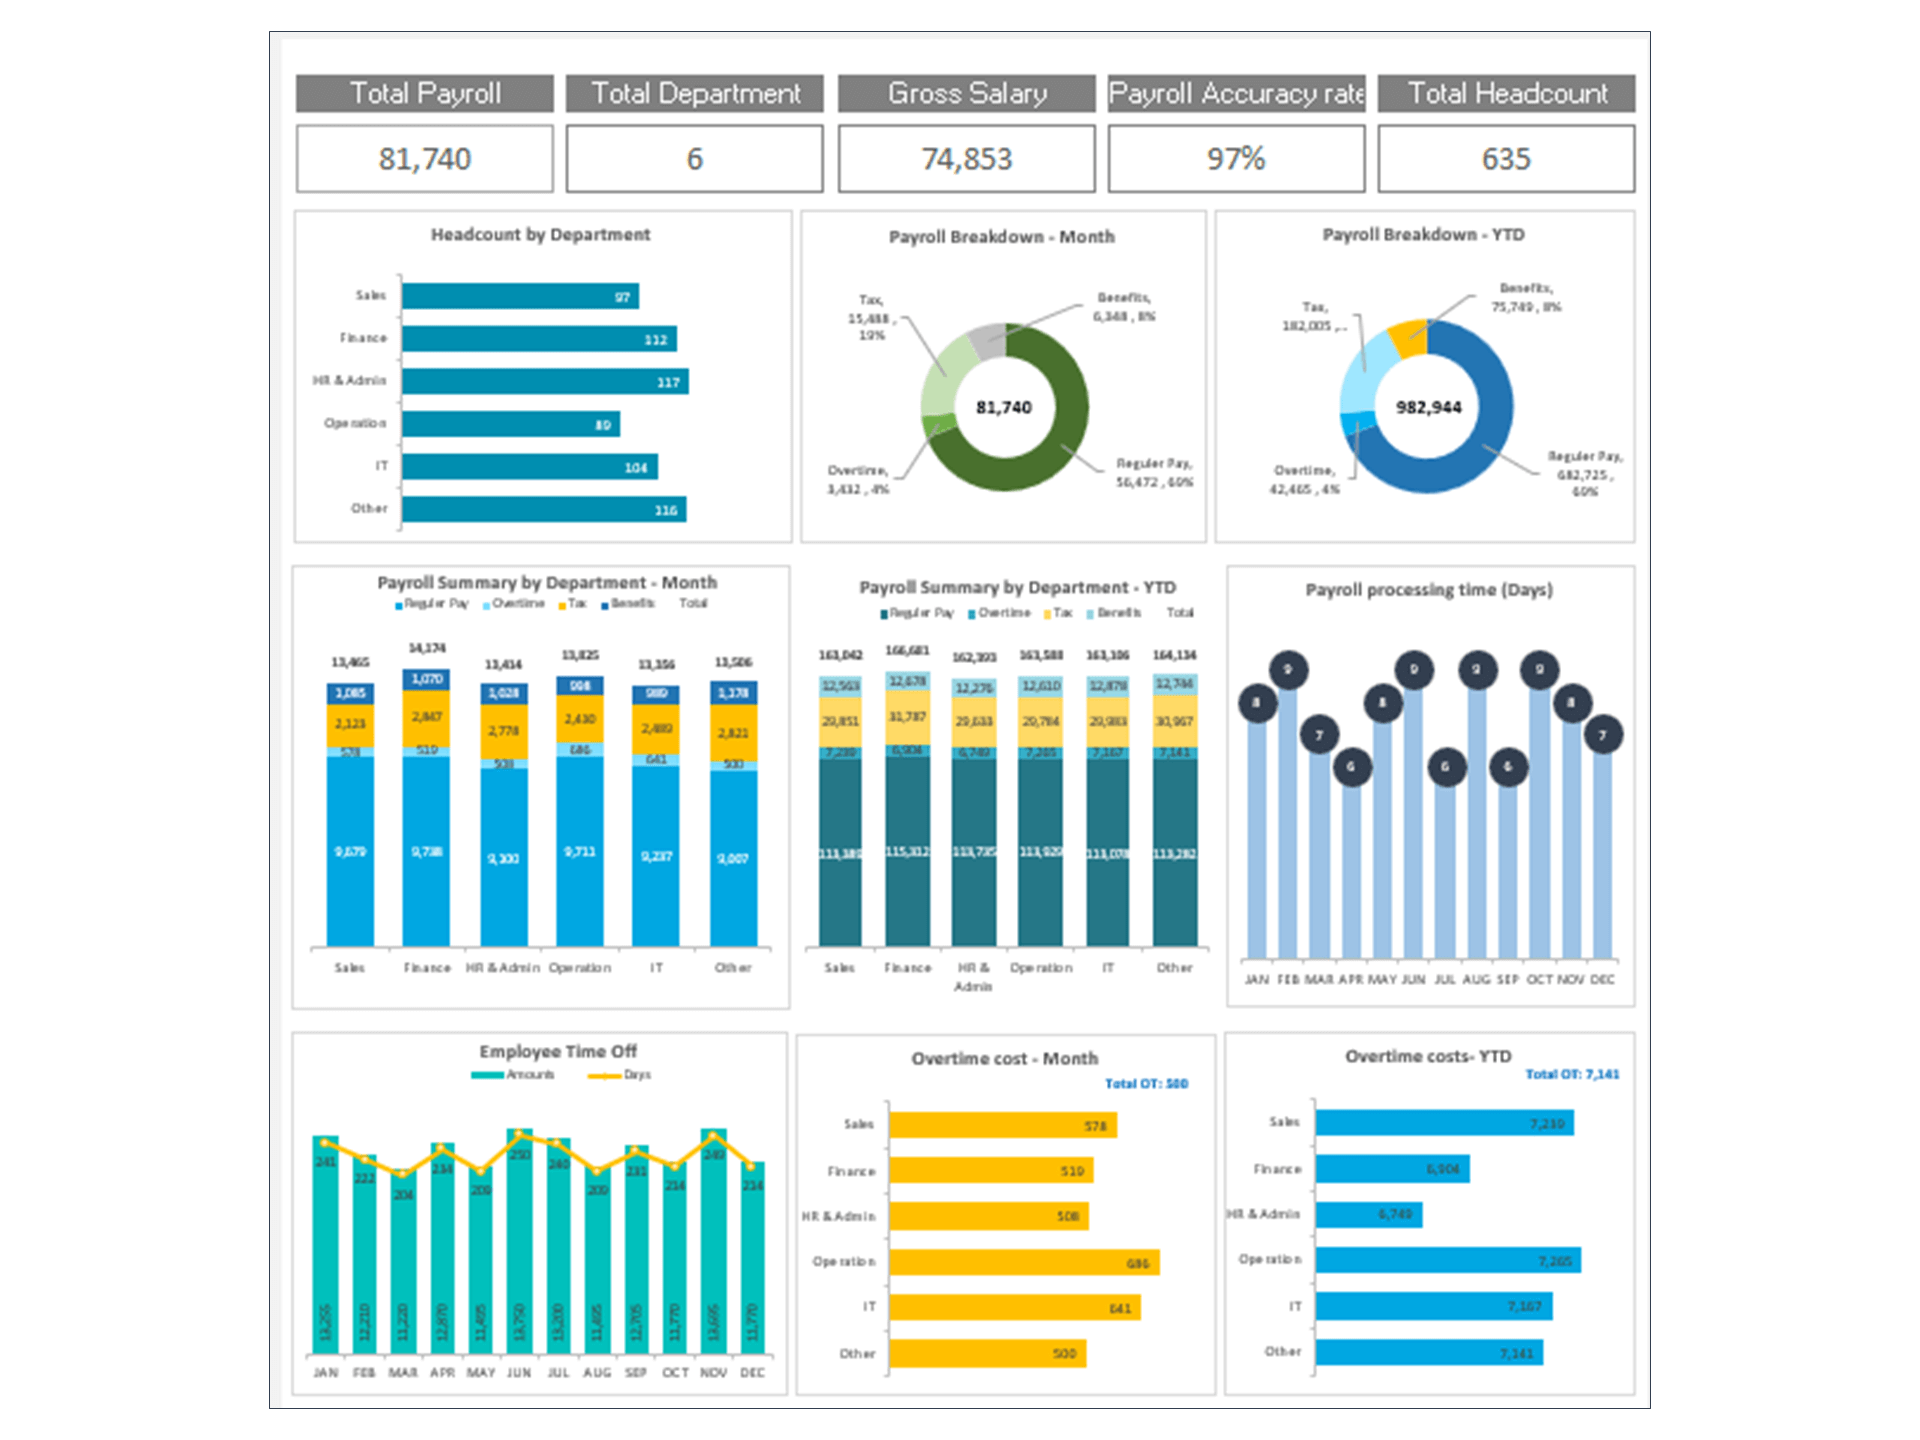
Key Performance Indicators (KPIs) for Monitoring Retention and Turnover
Identifying and monitoring the right KPIs is essential for any turnover dashboard. Excel allows HR teams to track a wide range of KPIs, including turnover rate, retention rate, average tenure, and cost of turnover. By focusing on these metrics, organizations can gain a comprehensive understanding of their turnover dynamics and the effectiveness of their retention strategies.
Optimizing Data Management for Excel HR Dashboards
Effective Practices for Store Data and Management in Excel
Effective data management practices are crucial for maintaining accurate and up-to-date HR dashboards in Excel. This includes establishing a structured data storage system, regularly updating the dashboard with new data, and ensuring data accuracy and consistency. By adhering to these practices, HR professionals can rely on their dashboards to provide reliable insights into turnover trends.
Utilizing Excel for Secure and Efficient Data Handling
Excel offers features for secure and efficient data handling, including password protection and data validation tools. These features help ensure that sensitive HR data is protected and that the integrity of the data used in turnover dashboards is maintained. This security and efficiency are essential for HR departments managing confidential employee information.
Deriving Actionable Strategies from Turnover Data in Excel
Formulating Retention Strategies Based on Excel Dashboard Analytics
Excel dashboard analytics provide a solid foundation for formulating effective retention strategies. By analyzing turnover data, HR teams can identify key drivers of attrition and develop targeted interventions to improve employee satisfaction, engagement, and loyalty. These strategies are crucial for reducing turnover rates and fostering a positive organizational culture.
Strategic Planning Using Insights from Employee Turnover Data
Insights gleaned from employee turnover data in Excel dashboards can inform strategic planning efforts, helping organizations to anticipate and prepare for future workforce needs. This proactive approach allows companies to align their HR strategies with overall business objectives, ensuring they have the right talent in place to achieve their goals.
Enhancing Excel HR Dashboards with Predictive Analytics
Forecasting Future Turnover Trends Using Excel
Excel's predictive analytics features enable HR professionals to forecast future turnover trends based on historical data. By applying predictive models, organizations can anticipate potential issues before they arise, allowing for more effective planning and intervention strategies to mitigate turnover risks.
Decision-Making Empowered by Excel's Predictive Analytics Features
The use of Excel's predictive analytics features in turnover dashboards empowers decision-making by providing forward-looking insights into workforce dynamics. This predictive capability helps organizations to make informed decisions about recruitment, retention, and talent management, ensuring they remain competitive and resilient in the face of changing workforce trends.
Navigating Common Questions About Excel Employee Turnover Dashboards
Starting Your Journey with Excel HR Metrics Dashboards
Embarking on the journey of creating an Excel HR dashboard for employee turnover begins with understanding the basics of Excel and dashboard design. This foundation allows HR professionals to effectively compile, analyze, and visualize turnover data, turning raw numbers into actionable insights.
Addressing Challenges in Developing Turnover Dashboards in Excel
Developing turnover dashboards in Excel can present challenges, such as managing large datasets, ensuring data accuracy, and creating visually appealing reports. By leveraging Excel's advanced features and adhering to best practices in dashboard design, HR professionals can overcome these challenges and build effective tools for monitoring and analyzing employee turnover.
Key Features of Our Dashboard Templates
- Monitor HR Termination indicators monthly
- Provide actionable insights
- Consolidate your HR termination metrics in one place
- Visualize overall termination situation
- Fully editable, easy-to-use, template with sample data
- Eye-catching design and customizable
- Change the sample data with your data
- Spreadsheets ready for printing without Biz Infograph logo
- Consolidate key business performance indicators in one dashboard
- No monthly fees
- Immediate download
- No VBA, no Macro
- No installation necessary
- Professionally designed
What is included in this dashboard template?
- Ready dashboard just plug your data and start using it. The dashboard will be ready instantly.
- A text file that contains a password to view and edit the formula
- A guide to unlocking all the elements in the dashboard
Professional Support:
- Video tutorial guide on how to navigate and use each Dashboard Template
- Professional service to customize dashboard template in excel as per business need
- Help and support in post-purchase
- Payment secured by Stripe and PayPal (no PayPal account needed)
A brief guide to using the dashboard template:
- Open the dashboard template
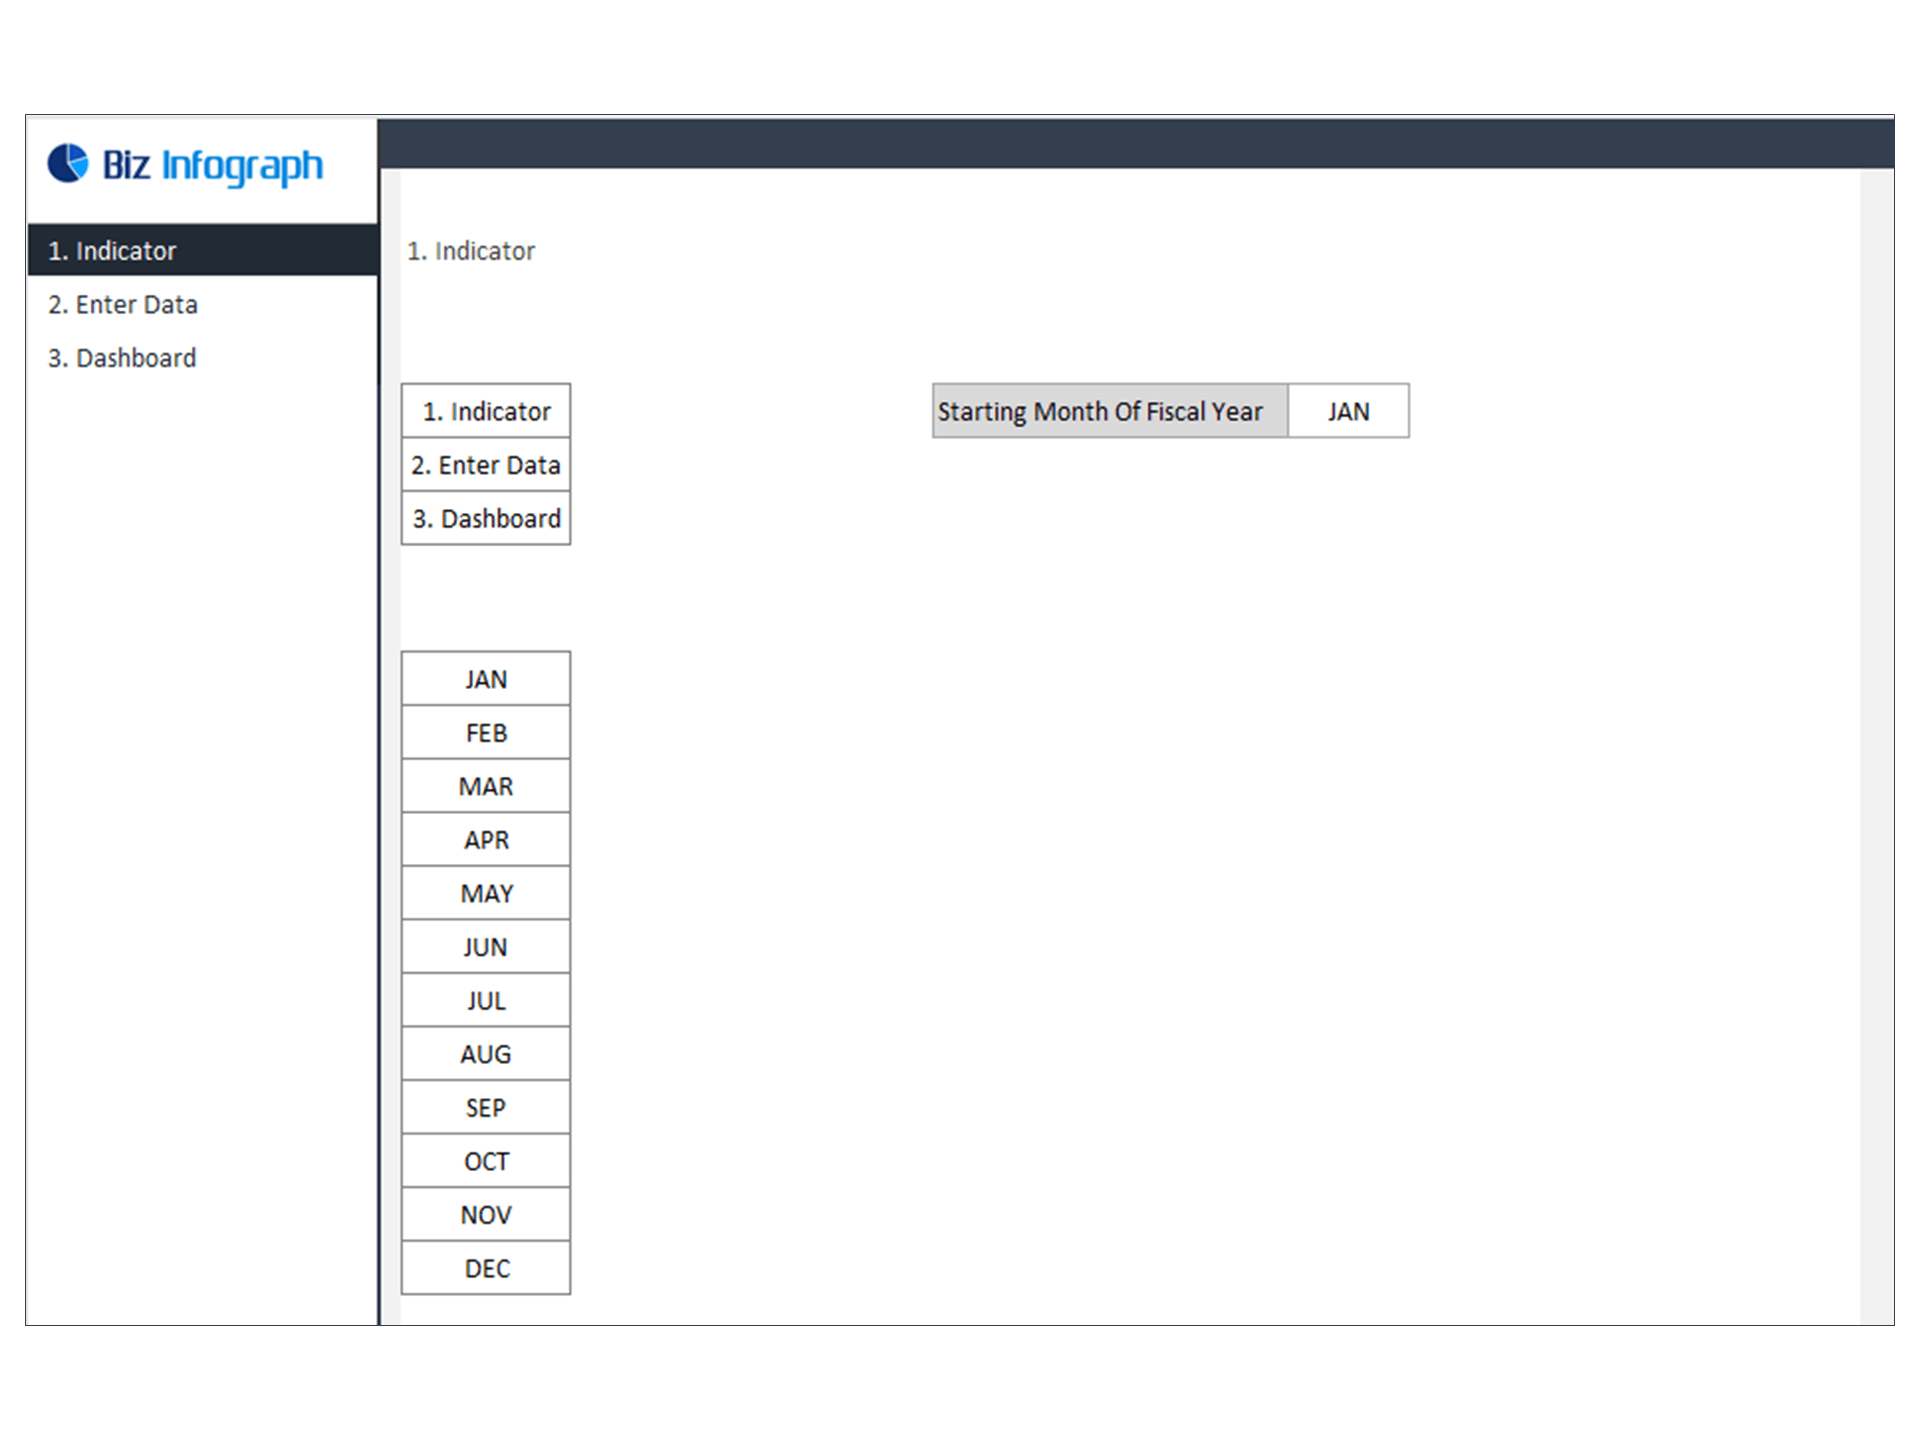
- Go to ‘Indicators’ menu – choose the start month of the fiscal year (i.e. Jan, Feb, Jul, etc.)
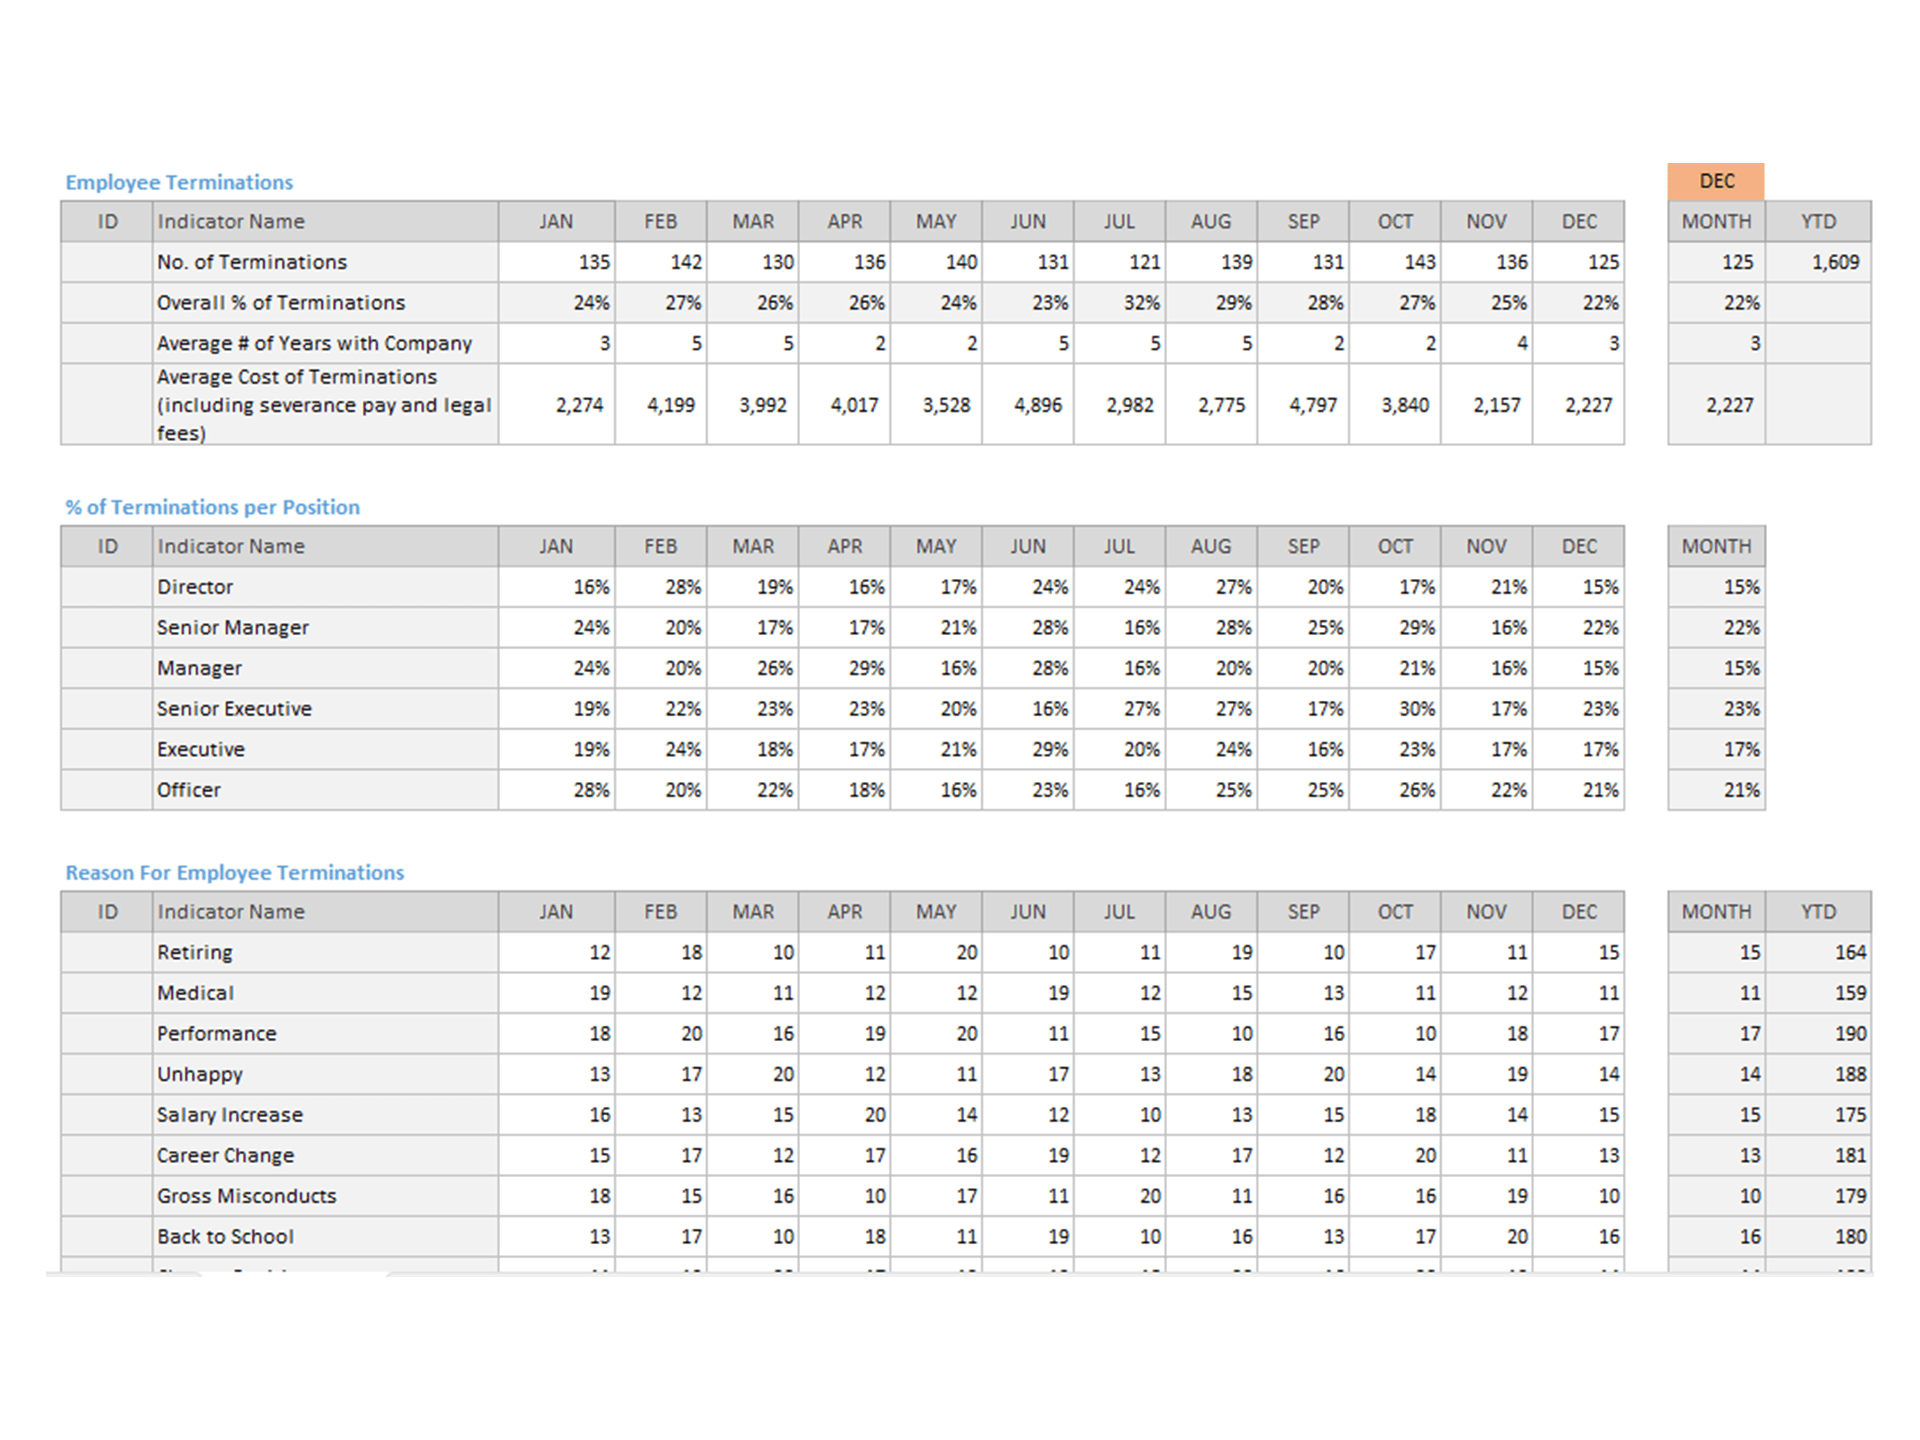
- Go to the ‘Enter Data’ menu – remove the sample data and give your actual data in the respective cells. Formula cells are locked, and you cannot edit it without a password.
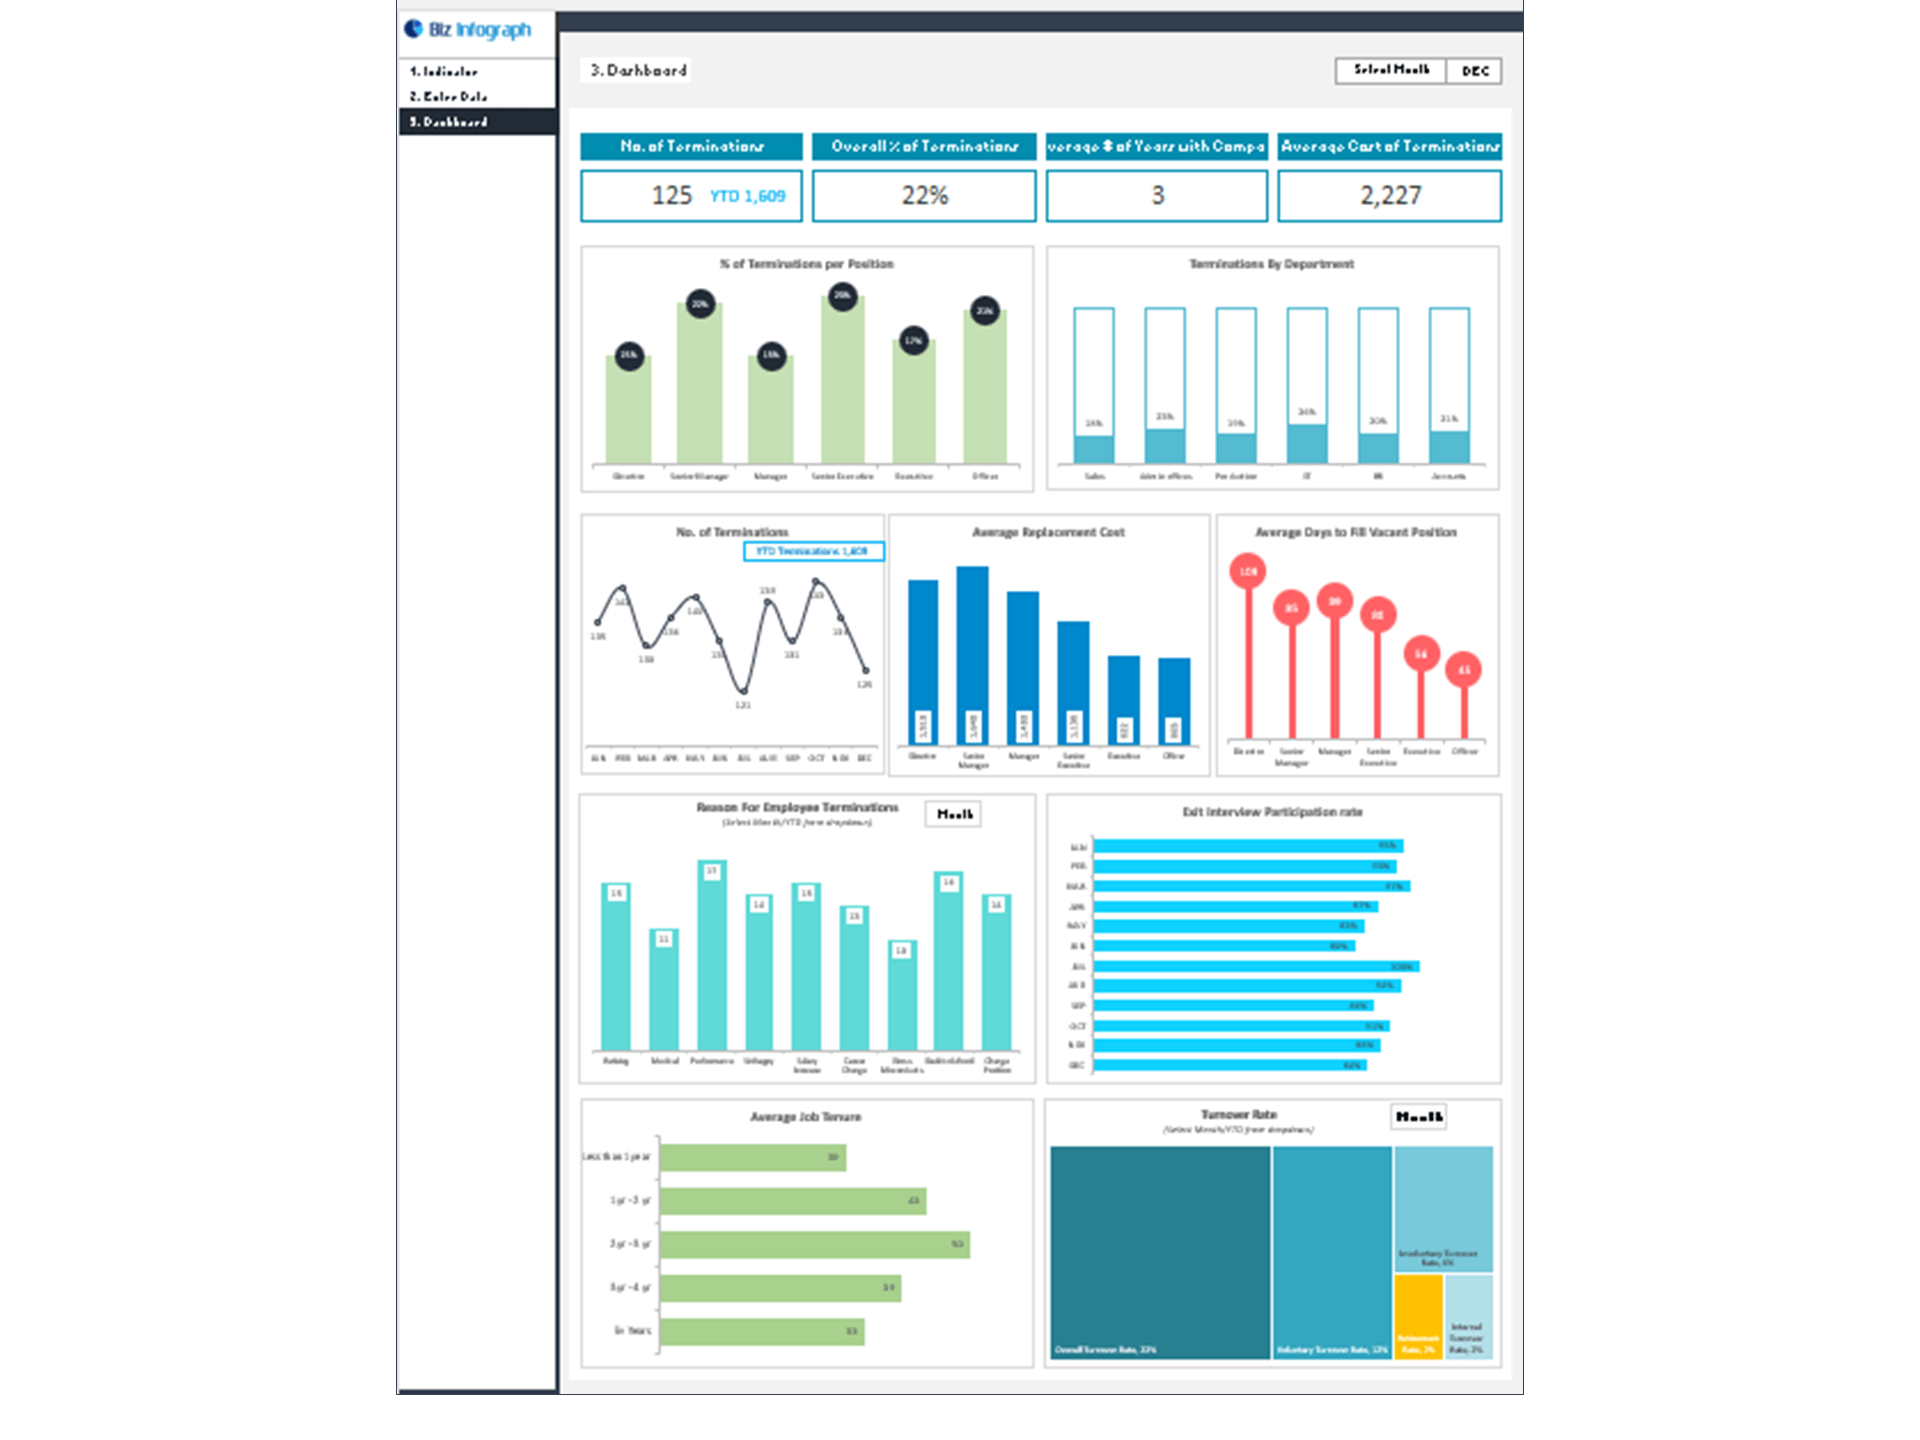
- Go to the ‘Dashboard’ menu – select the month name from the drop-down to see the monthly picture of performance indicators
- Each page is ready for printing – just press CTRL+P
This Excel dashboard template is password-protected to avoid mistakes, such as accidentally deleting formulas. When you completed the purchase, the password will be available.
For ready-to-use Dashboard Templates: