Retail Inventory & Supply Chain Dashboard — Excel Template
Stop stockouts, cut carrying costs, and speed up fulfillment—right inside Excel. This template turns raw inventory, PO, and fulfillment data into a live dashboard tracking Inventory Turnover, Days on Hand, Stock Availability, Shrinkage, On-Time POs, Supplier Delivery %, Lead Time, Fill Rate, Backorder Rate, and Order Cycle Time so you can balance service levels with working capital.
Why retailers use this template
-
End-to-end visibility: Monitor inventory health, supplier reliability, and order fulfillment from one place.
-
Fast ROI: Identify slow movers, lead-time bottlenecks, and shrinkage leaks to release cash.
-
Service you can trust: Improve Fill Rate and reduce Backorders while keeping Days of Inventory in check.
KPIs included (ready-made formulas)
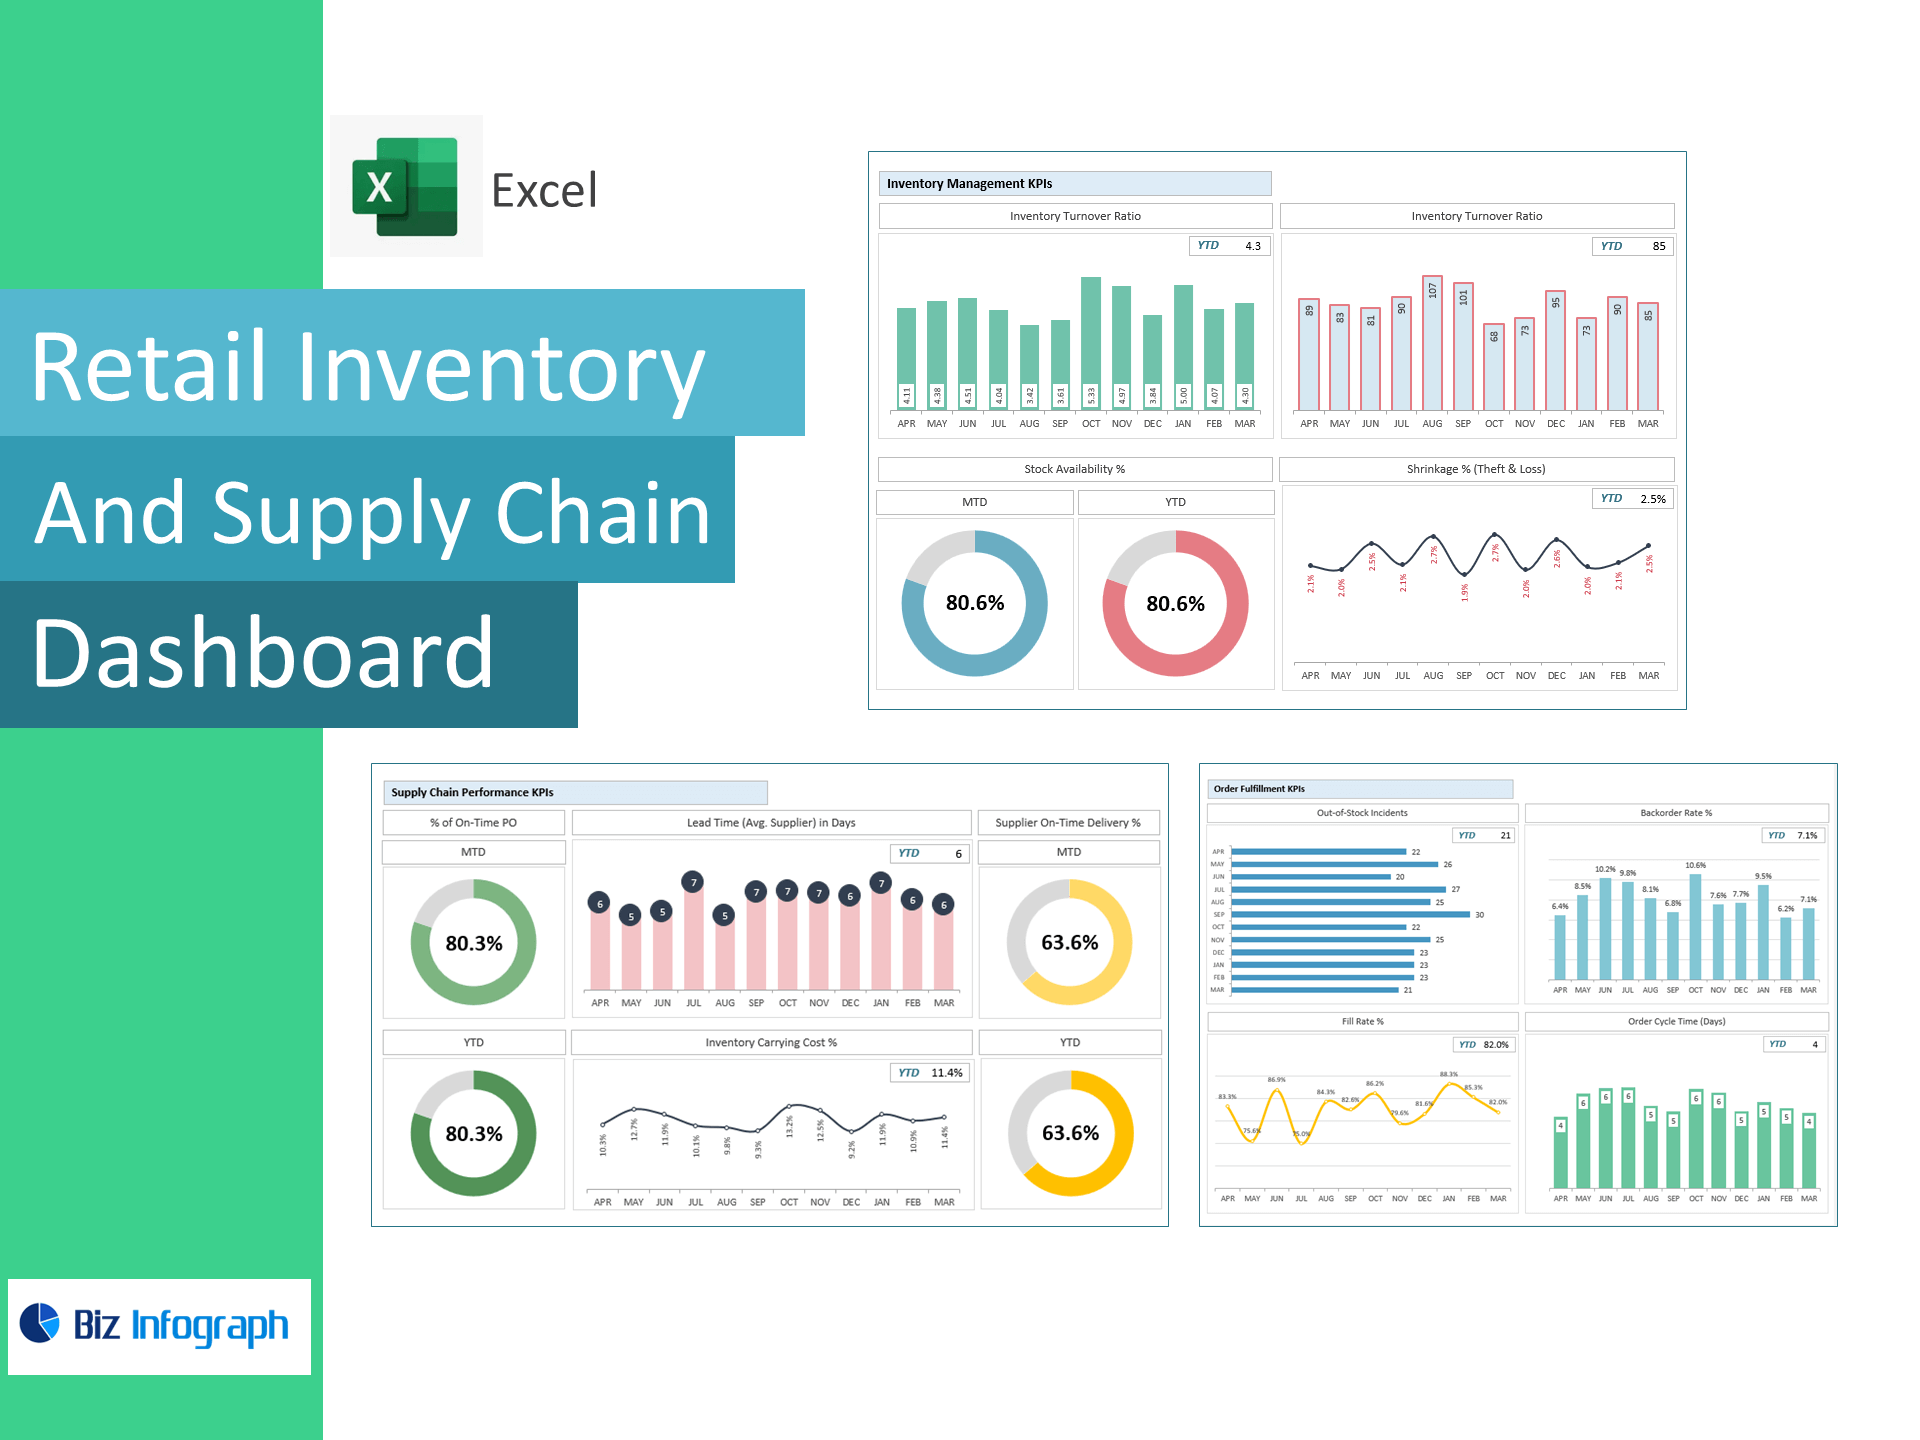
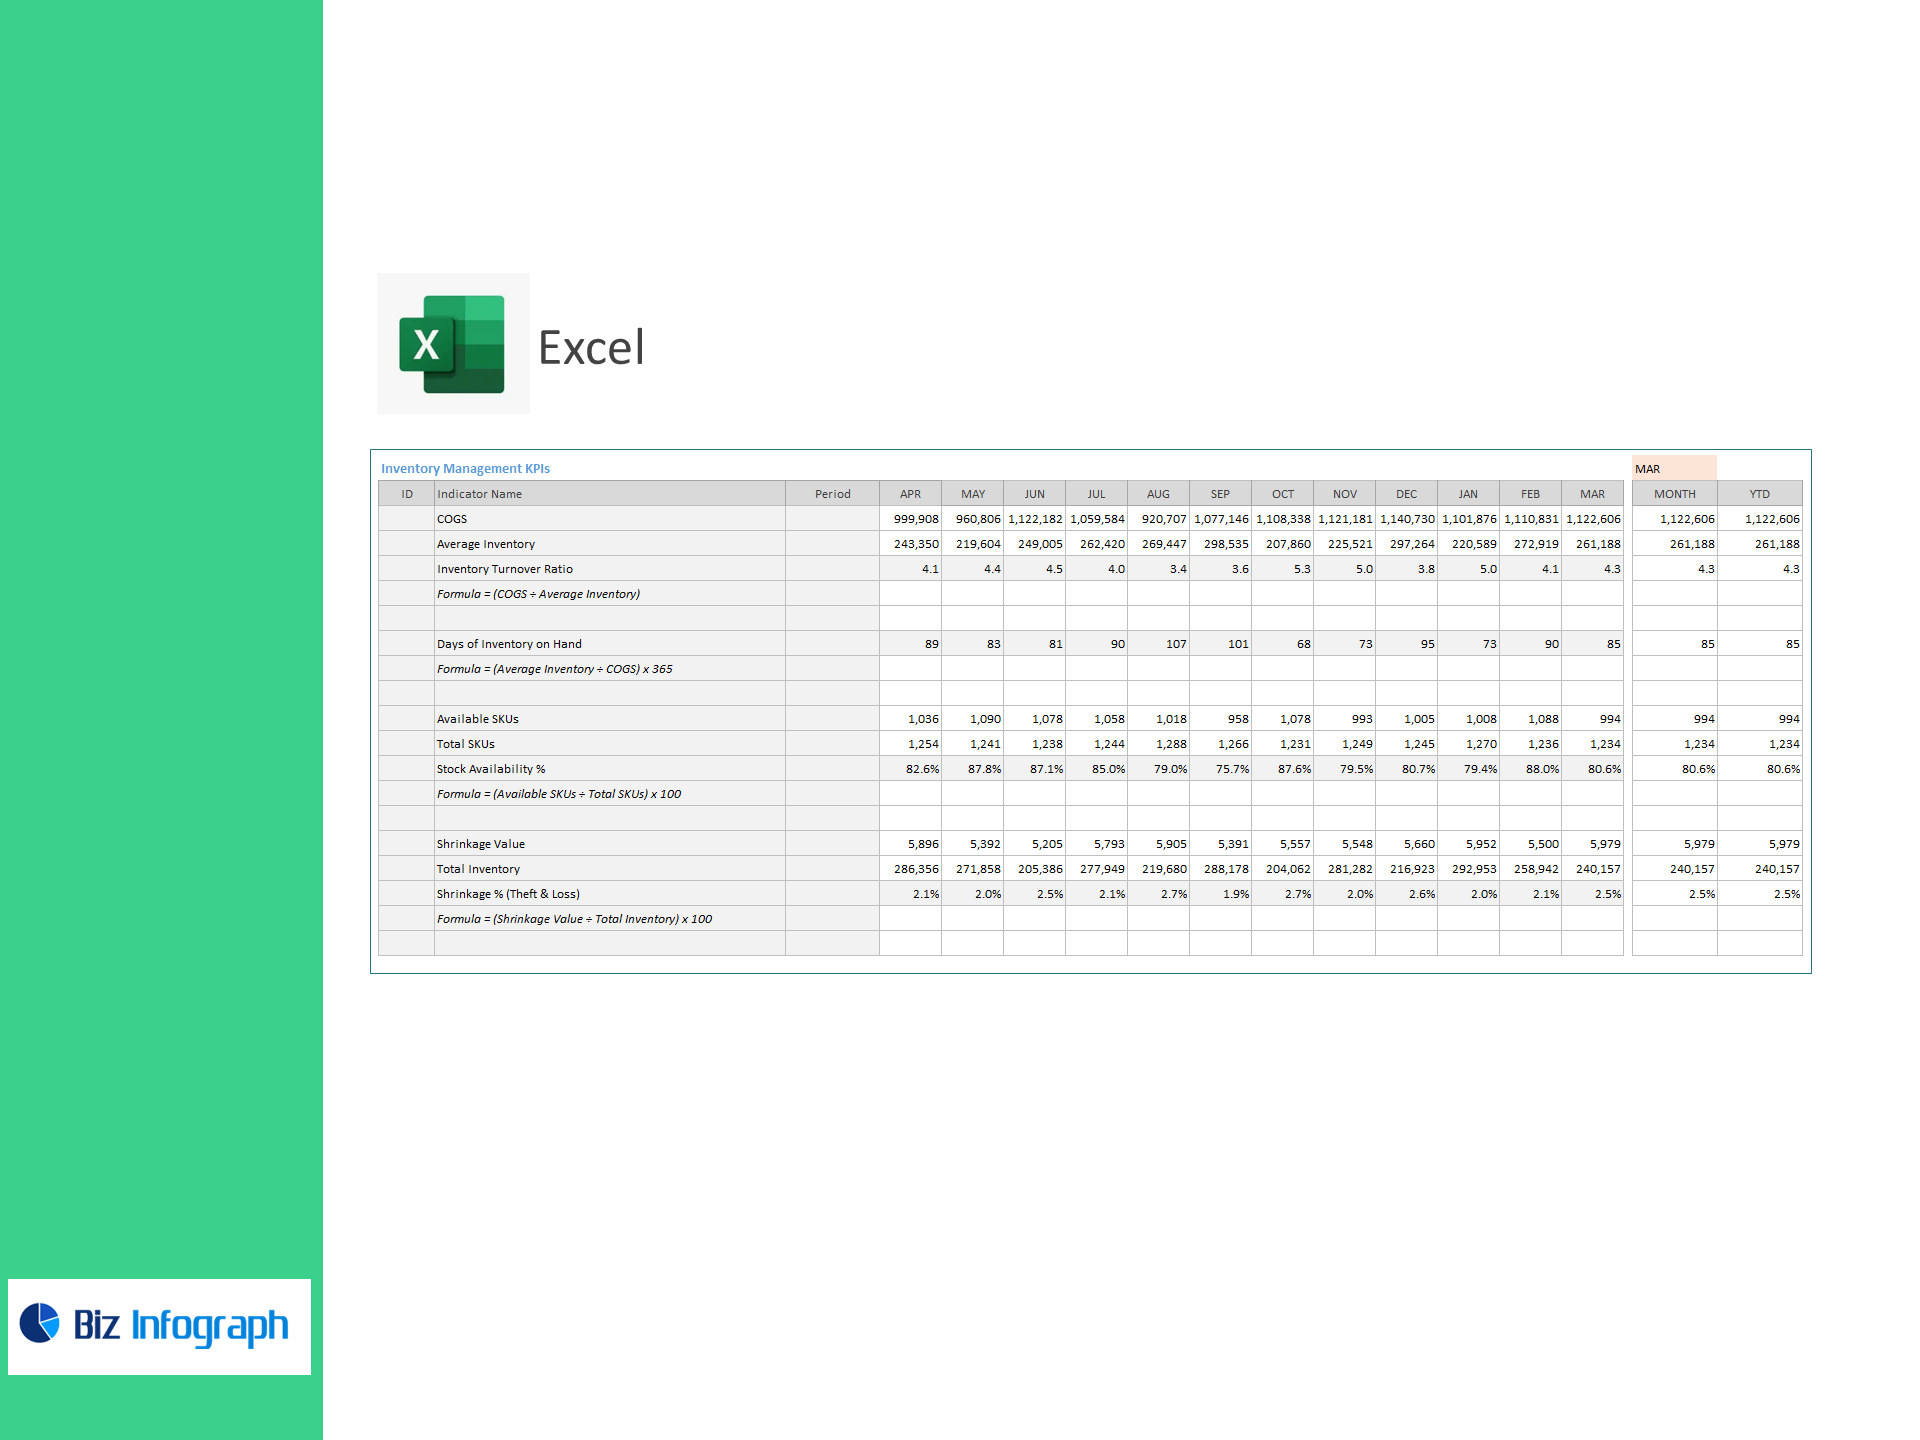
Inventory Management
-
COGS, Average Inventory
-
Inventory Turnover = COGS ÷ Average Inventory
-
Days of Inventory on Hand (DOH) = (Average Inventory ÷ COGS) × 365
-
Available SKUs, Total SKUs, Stock Availability % = (Available ÷ Total) × 100
-
Shrinkage Value, Total Inventory, Shrinkage % = (Shrinkage ÷ Total Inventory) × 100
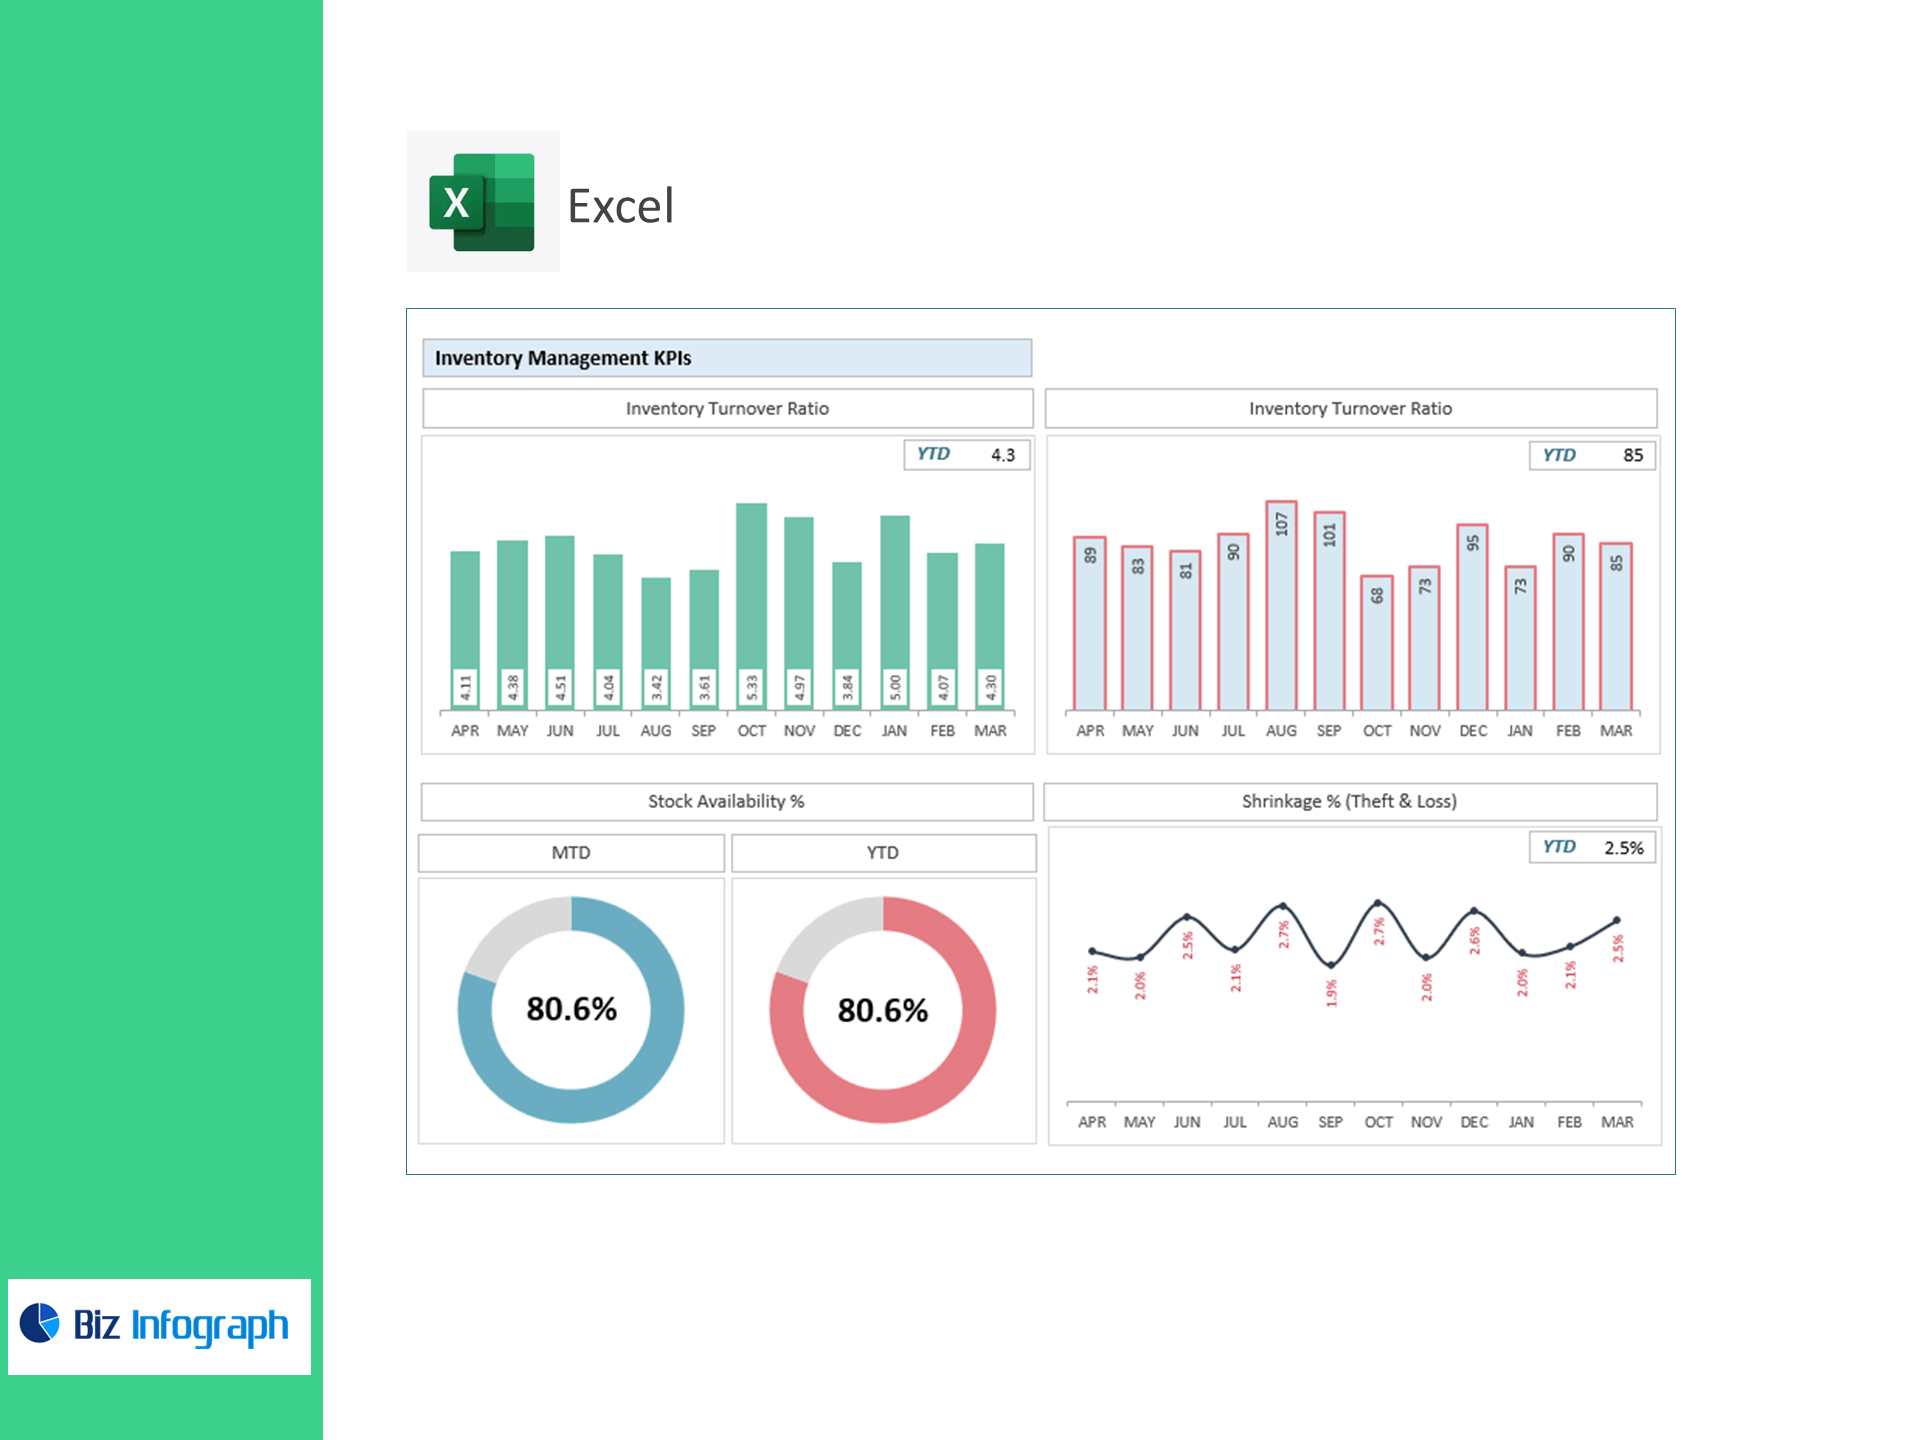
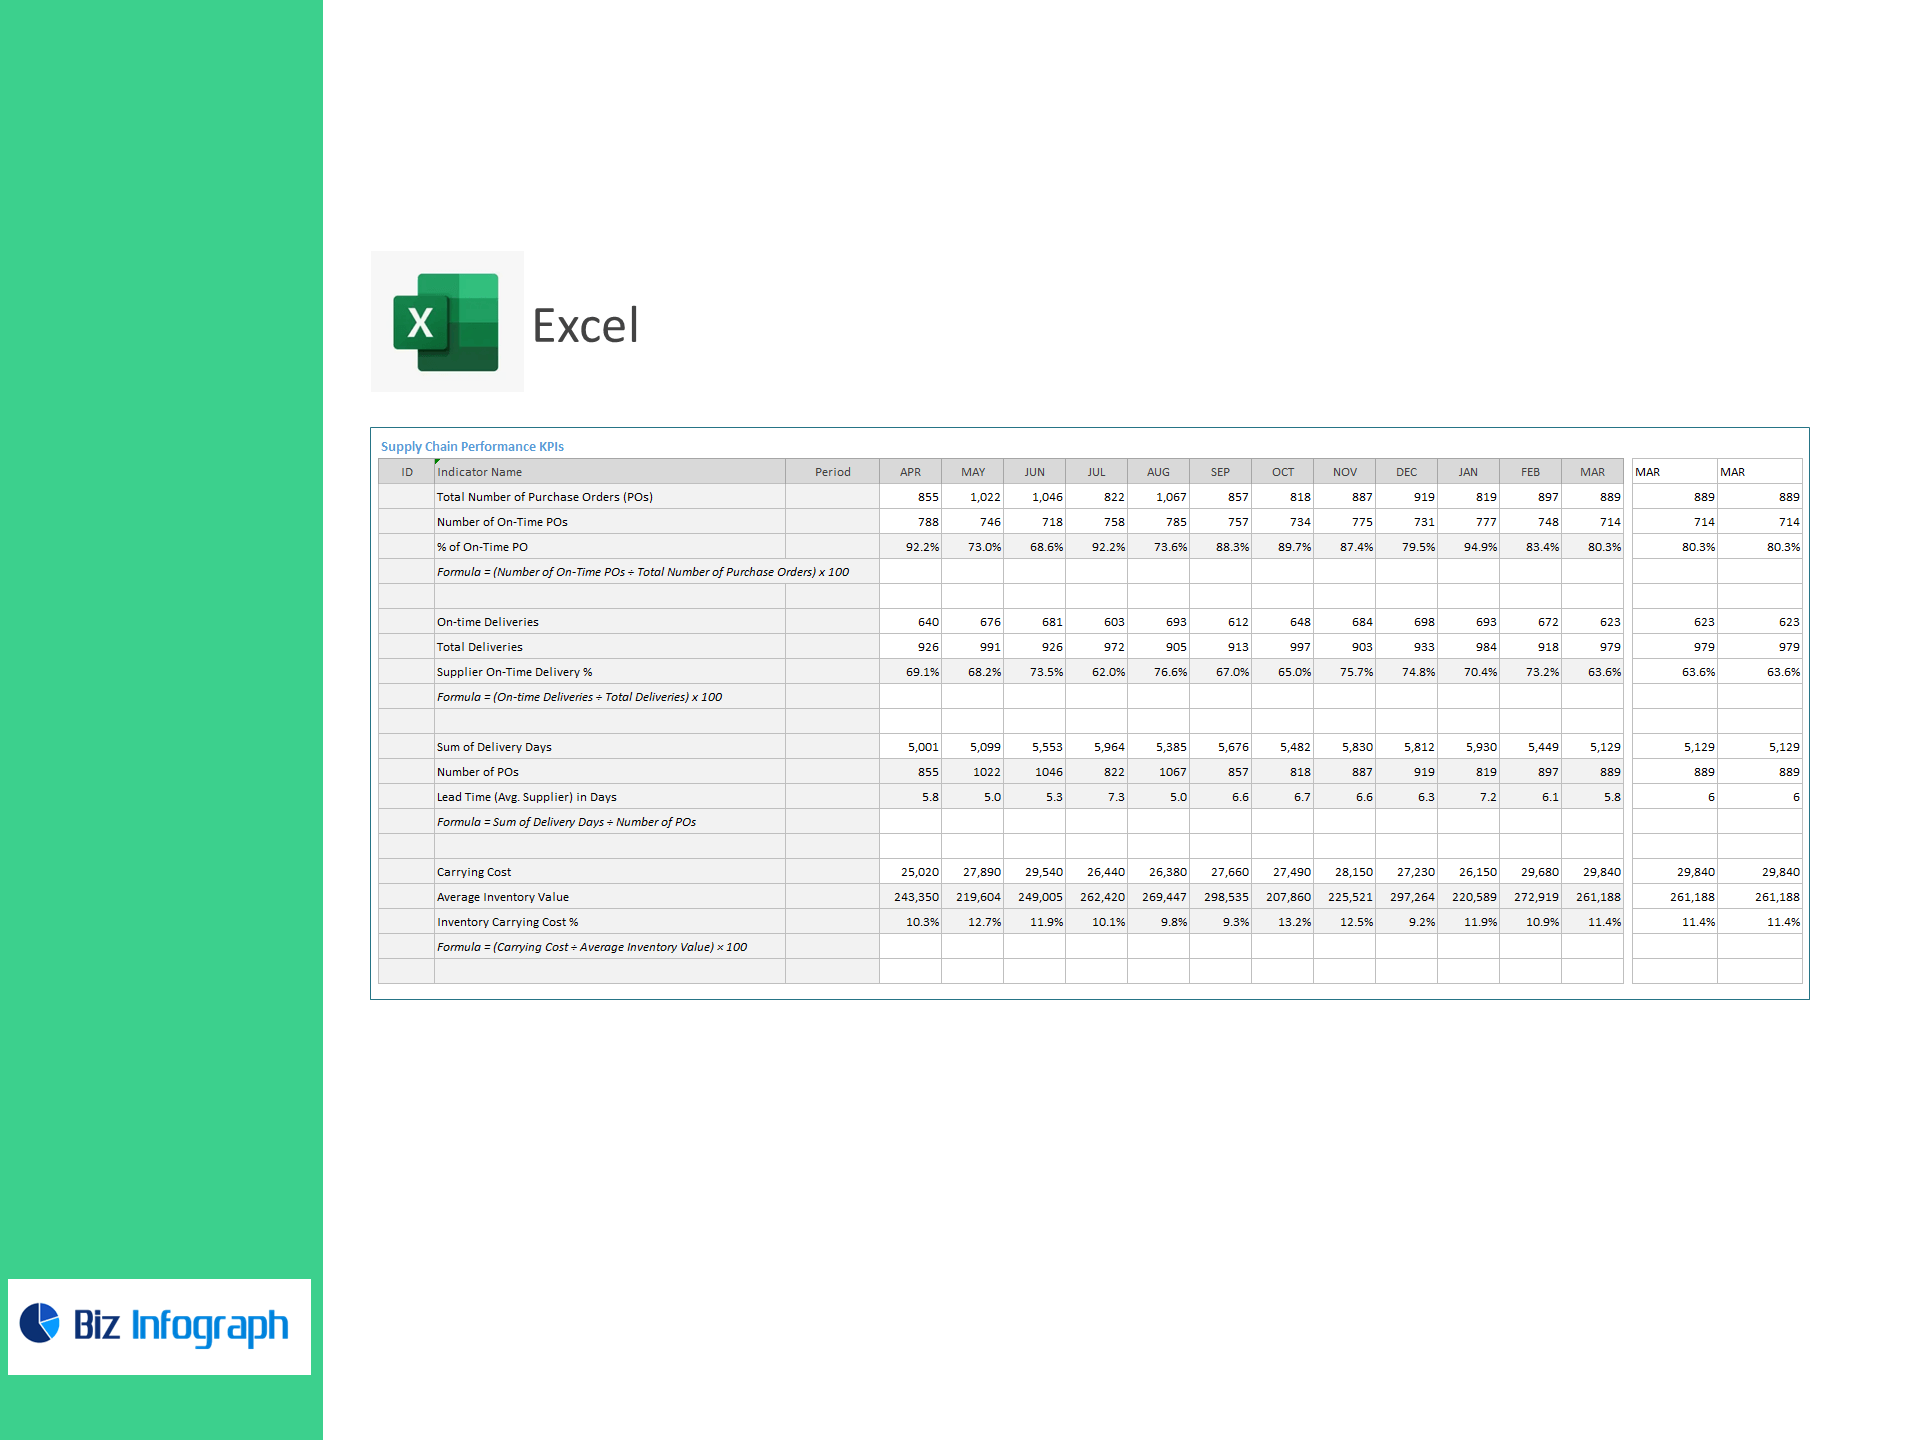
Supply Chain Performance
-
Total Purchase Orders (POs), On-Time POs, % On-Time PO = (On-Time ÷ Total POs) × 100
-
On-Time Deliveries, Total Deliveries, Supplier On-Time Delivery % = (On-Time ÷ Total) × 100
-
Lead Time (Avg.) in Days = (Sum of Delivery Days ÷ Number of POs)
-
Inventory Carrying Cost % = (Carrying Cost ÷ Average Inventory Value) × 100
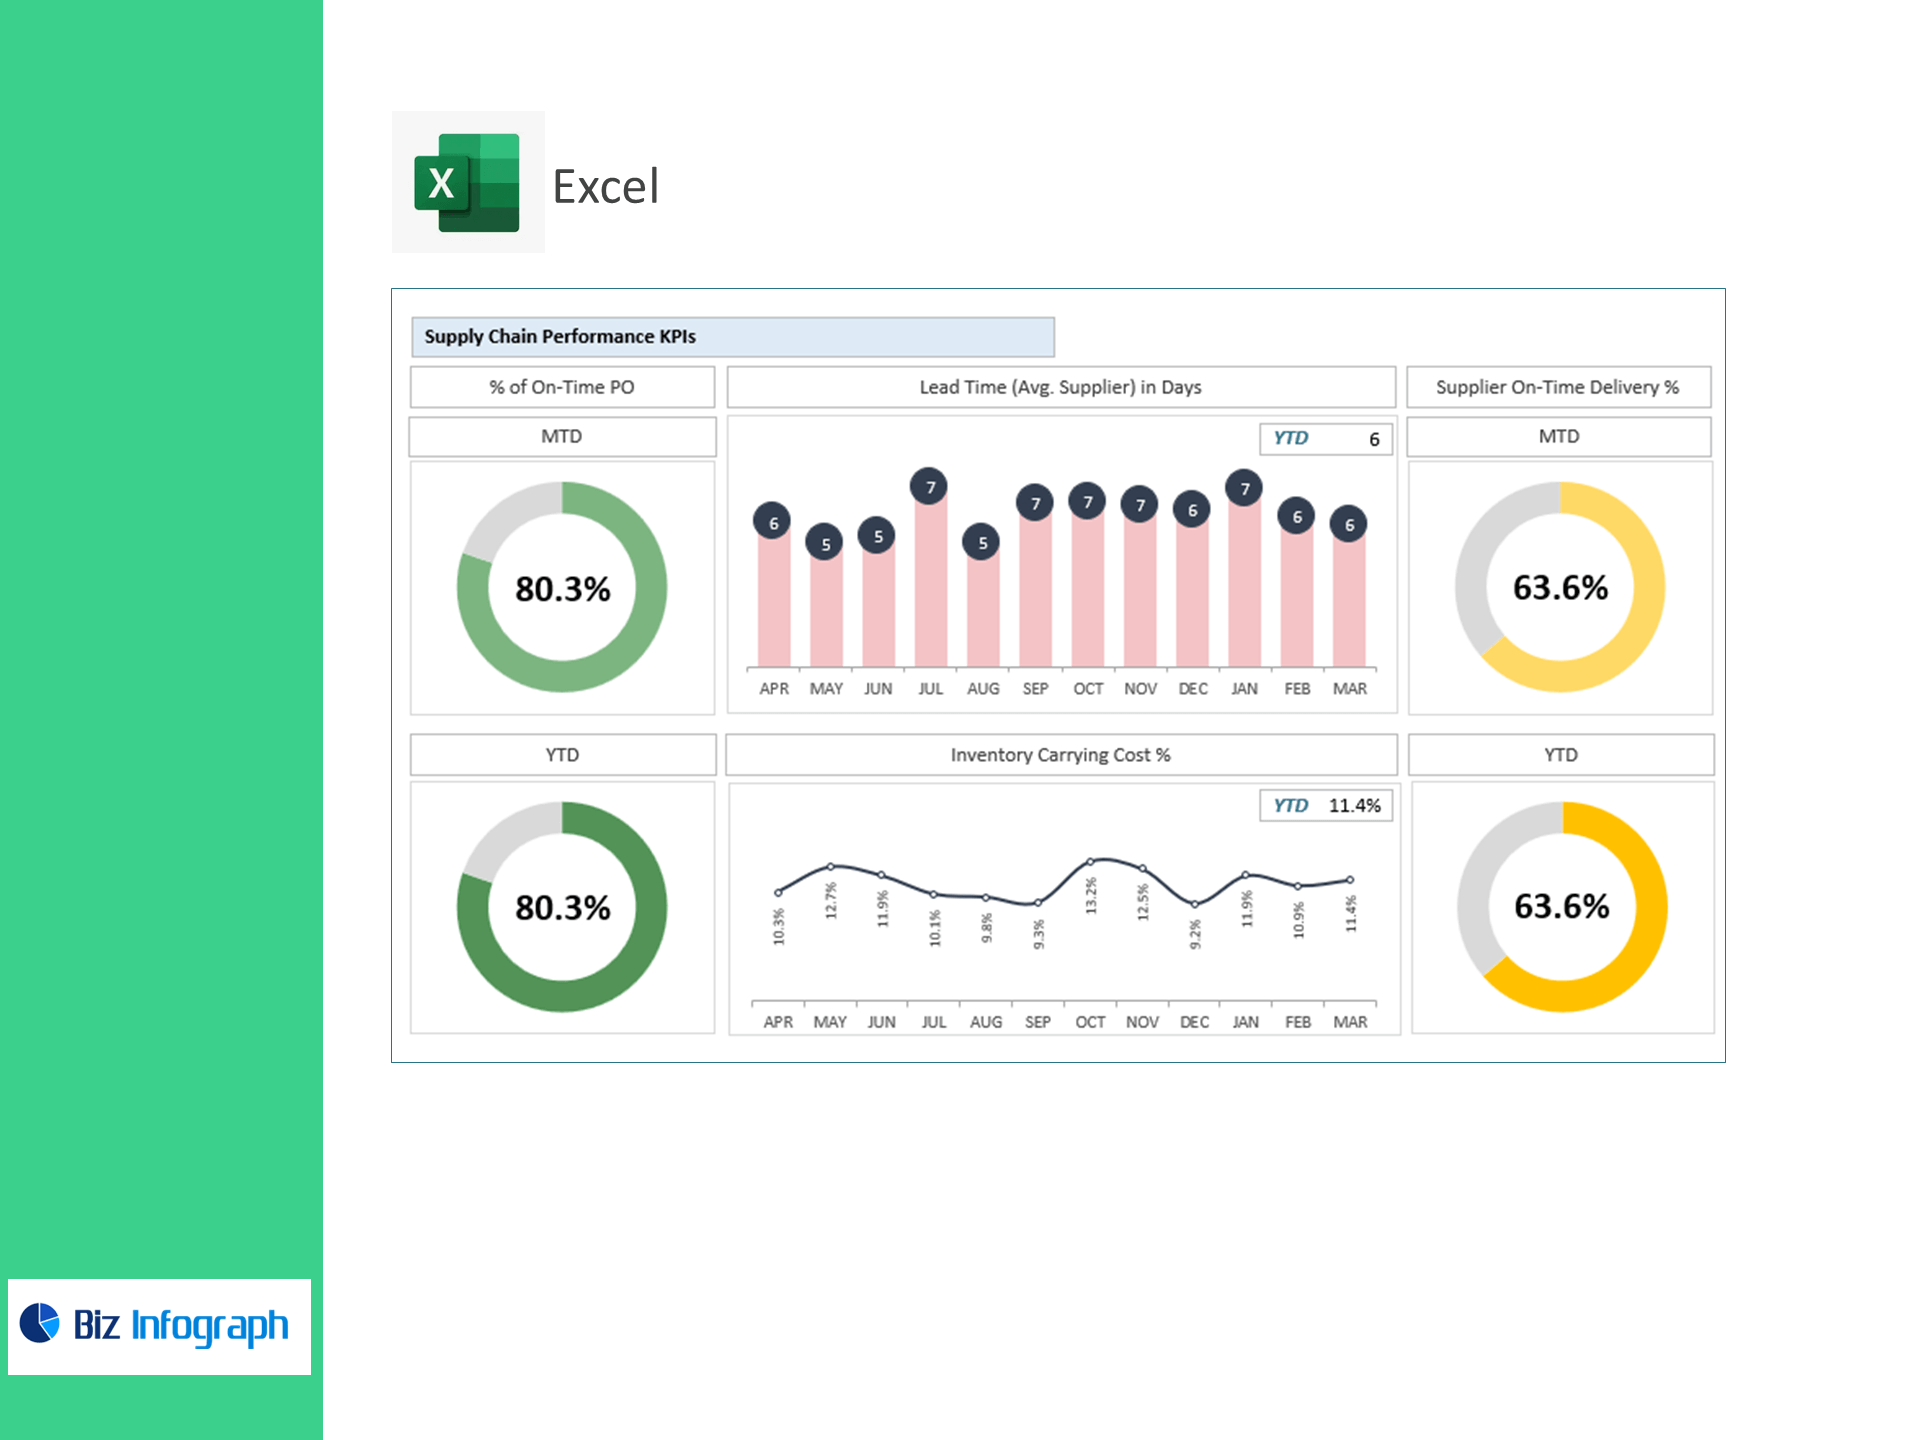
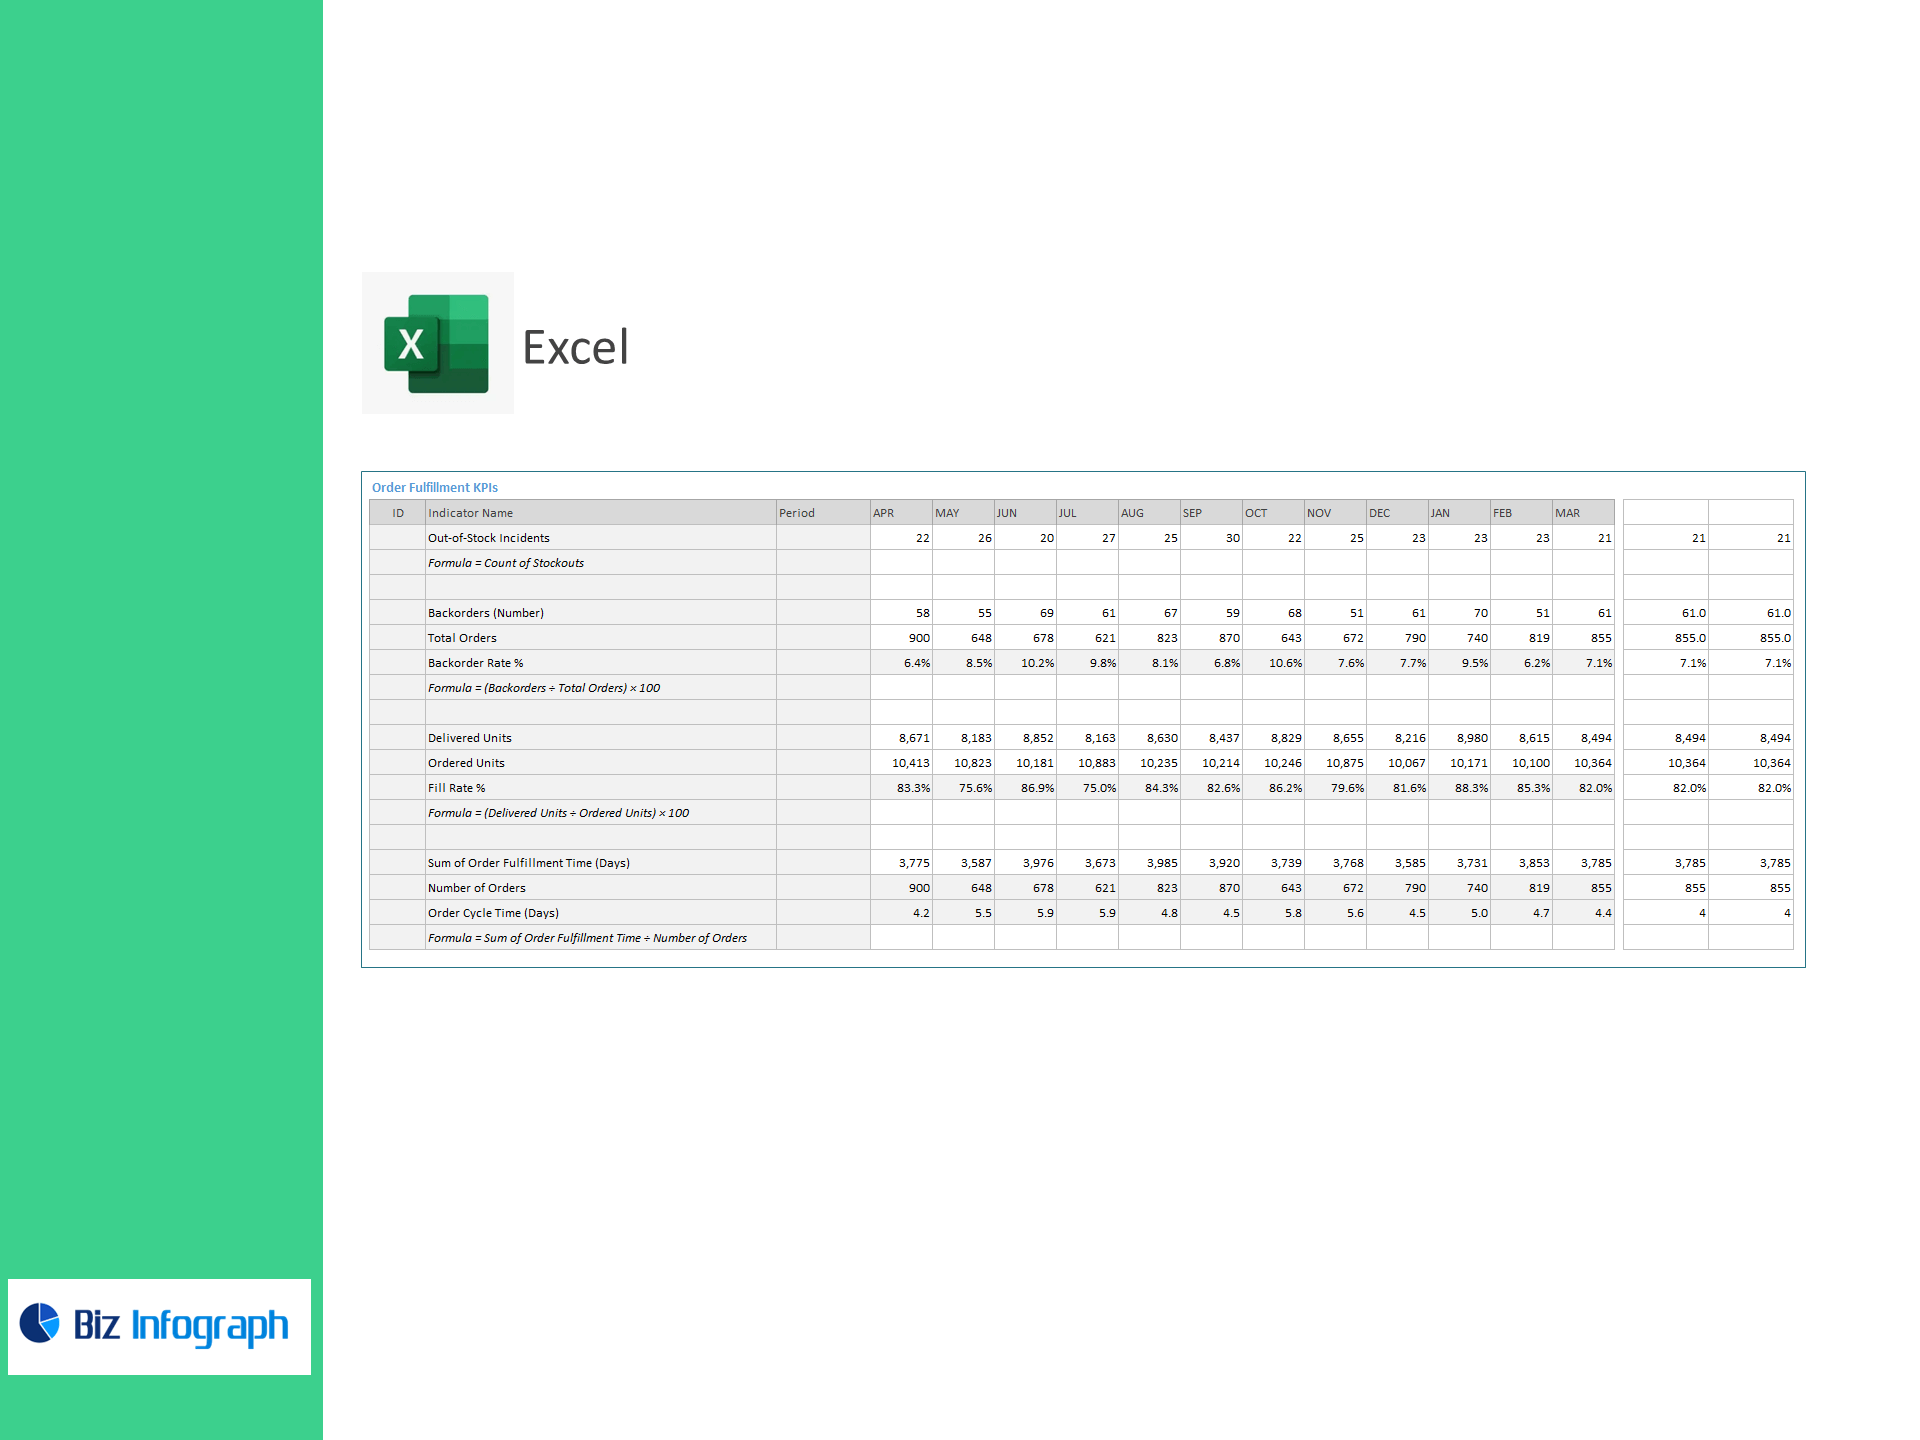
Order Fulfillment
-
Out-of-Stock Incidents (count)
-
Backorders, Total Orders, Backorder Rate % = (Backorders ÷ Total Orders) × 100
-
Delivered Units, Ordered Units, Fill Rate % = (Delivered ÷ Ordered) × 100
-
Order Cycle Time (Days) = (Sum of Fulfillment Time ÷ Number of Orders)
What’s inside
-
Executive Control Panel: Turnover, DOH, Fill Rate, Backorder Rate, On-Time PO %, and Cycle Time with trend & target variance.
-
Inventory Health View: Stock availability by category/SKU, ABC-style concentration, slow/fast movers.
-
Supplier Scorecards: On-time delivery %, average lead time, PO reliability, and exceptions.
-
Fulfillment Tracker: Stockouts, backorders, and OTIF-style metrics with drill-downs.
-
Assumptions & Targets: Set service-level targets and carrying-cost assumptions; visuals update instantly.
-
Clean Data Tables: Import-ready sheets for Inventory, POs, Receipts, Deliveries, and Orders.
How it works
-
Paste your CSV/Excel data into the provided tables.
-
Set targets (e.g., DOH, Fill Rate, On-Time %).
-
Review the dashboard to rebalance stock, renegotiate suppliers, and streamline fulfillment.
Benefits
-
Release working capital: Lower DOH and carrying cost without risking service.
-
Improve supplier reliability: Track on-time performance and lead-time drift.
-
Protect customer experience: Lift Fill Rate, reduce backorders and stockouts.
-
Decide quickly: Clear visuals highlight exceptions and root causes.
Technical details
-
Built for Microsoft Excel 365/2021 (Windows & Mac).
-
100% formula-driven; no add-ins. Named tables & dynamic ranges.
-
Includes sample data + quick-start guide.
For ready-to-use Dashboard Templates: