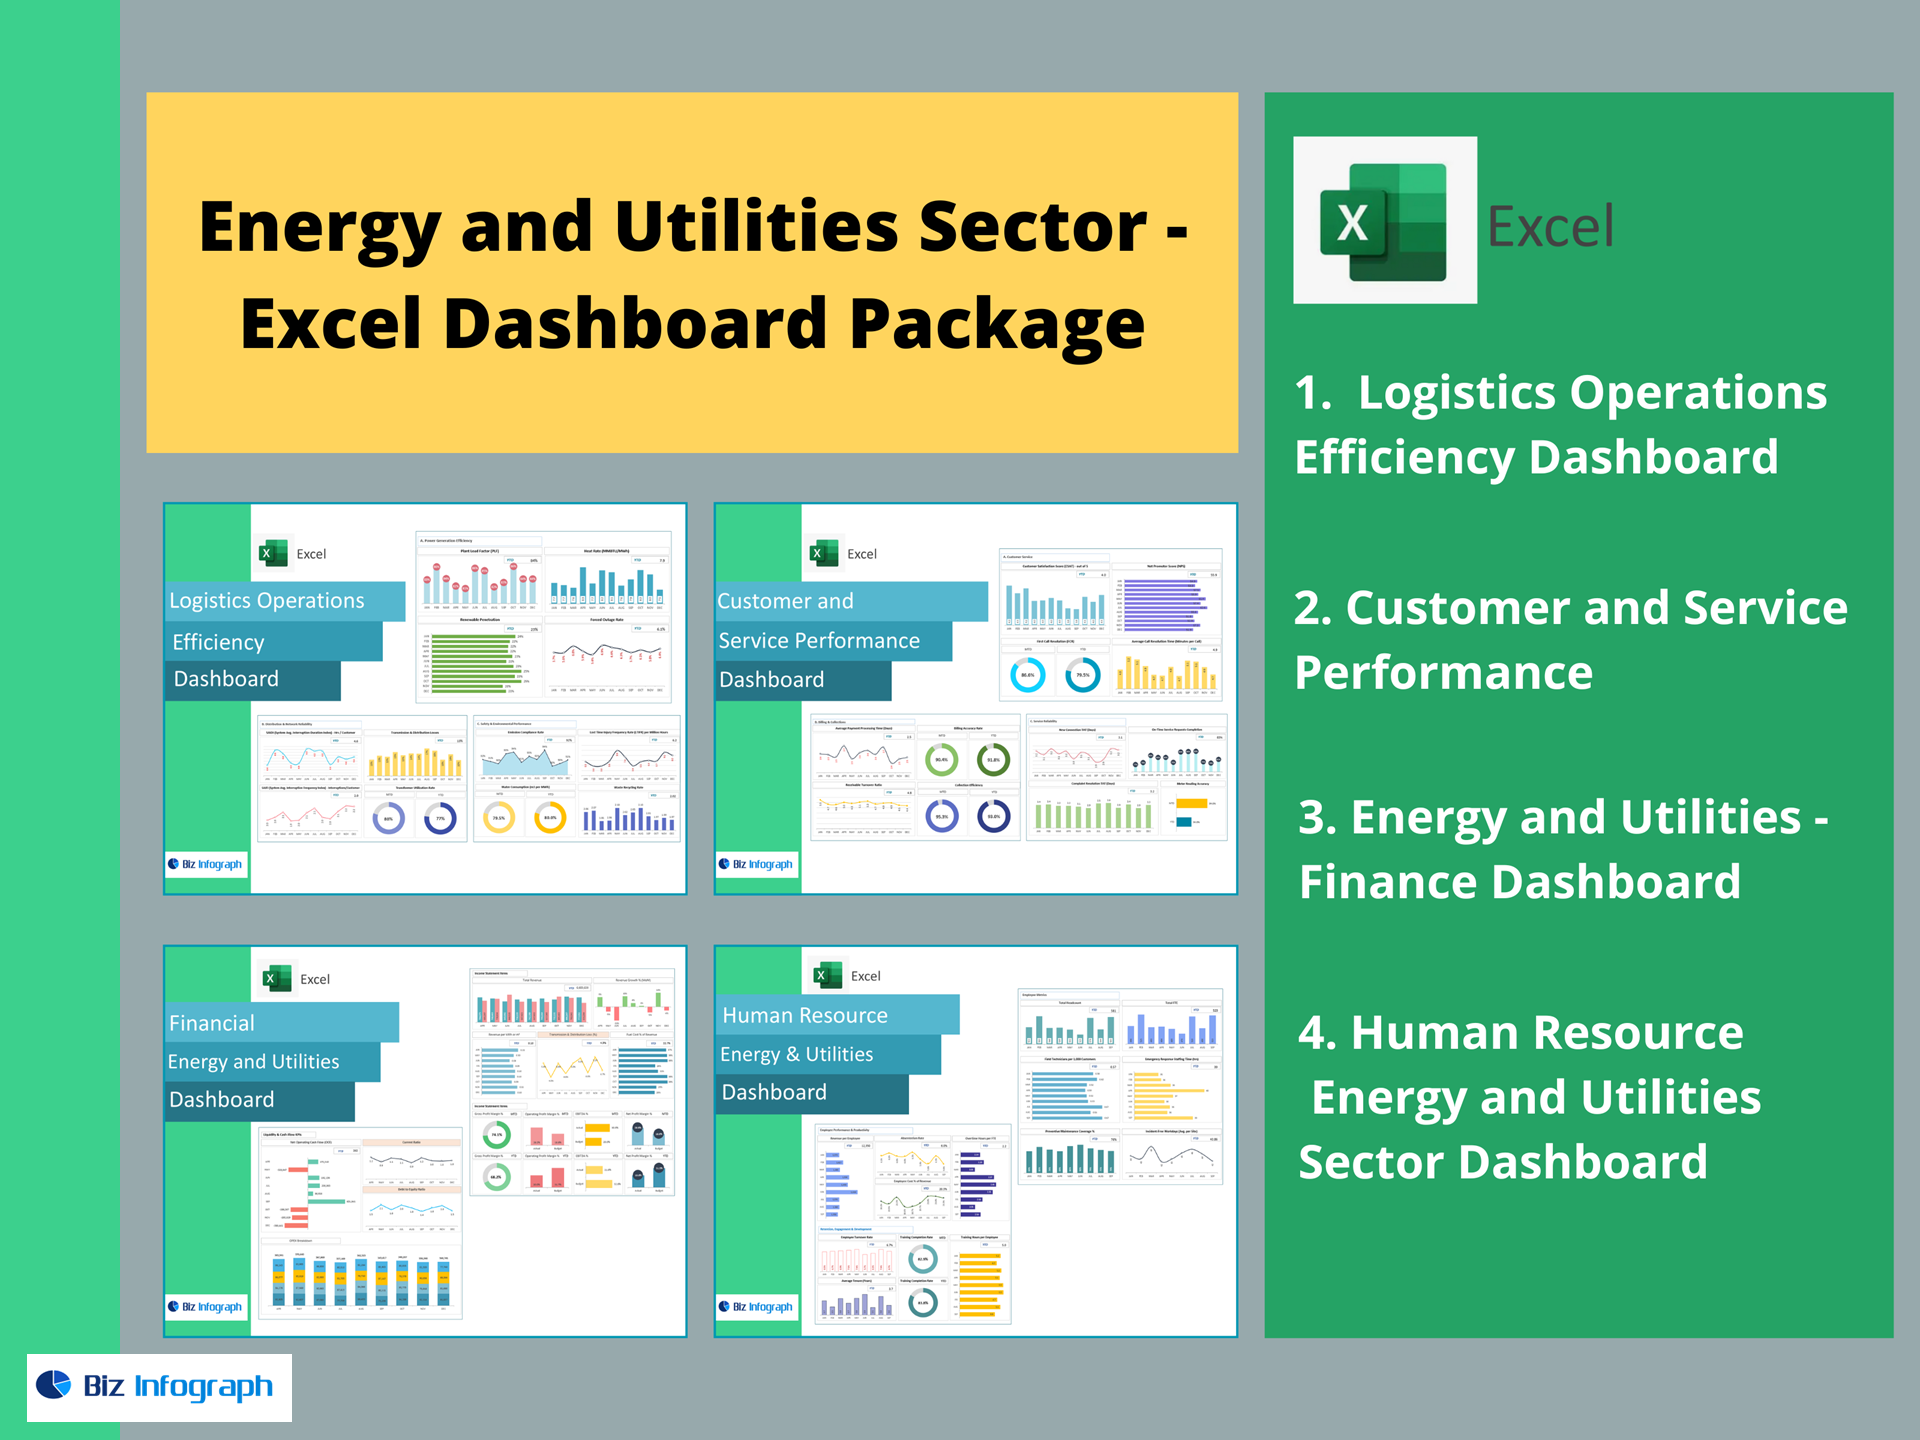
Energy & Utilities Finance Dashboard — Excel Template
Track profitability, liquidity, and network efficiency in one place. This ready-to-use Excel dashboard gives CFOs and operations leaders in power, gas, and water utilities instant, reliable visibility across Income Statement, Cash Flow, and Operational KPIs—without macros or add-ins.
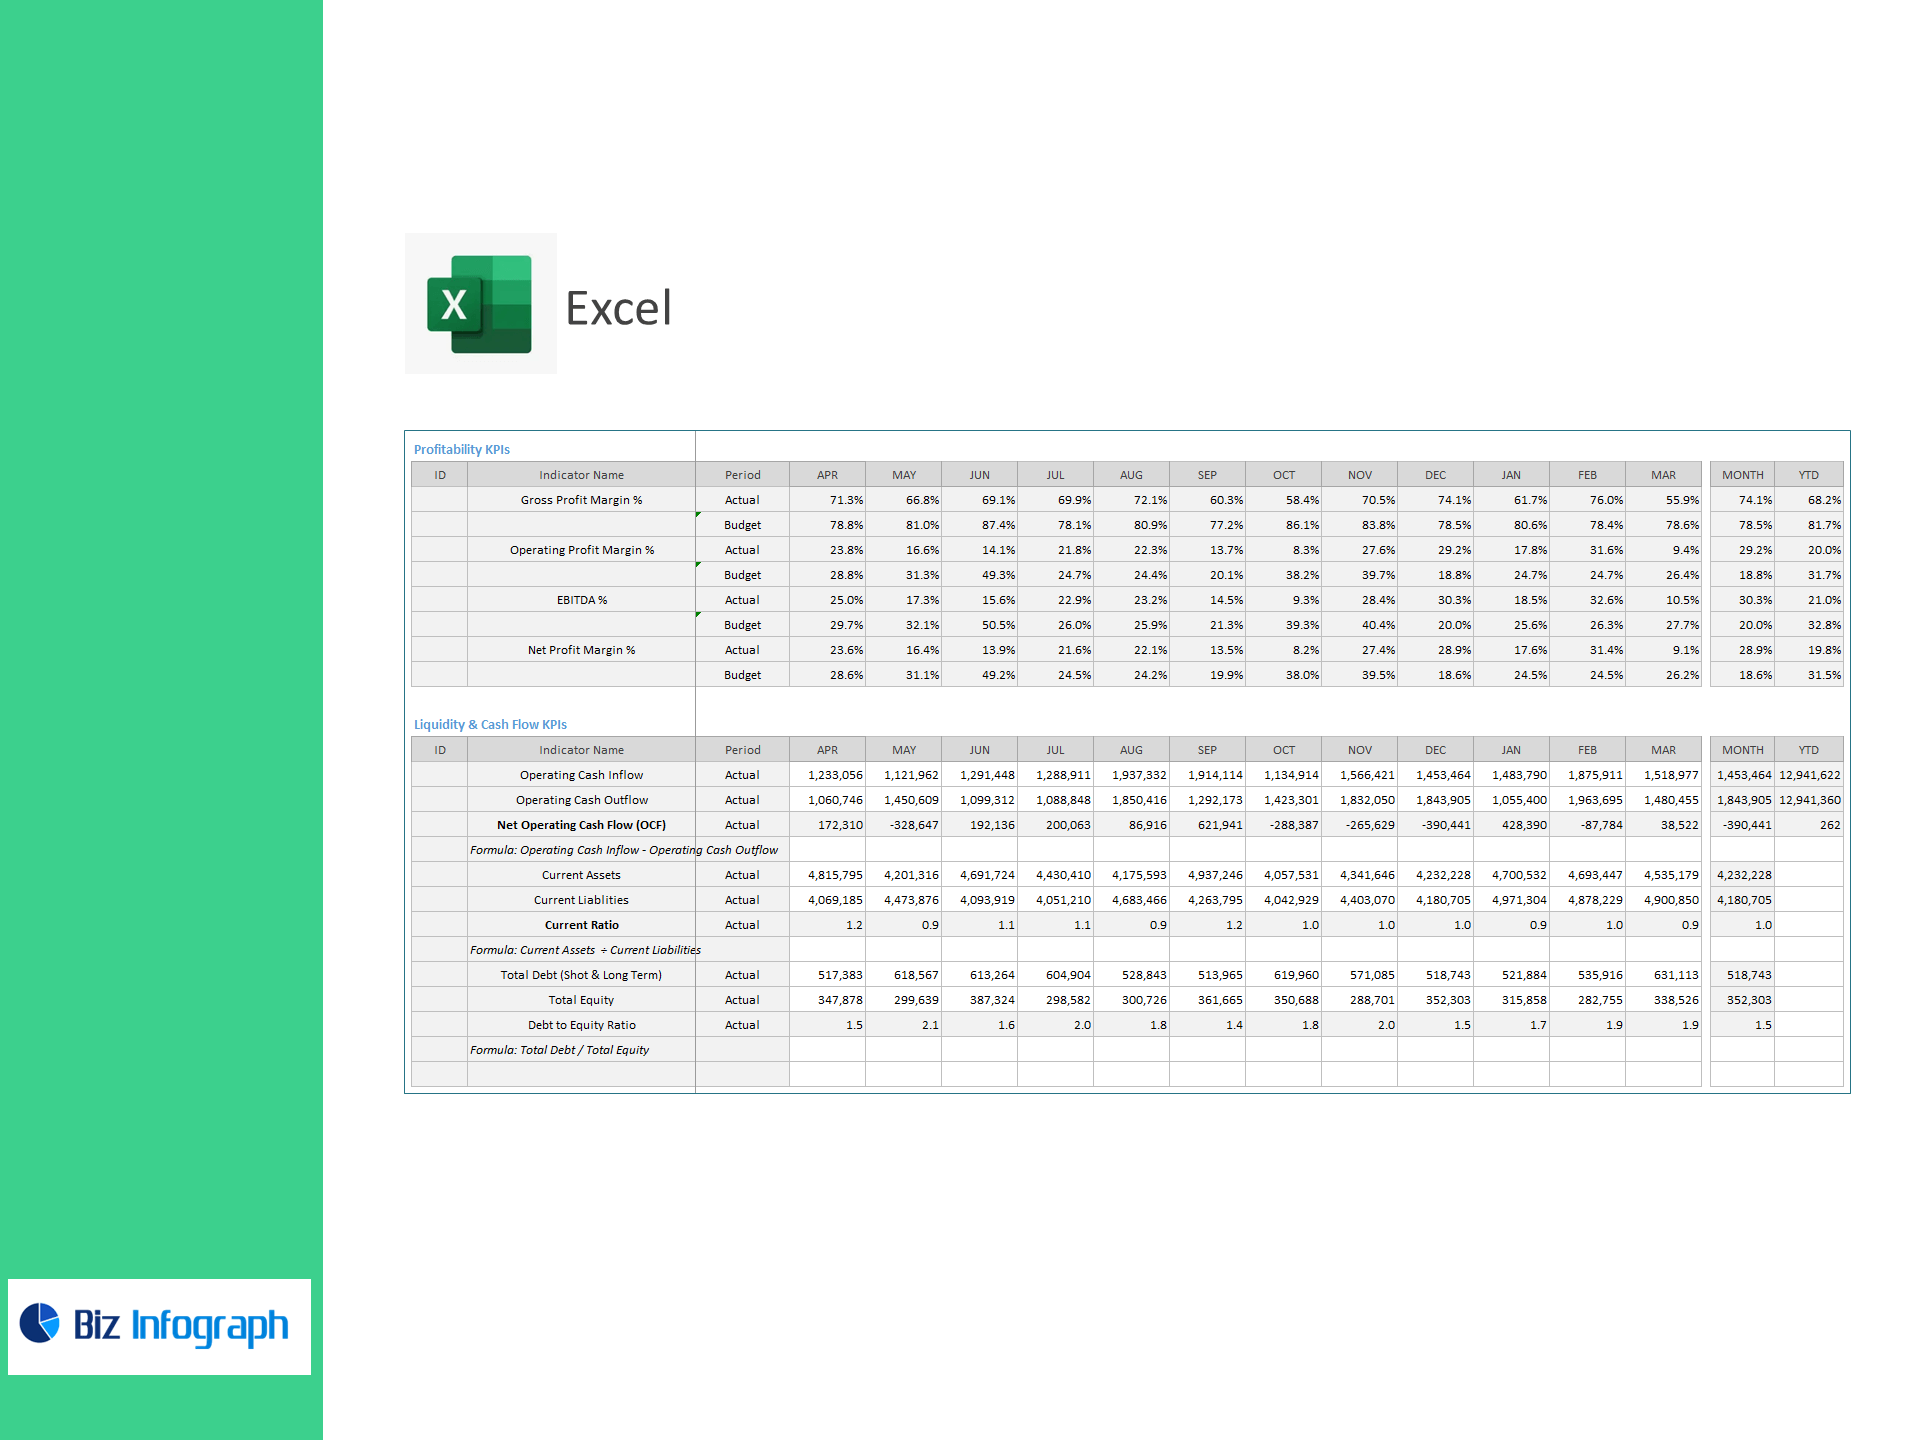
What you can monitor (prebuilt KPIs)
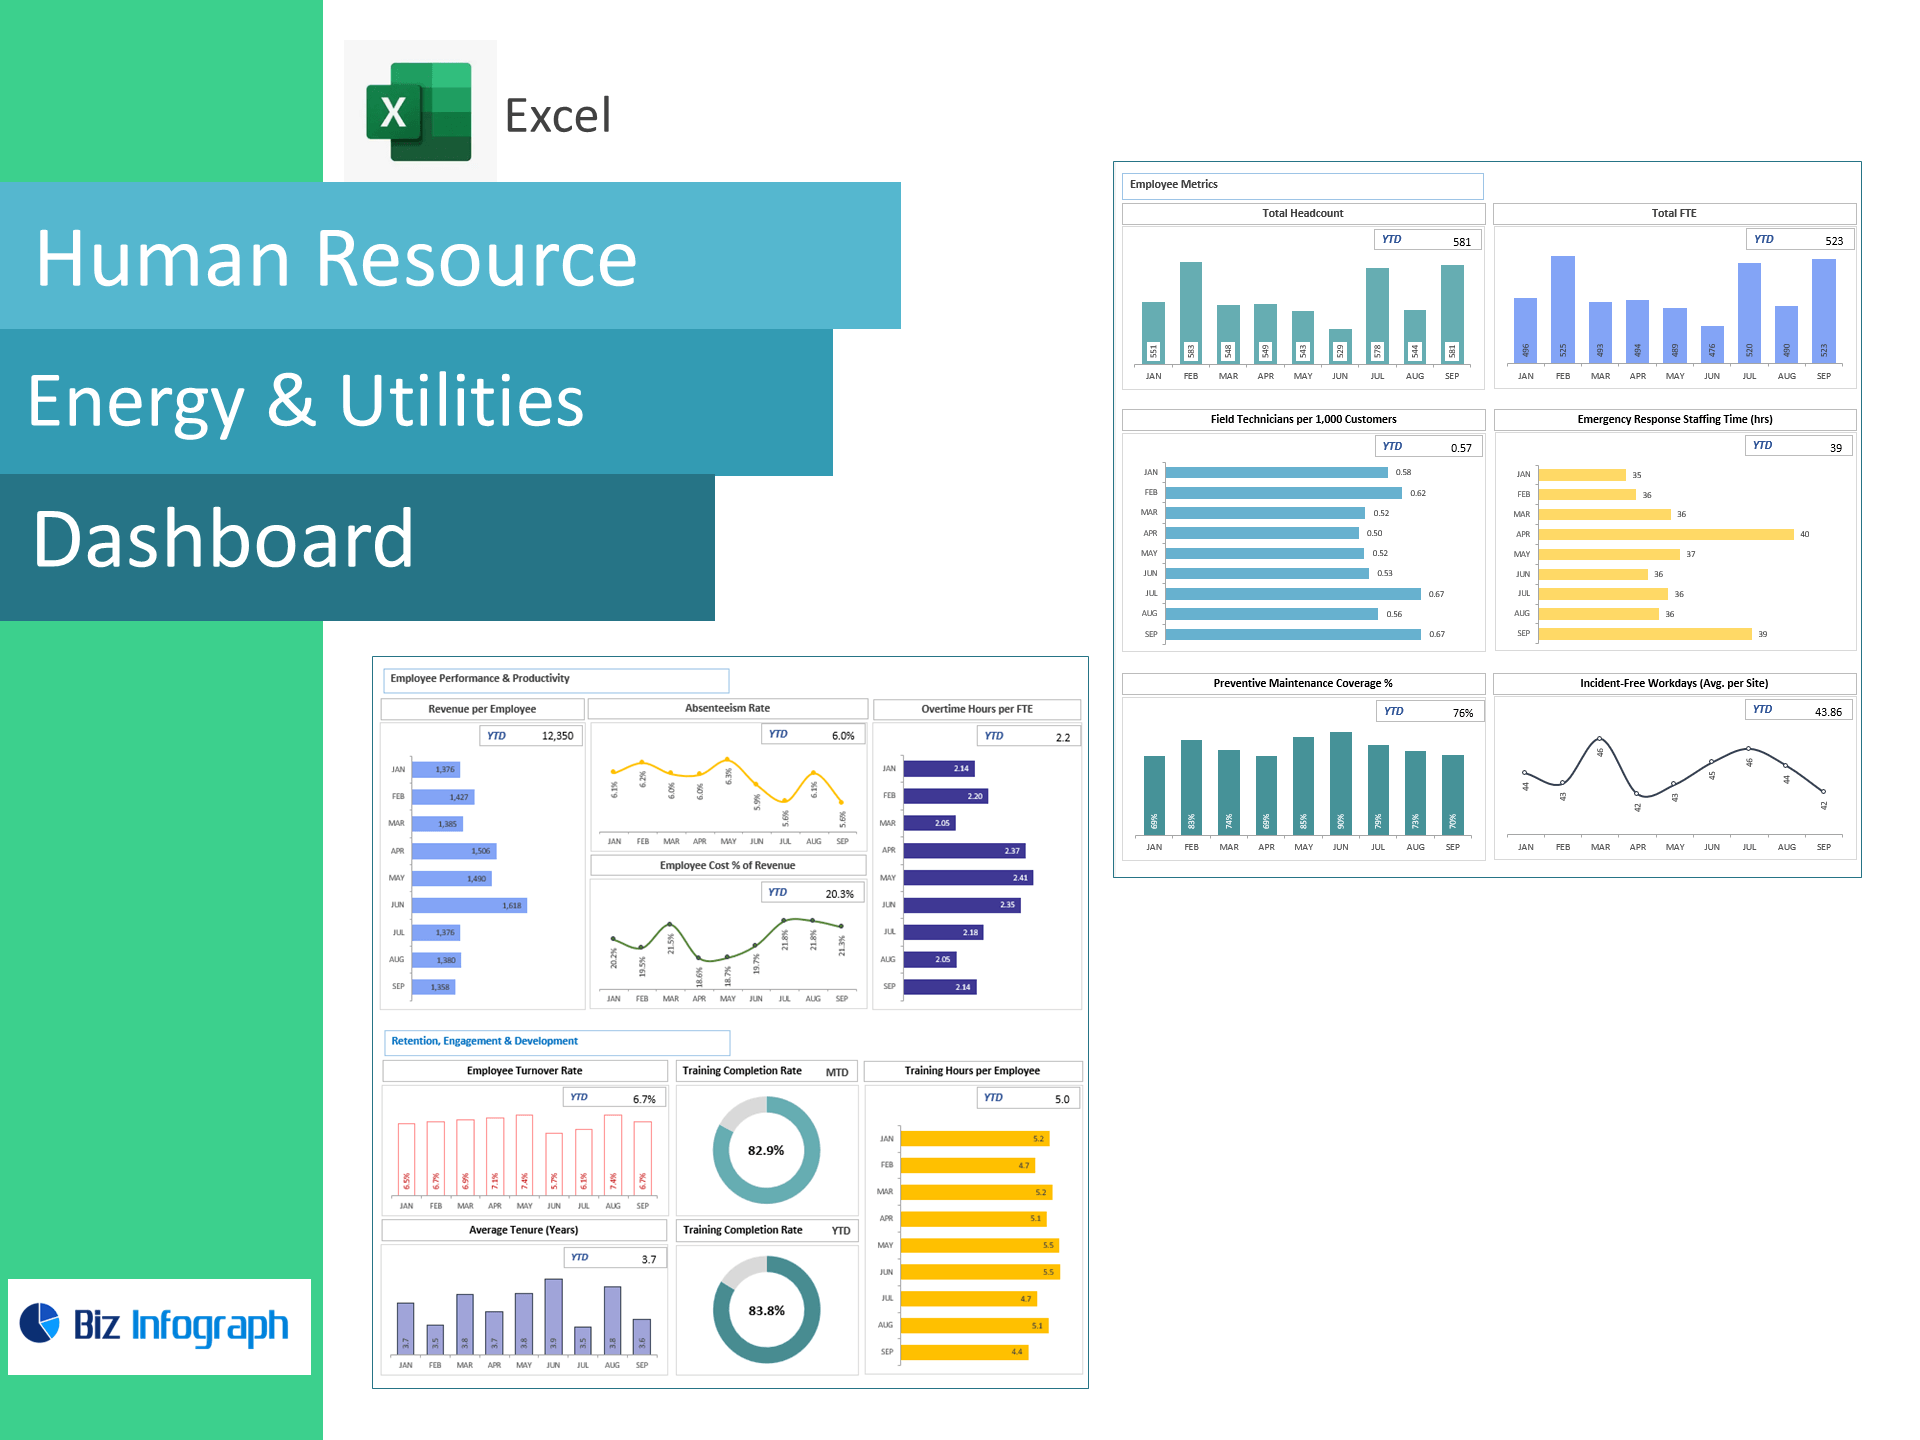
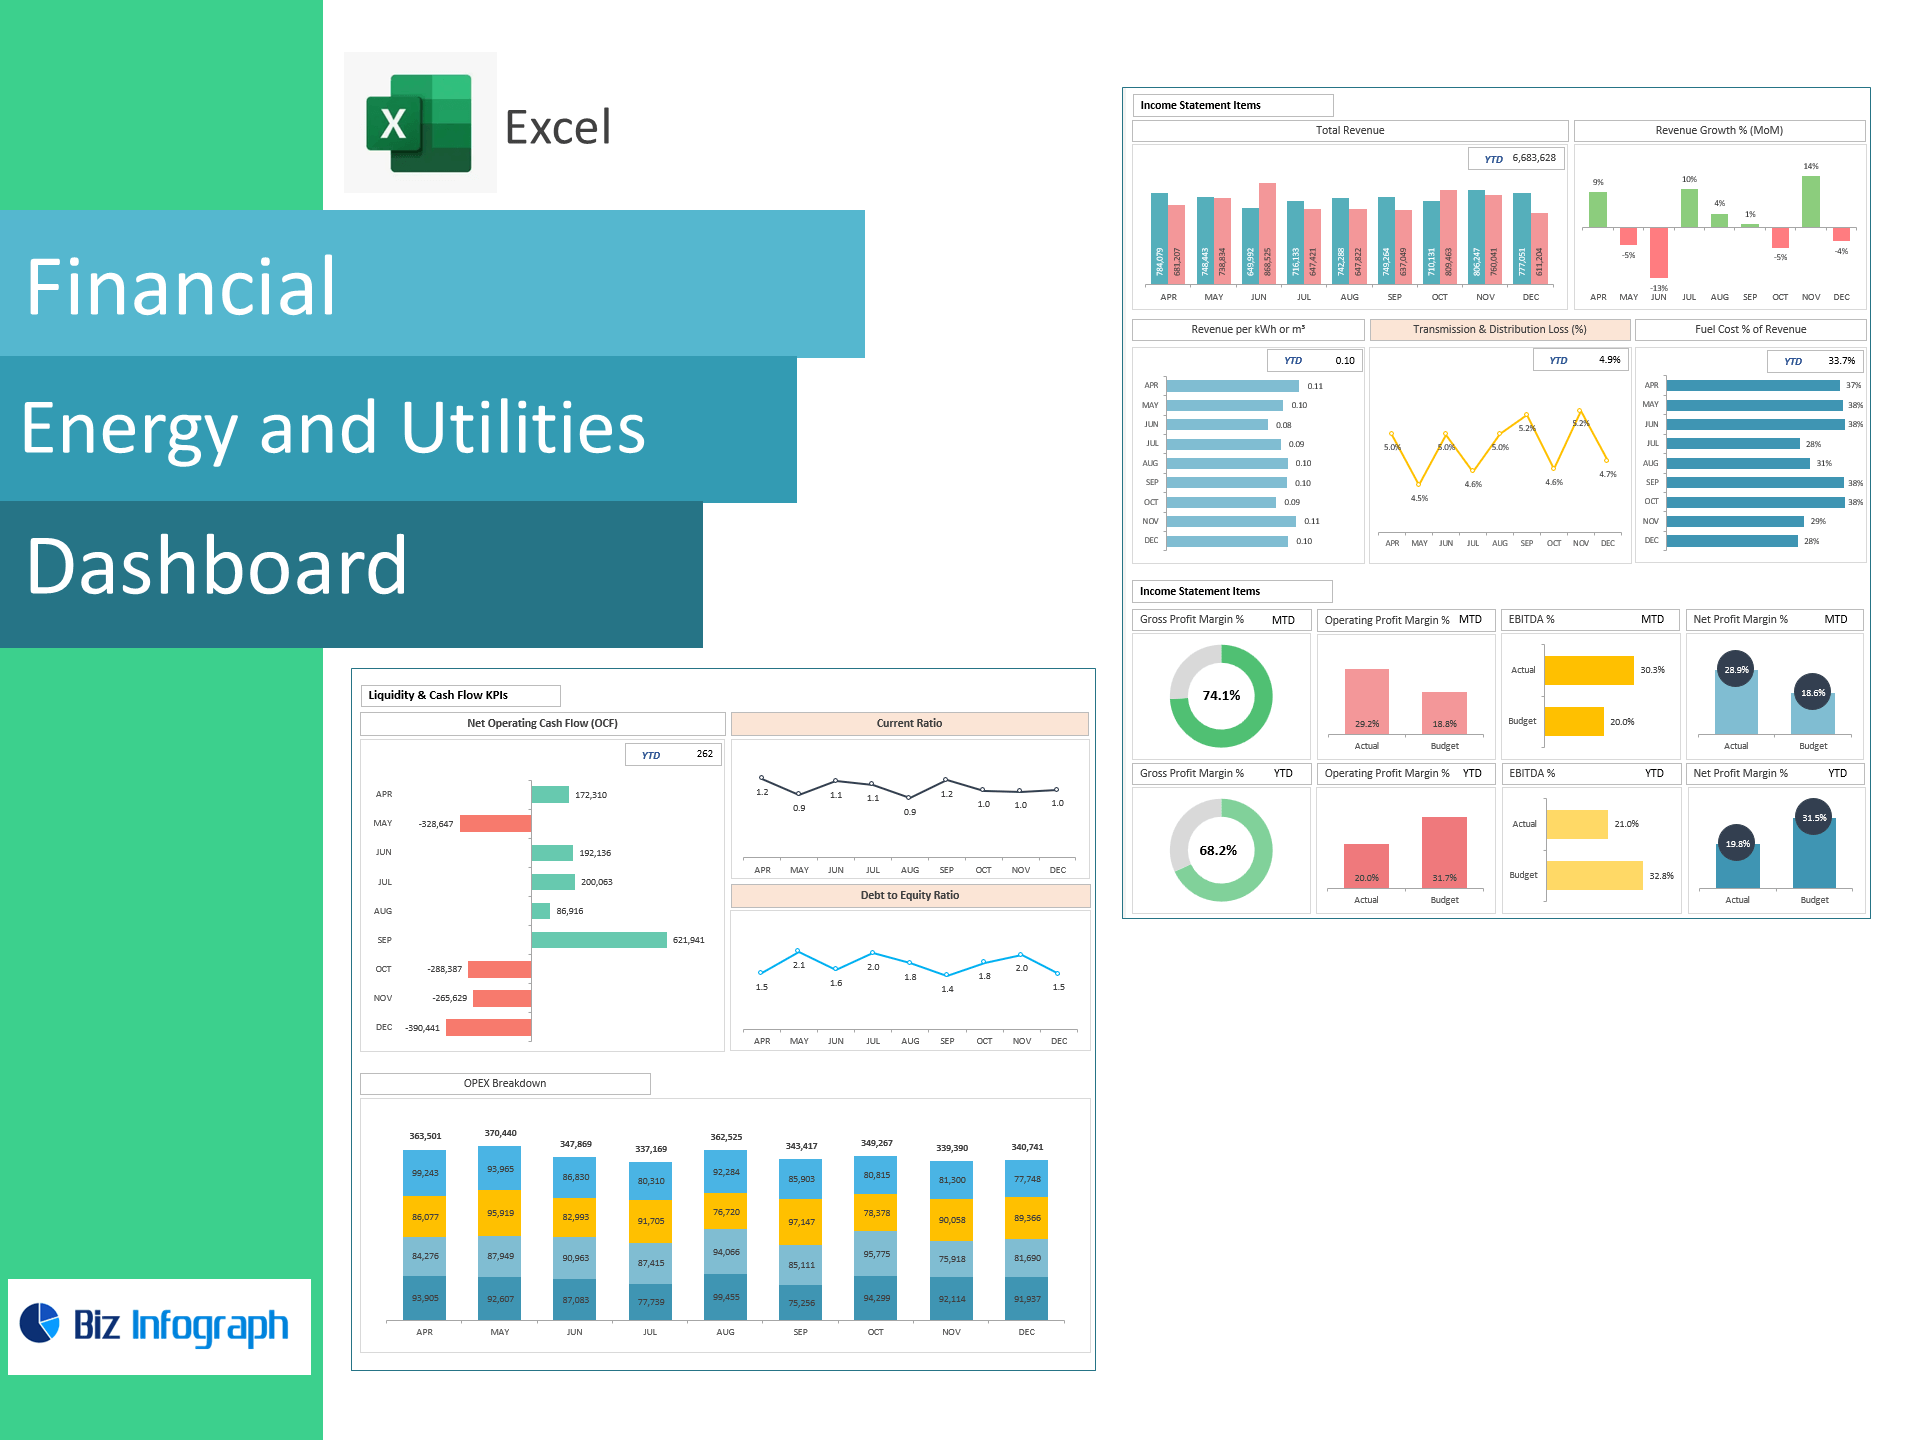
Financial Performance
-
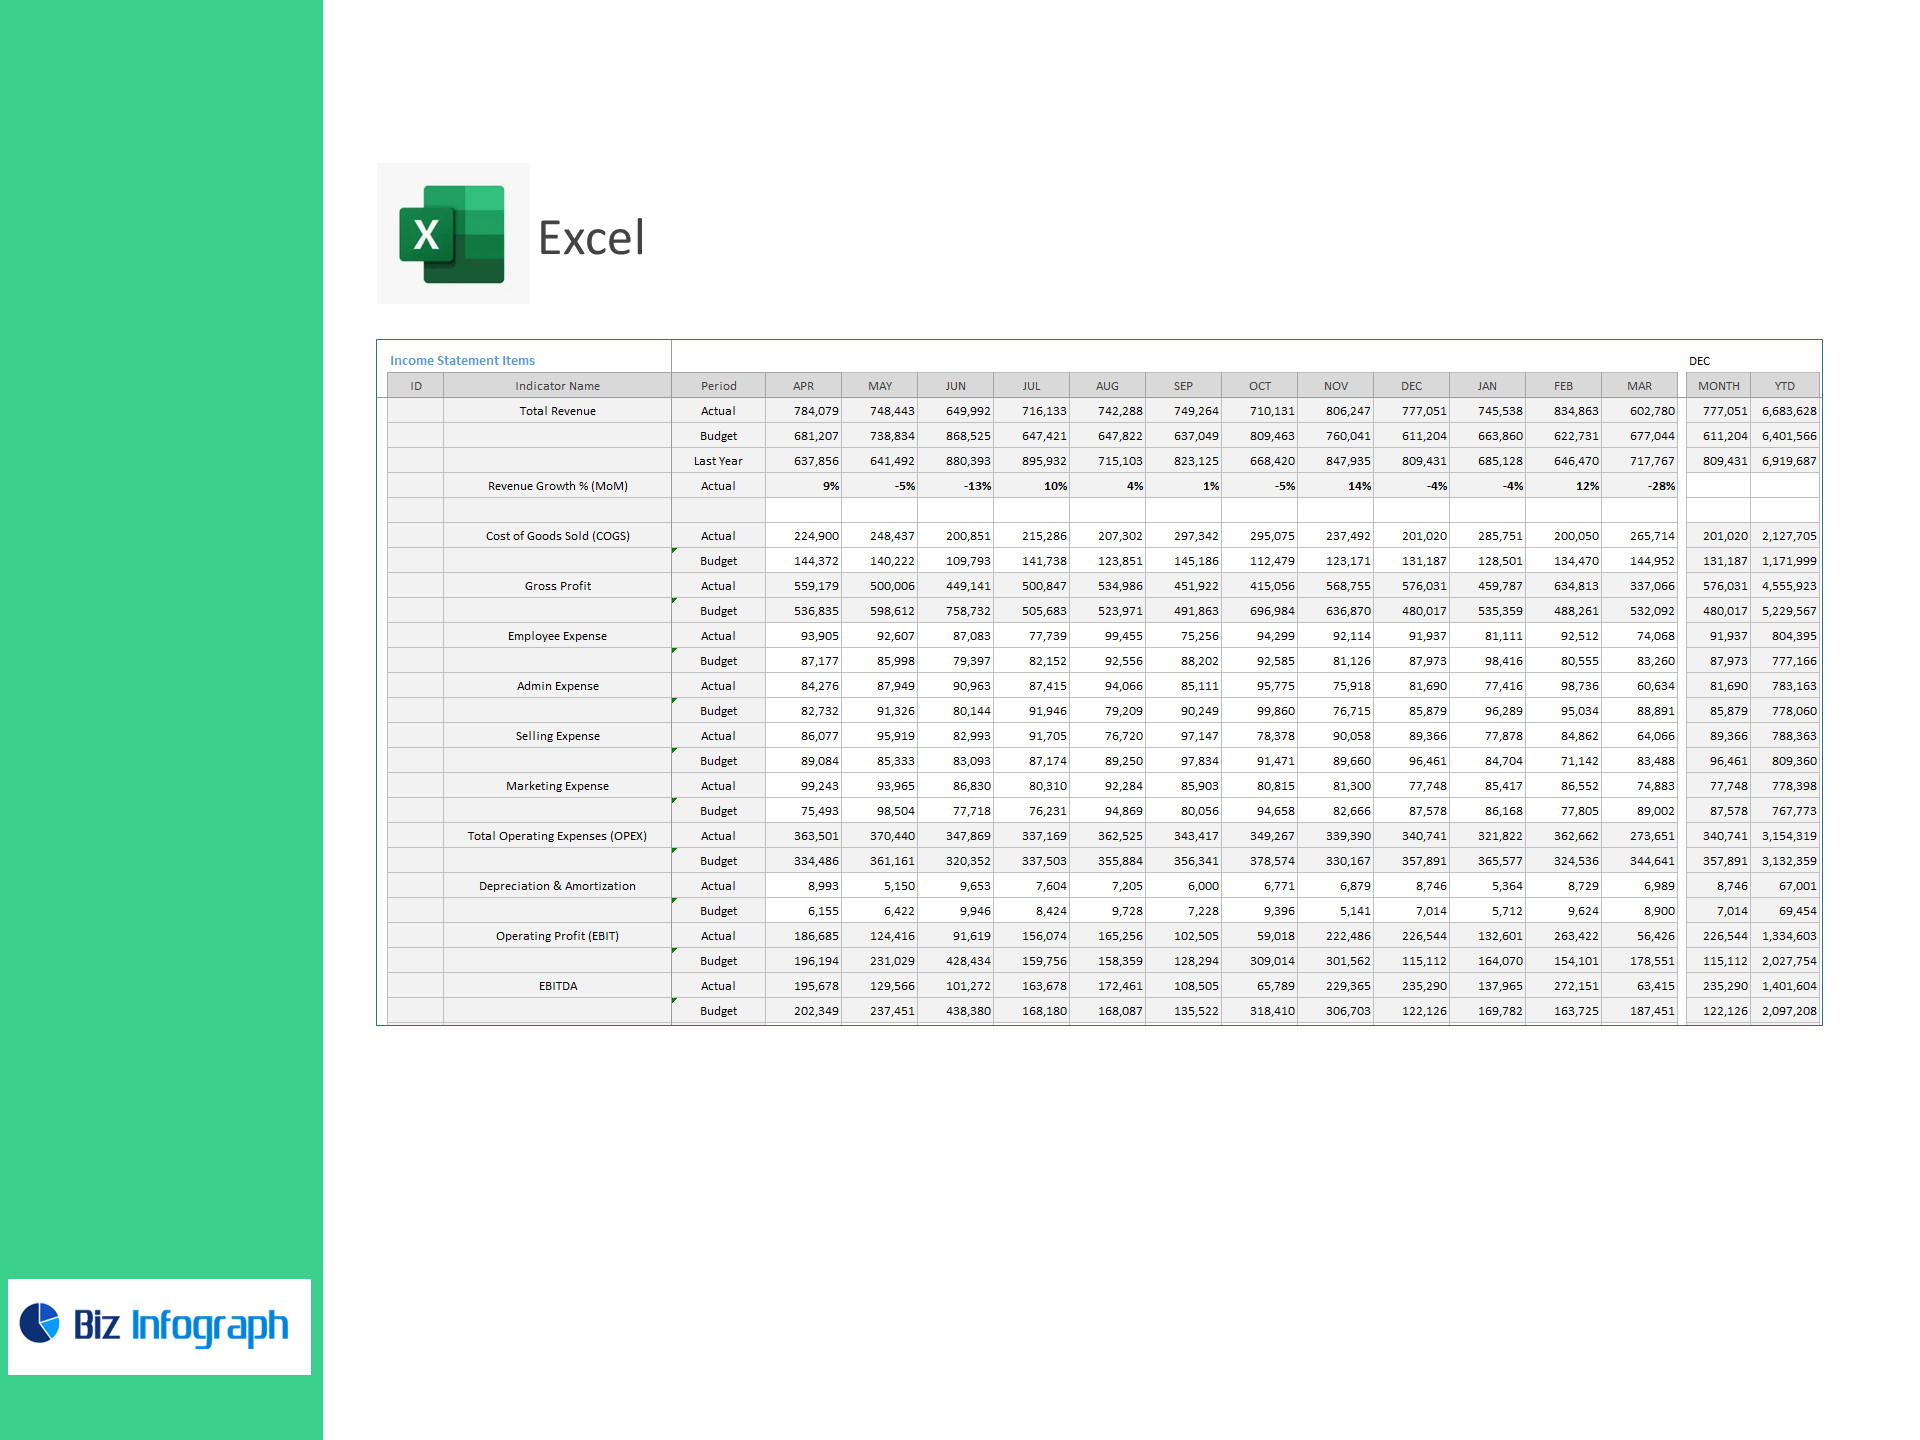
Total Revenue, COGS, Gross Profit, OPEX (with breakdown), D&A, EBIT, EBITDA, Interest, Taxes, Net Profit
-
Profitability ratios: Gross/Operating/EBITDA/Net Profit Margin %
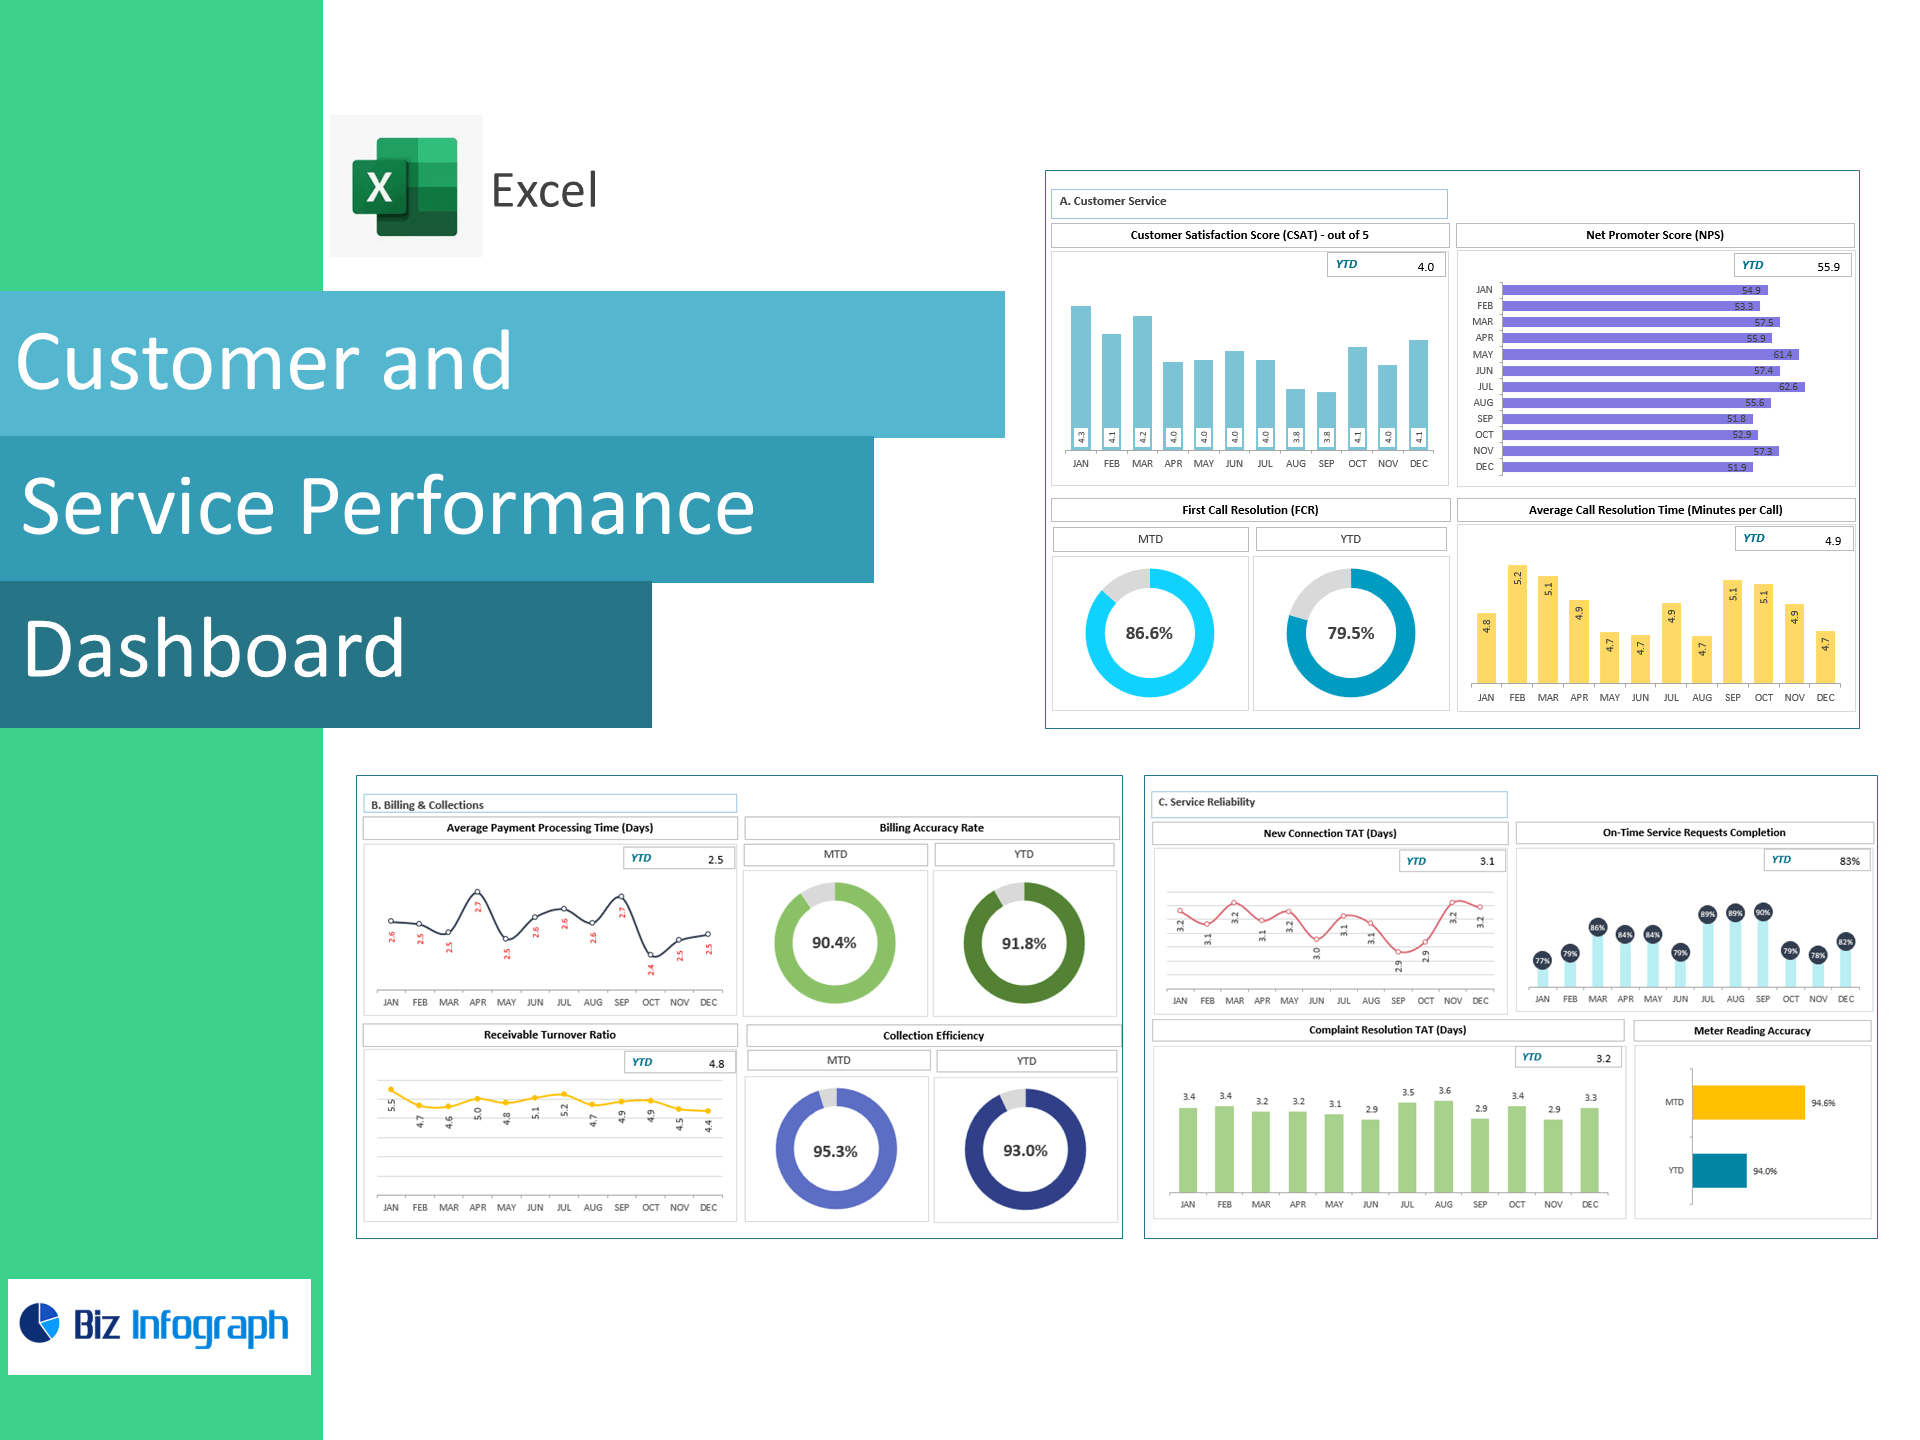
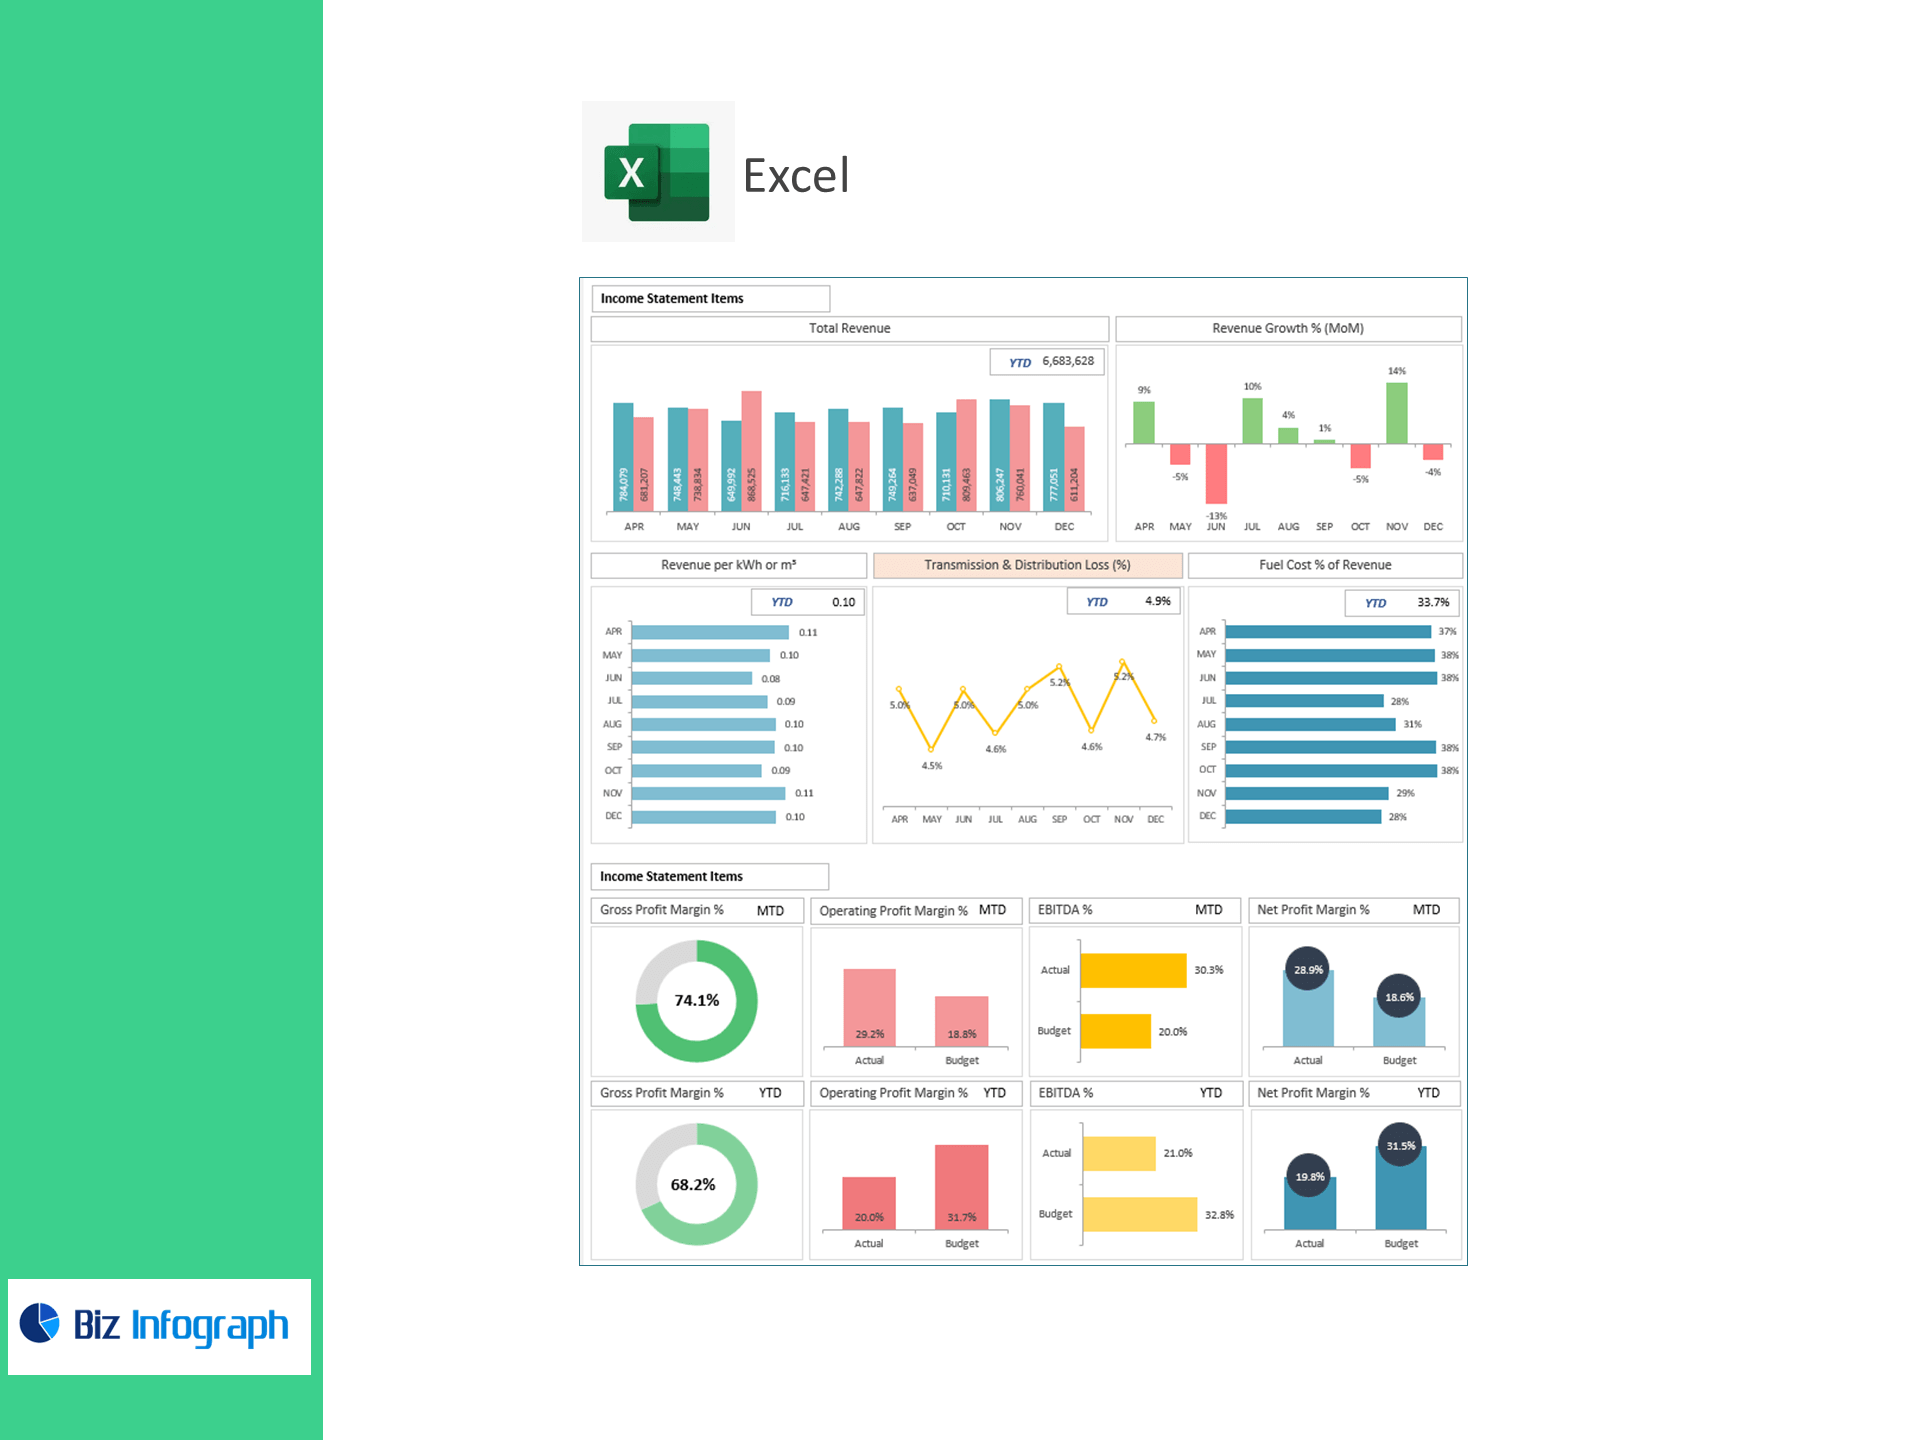
Liquidity & Leverage
-
Operating Cash Inflow/Outflow, Net Operating Cash Flow (OCF)
-
Current Ratio (Current Assets ÷ Current Liabilities)
-
Debt-to-Equity Ratio
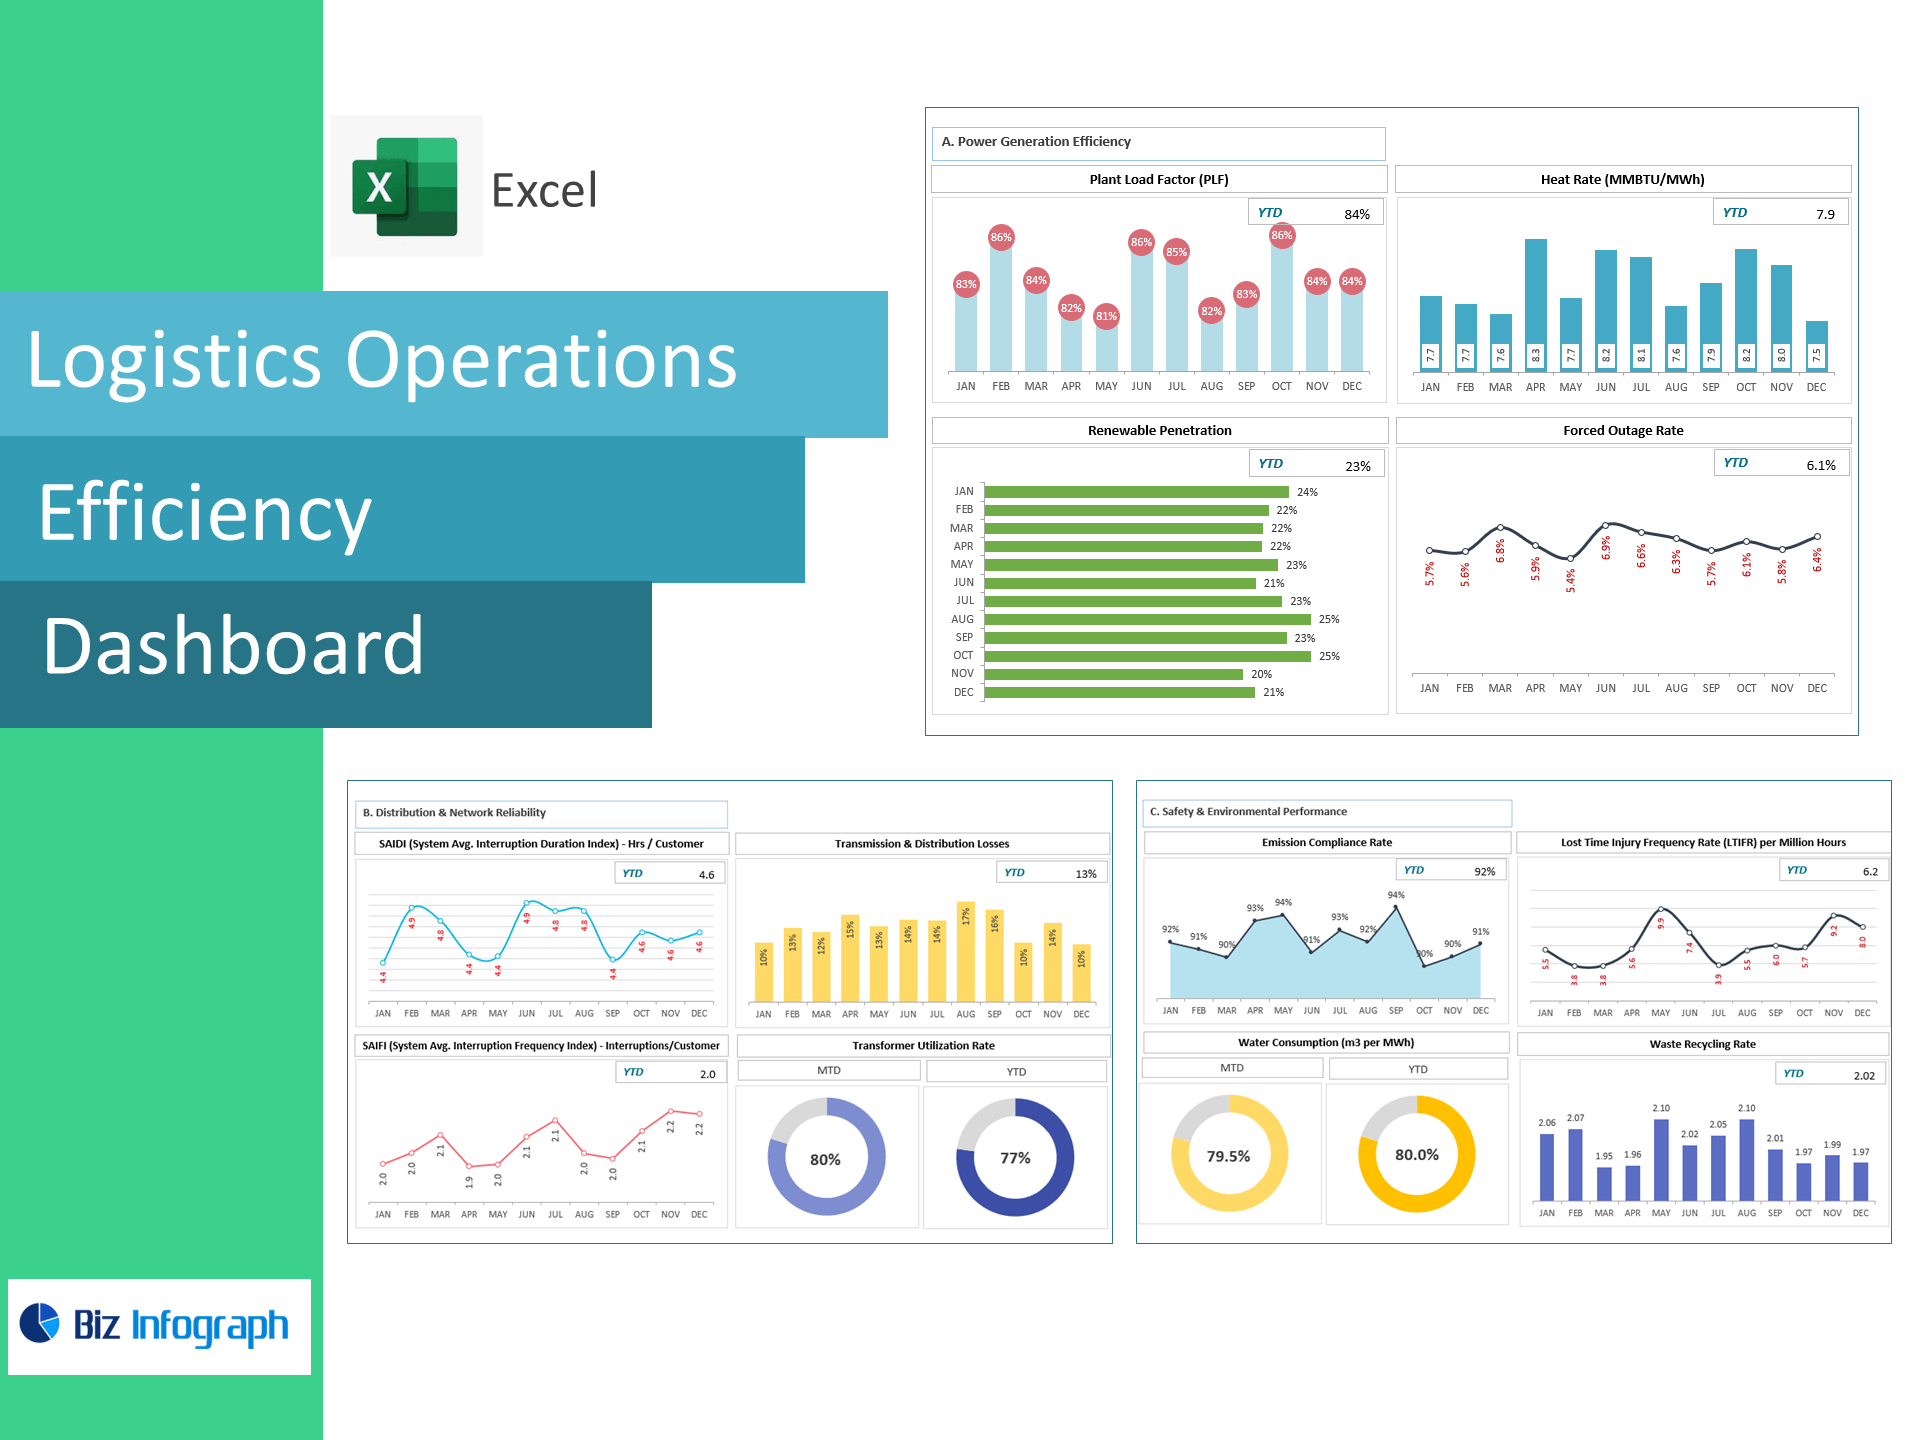
Energy & Network Efficiency
-
Total Units Supplied (kWh / m³)
-
Revenue per kWh / m³
-
Transmission & Distribution Loss % (Energy Loss ÷ Energy Supplied × 100)
-
Fuel Procurement Cost and Fuel Cost % of Revenue
Why teams love this template
-
Finance + Ops on one screen – tie financial results to network efficiency and fuel dynamics.
-
Variance-ready visuals – monthly trends, YoY comps, target vs. actual, and traffic-light statuses.
-
Drilldowns that matter – segment by plant, region, tariff class, customer type, or business unit.
-
Board-ready outputs – one-page summary auto-formatted for print and PDF export.
What’s inside
-
Clean, brandable dashboard (Excel 365/2021, Windows & Mac)
-
Structured data tables with paste-ready import sheets
-
KPI tiles, sparklines, and interactive slicers
-
Sample data + step-by-step setup guide
-
No VBA/macros; formula-driven for easy auditing
For ready-to-use Dashboard Templates: