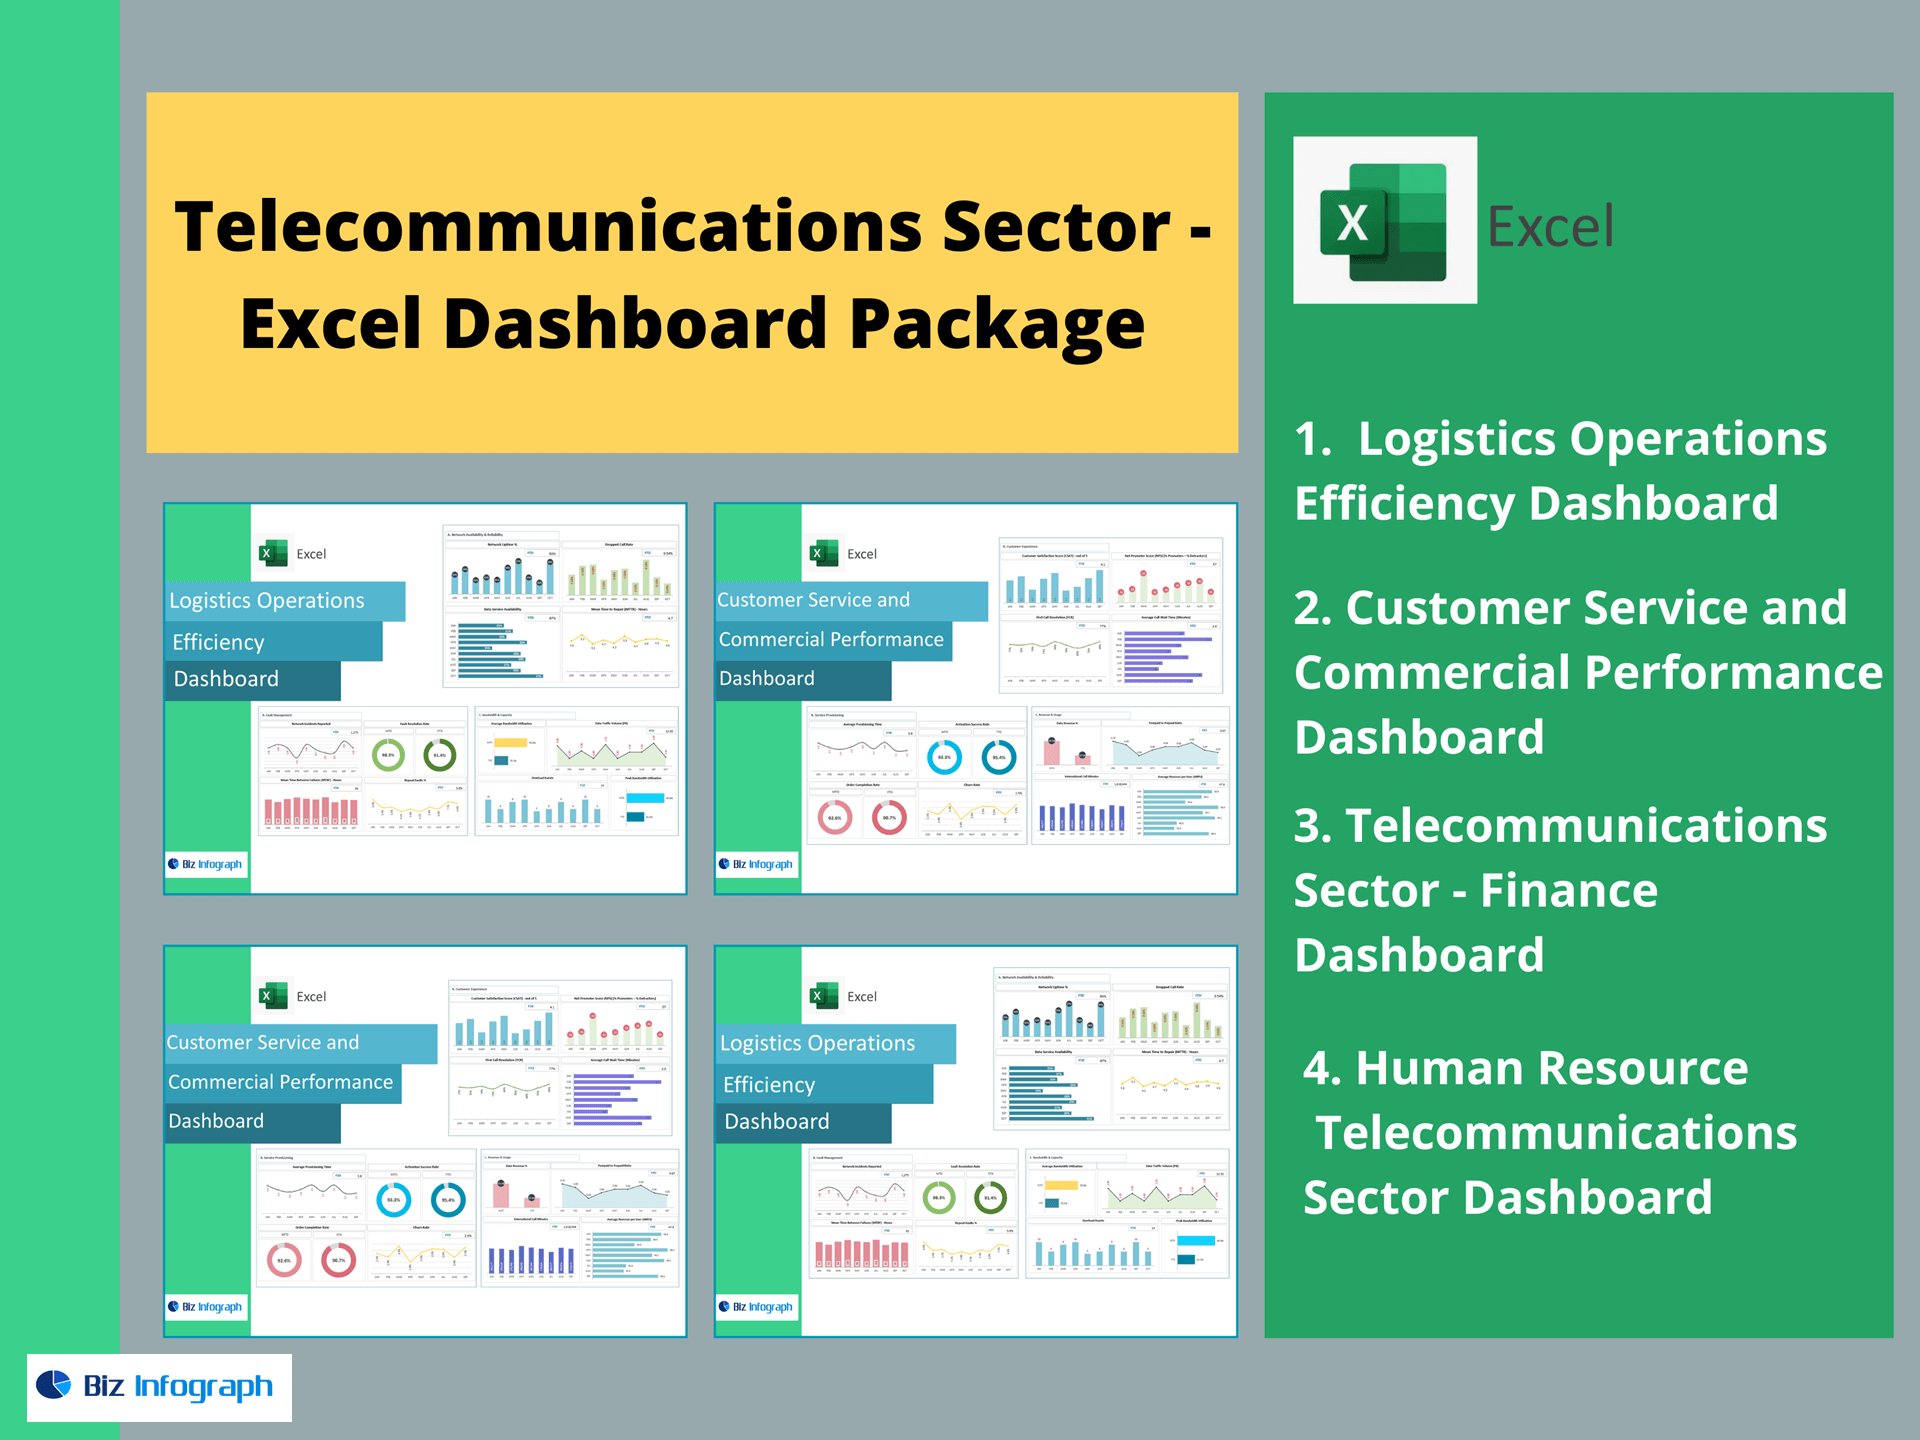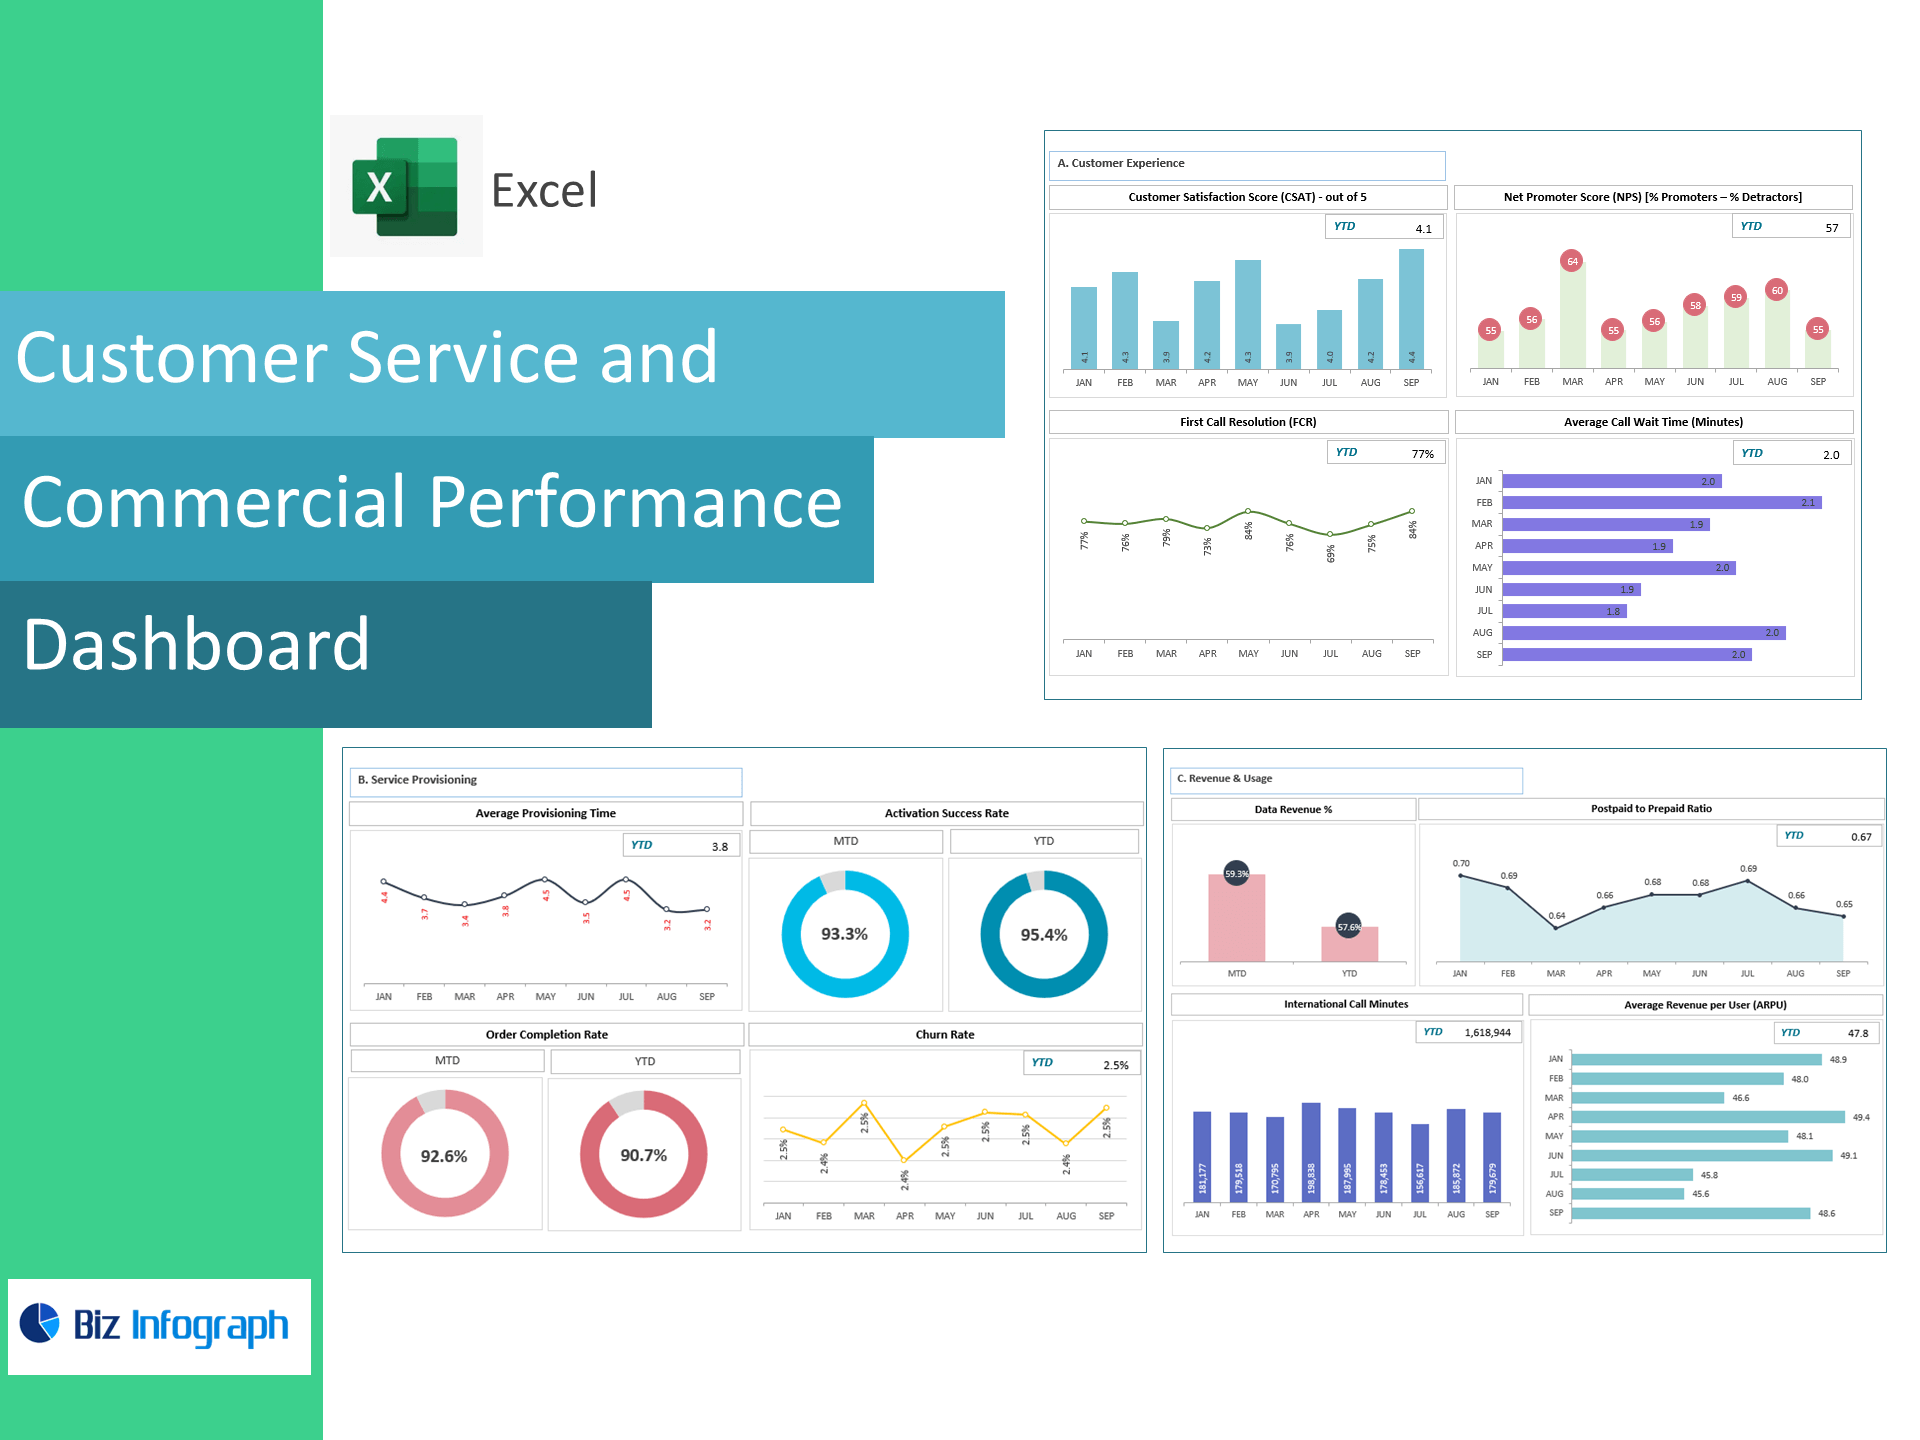
Customer Service & Commercial Performance Dashboard — Excel Template
Turn support and revenue signals into decisions. This ready-to-use Excel dashboard tracks customer experience, service provisioning, churn, ARPU, and data revenue—perfect for telco, ISP, and subscription businesses that want fast, reliable KPIs without building everything from scratch.
Built for CX and Commercial teams
-
No macros required (100% Excel 2016+ for Windows/Mac).
-
Drop-in data sheets: paste monthly/weekly CSV exports and refresh.
-
Auto-KPIs & RAG targets: instant red/amber/green status vs. your goals.
-
Filters: segment by product, plan, market, channel, or team.
KPIs Included (with formulas)
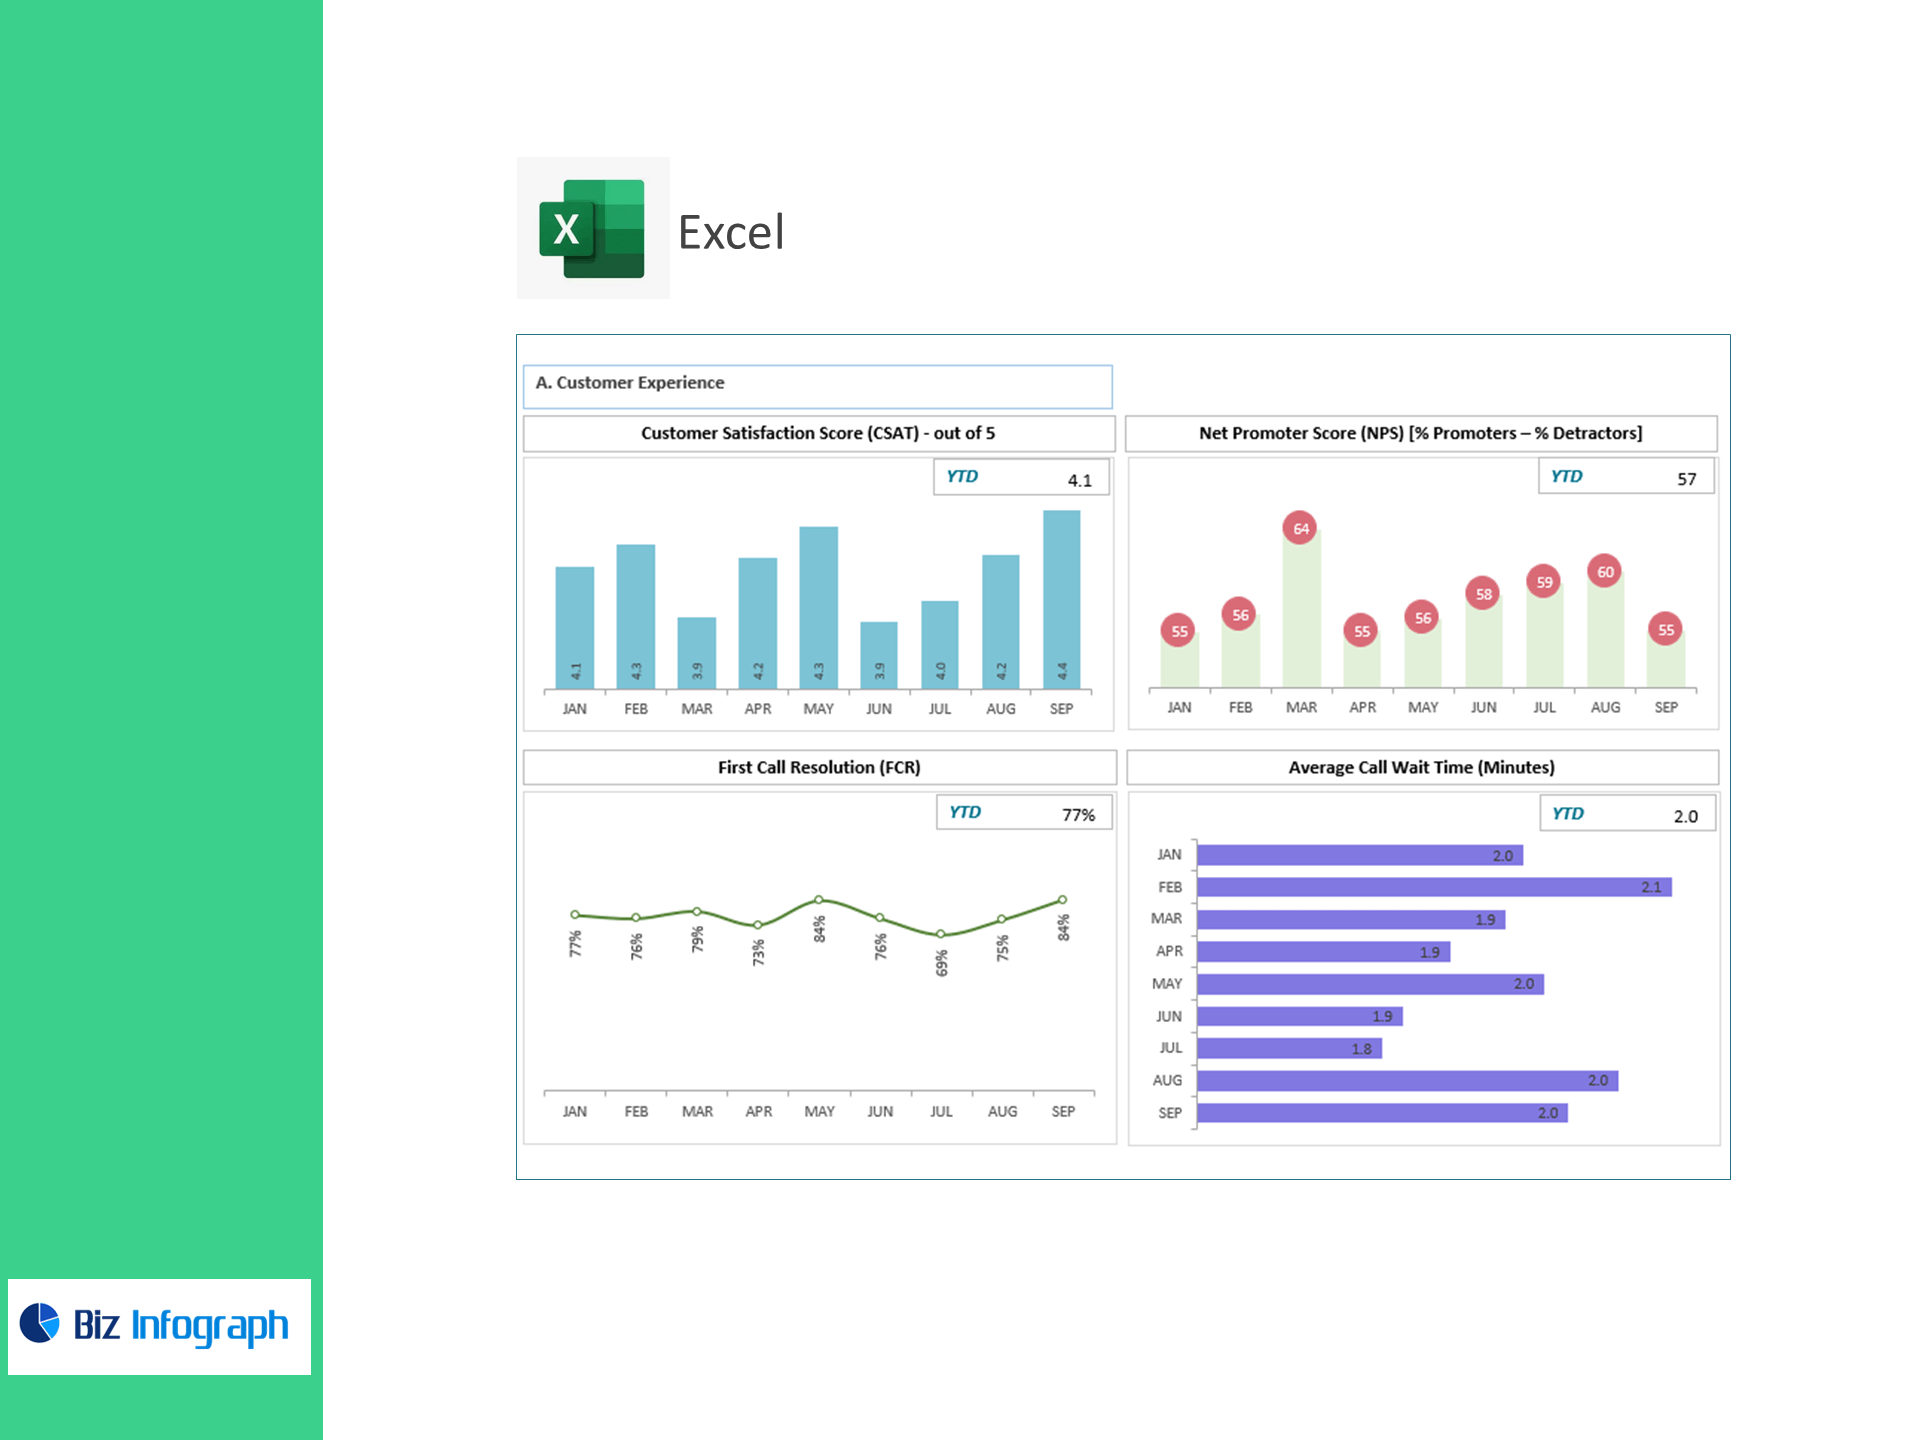
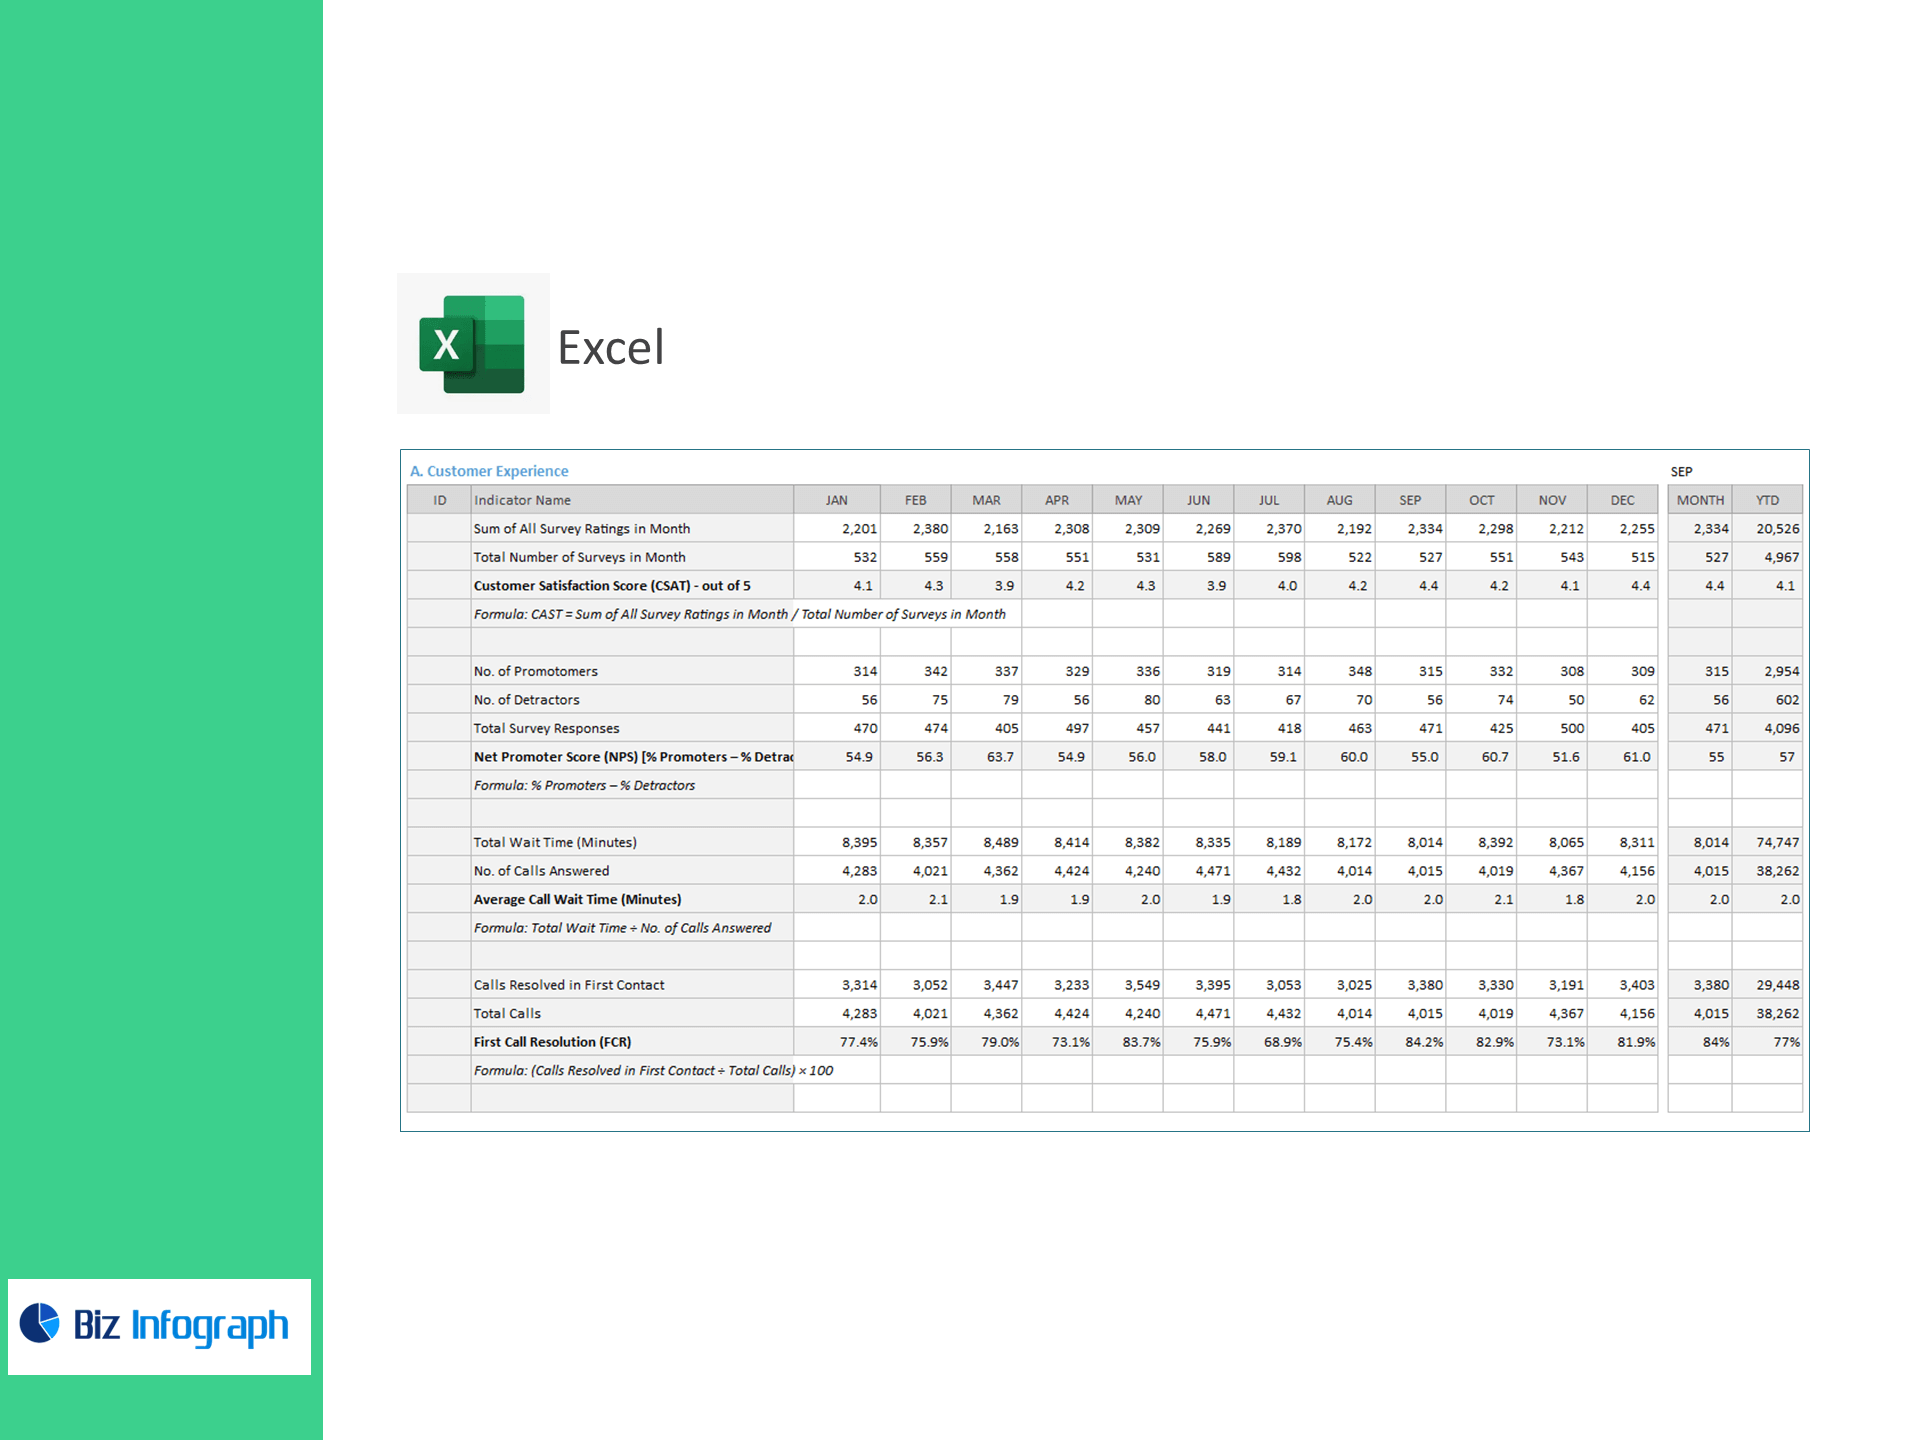
A) Customer Experience
-
Customer Satisfaction Score (CSAT) (out of 5)
CSAT = Sum of All Survey Ratings in Month ÷ Total Number of Surveys in Month -
Net Promoter Score (NPS)
NPS = % Promoters – % Detractors -
Average Call Wait Time (Minutes)
Total Wait Time ÷ No. of Calls Answered -
First Call Resolution (FCR) %
(Calls Resolved in First Contact ÷ Total Calls) × 100
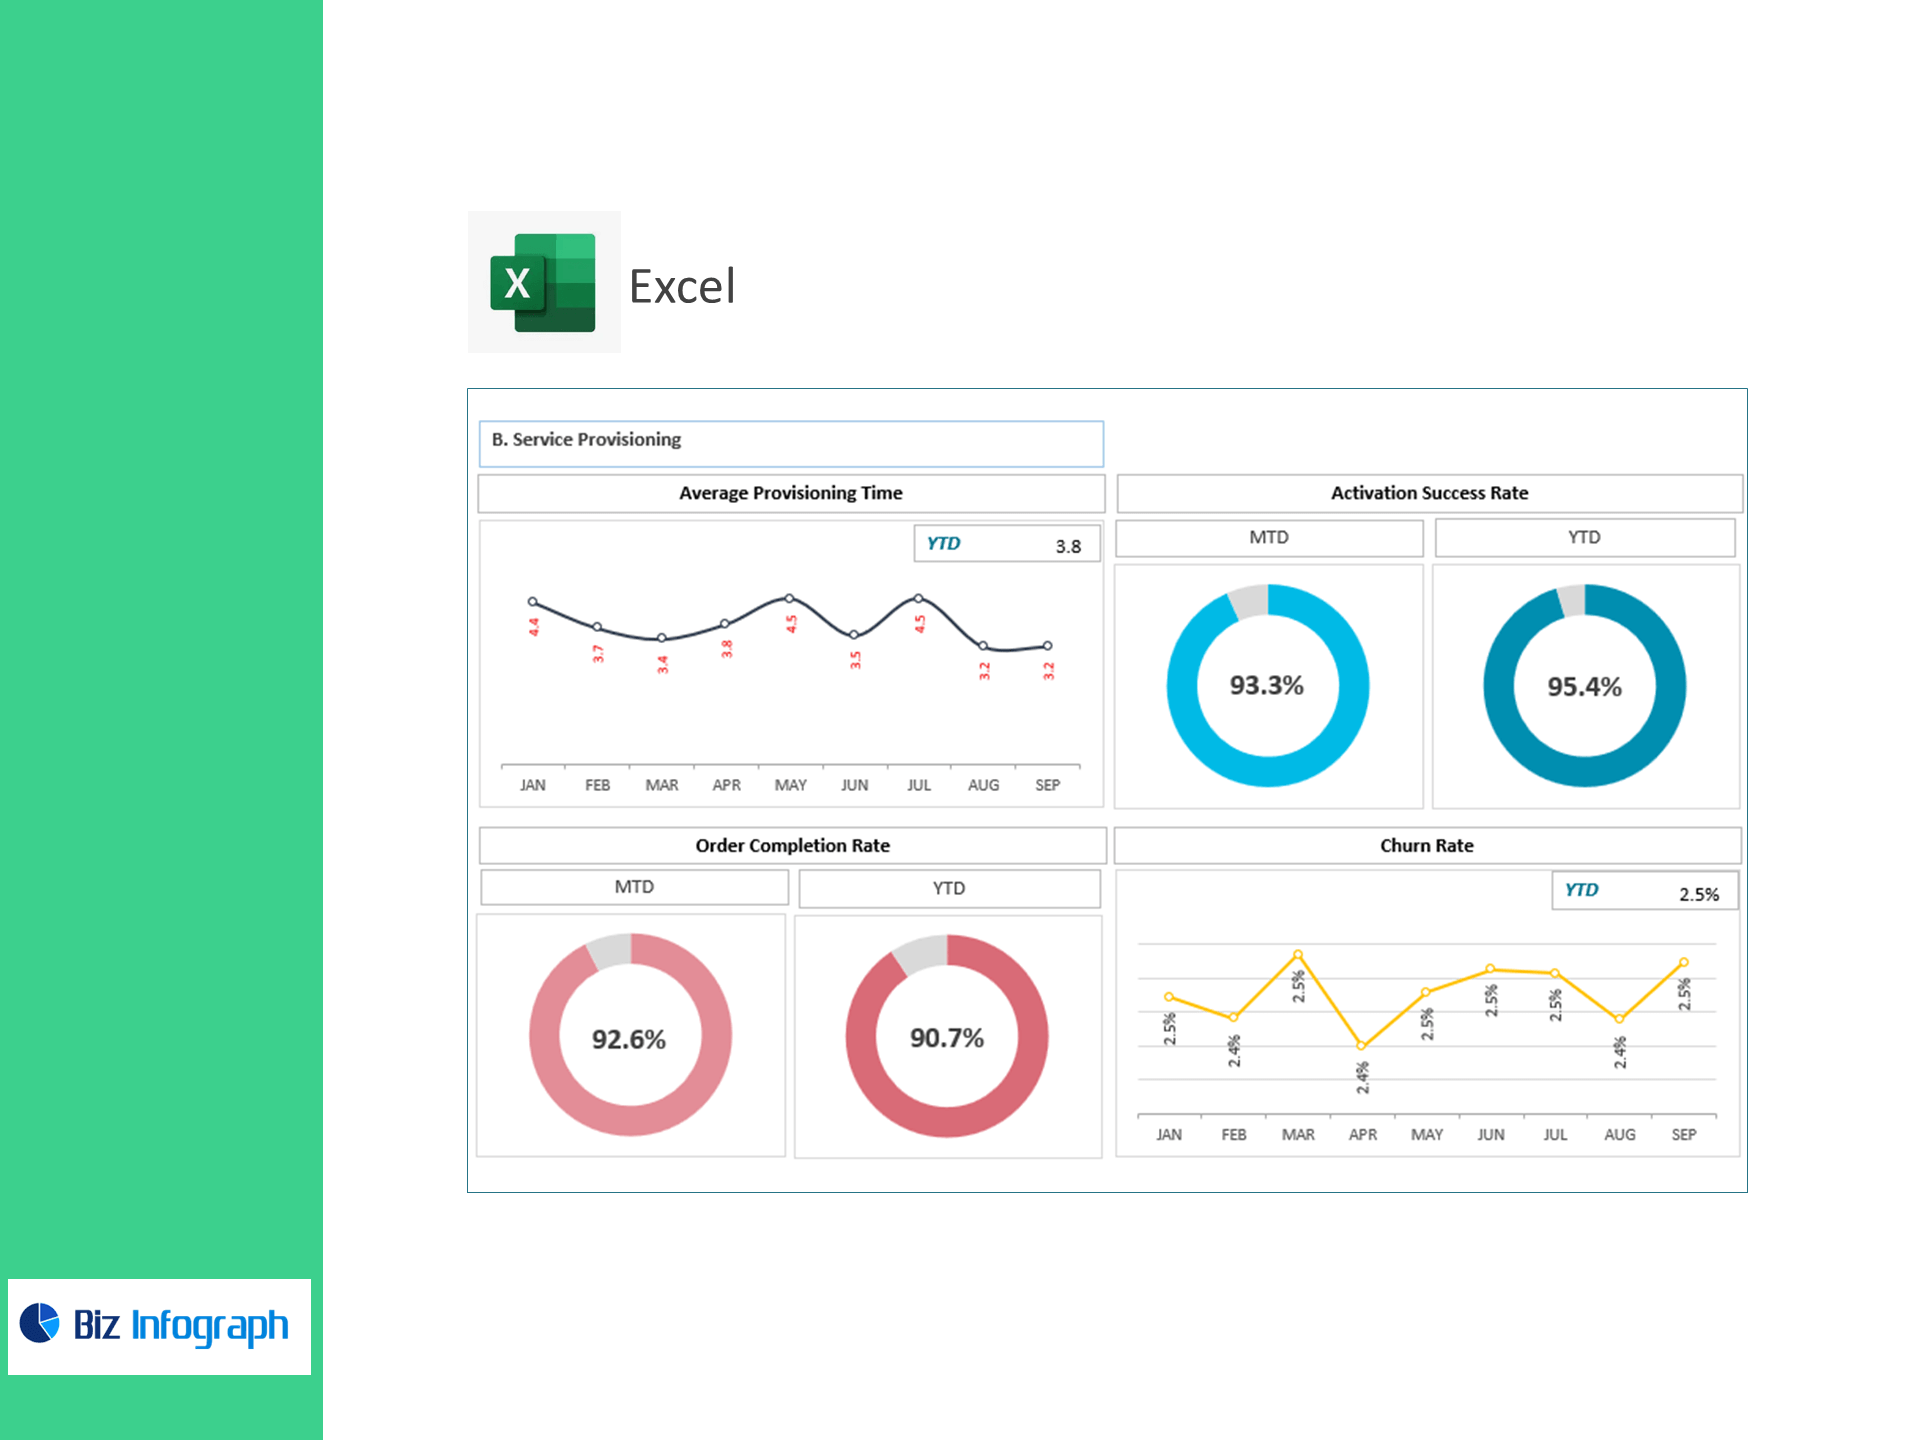
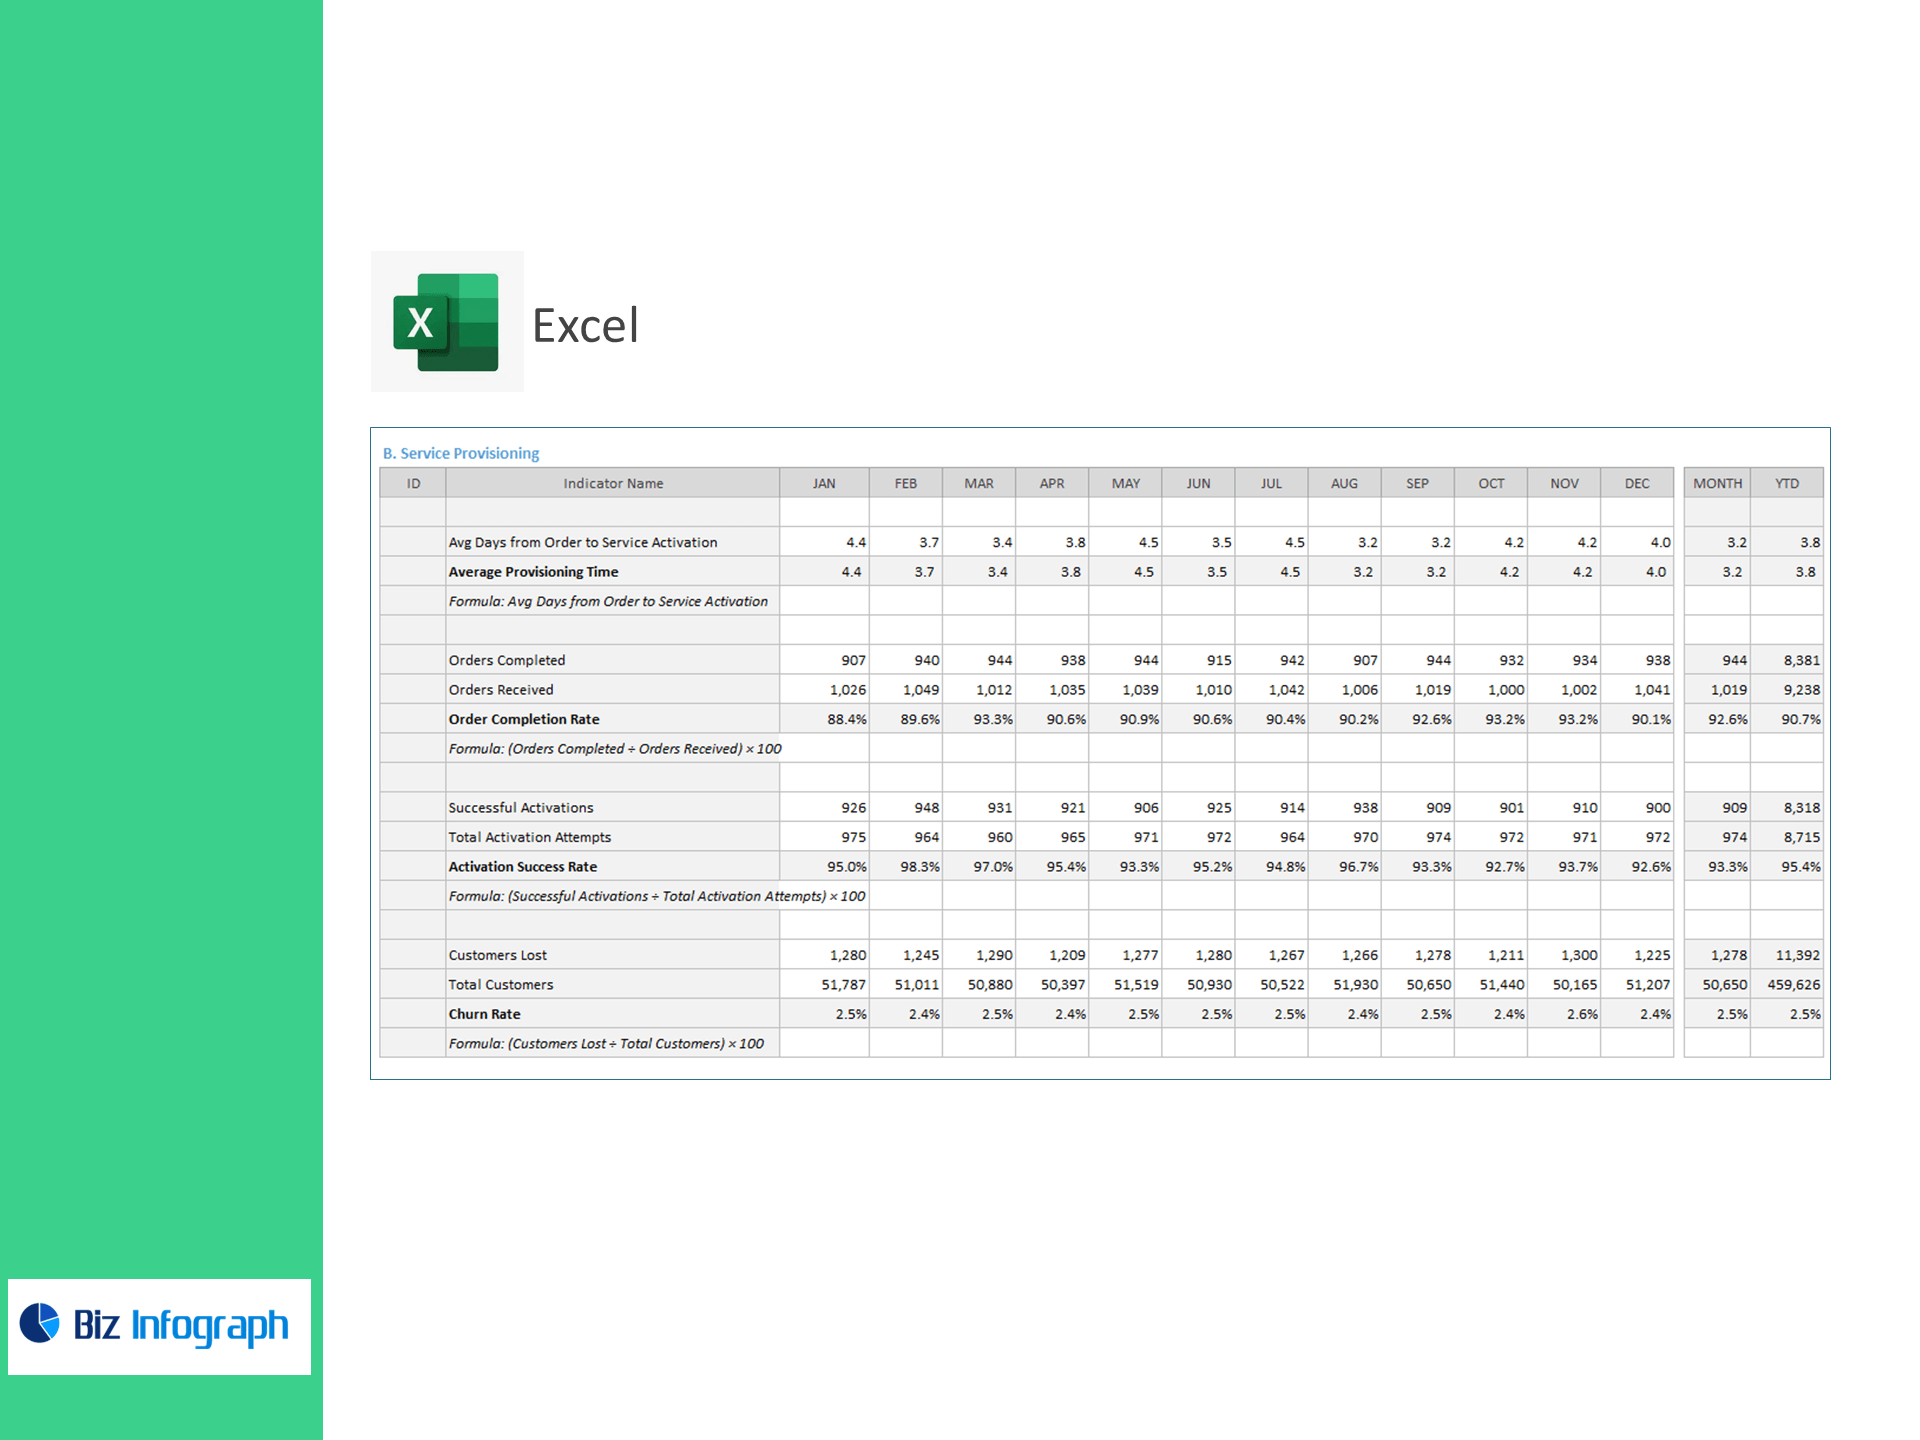
B) Service Provisioning
-
Average Provisioning Time (Days)
Avg Days from Order to Service Activation -
Order Completion Rate %
(Orders Completed ÷ Orders Received) × 100 -
Activation Success Rate %
(Successful Activations ÷ Total Activation Attempts) × 100 -
Churn Rate %
(Customers Lost ÷ Total Customers) × 100
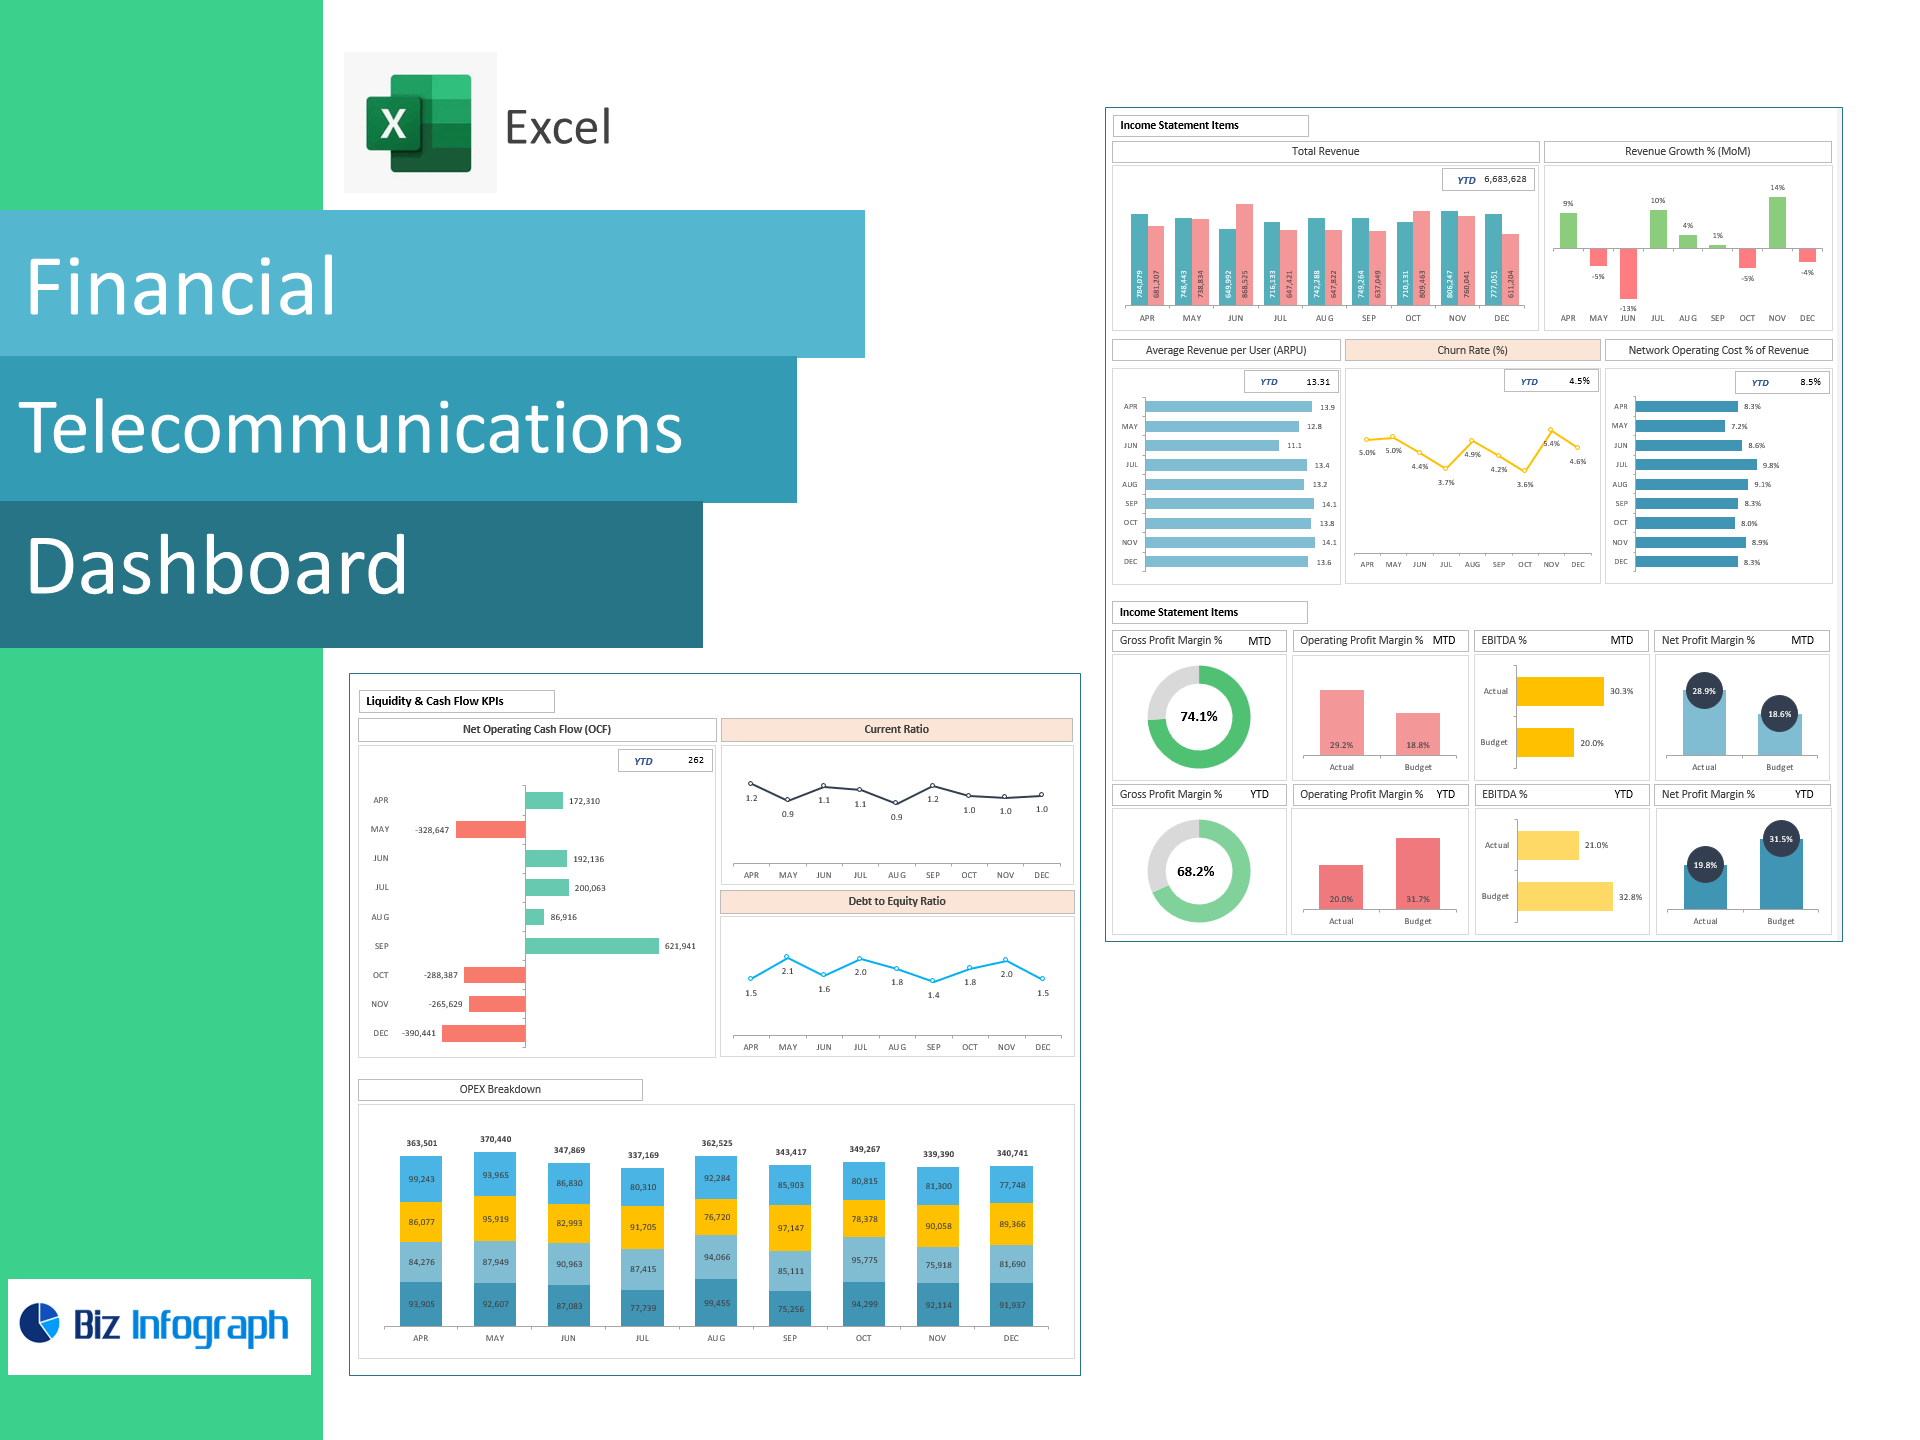
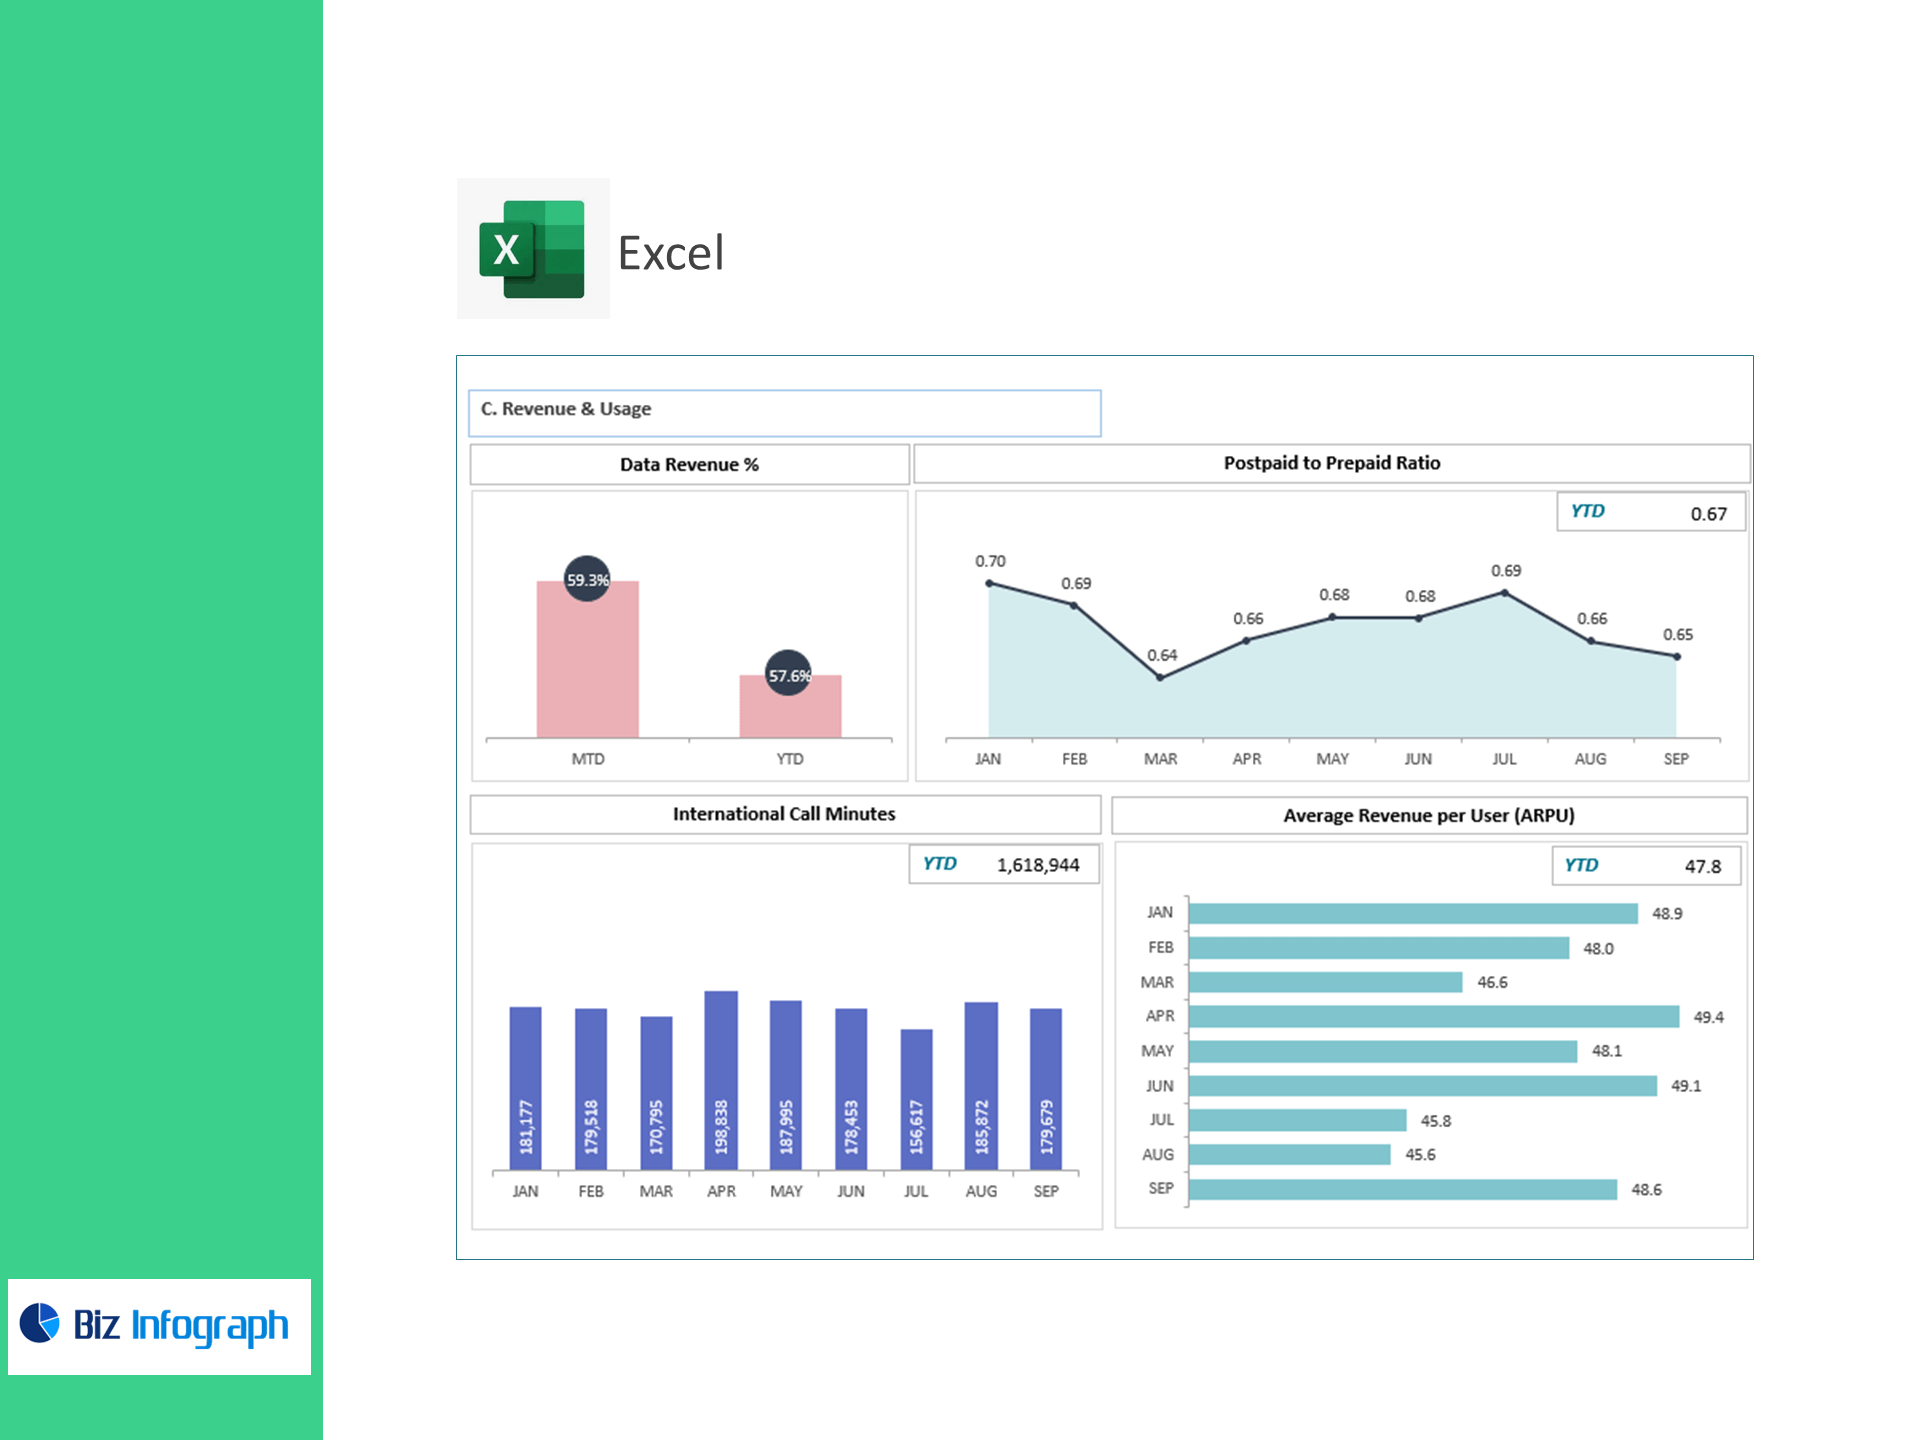
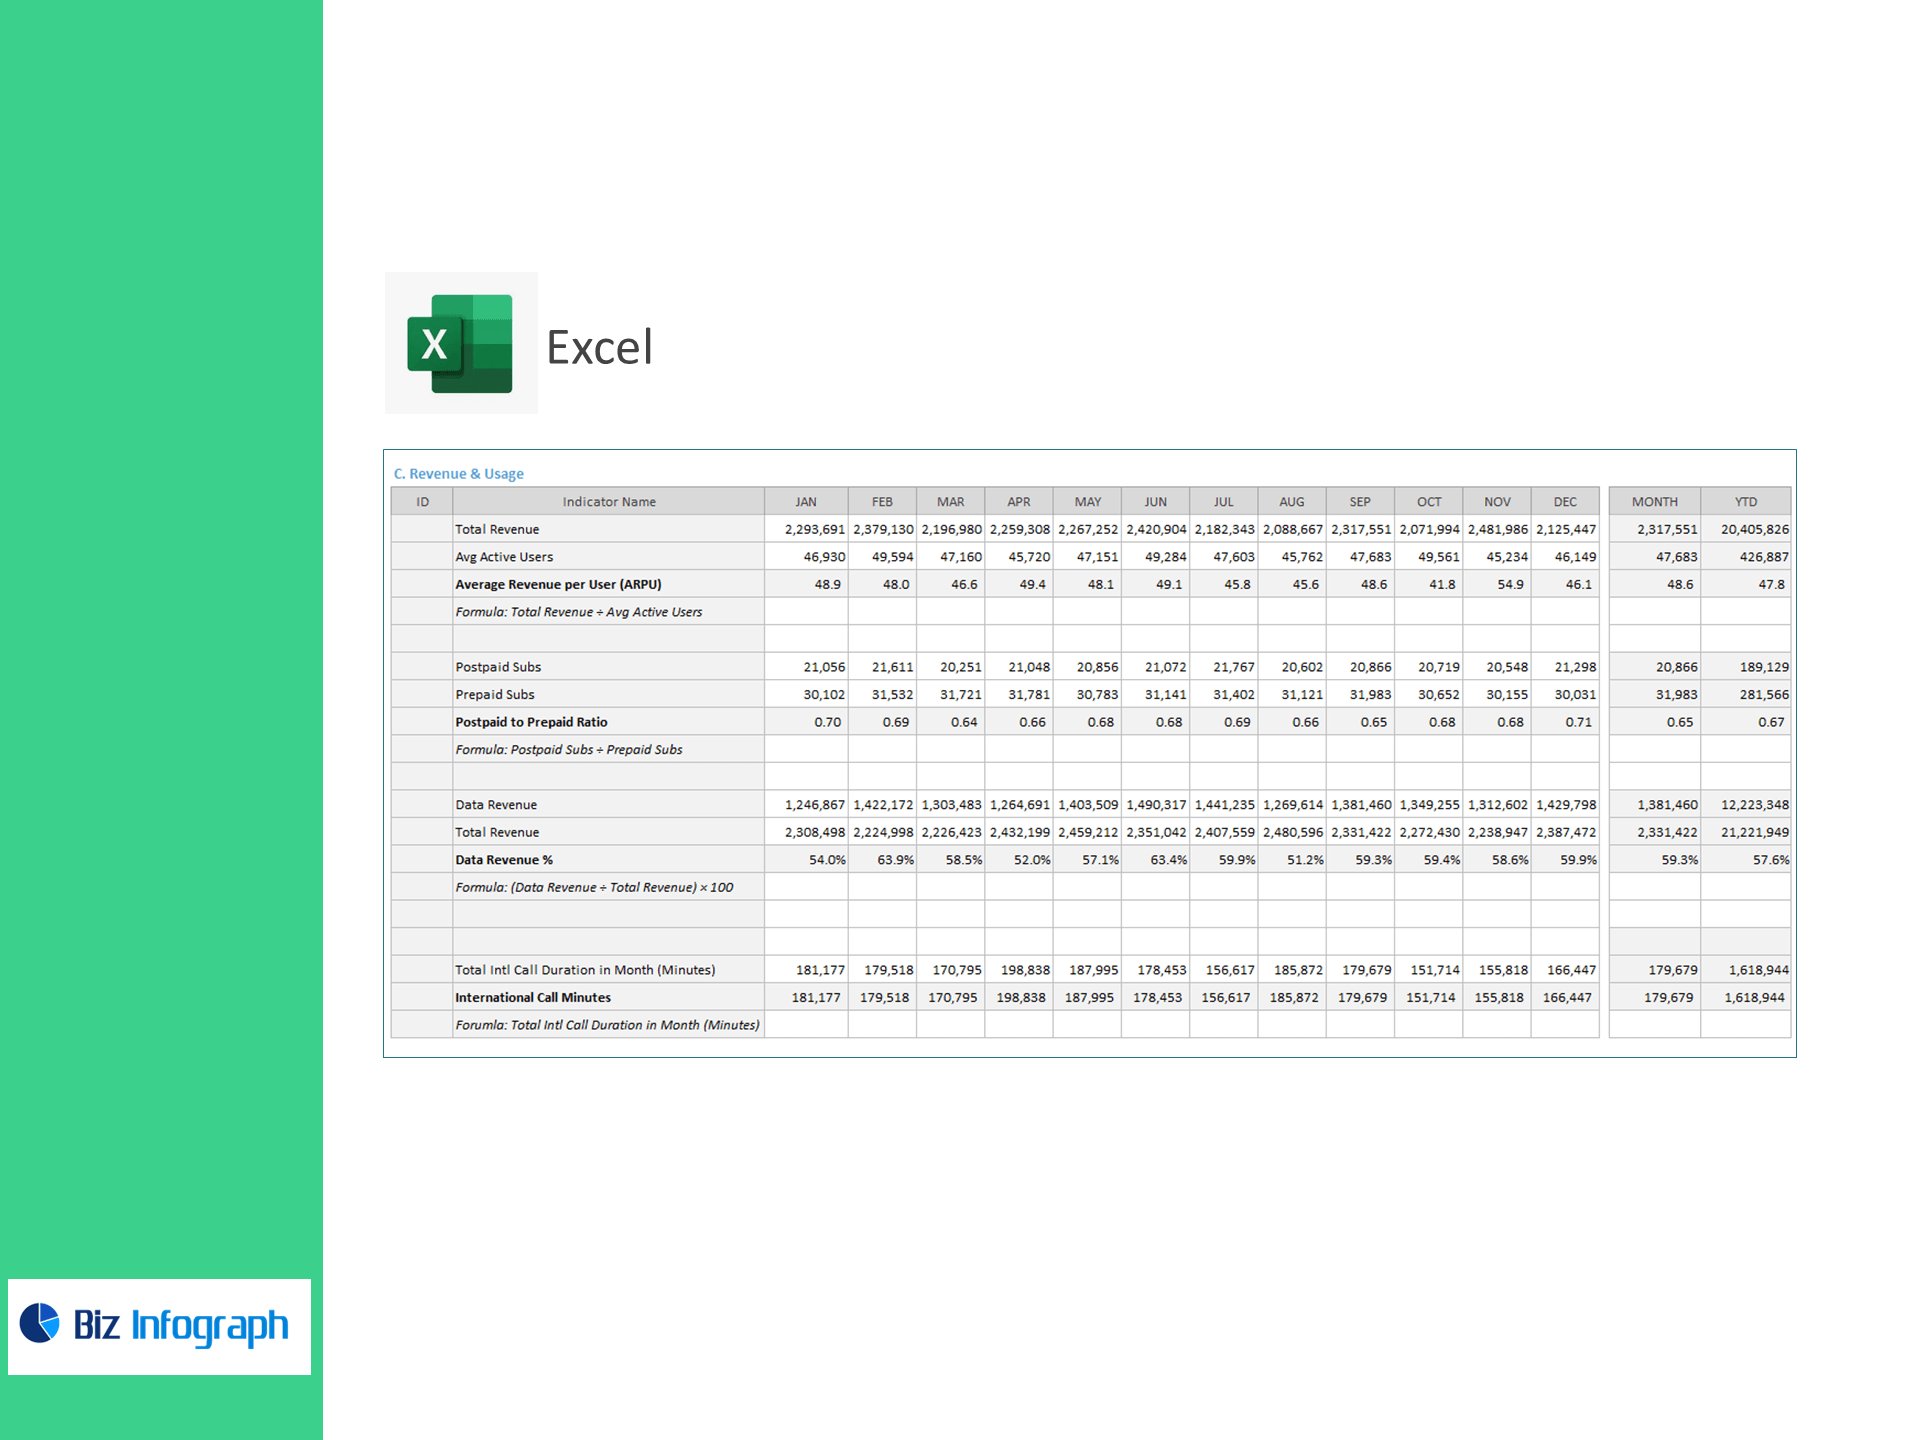
C) Revenue & Usage
-
Average Revenue per User (ARPU)
Total Revenue ÷ Avg Active Users -
Postpaid to Prepaid Ratio
Postpaid Subs ÷ Prepaid Subs -
Data Revenue %
(Data Revenue ÷ Total Revenue) × 100 -
International Call Minutes
Total Intl Call Duration in Month (Minutes)
What’s inside
-
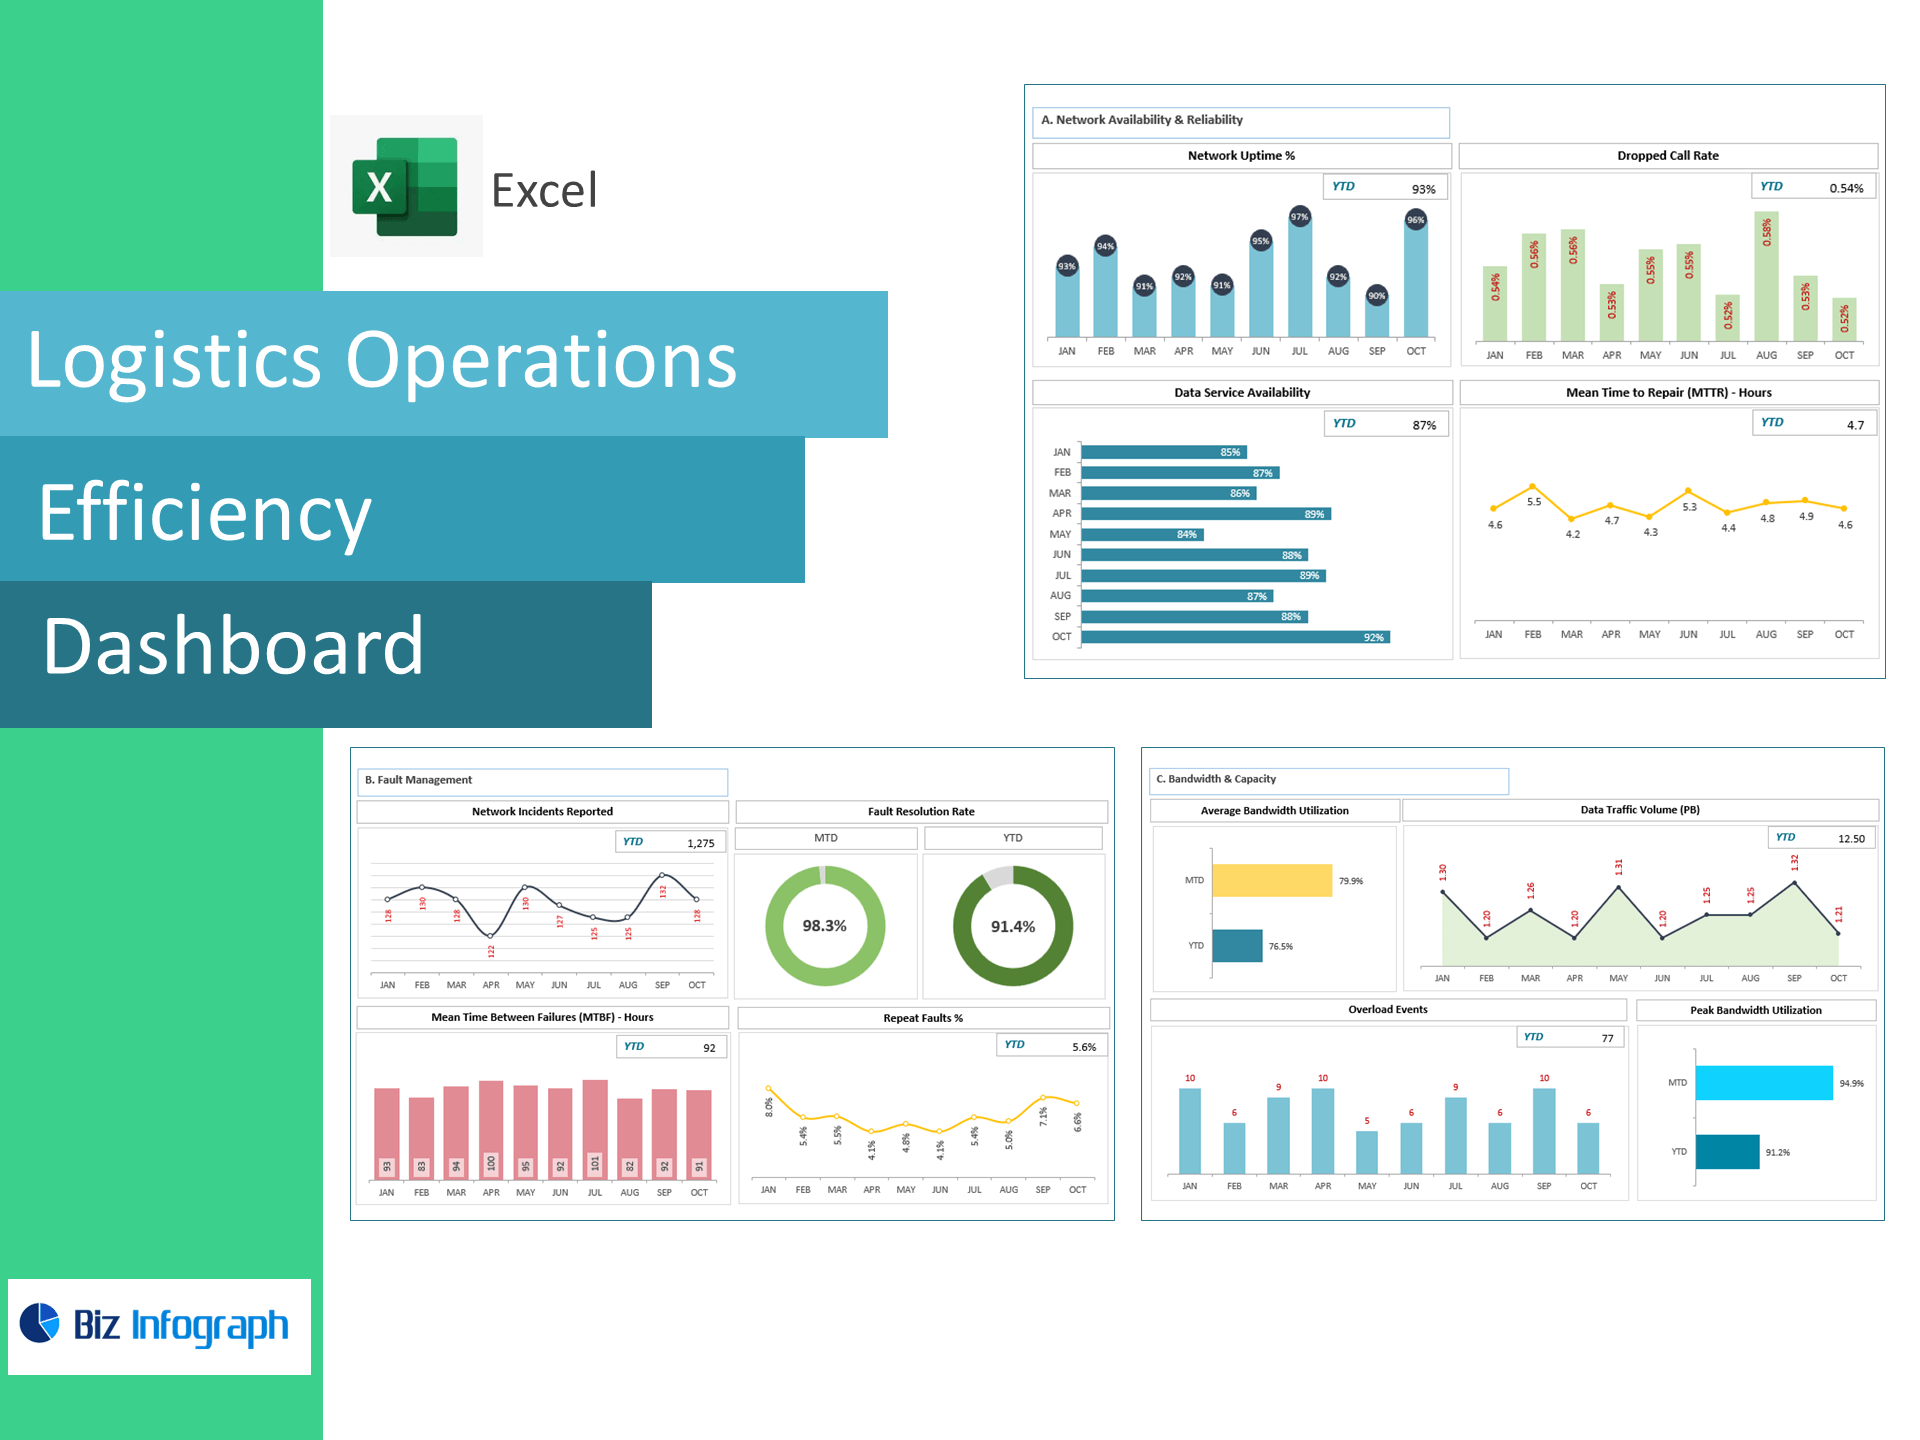
Executive Dashboard: CSAT, NPS, FCR, wait time, provisioning speed, activation rate, churn, ARPU, data revenue, Intl minutes—plus MoM/YoY trends and variance to target.
-
Data Entry Sheets: structured tables for surveys, contact center, orders, activations, base movement, and revenue.
-
KPI Engine: prebuilt calculations & error checks.
-
Settings & Targets: define thresholds, product hierarchies, and date ranges.
-
Print-ready views: export to PDF for QBRs and ops reviews.
For ready-to-use Dashboard Templates: