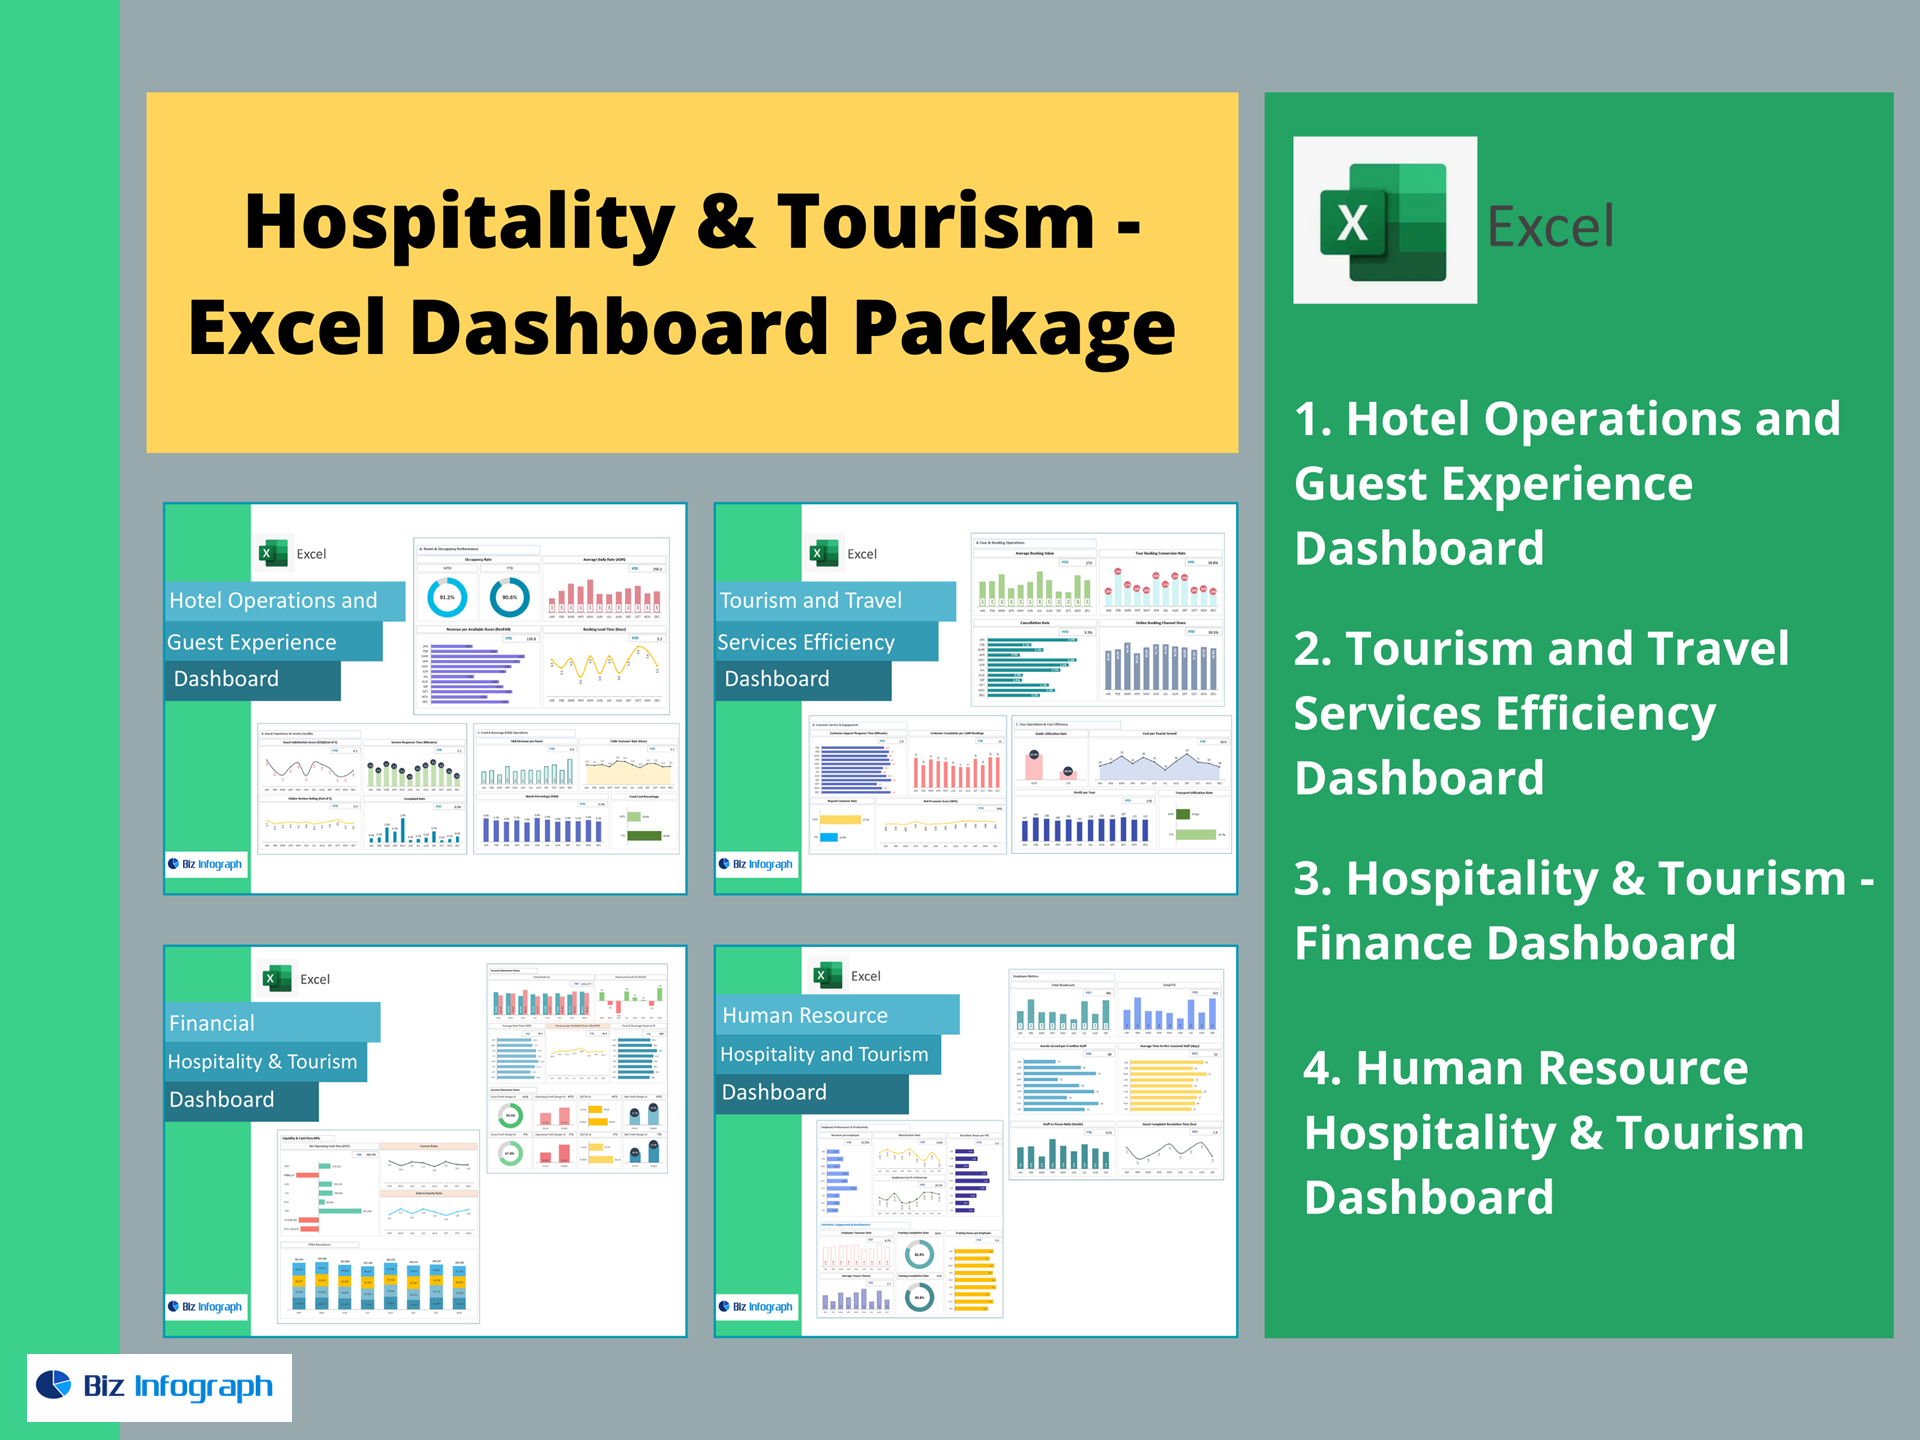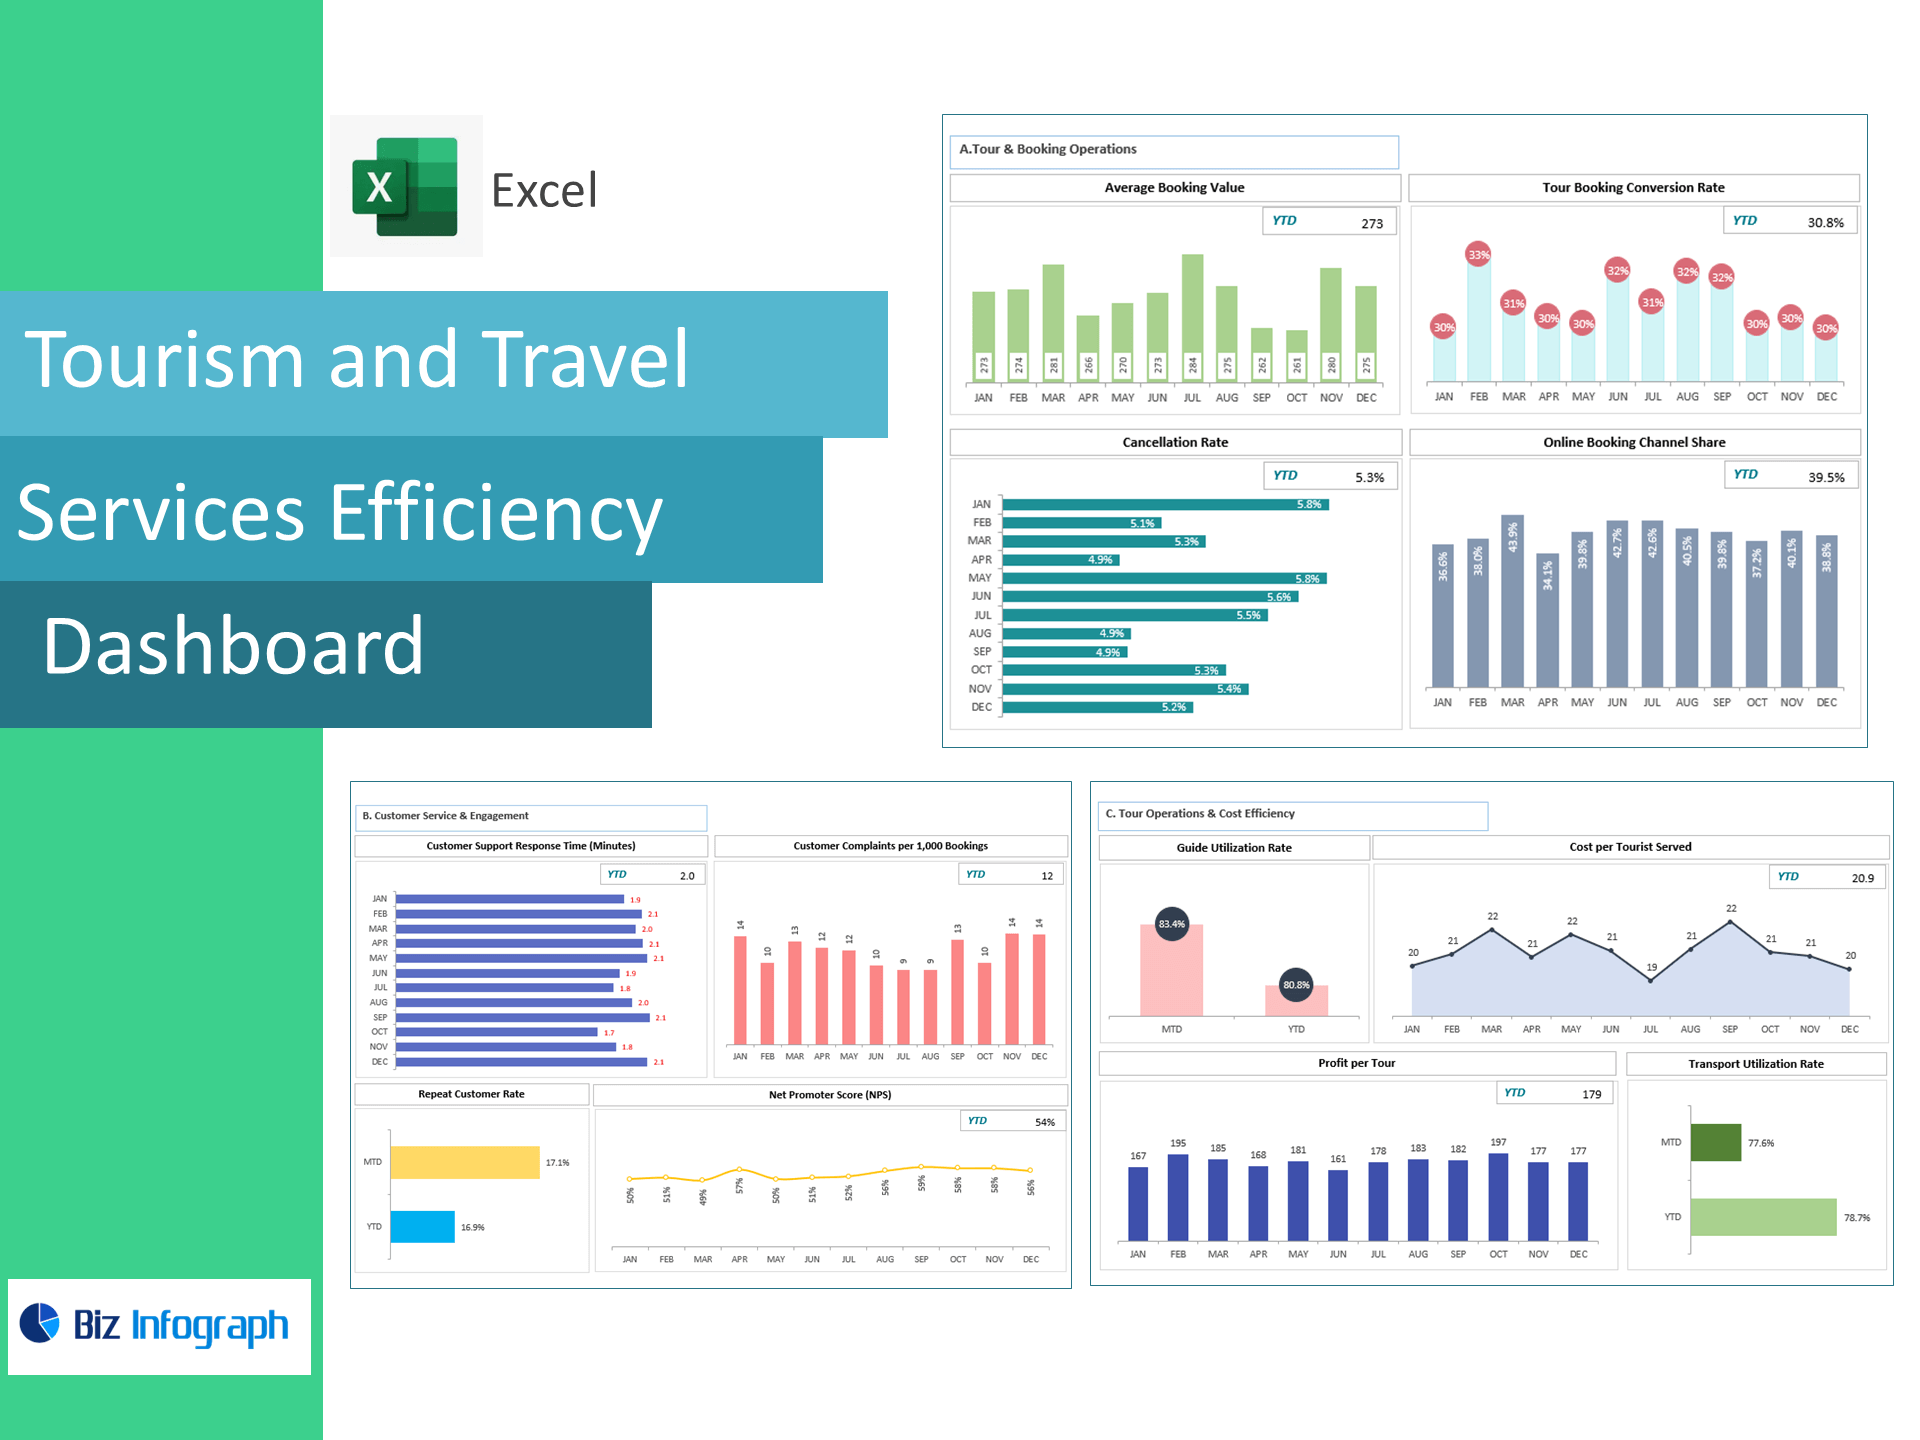
Tourism & Travel Services Efficiency Dashboard — Excel Template
Convert inquiries into bookings, delight travelers, and run profitable tours—right in Excel. This template turns CRM, OTA, and ops exports into a live dashboard tracking Booking Conversion Rate, Average Booking Value, Cancellation Rate, Online Booking Channel Share, Support Response Time, NPS, Repeat Customer Rate, Complaints per 1,000 Bookings, Guide Utilization, Transport Utilization, Cost per Tourist Served, and Profit per Tour—so you can scale demand and efficiency together.
Why travel operators choose this template
-
Sales + service + ops in one view: See how marketing channels and response speed impact bookings and repeat customers.
-
Profit-first routing: Monitor cost per tourist and profit per tour to optimize schedules and pricing.
-
Excel-native: Paste CSVs from your CRM/OTA/ticketing system—no add-ins or BI setup required.
KPIs included (ready-made formulas)
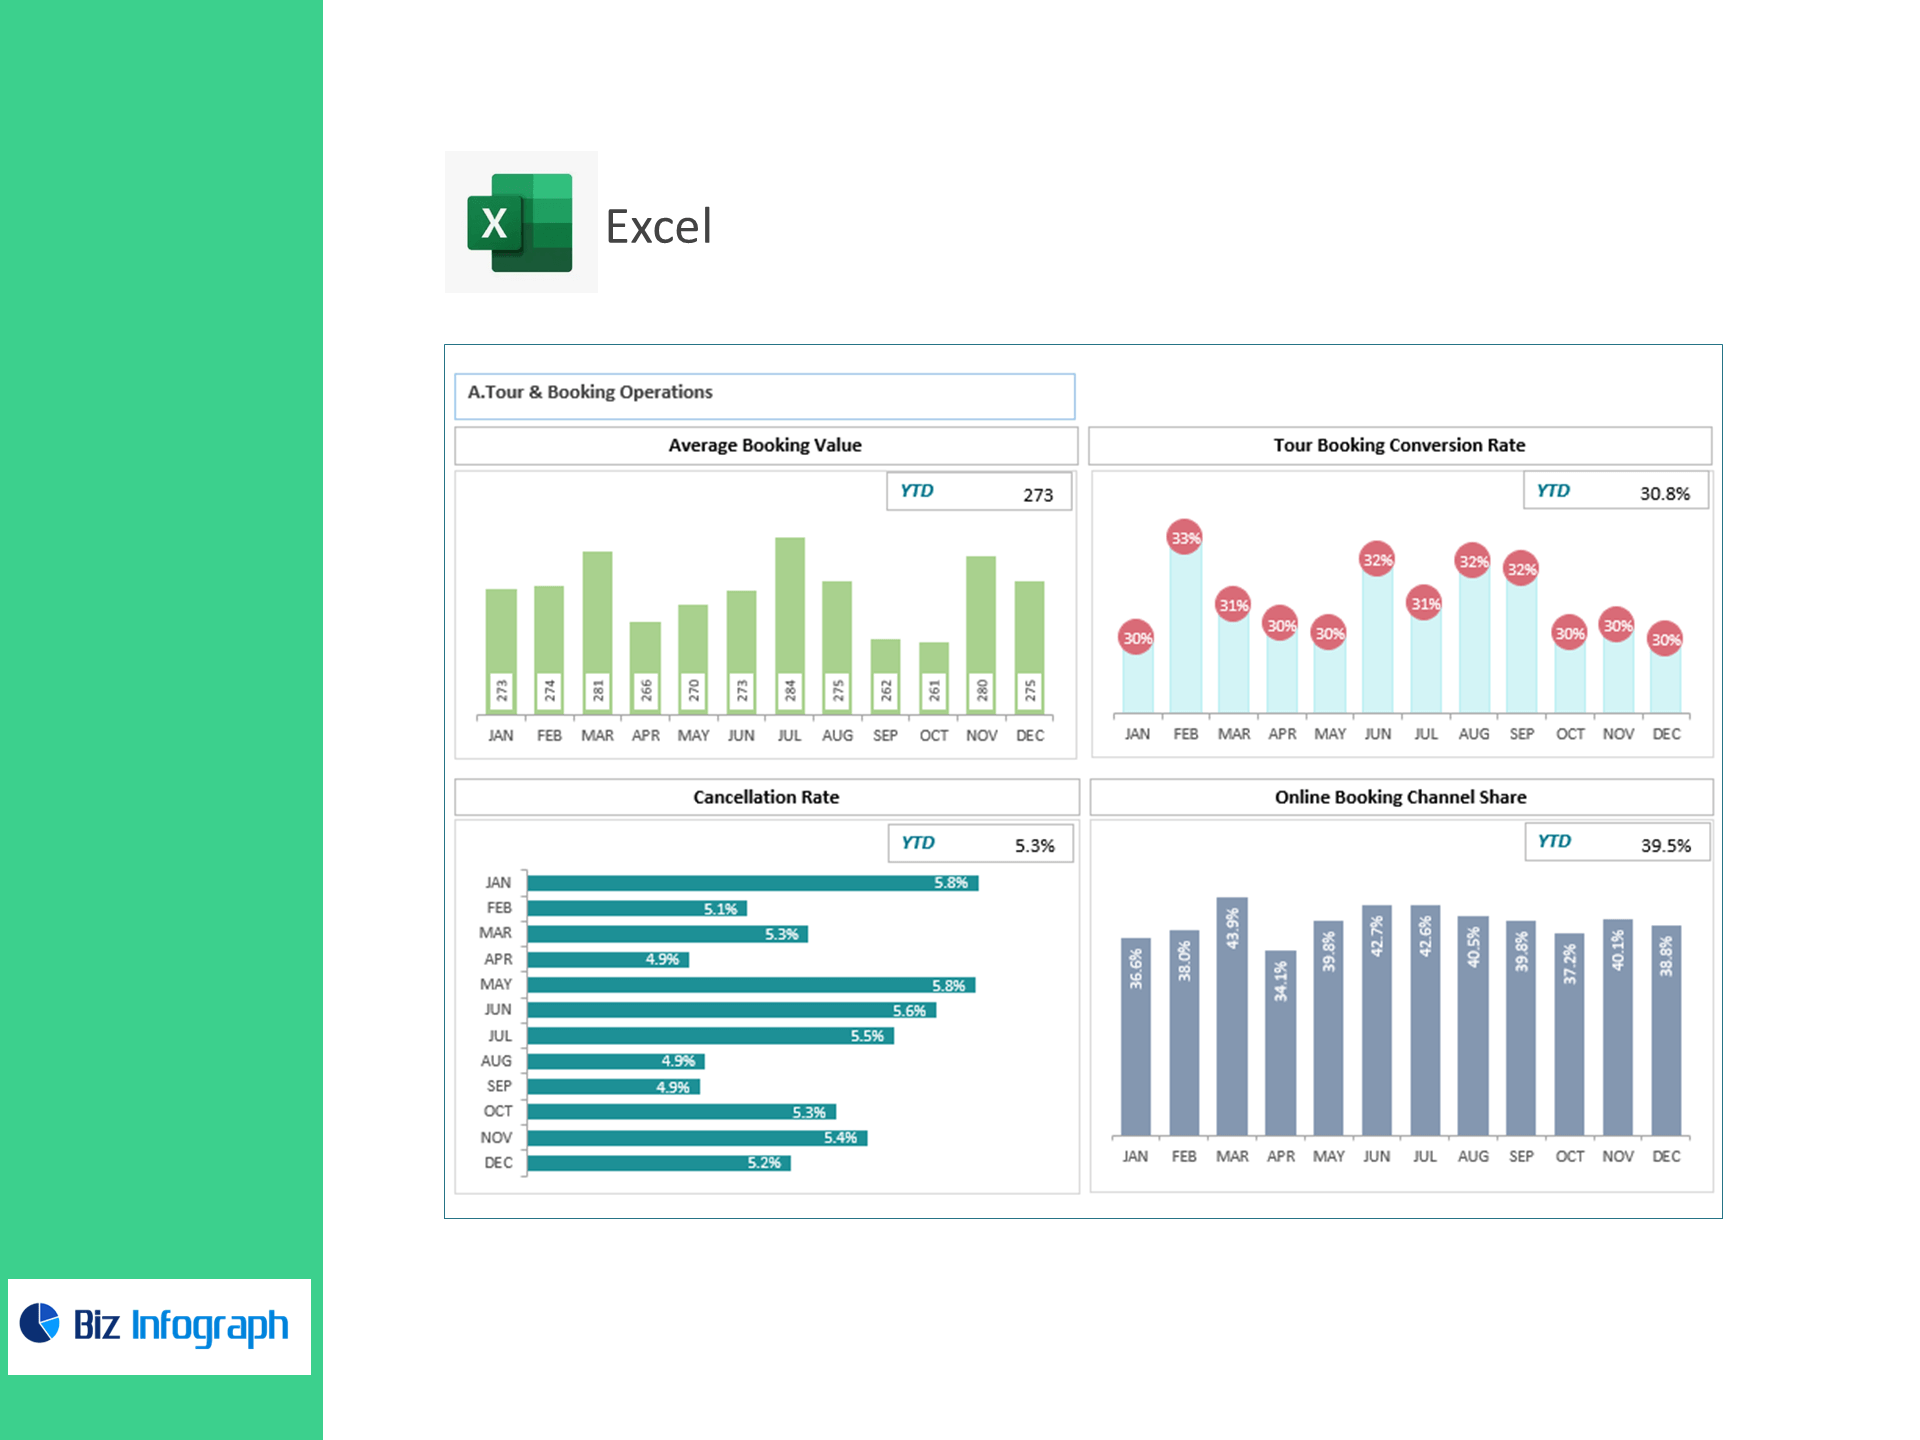
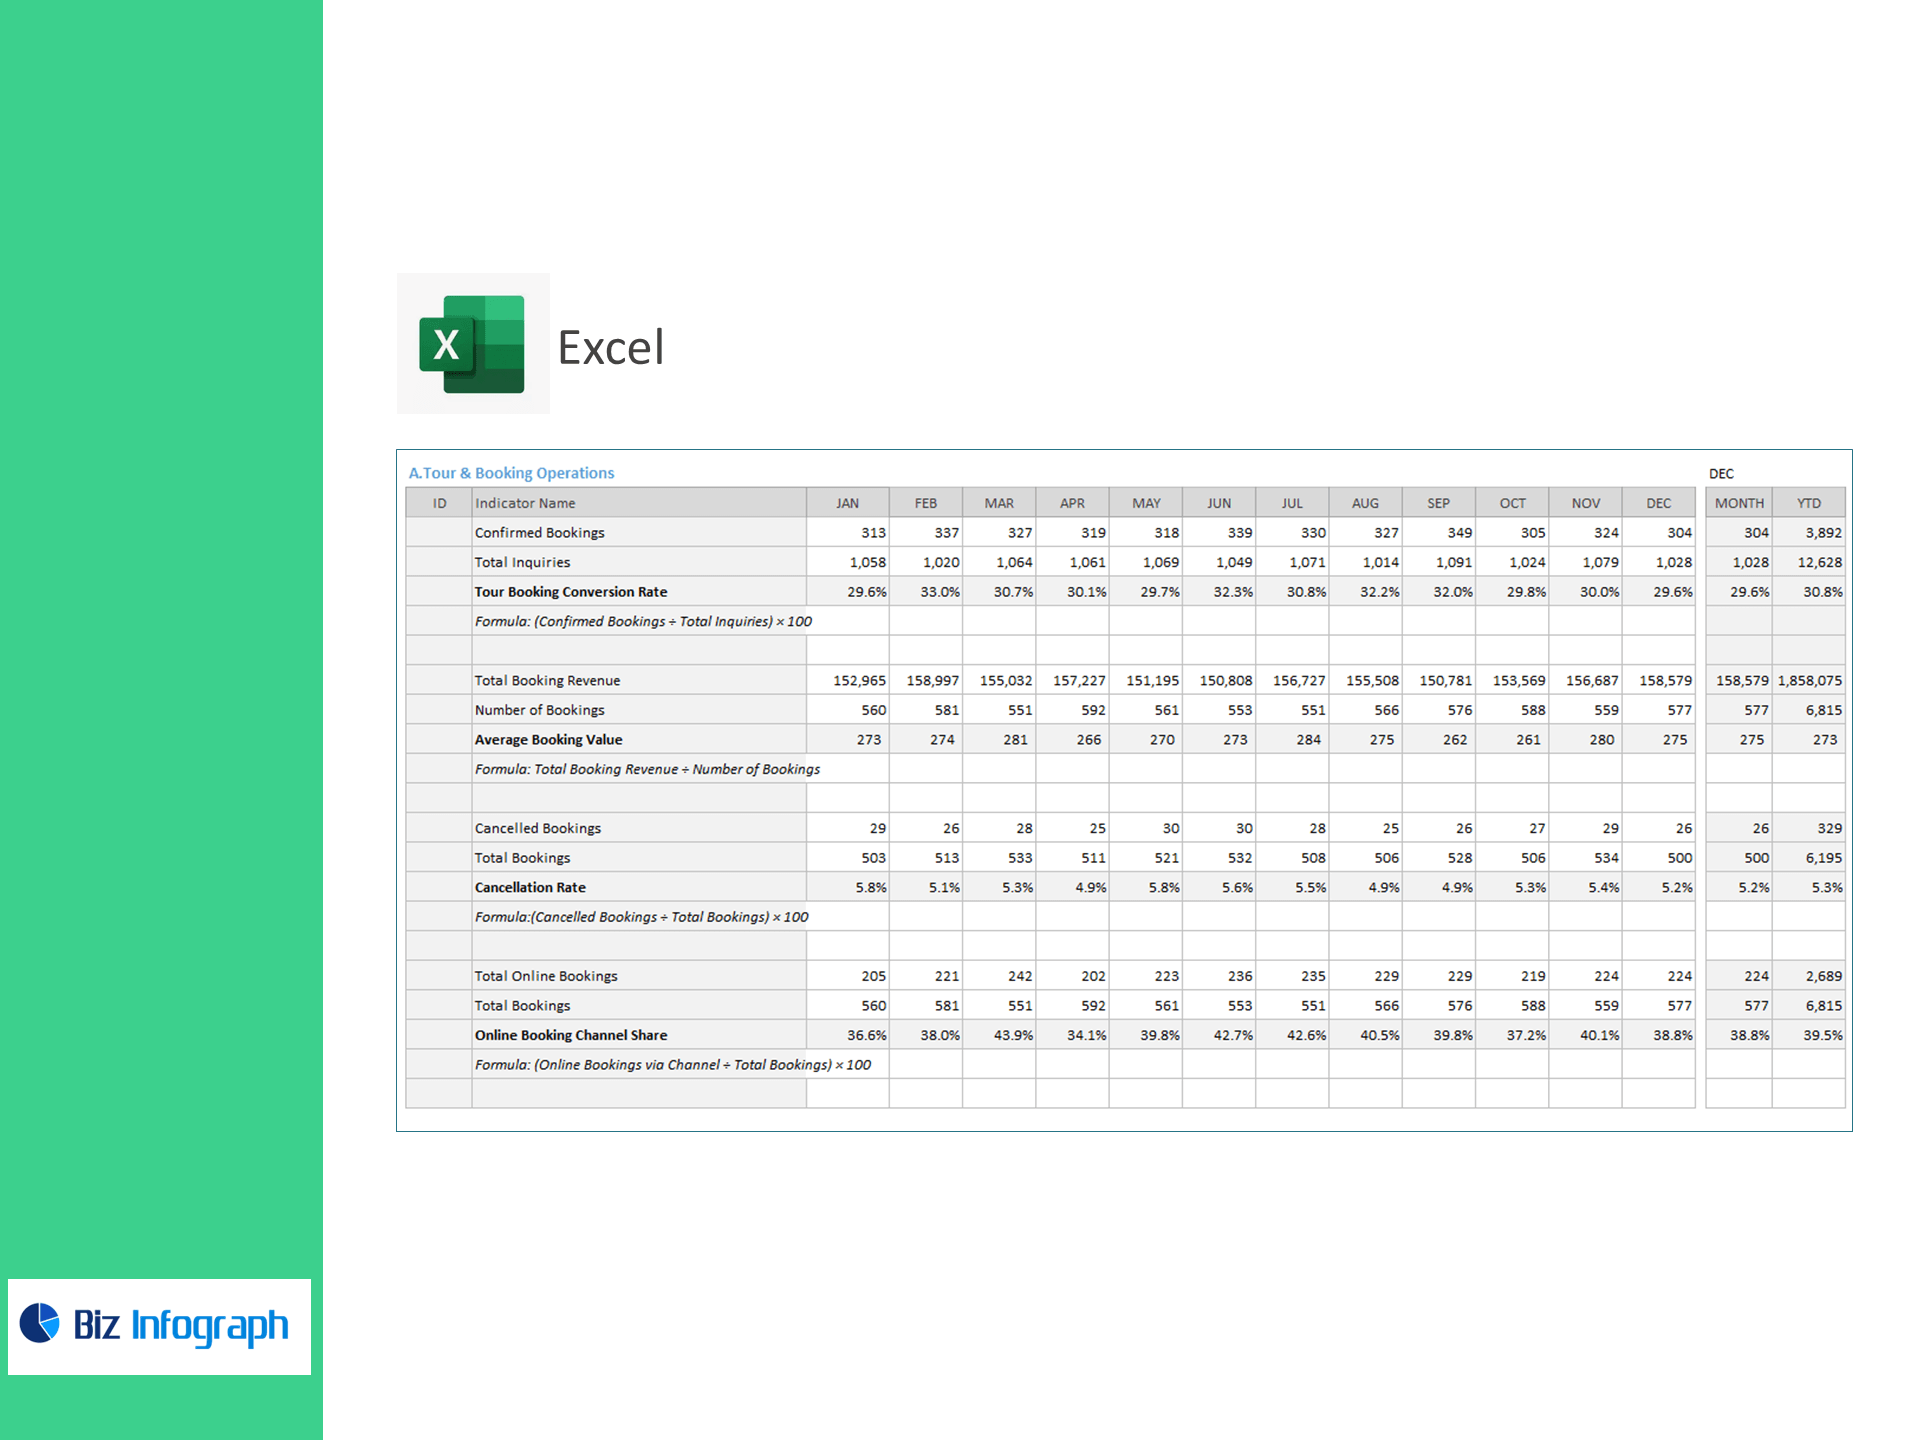
A) Tour & Booking Operations
-
Tour Booking Conversion Rate (%) = Confirmed Bookings ÷ Inquiries × 100
-
Average Booking Value = Total Booking Revenue ÷ Number of Bookings
-
Cancellation Rate (%) = Cancelled Bookings ÷ Total Bookings × 100
-
Online Booking Channel Share (%) = Online Bookings via Channel ÷ Total Bookings × 100
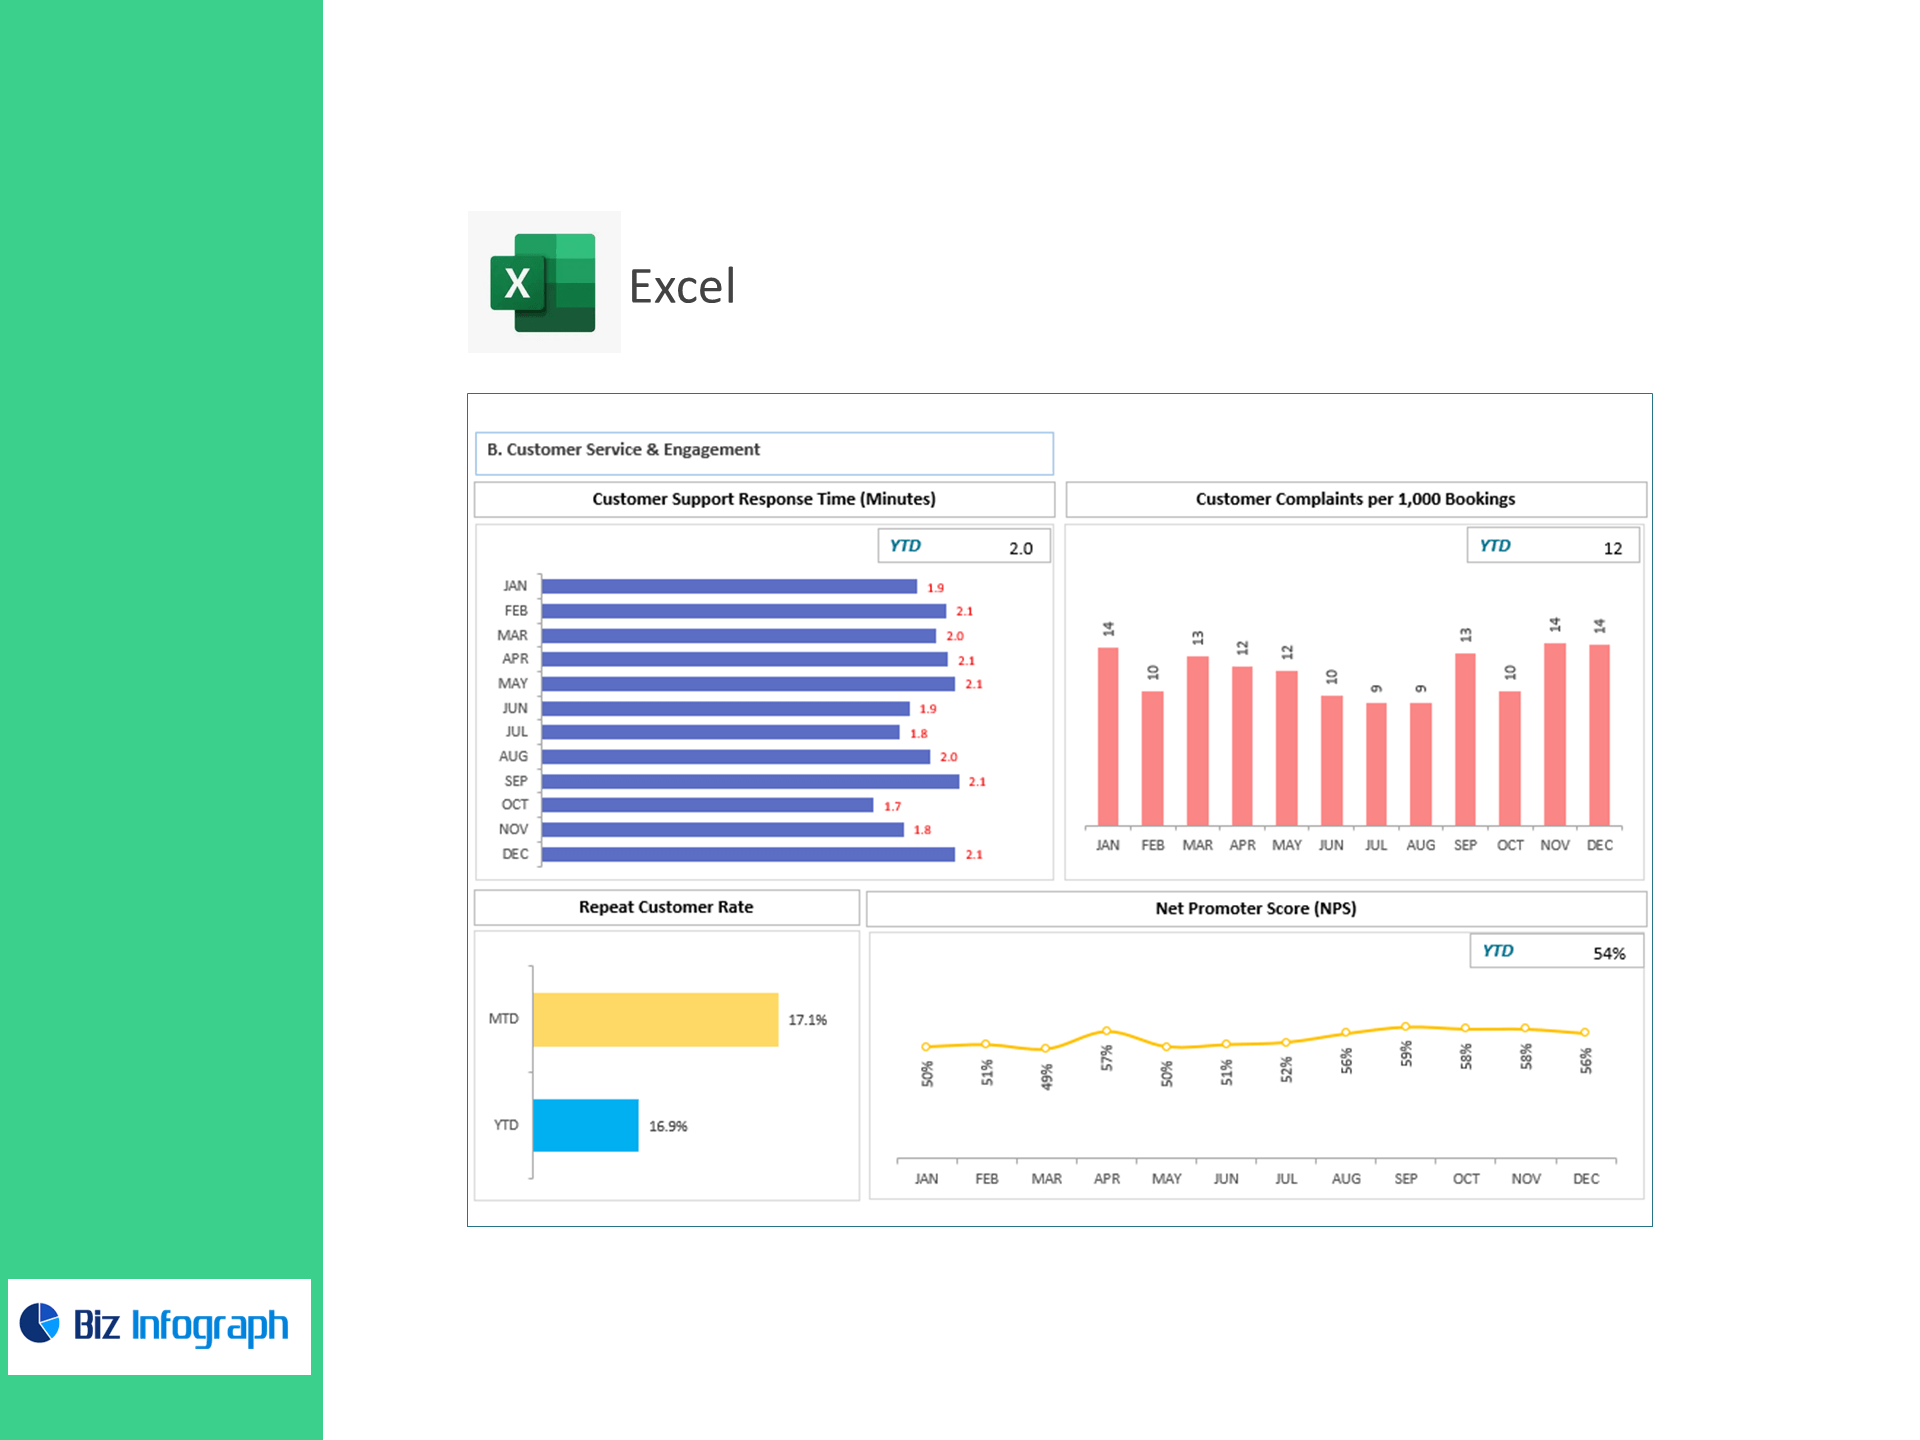
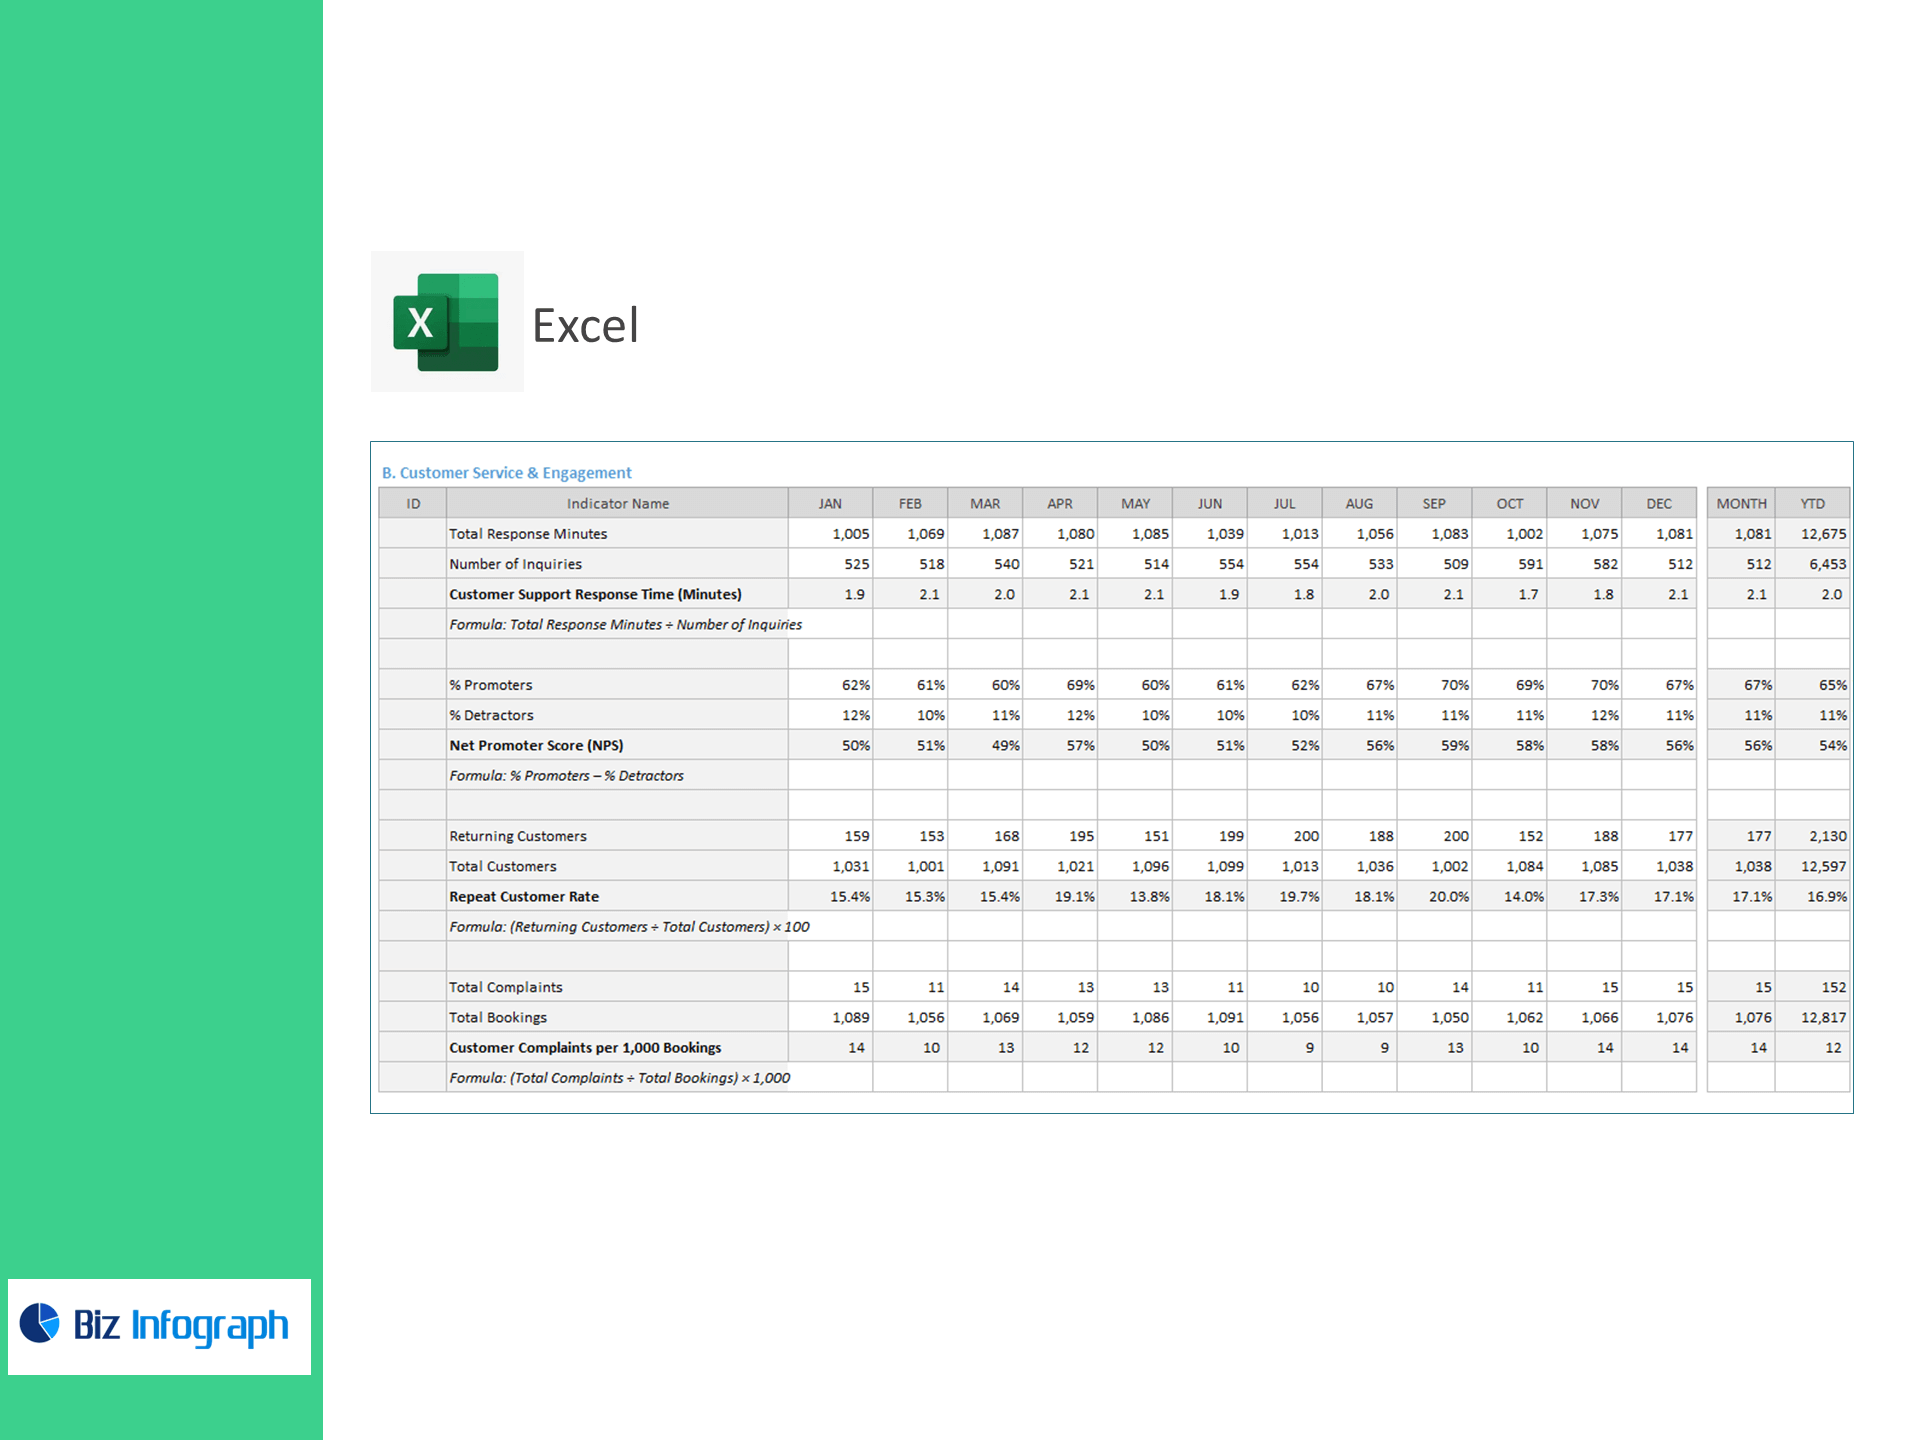
B) Customer Service & Engagement
-
Customer Support Response Time (mins) = Total Response Minutes ÷ Inquiries
-
Net Promoter Score (NPS) = % Promoters − % Detractors
-
Repeat Customer Rate (%) = Returning Customers ÷ Total Customers × 100
-
Complaints per 1,000 Bookings = Total Complaints ÷ Total Bookings × 1,000
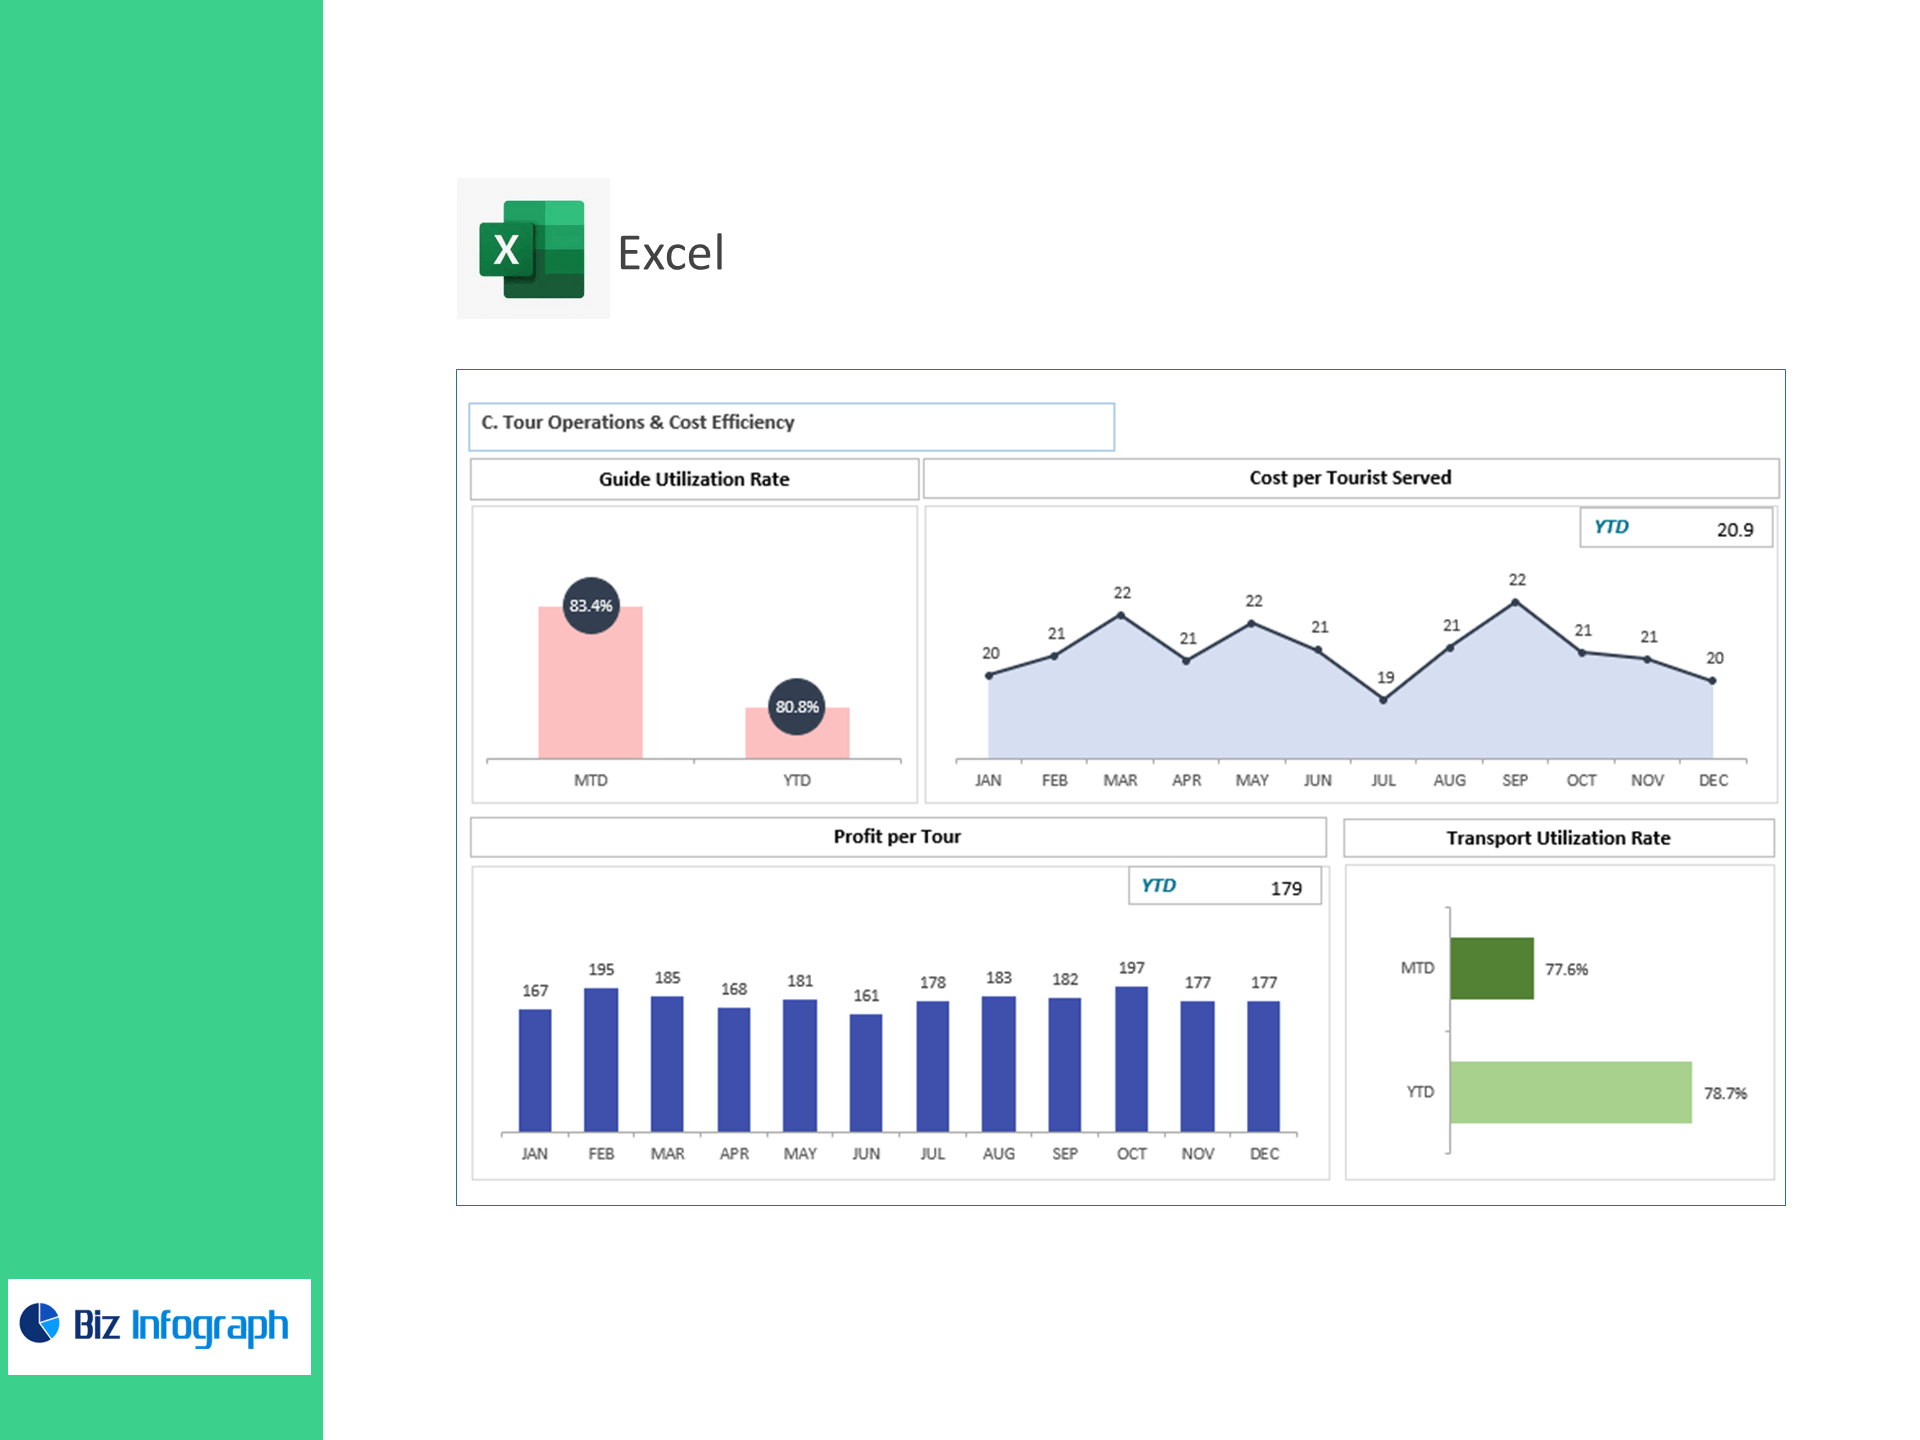
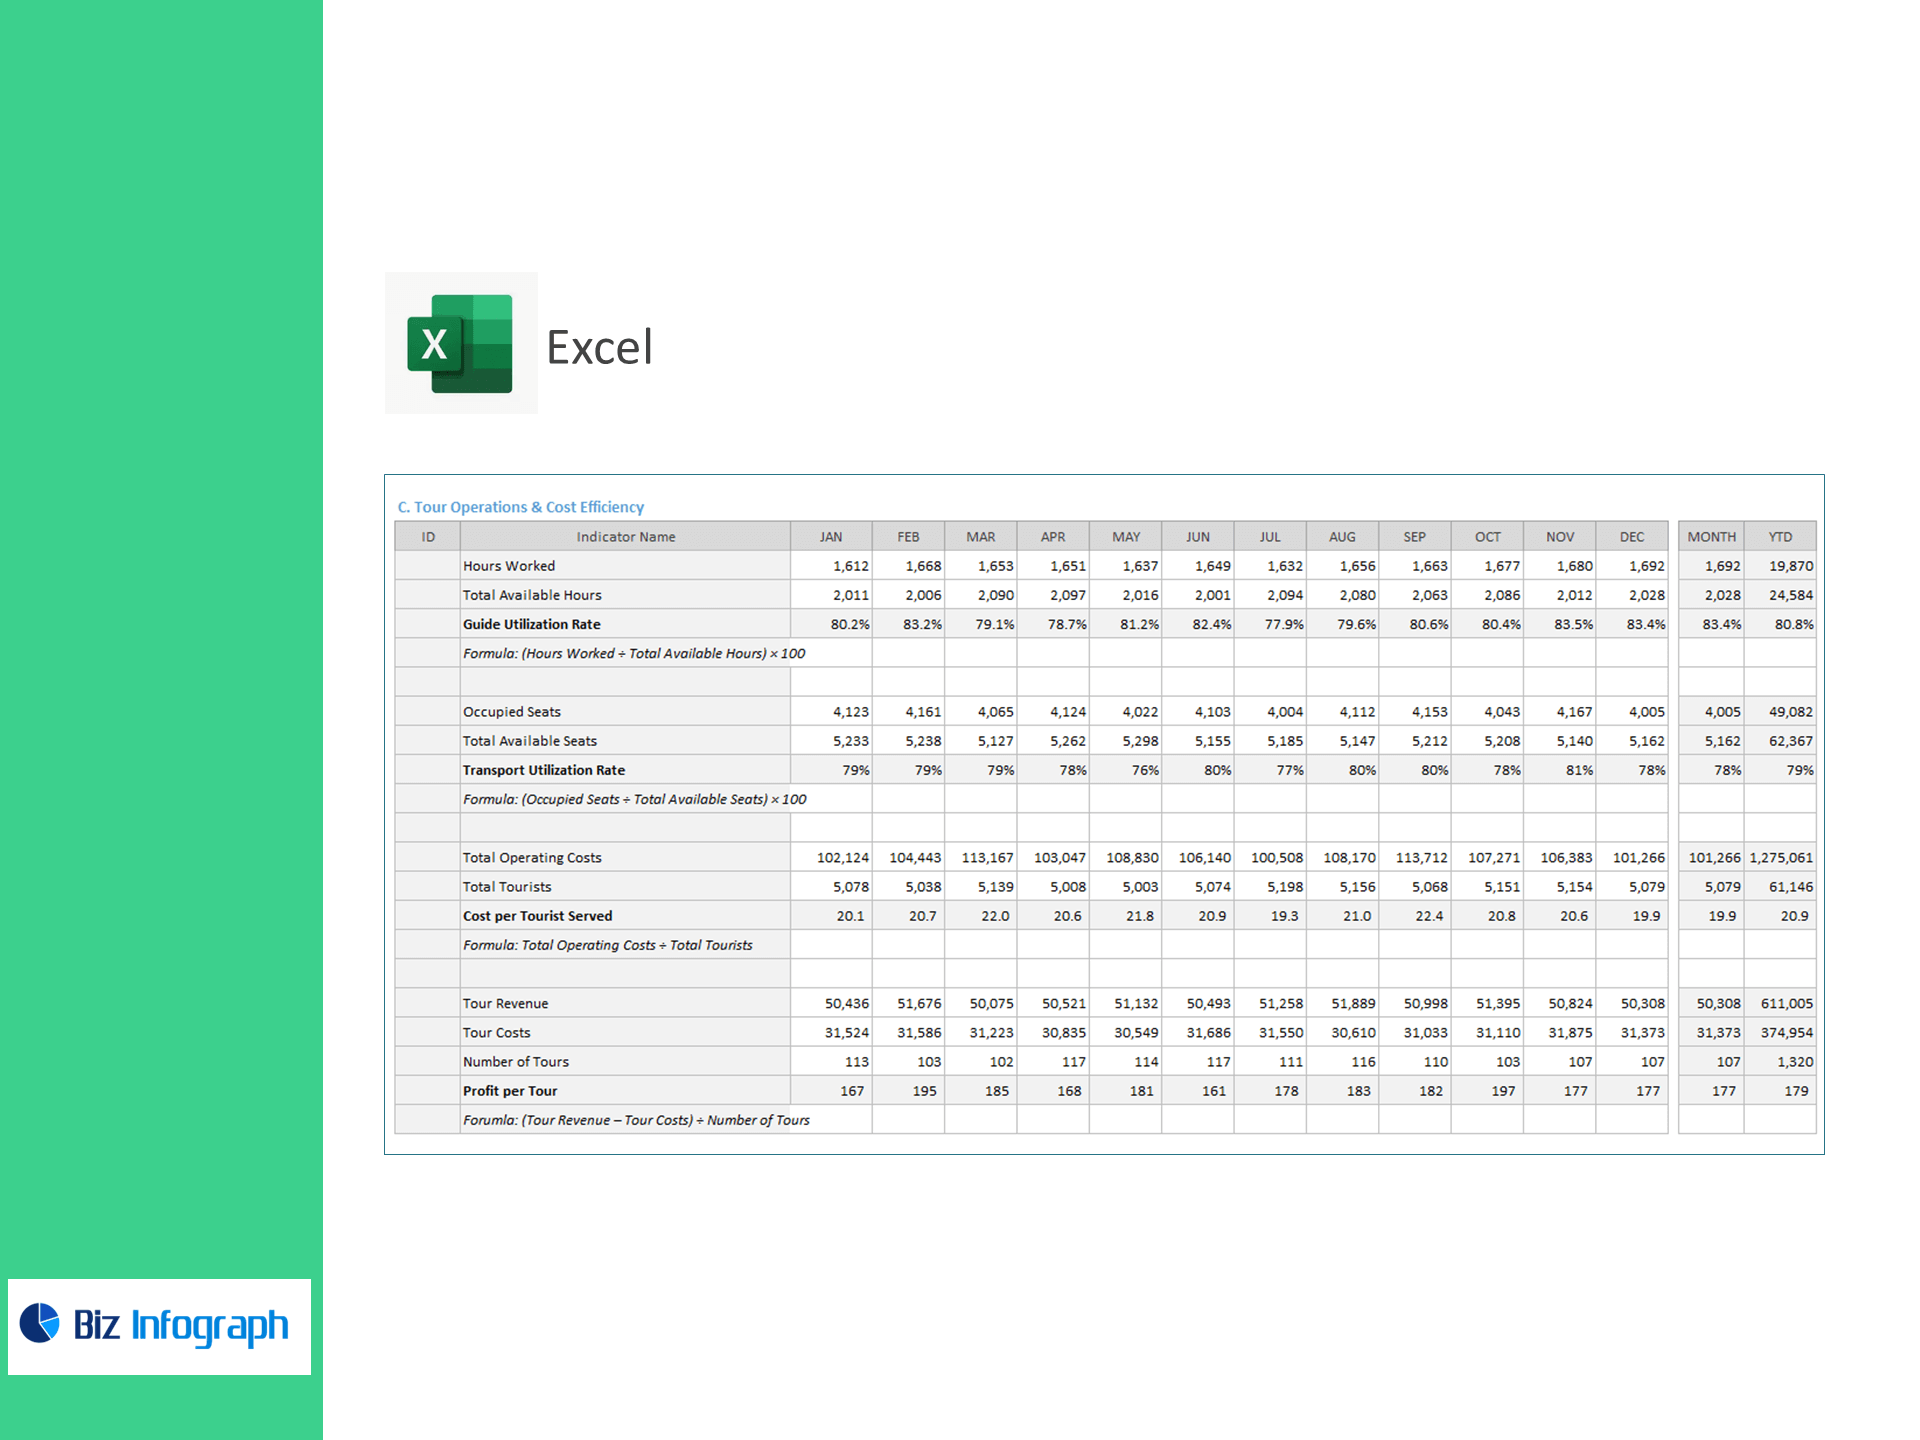
C) Tour Operations & Cost Efficiency
-
Guide Utilization Rate (%) = Hours Worked ÷ Available Hours × 100
-
Transport Utilization Rate (%) = Occupied Seats ÷ Available Seats × 100
-
Cost per Tourist Served = Total Operating Costs ÷ Total Tourists
-
Profit per Tour = (Tour Revenue − Tour Costs) ÷ Number of Tours
What’s inside
-
Executive Dashboard: Tiles & trends for conversion, value, cancels, channel mix, response time, NPS, repeats, utilization, cost/tourist, and profit/tour with variance to target.
-
Channel & OTA Panel: Compare conversion, ABV, and cancel rate by channel/market.
-
Service Desk View: Response SLAs, complaint drivers, and NPS distribution.
-
Operations Optimizer: Guide & vehicle utilization and route/tour profitability.
-
Targets & Assumptions: Enter KPI targets; automatic Above/Below Target flags.
-
Clean Data Sheets: Import-ready tables for inquiries/bookings, revenue, cancellations, support tickets, NPS, tourists, hours, seats, costs, and tour P&L.
Benefits
-
Grow high-quality bookings: Improve conversion and ABV while reducing cancellations.
-
Elevate traveler experience: Shorten response time, lift NPS, and cut complaints.
-
Run lean tours: Increase utilization, lower cost per tourist, and maximize profit per tour.
-
Decide faster: Board-ready visuals with transparent, audit-friendly formulas.
For ready-to-use Dashboard Templates: