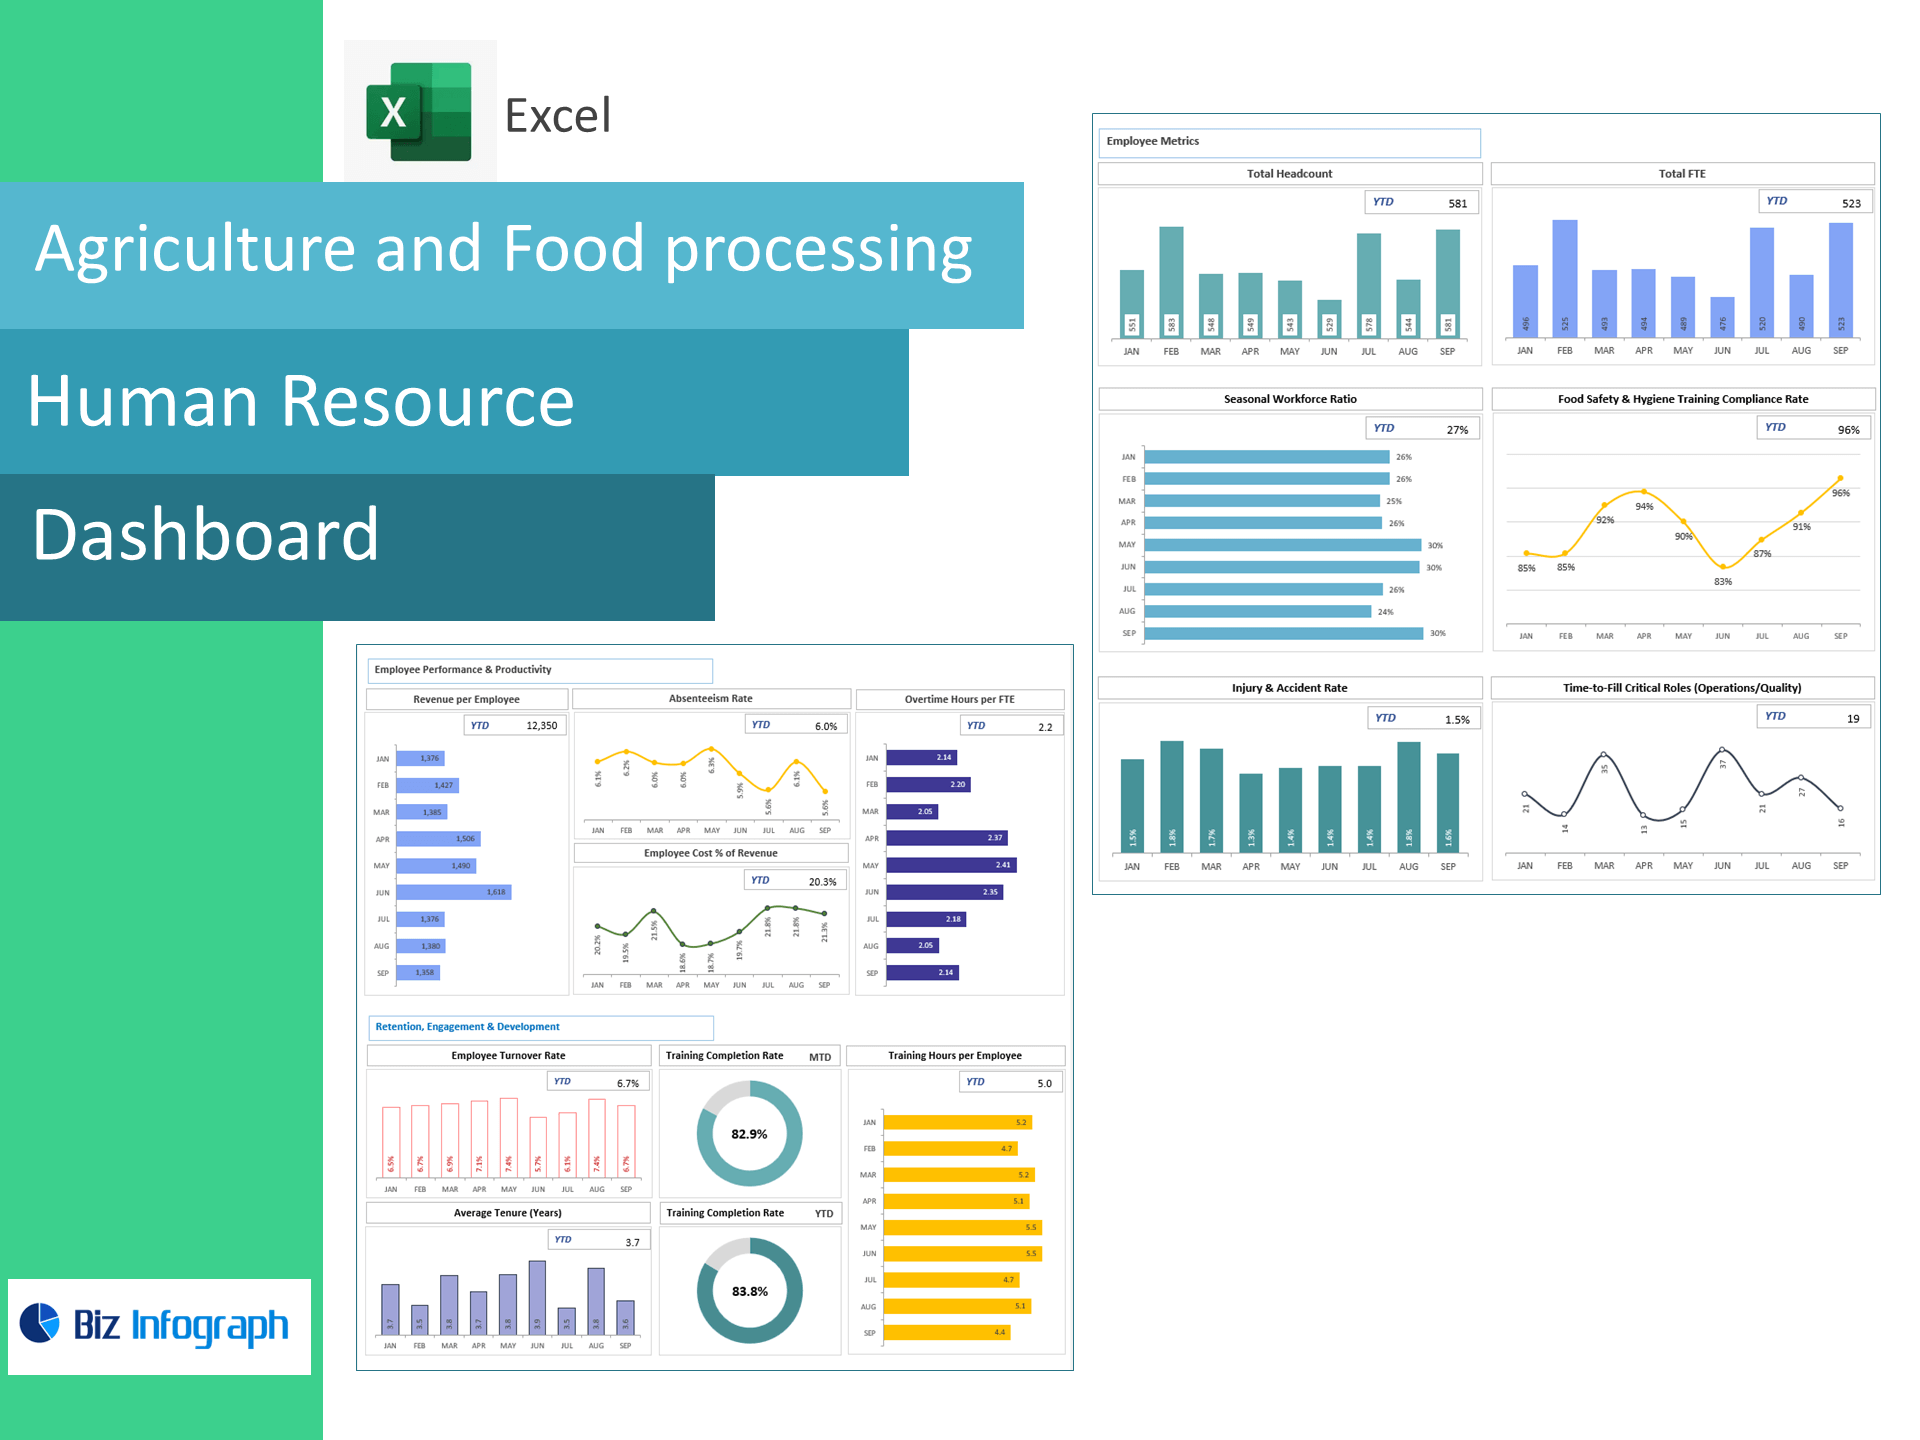

HR Agriculture & Food Processing Dashboard — Excel Template
Track workforce, safety, training, and labor costs for farms and food plants in one flexible Excel dashboard. Purpose-built for seasonal operations, this template converts raw HR data into actionable insights that cut overtime, improve compliance, and stabilize staffing.
Who it’s for
HR managers, Plant Ops, Food Safety/Quality leaders, and Farm Supervisors who need a ready-to-use HR analytics dashboard for agriculture and food processing—without building complex models.
What you get
-
Interactive Excel dashboard (no add-ins): filters by site, line, department, shift, and period.
-
Clean data entry sheets: paste or import monthly/weekly HR metrics.
-
Prebuilt KPIs & visuals aligned to farm and food plant realities (seasonal hiring, hygiene training, shift labor).
-
Targets & thresholds: auto RAG status (red/amber/green) against your goals.
-
Documentation tab: plain-English definitions and formulas for every KPI.
Core KPIs (out-of-the-box)
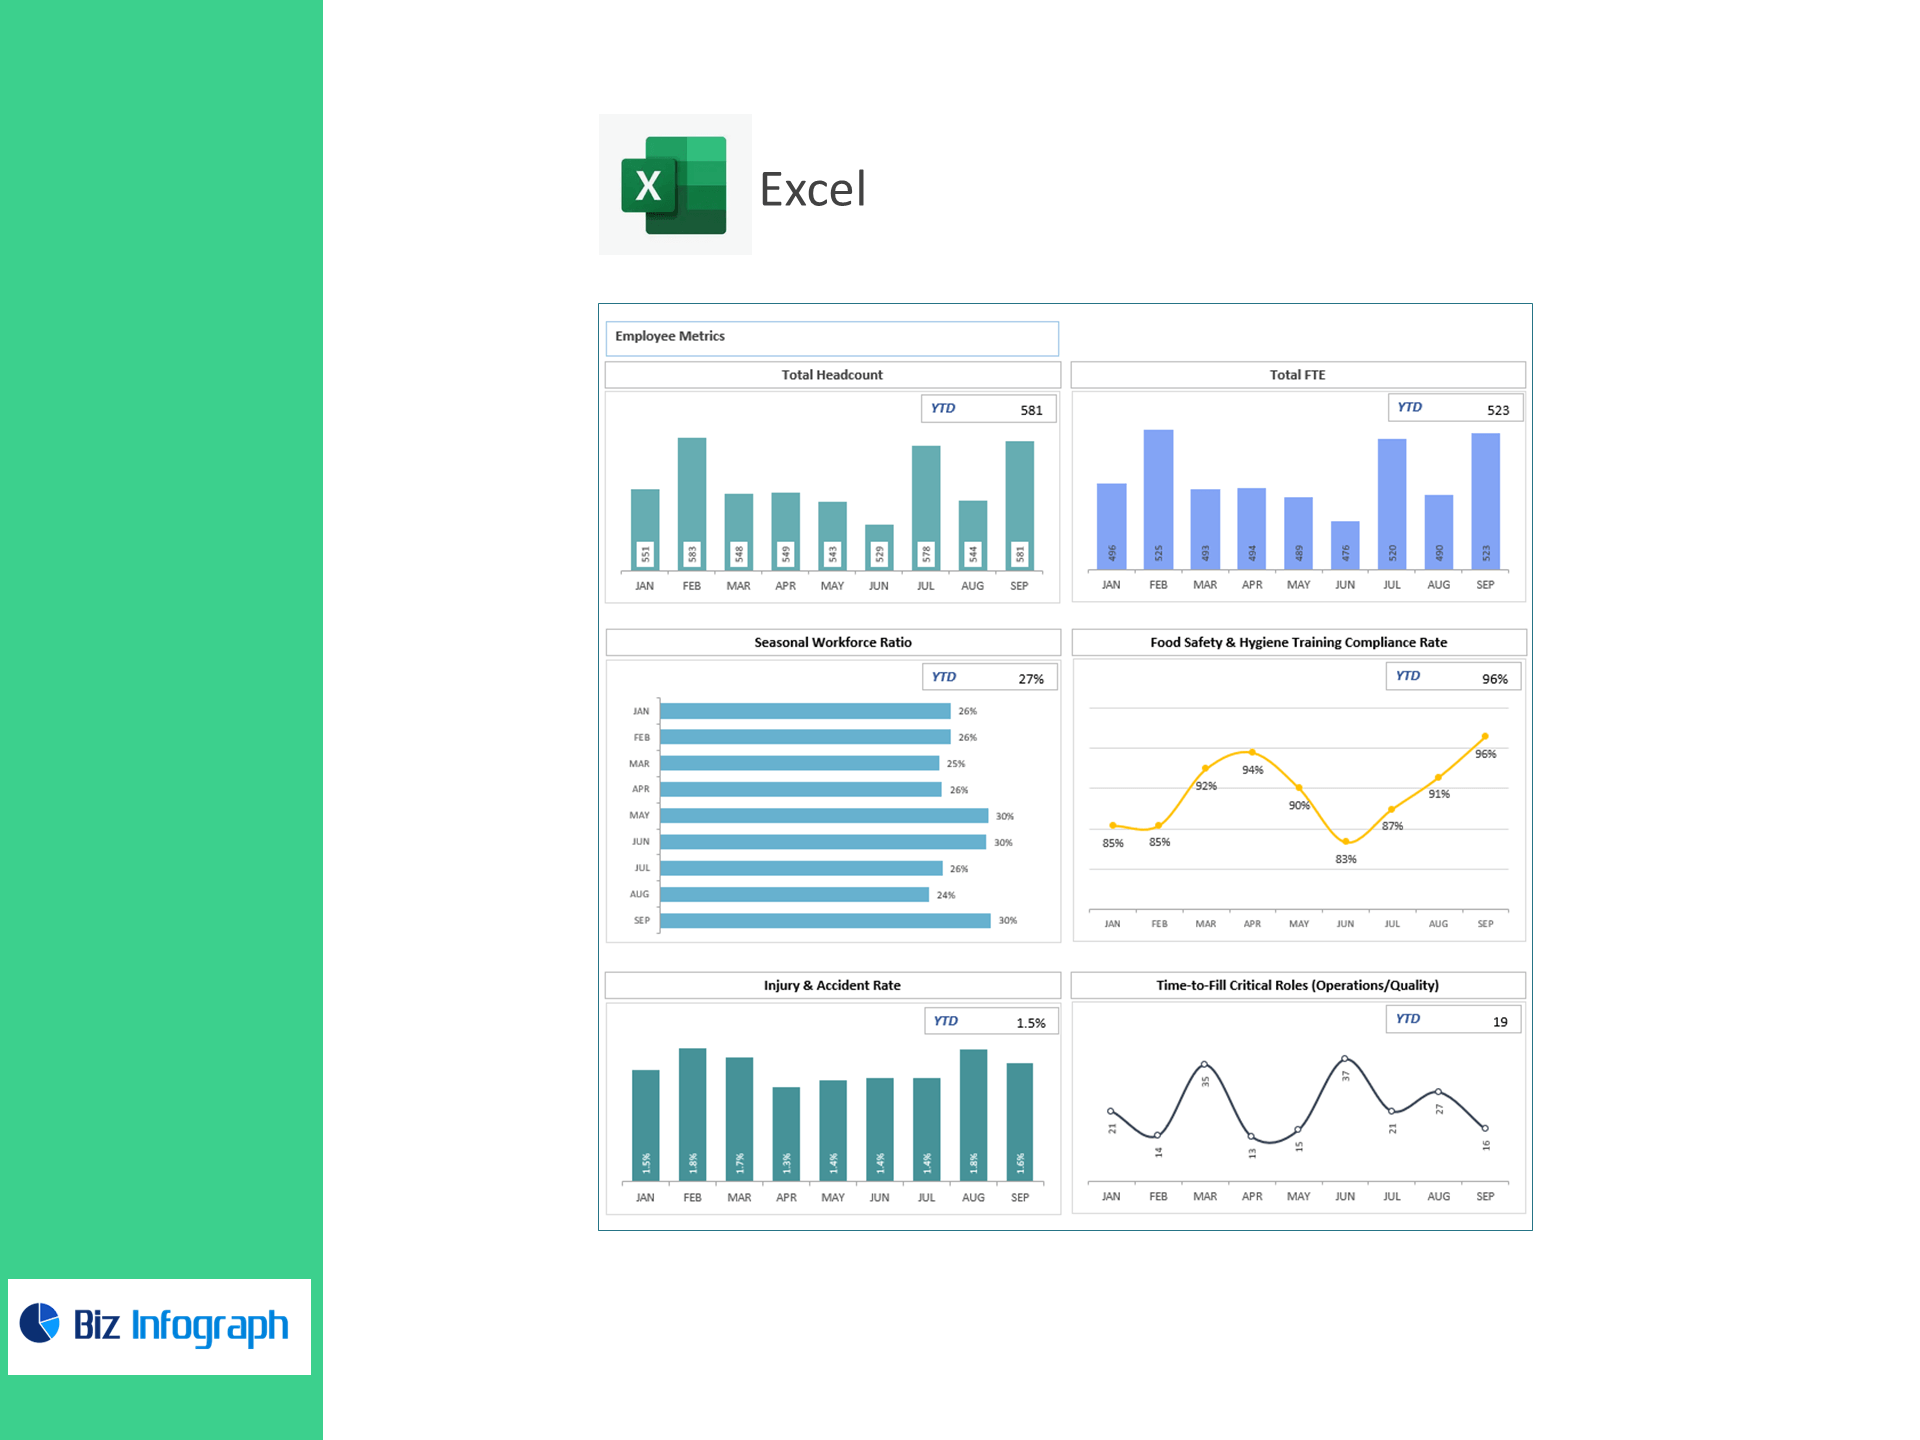
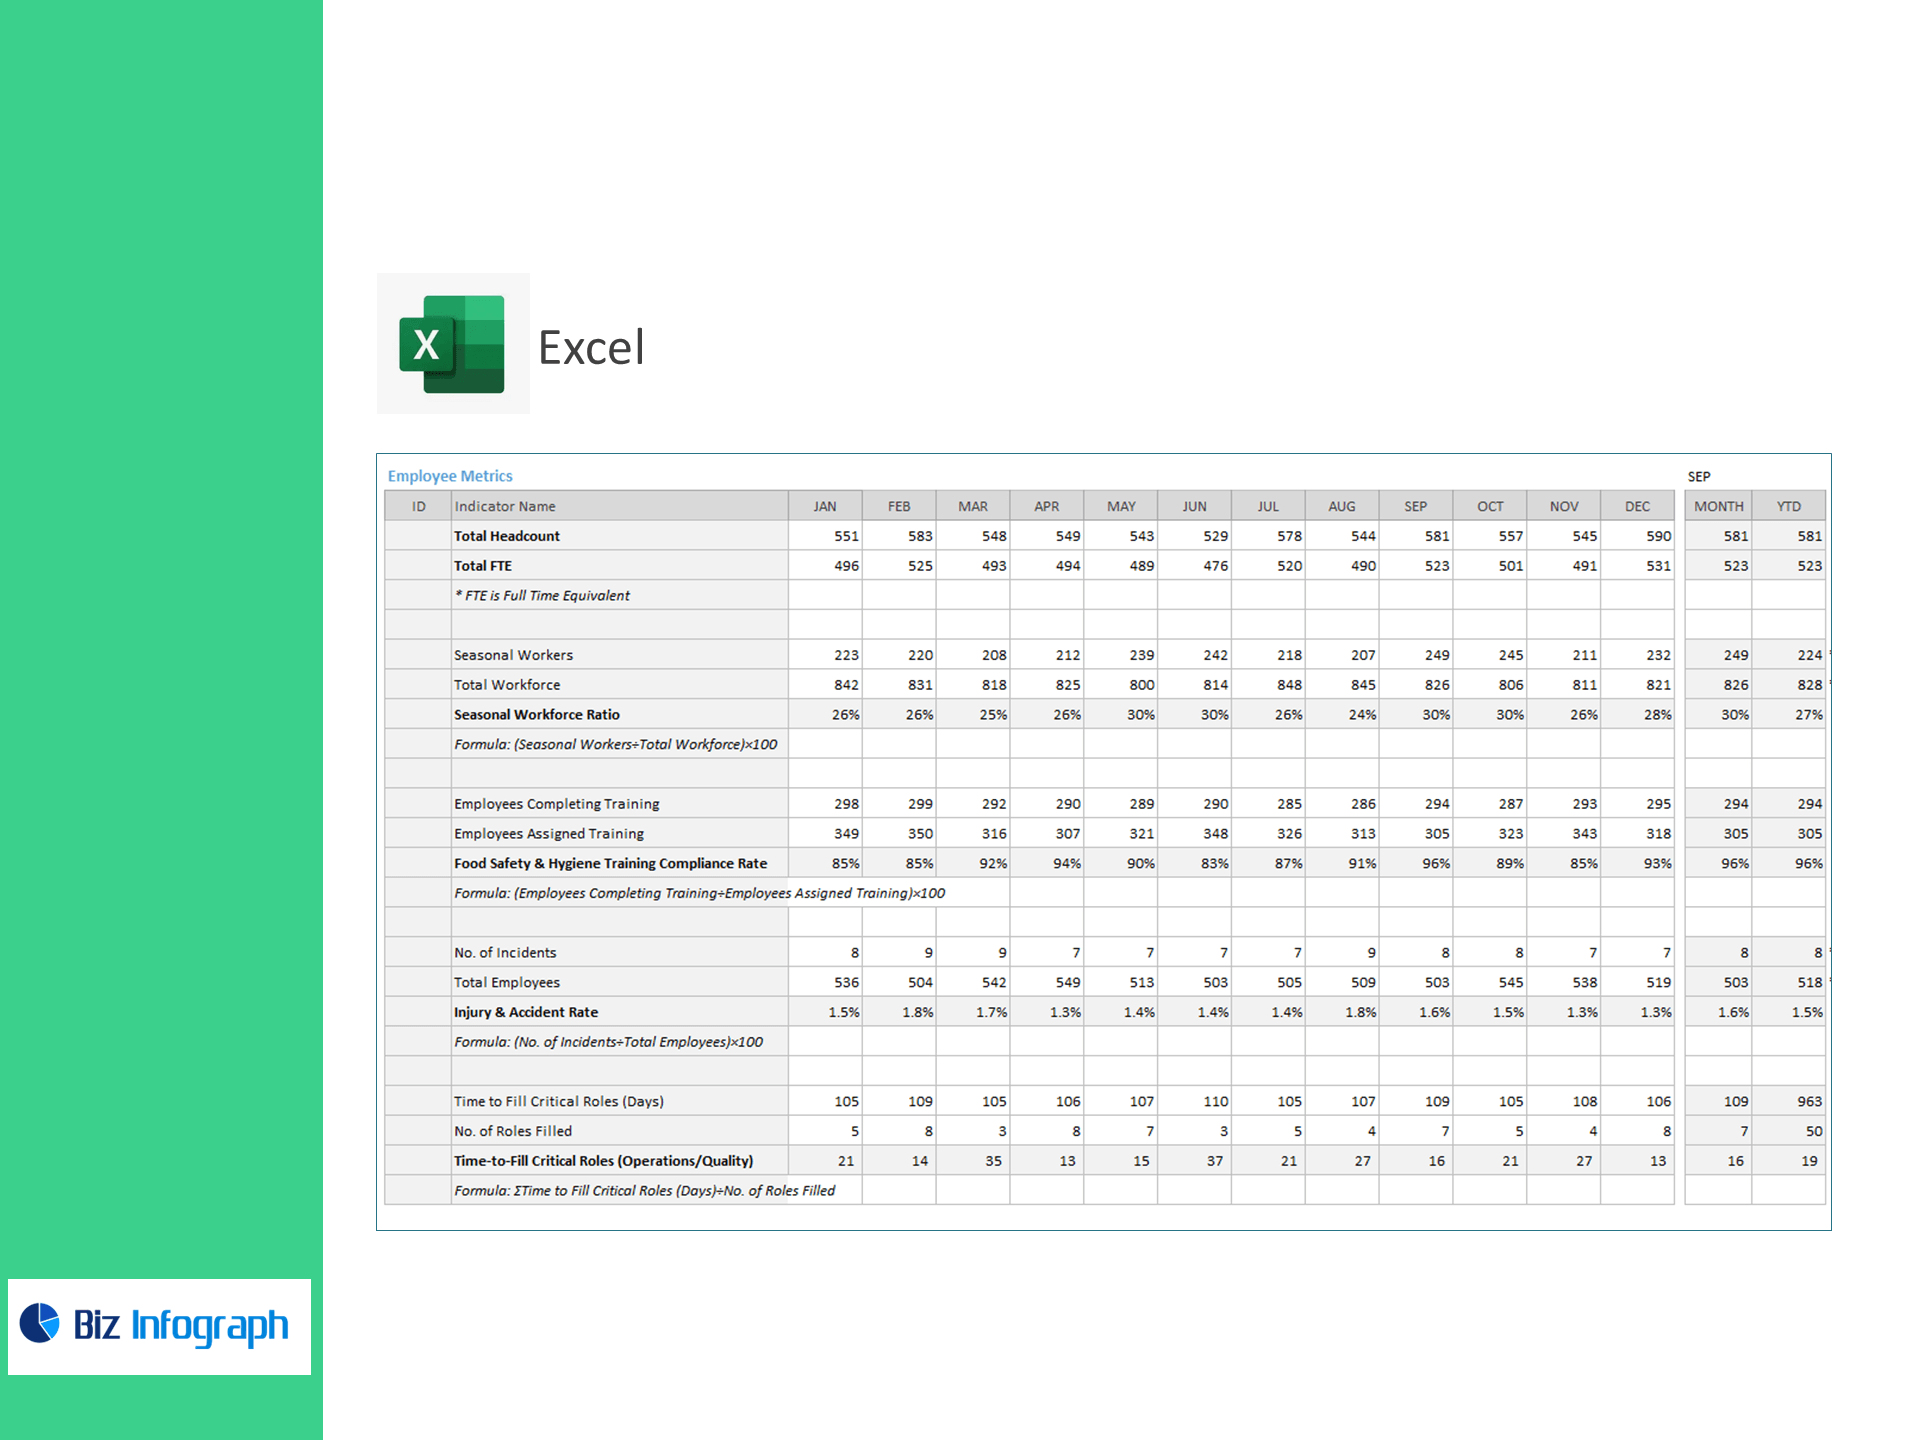
Workforce Structure
-
Total Headcount
-
Total FTE (Full-Time Equivalent)
-
Seasonal Workforce Ratio (%) = (Seasonal Workers ÷ Total Workforce) × 100
Training, Food Safety & Hygiene
-
Food Safety & Hygiene Training Compliance Rate (%)
= (Employees Completing Training ÷ Employees Assigned Training) × 100 -
Training Completion Rate (%)
= (Completed ÷ Assigned Trainings) × 100 -
Training Hours per Employee
= Total Training Hours ÷ No. of Employees
Safety & Compliance
-
Injury & Accident Rate (%)
= (No. of Incidents ÷ Total Employees) × 100
Hiring Velocity (Operations & Quality)
-
Time-to-Fill Critical Roles (Days)
= Σ Time to Fill Critical Roles (Days) ÷ No. of Roles Filled
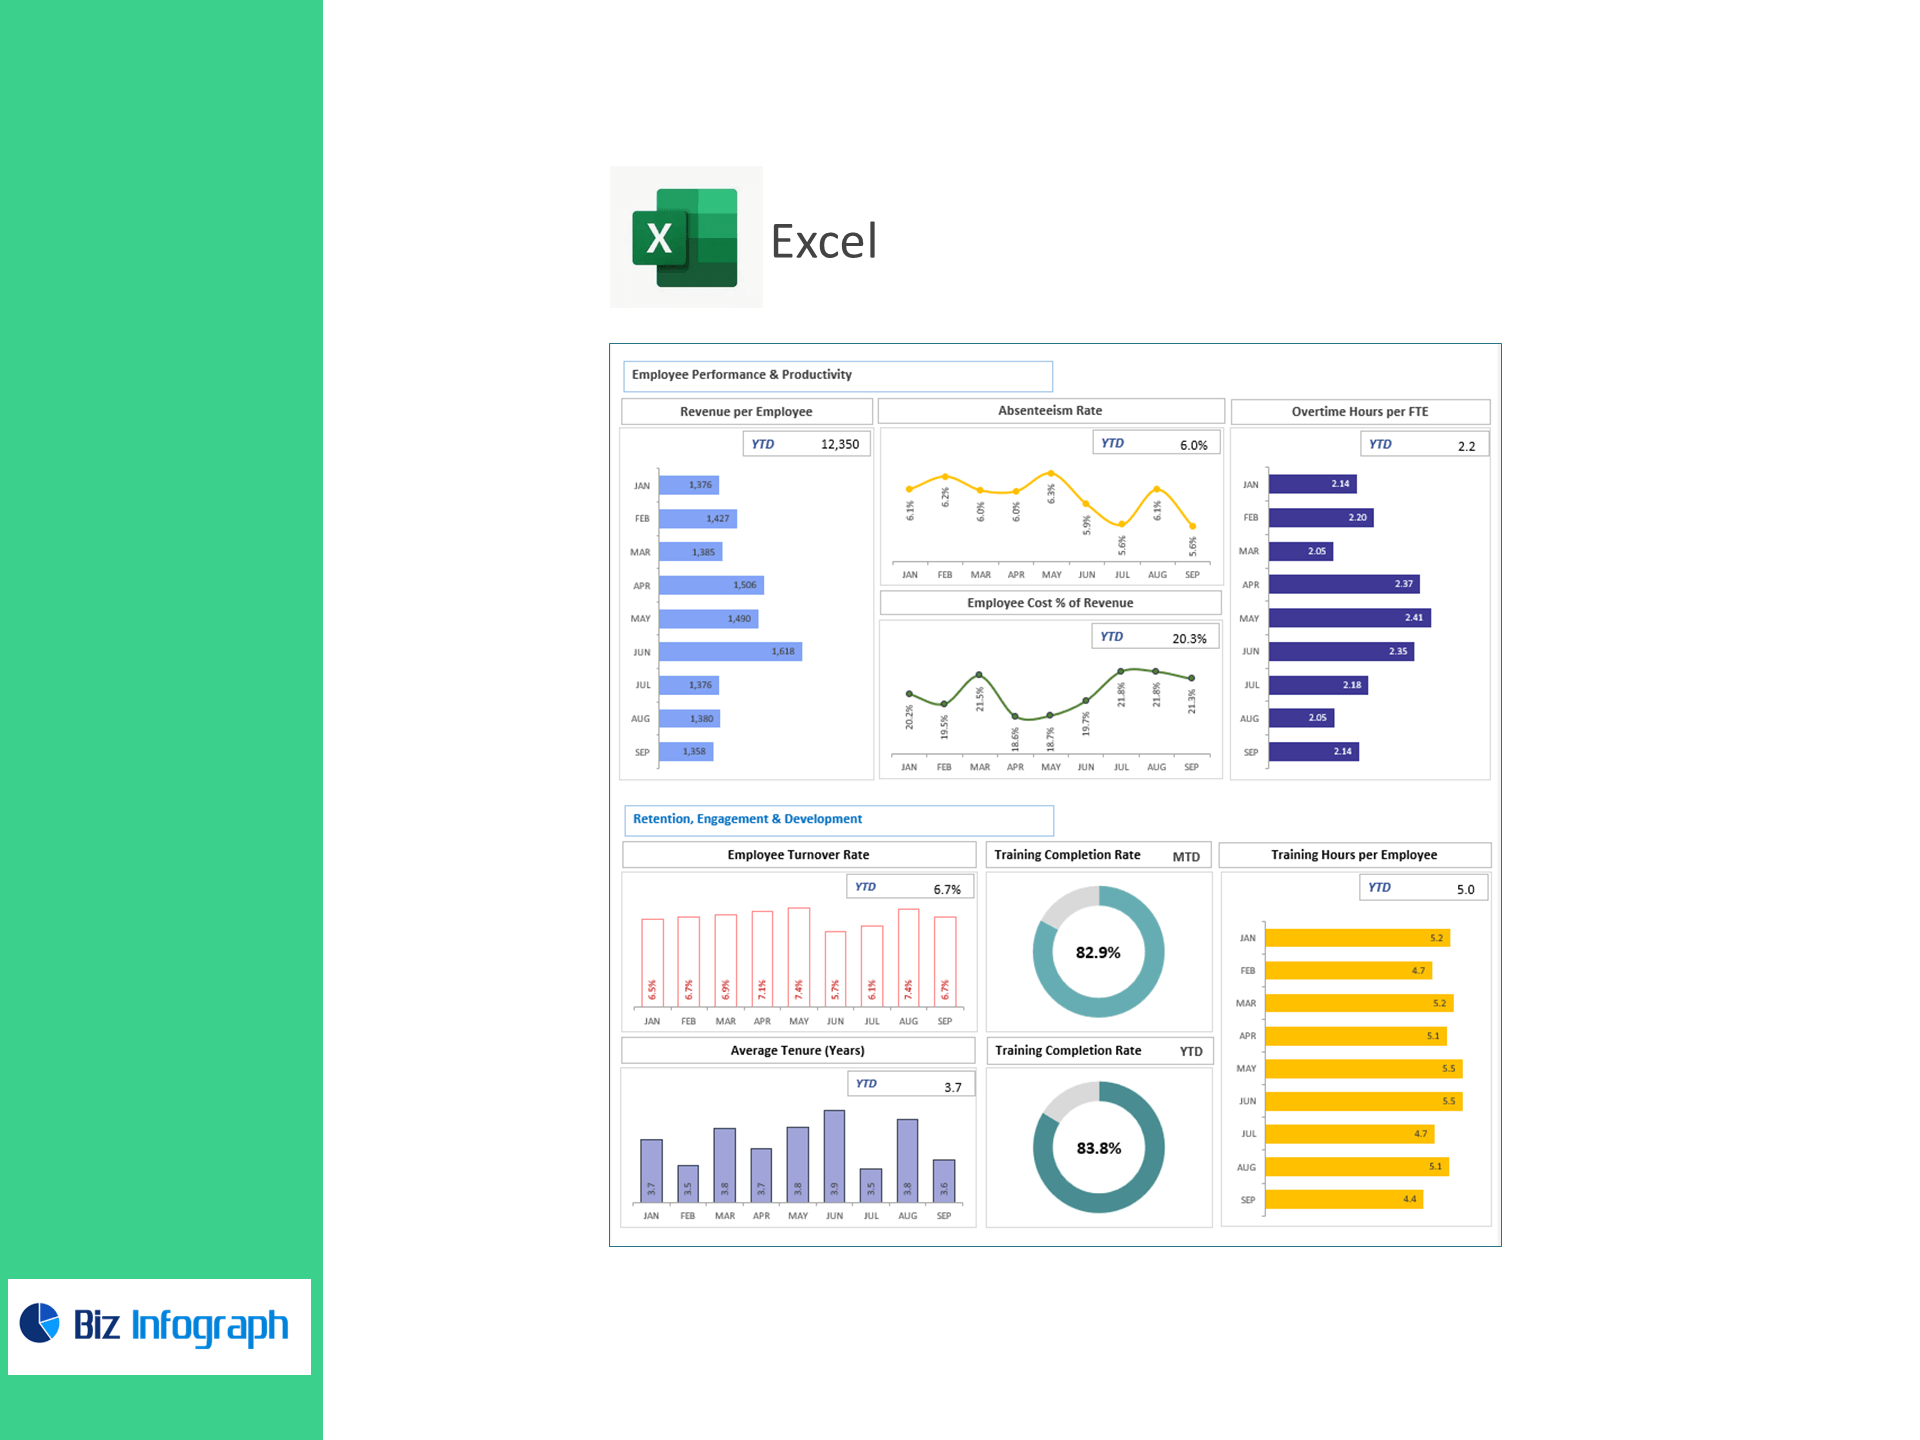
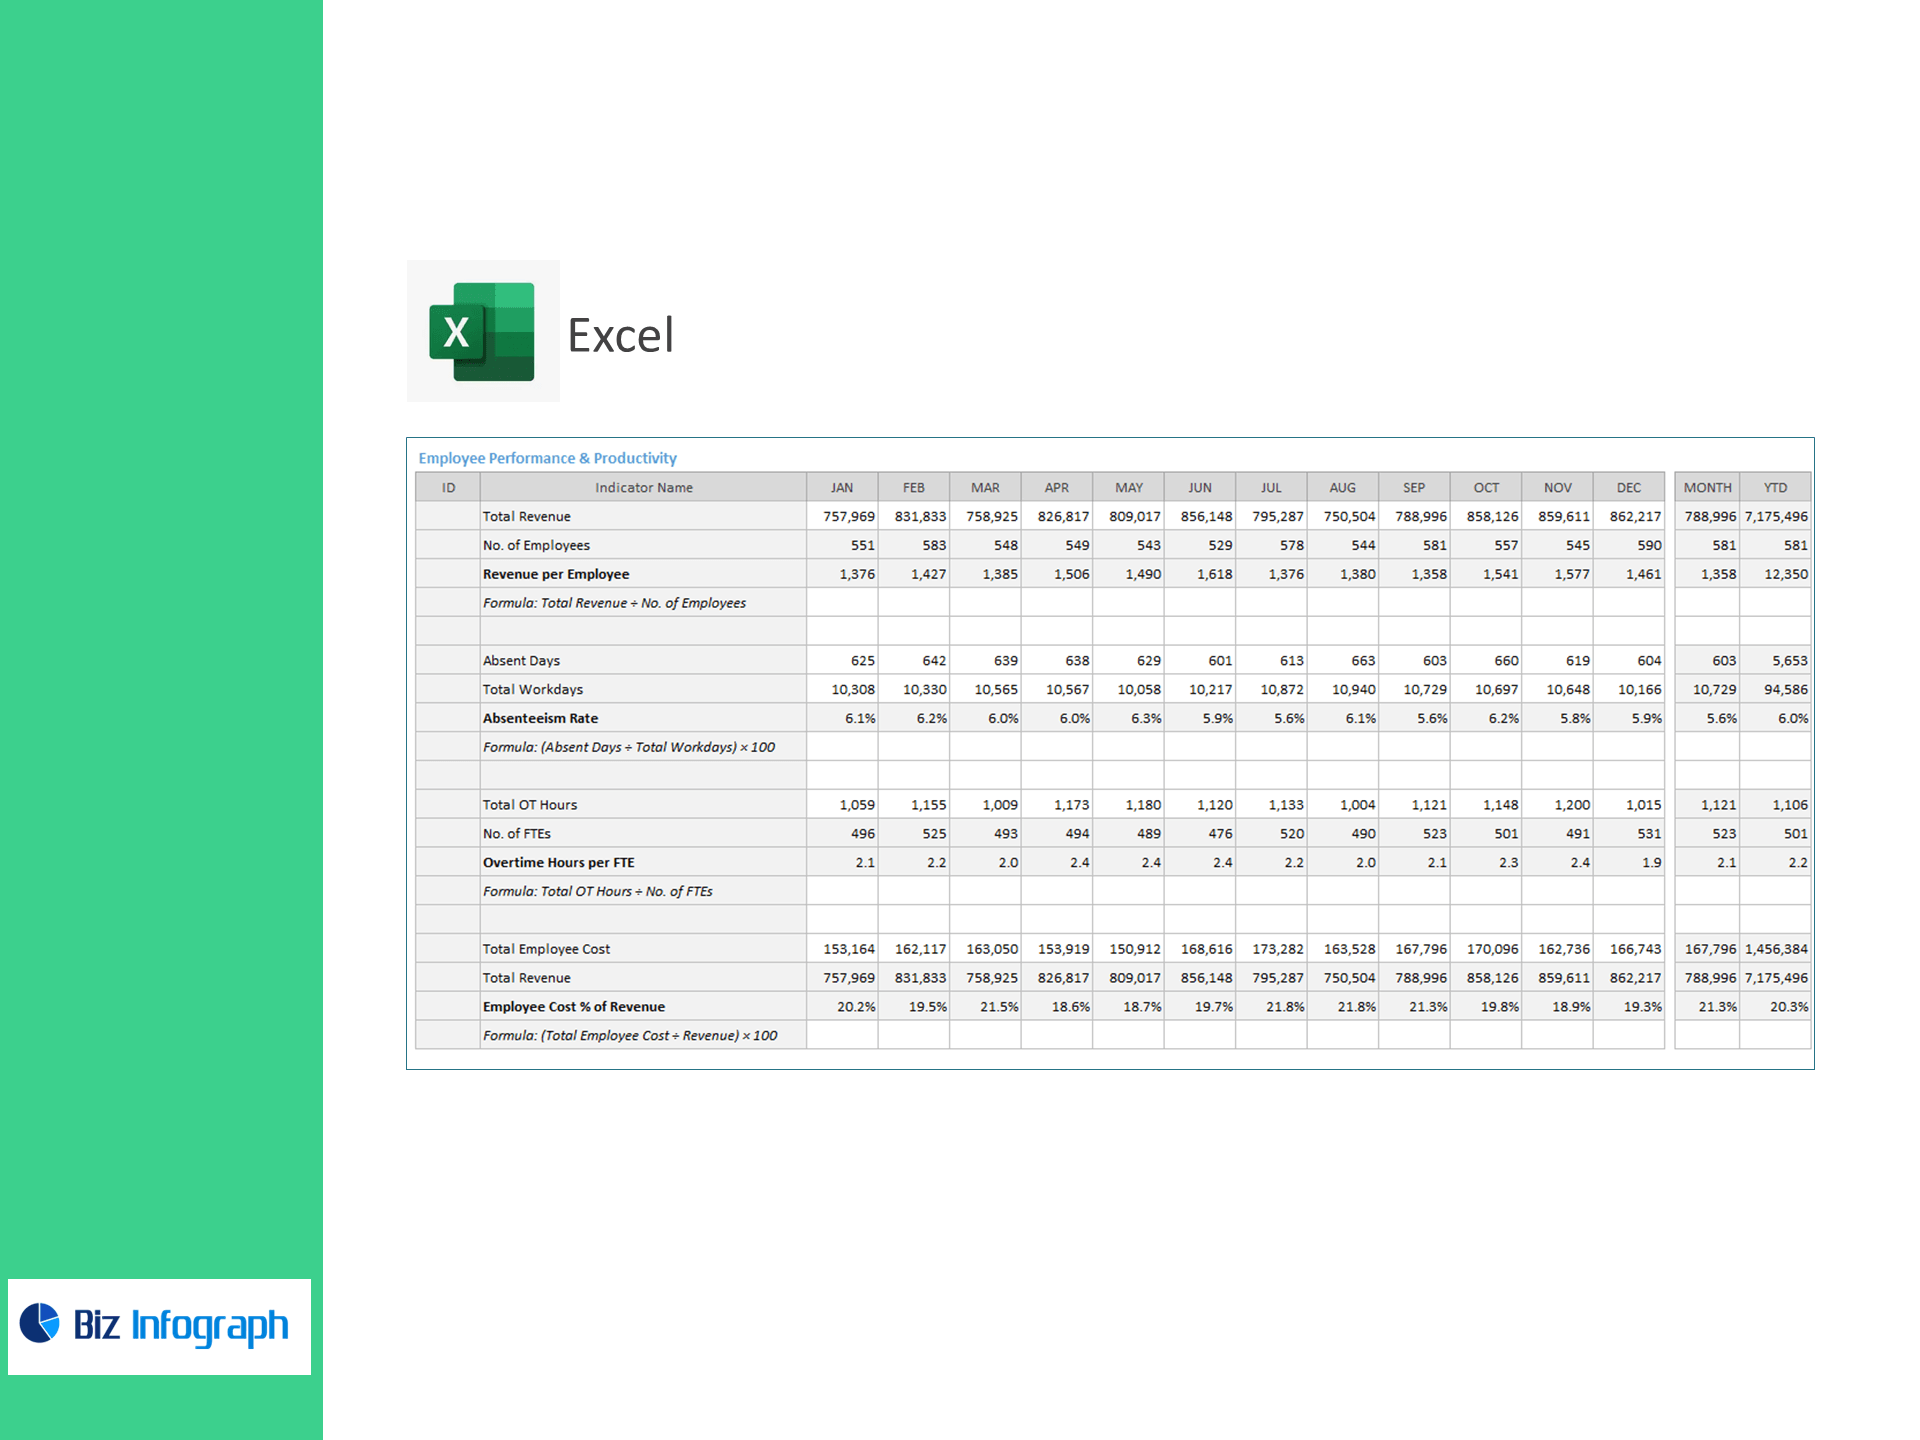
Employee Performance & Productivity
-
Revenue per Employee
= Total Revenue ÷ No. of Employees
Attendance & Labor Efficiency
-
Absenteeism Rate (%)
= (Absent Days ÷ Total Workdays) × 100 -
Overtime Hours per FTE
= Total OT Hours ÷ No. of FTEs
Cost Control
-
Employee Cost % of Revenue
= (Total Employee Cost ÷ Revenue) × 100
Retention & Experience
-
Employee Turnover Rate (%)
= (Exits ÷ Avg. Headcount) × 100 -
Average Tenure (Years)
= Σ Total Tenure ÷ No. of Employees
Why agriculture & food processors choose this template
-
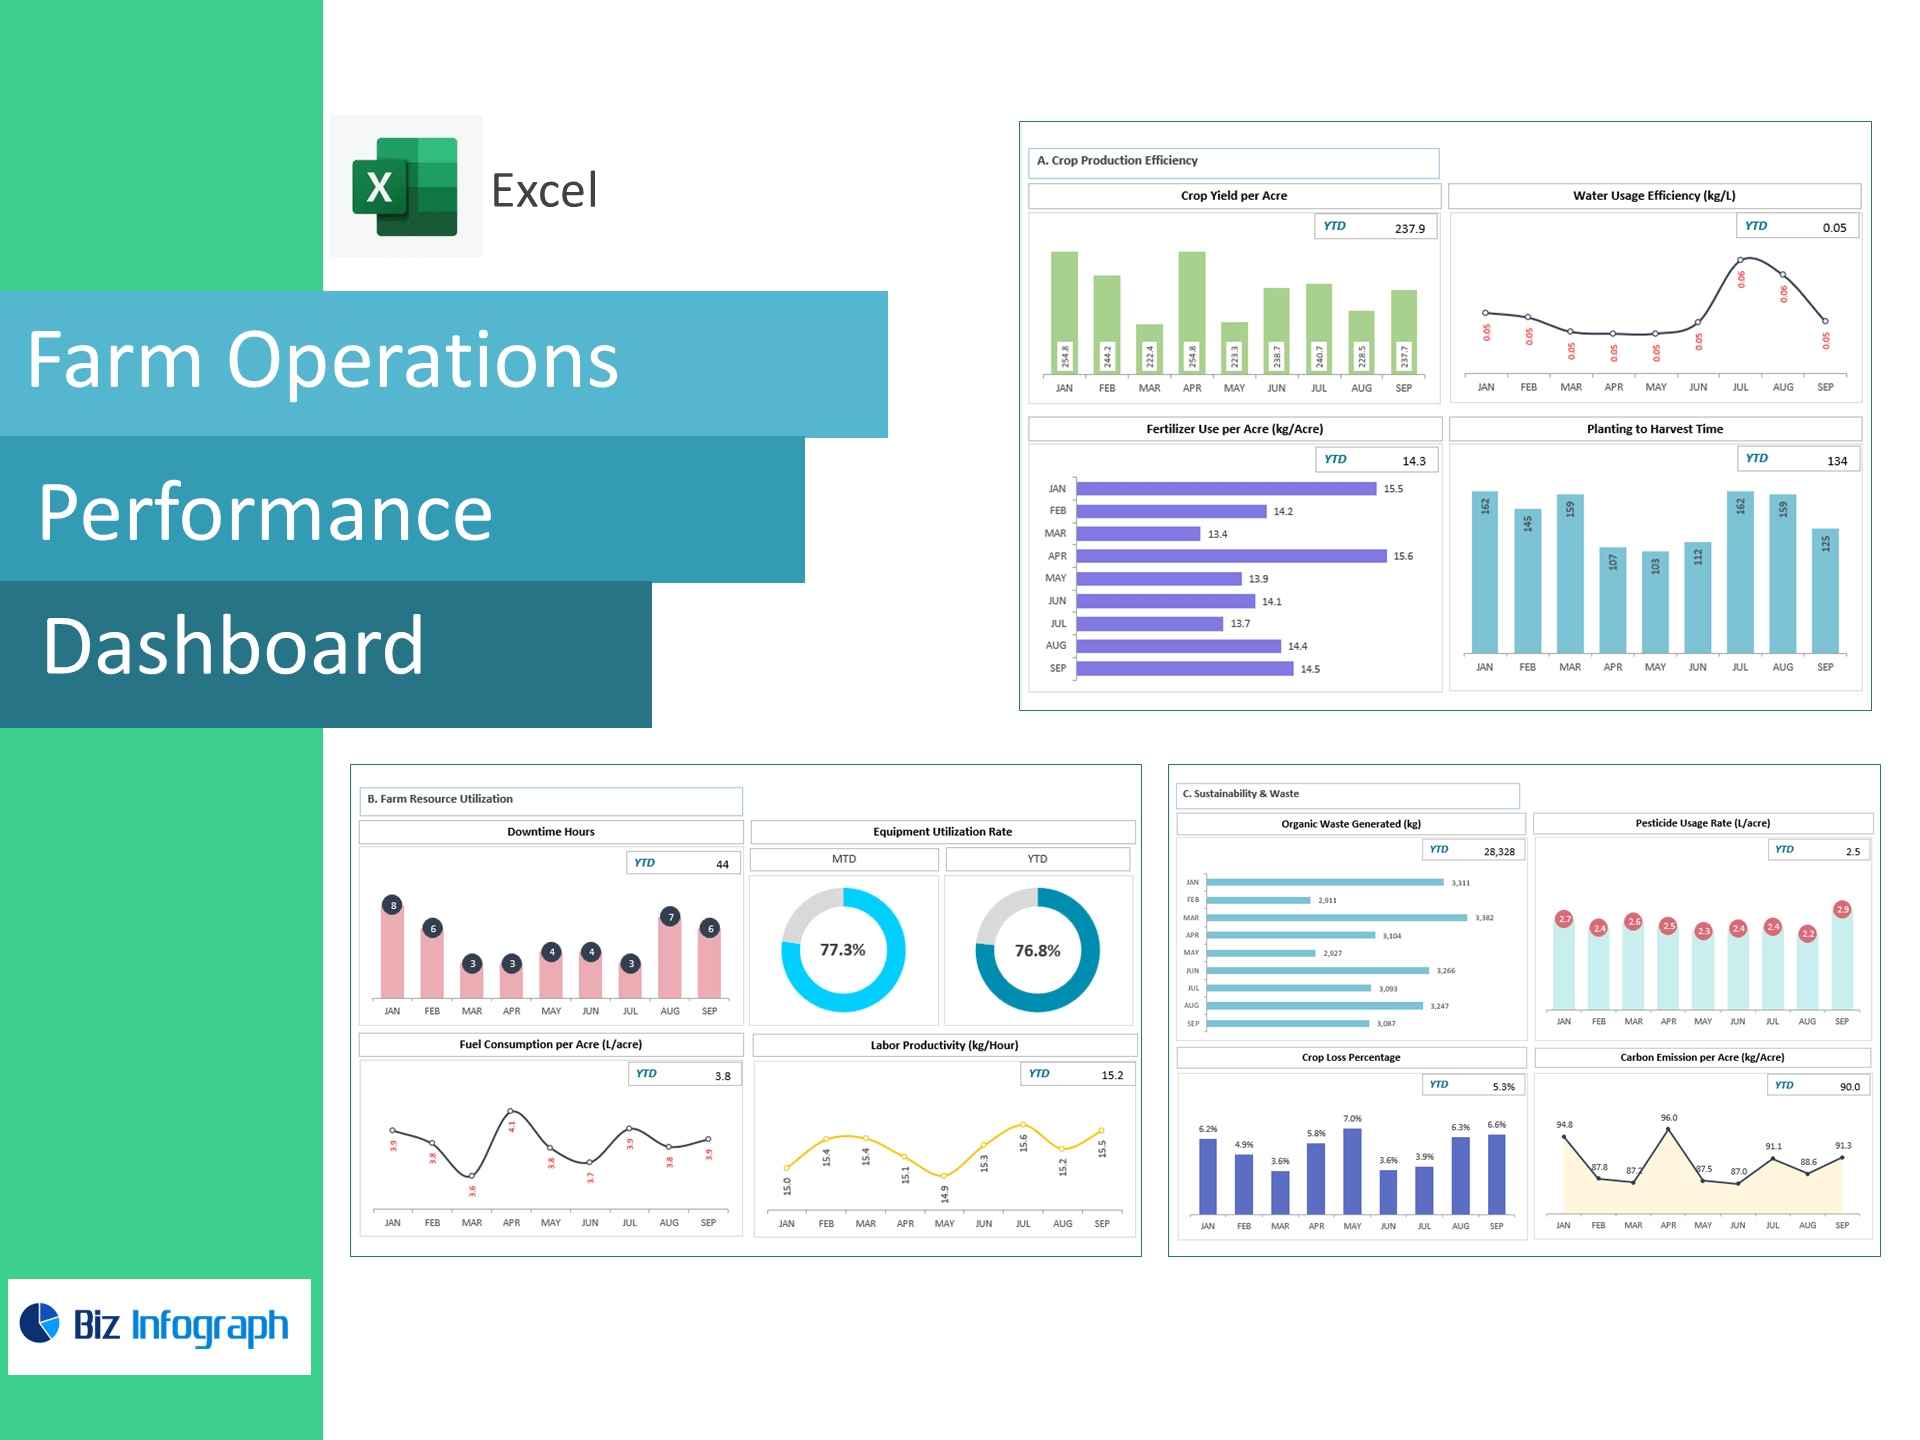
Seasonality-ready: visualize the balance of seasonal vs. core workforce to plan peak harvests or production surges.
-
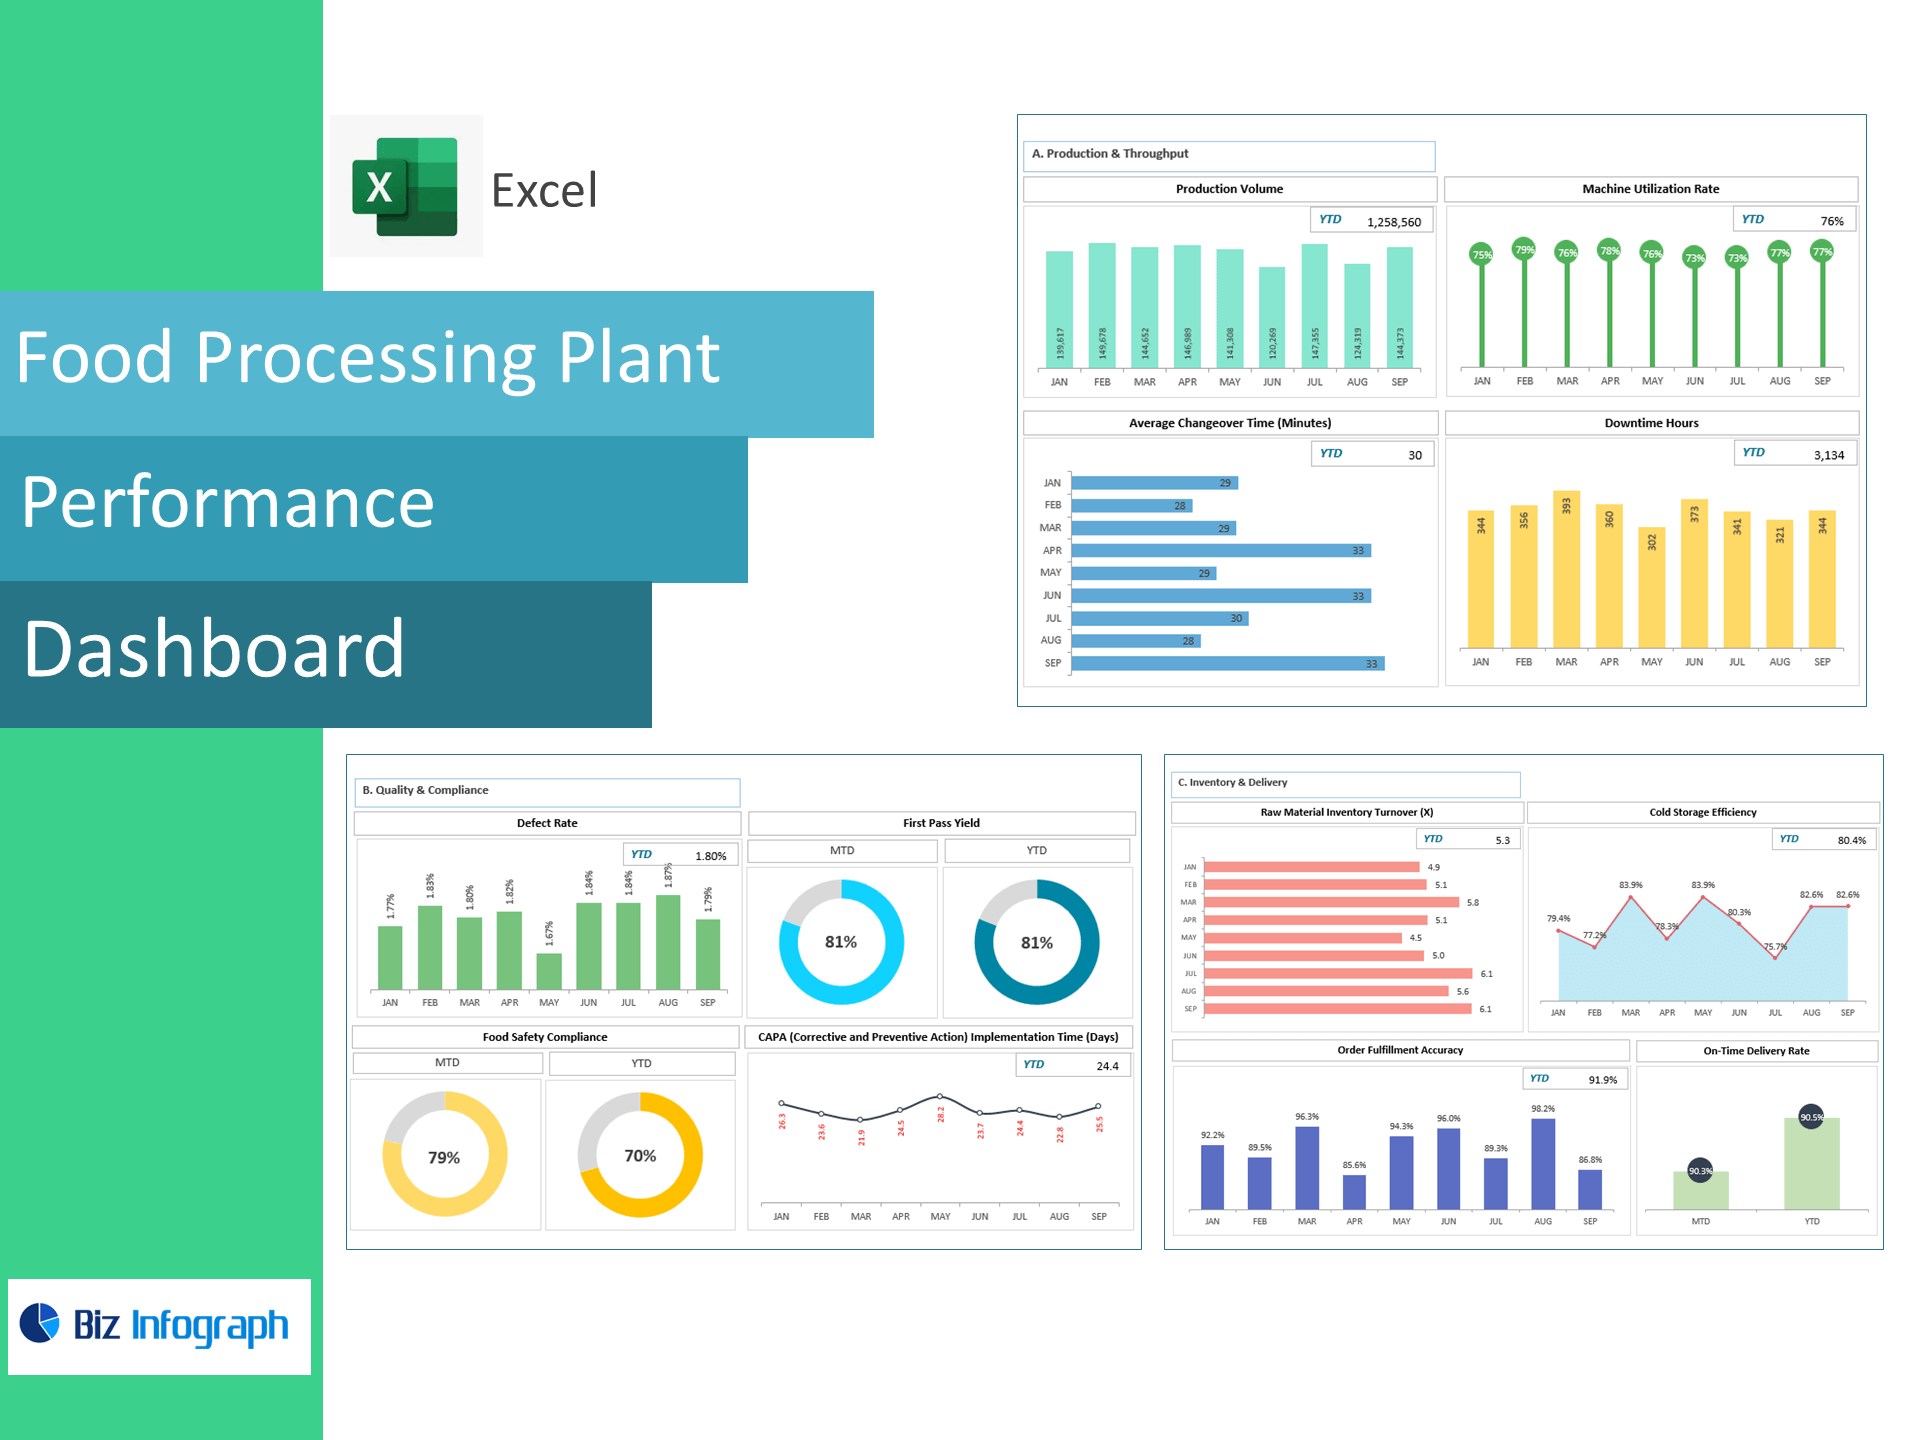
Food-safety aligned: track hygiene training compliance and incident rate to pass audits with confidence.
-
Faster staffing: monitor time-to-fill for critical ops/quality roles to keep lines running.
-
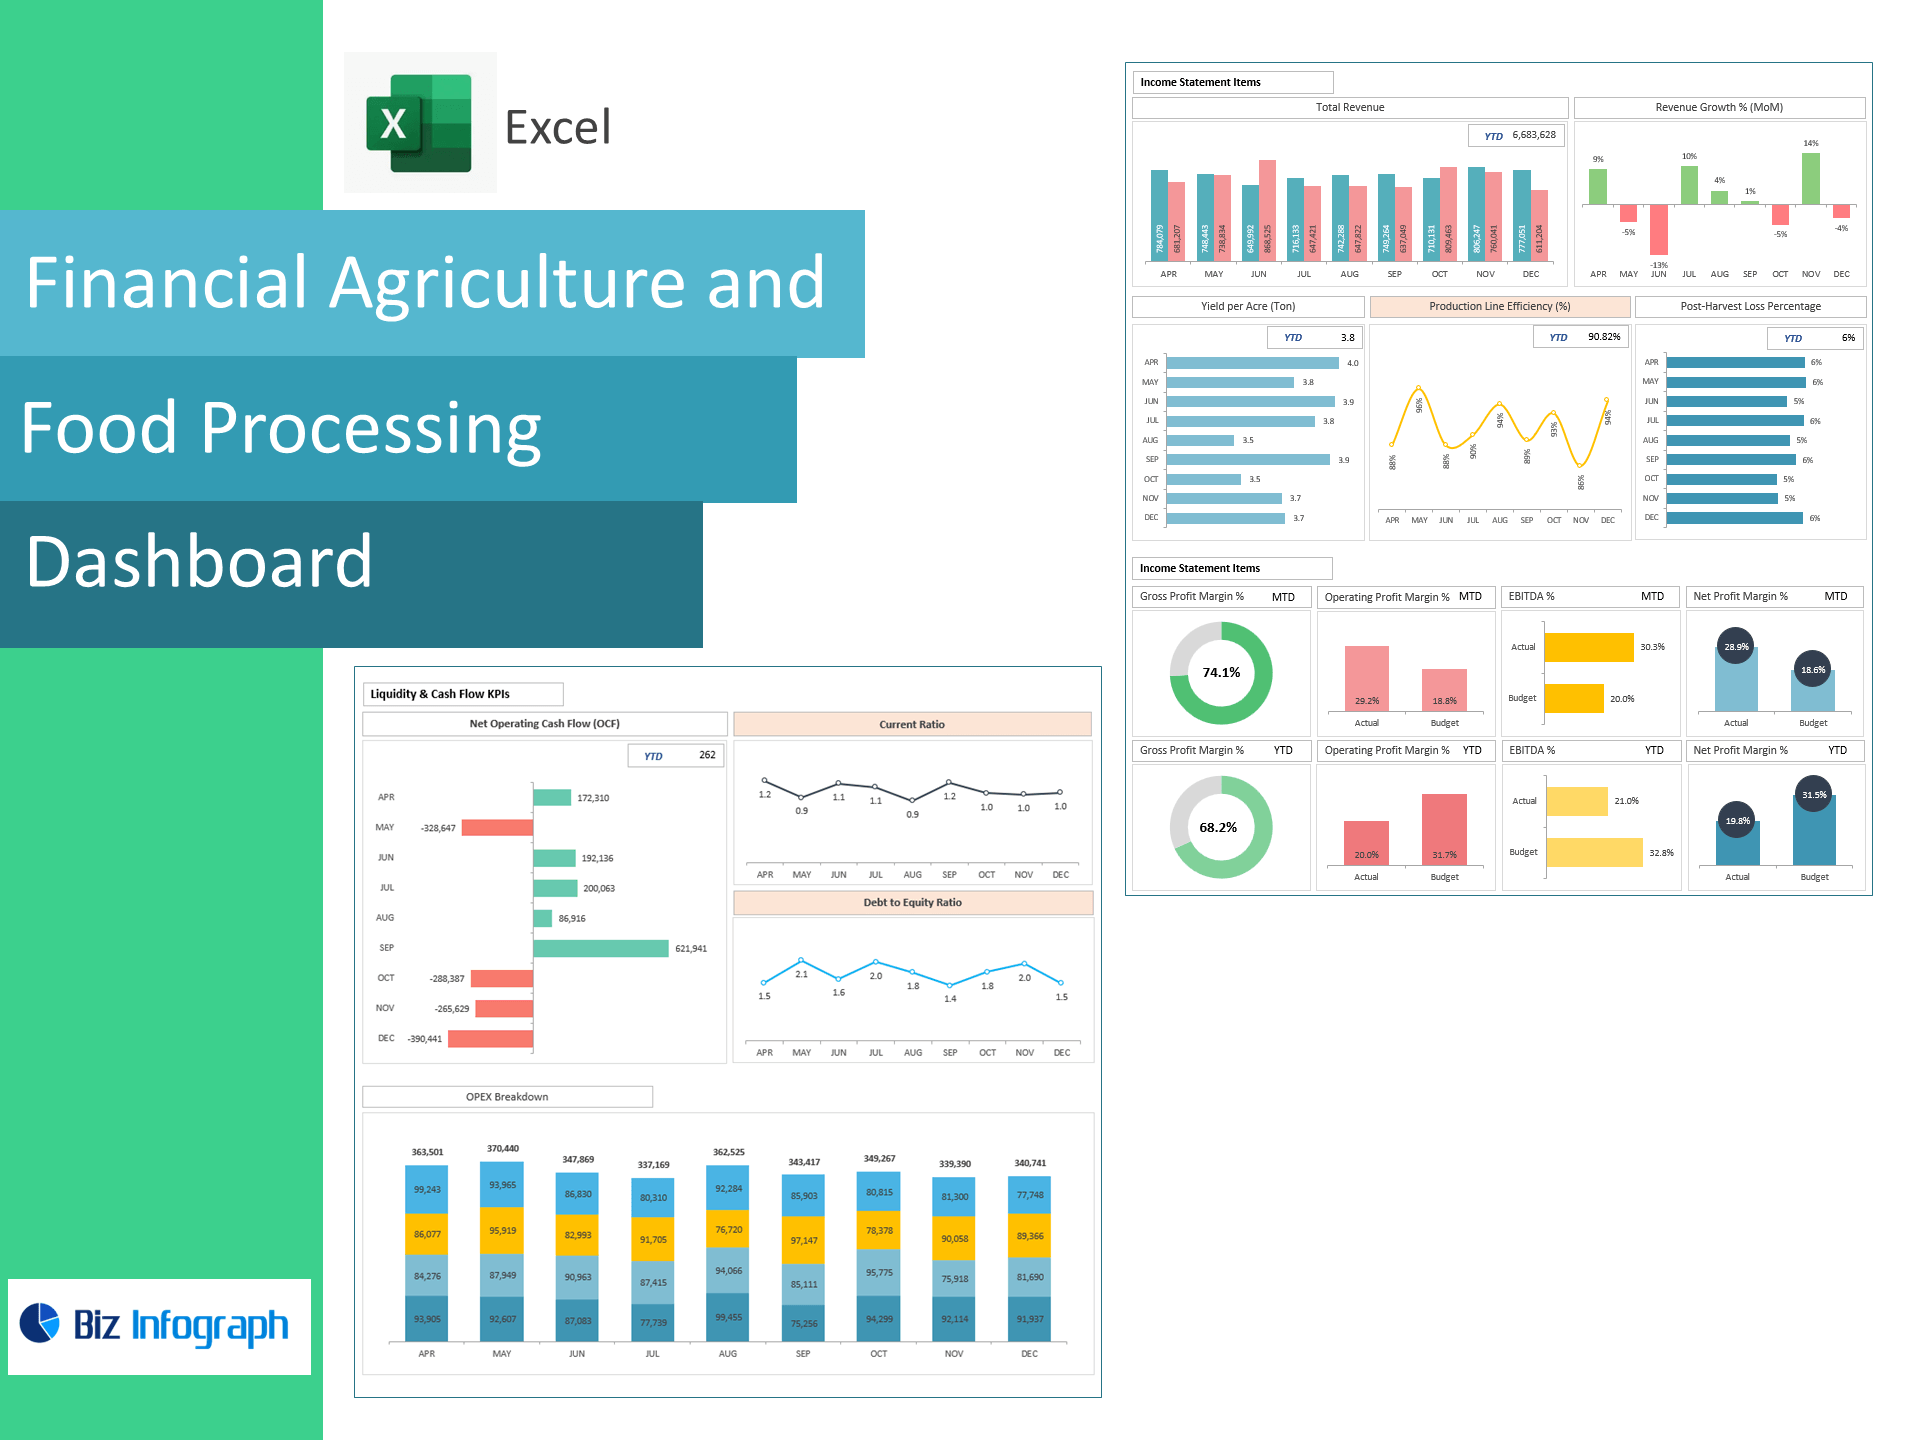
Labor cost clarity: connect employee cost %, OT per FTE, absenteeism, and turnover to throughput and service levels.
-
Executive-friendly: one-page summary with trend lines, variance to target, and drill-downs by site, shift, department, or role.
What’s inside the workbook
-
Dashboard: KPIs, trends (MoM/YoY), goal tracking, exception flags.
-
Data Sheets: structured tables for headcount, FTEs, incidents, training, hiring, OT, costs, revenue, and tenure.
-
Lookups & Settings: role categories, departments, sites, KPI targets, period selectors.
-
Print-ready views: export slides/PDFs for monthly reviews and audits.
For ready-to-use Dashboard Templates: