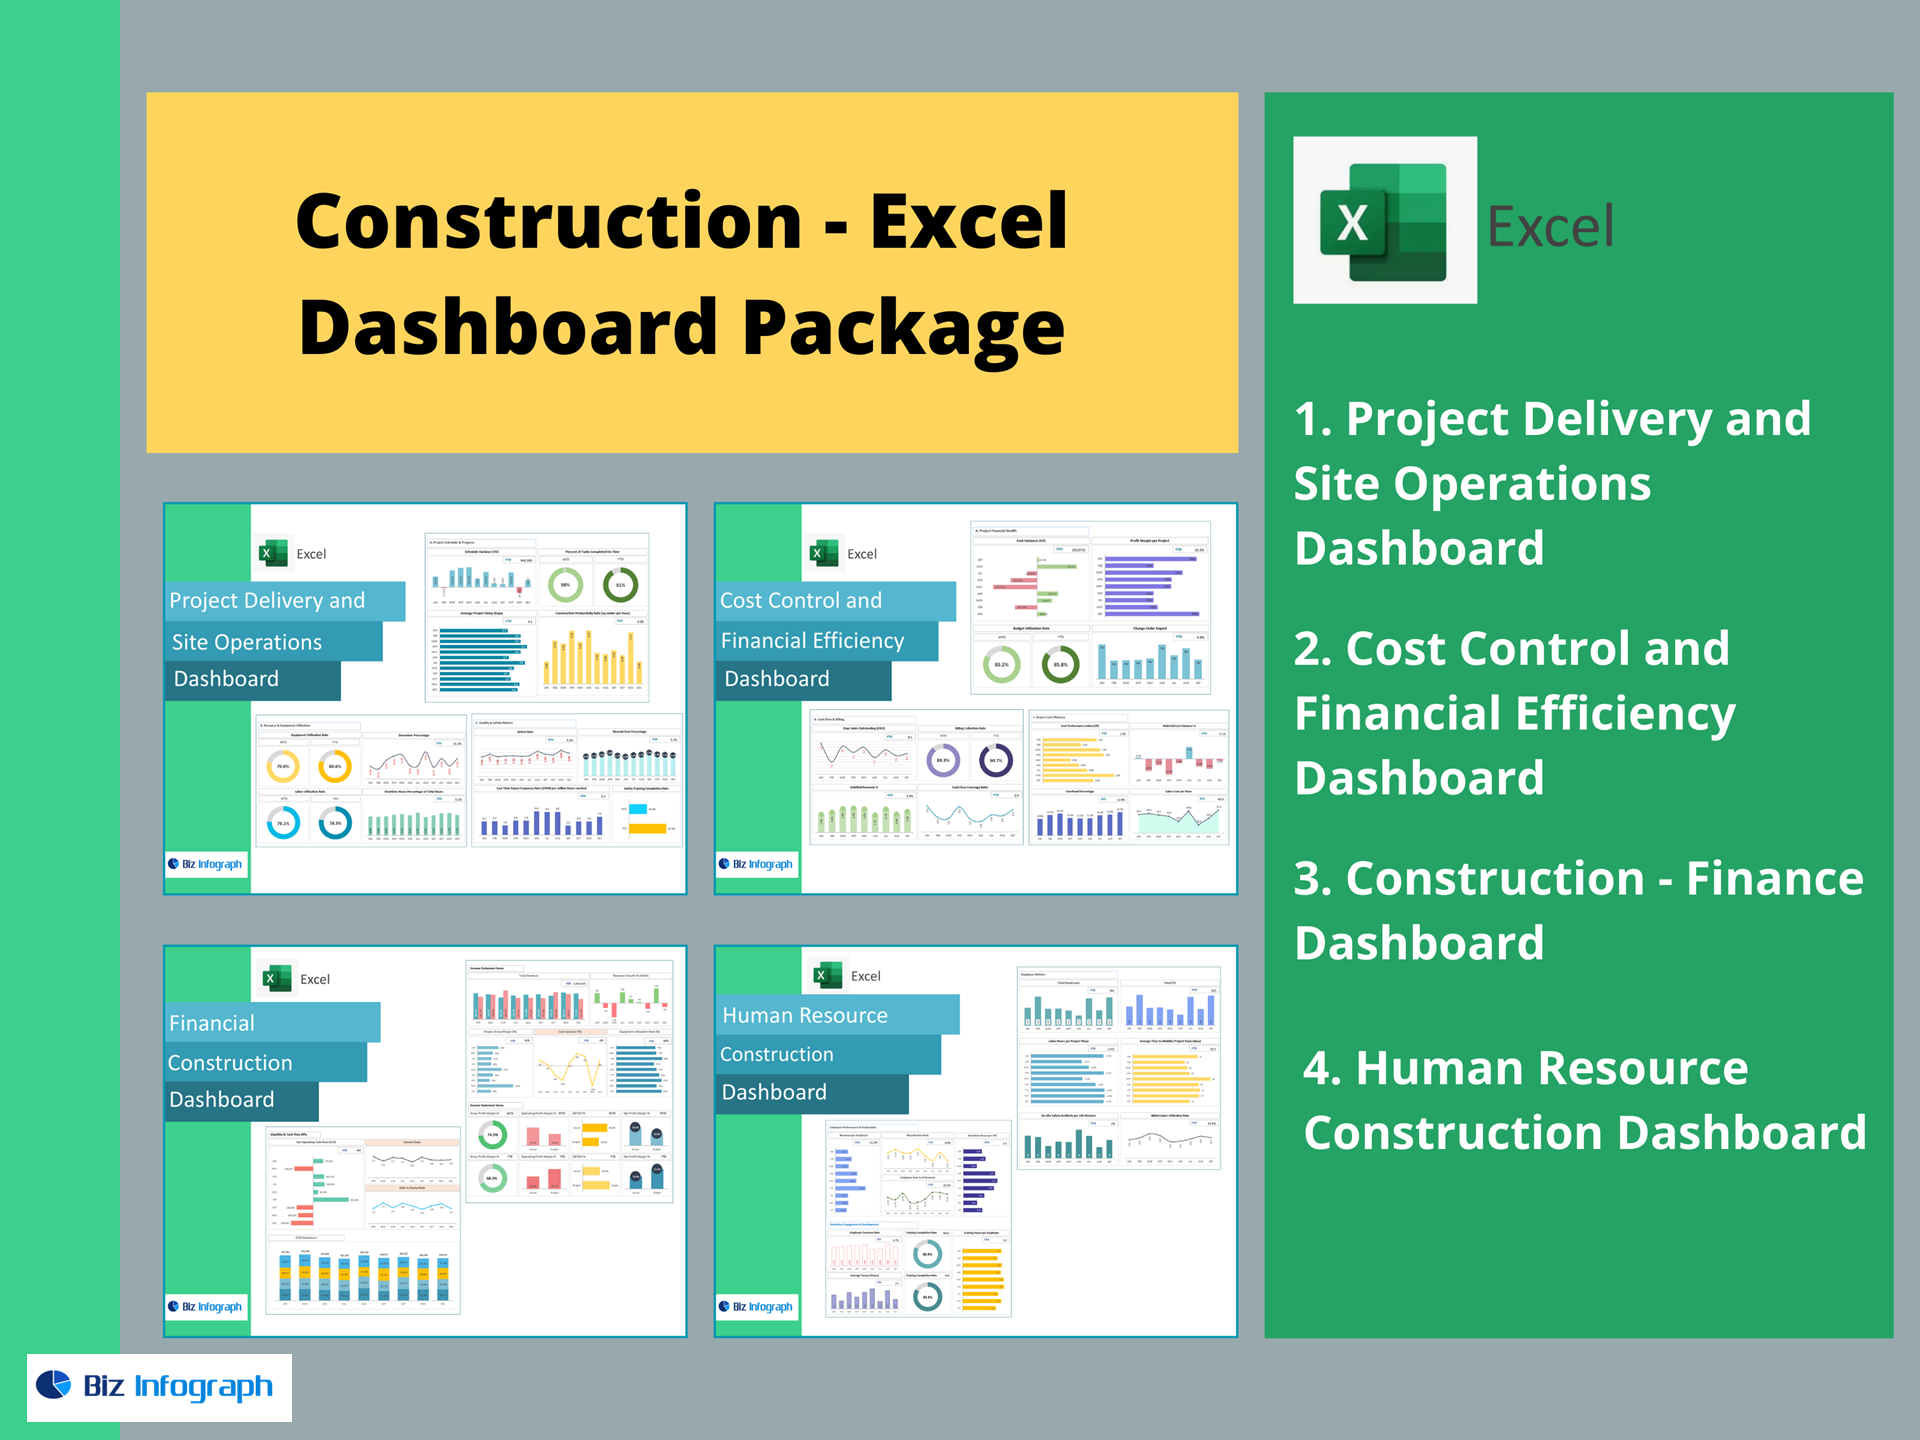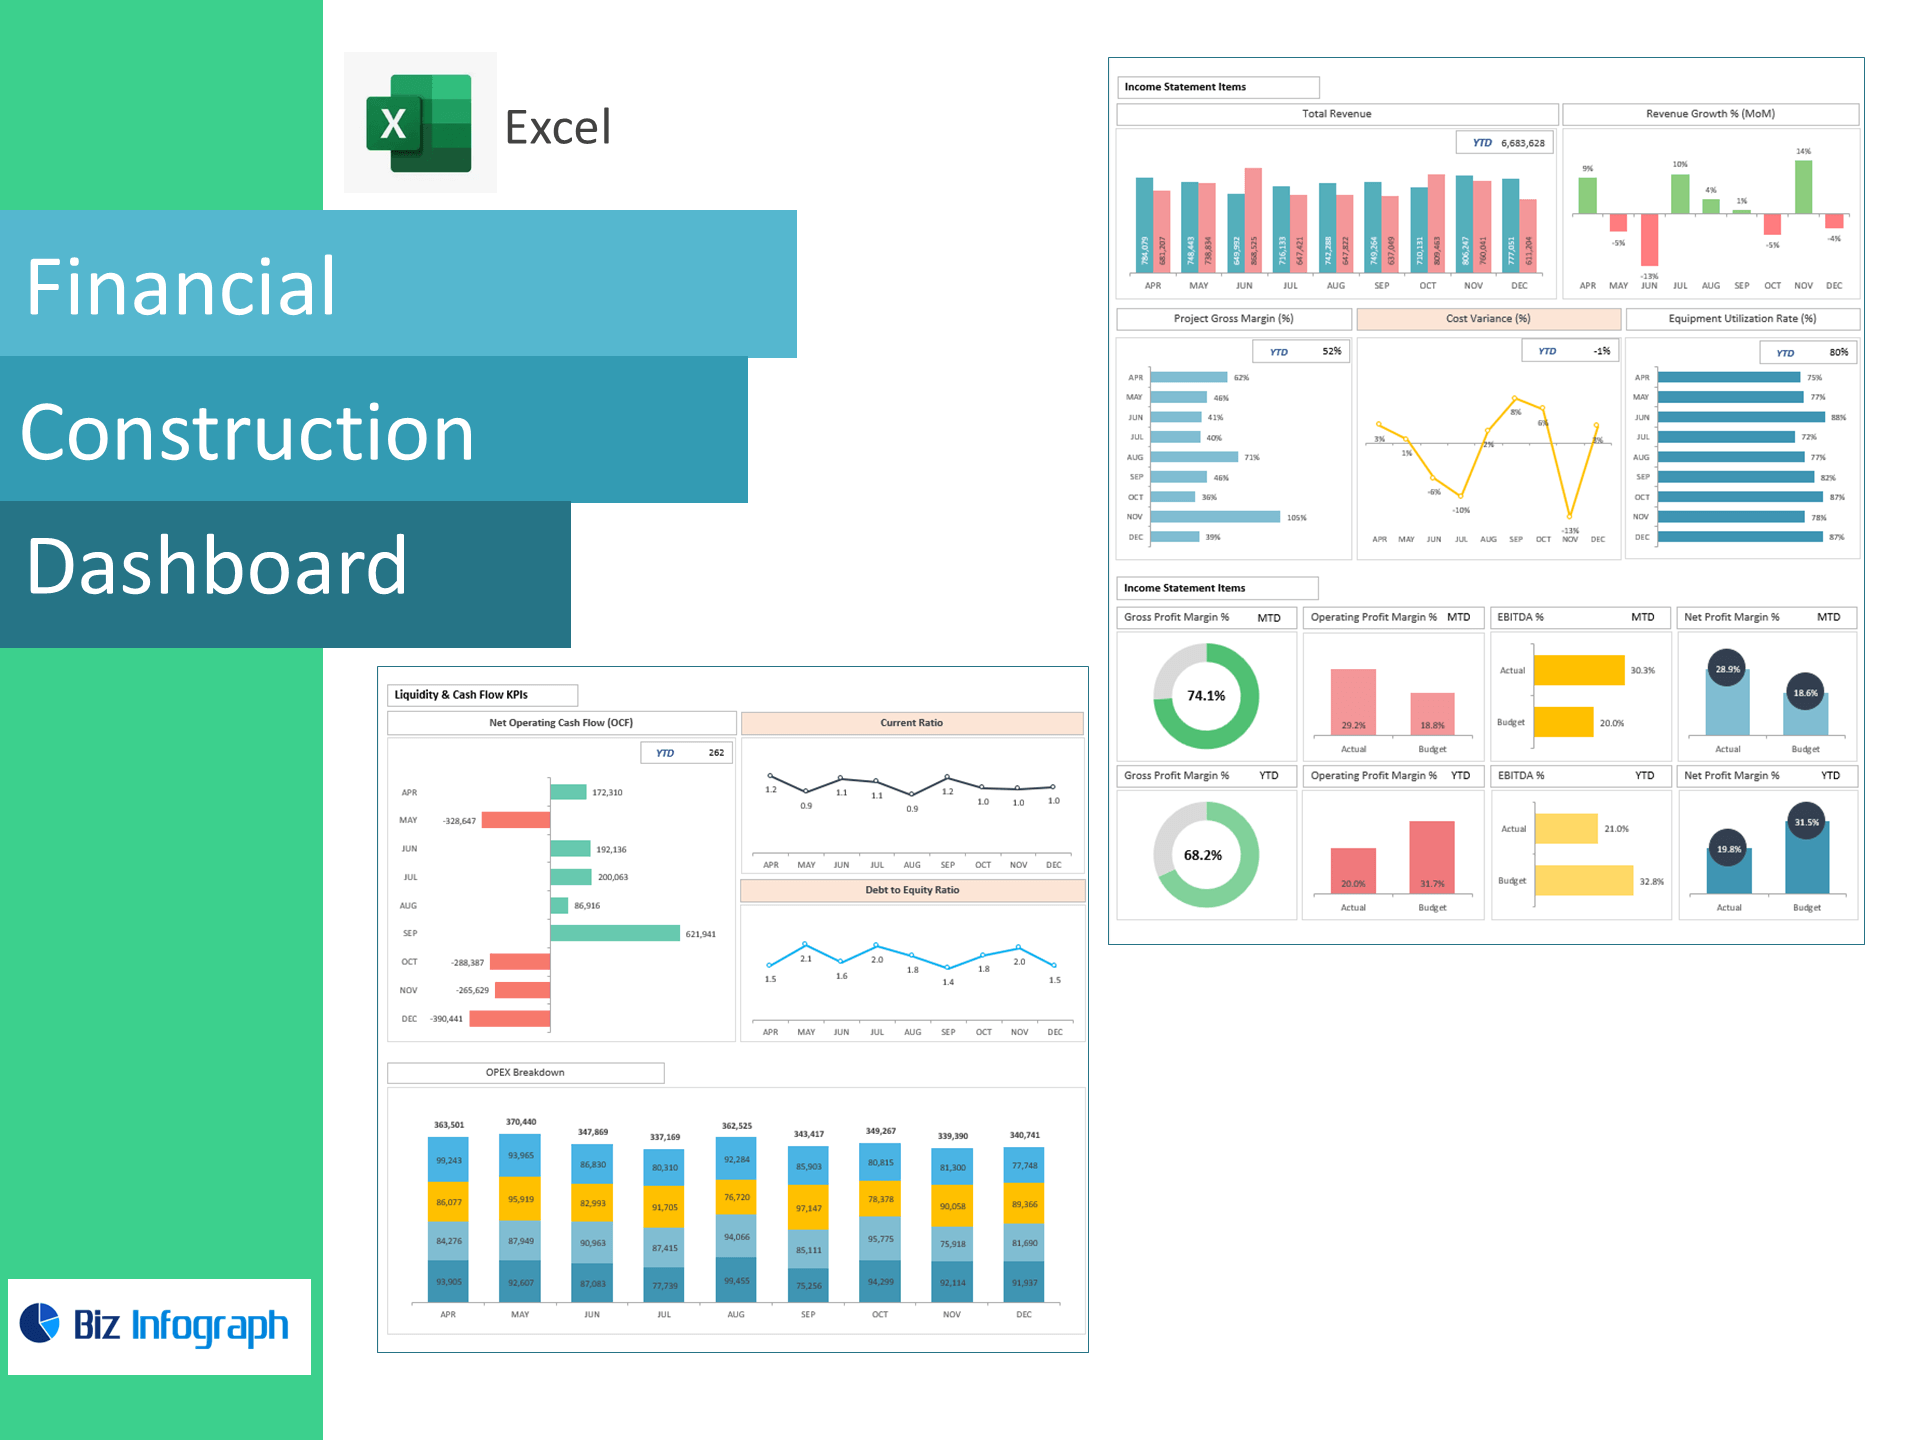
Construction Finance Dashboard — Excel Template
Control project margins, cash flow, and equipment utilization—right in Excel. Designed for GC’s, subcontractors, and owners, this template converts job-cost, GL, and timesheet exports into a board-ready dashboard tracking Revenue Growth, Gross/Operating/EBITDA/Net Profit, Net Operating Cash Flow (OCF), Current Ratio, Debt-to-Equity, Project Gross Margin, Cost Variance, and Equipment Utilization—so you can keep bids profitable and jobs on schedule.
Why construction teams choose this template
-
Finance + jobs in one view: Tie company P&L and liquidity to project-level KPIs.
-
Early warning signals: Catch margin erosion and cost overruns before they hit cash.
-
Excel-native: Paste CSVs from your accounting and field tools—no add-ins or BI setup.
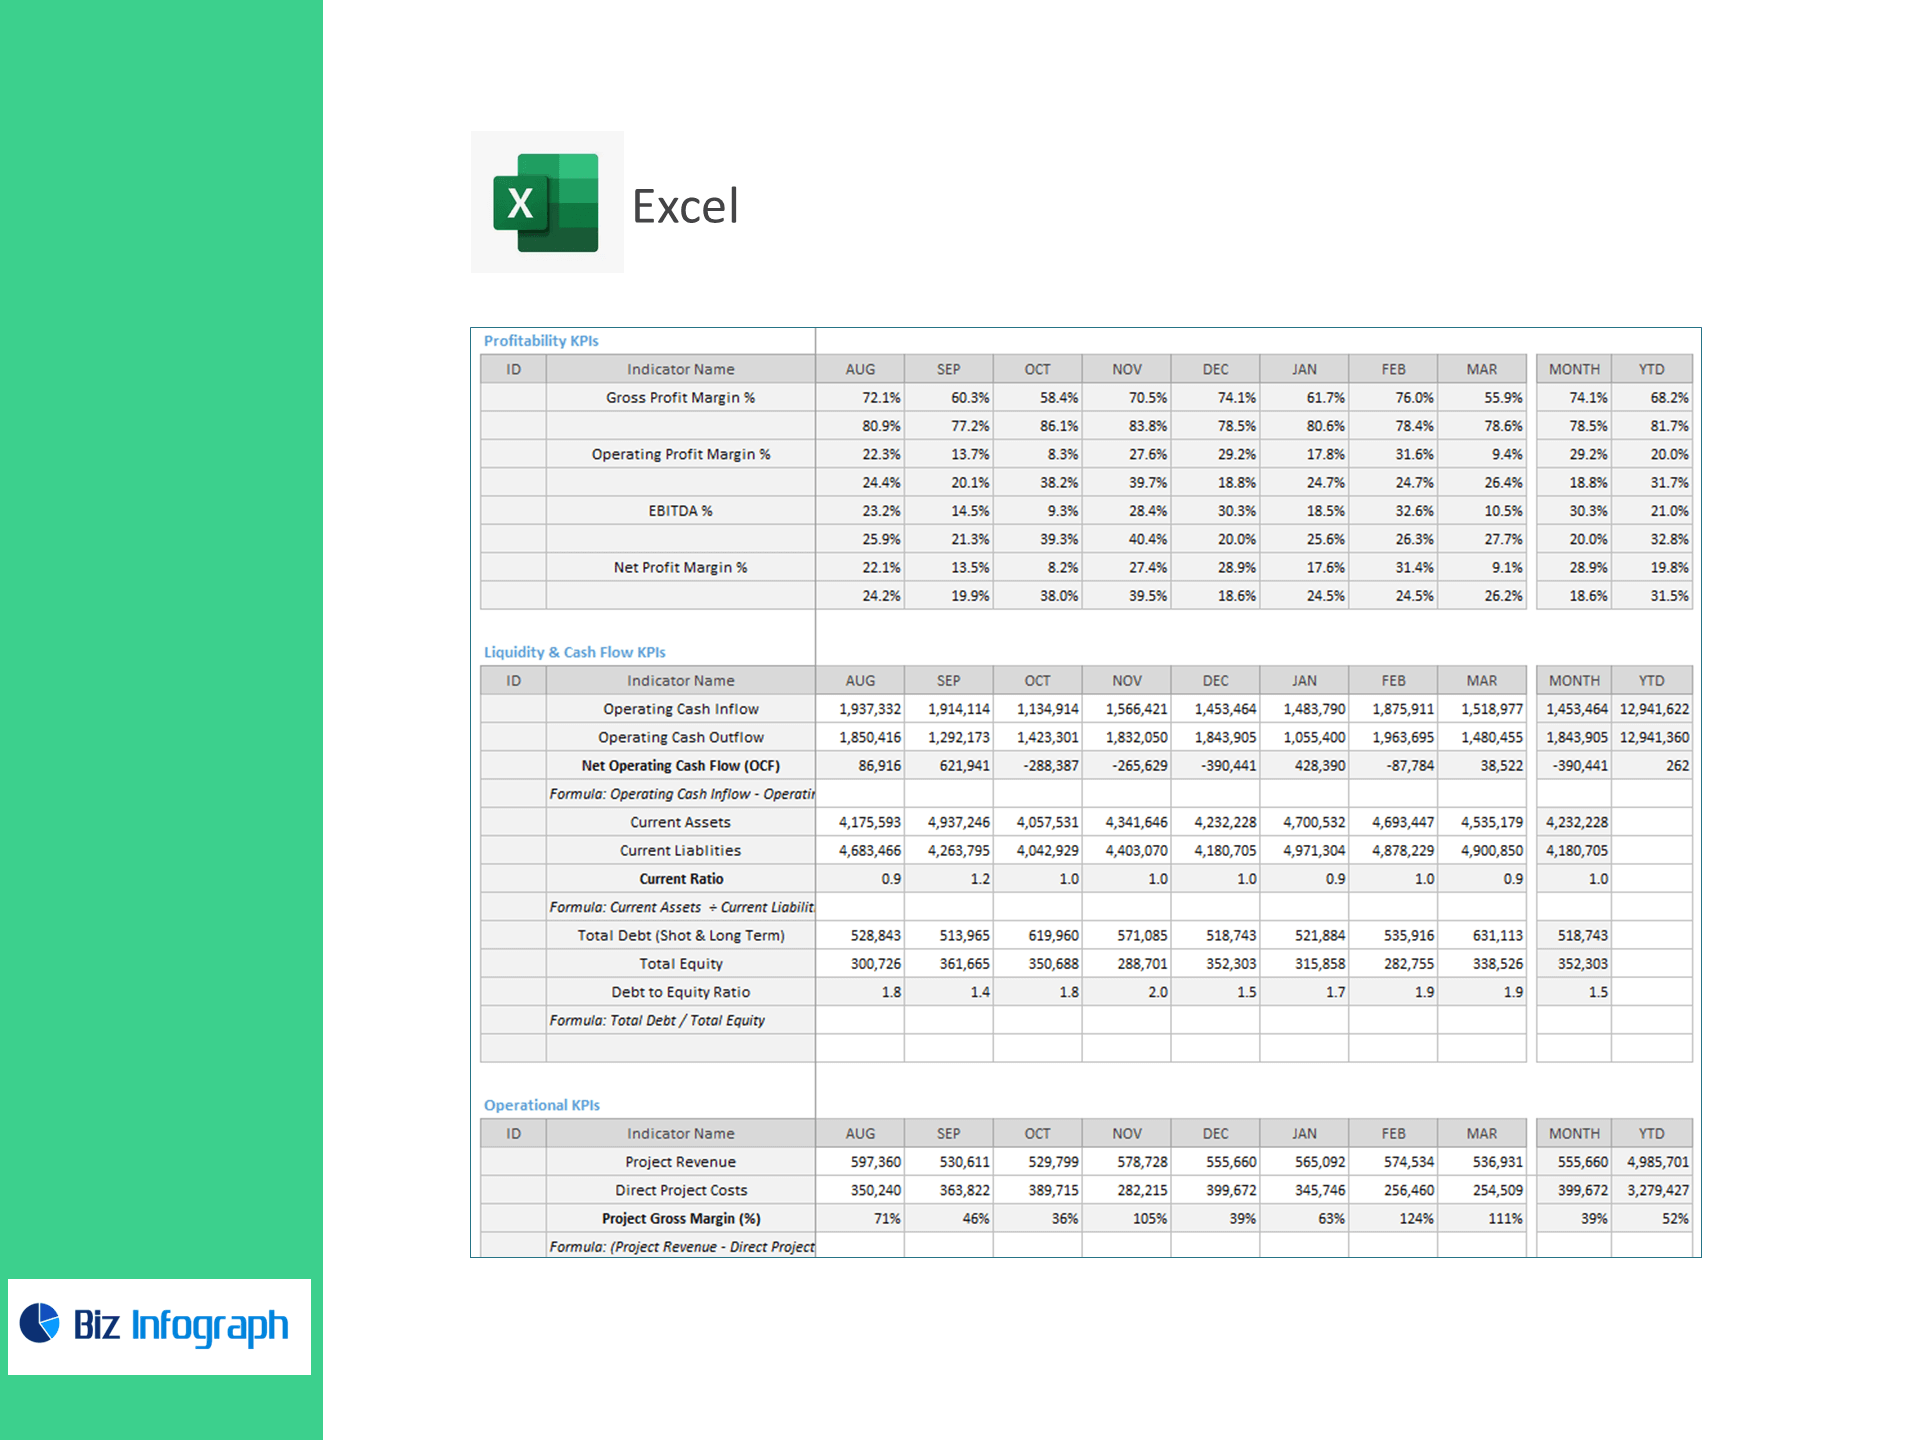
KPIs included (ready-made formulas)
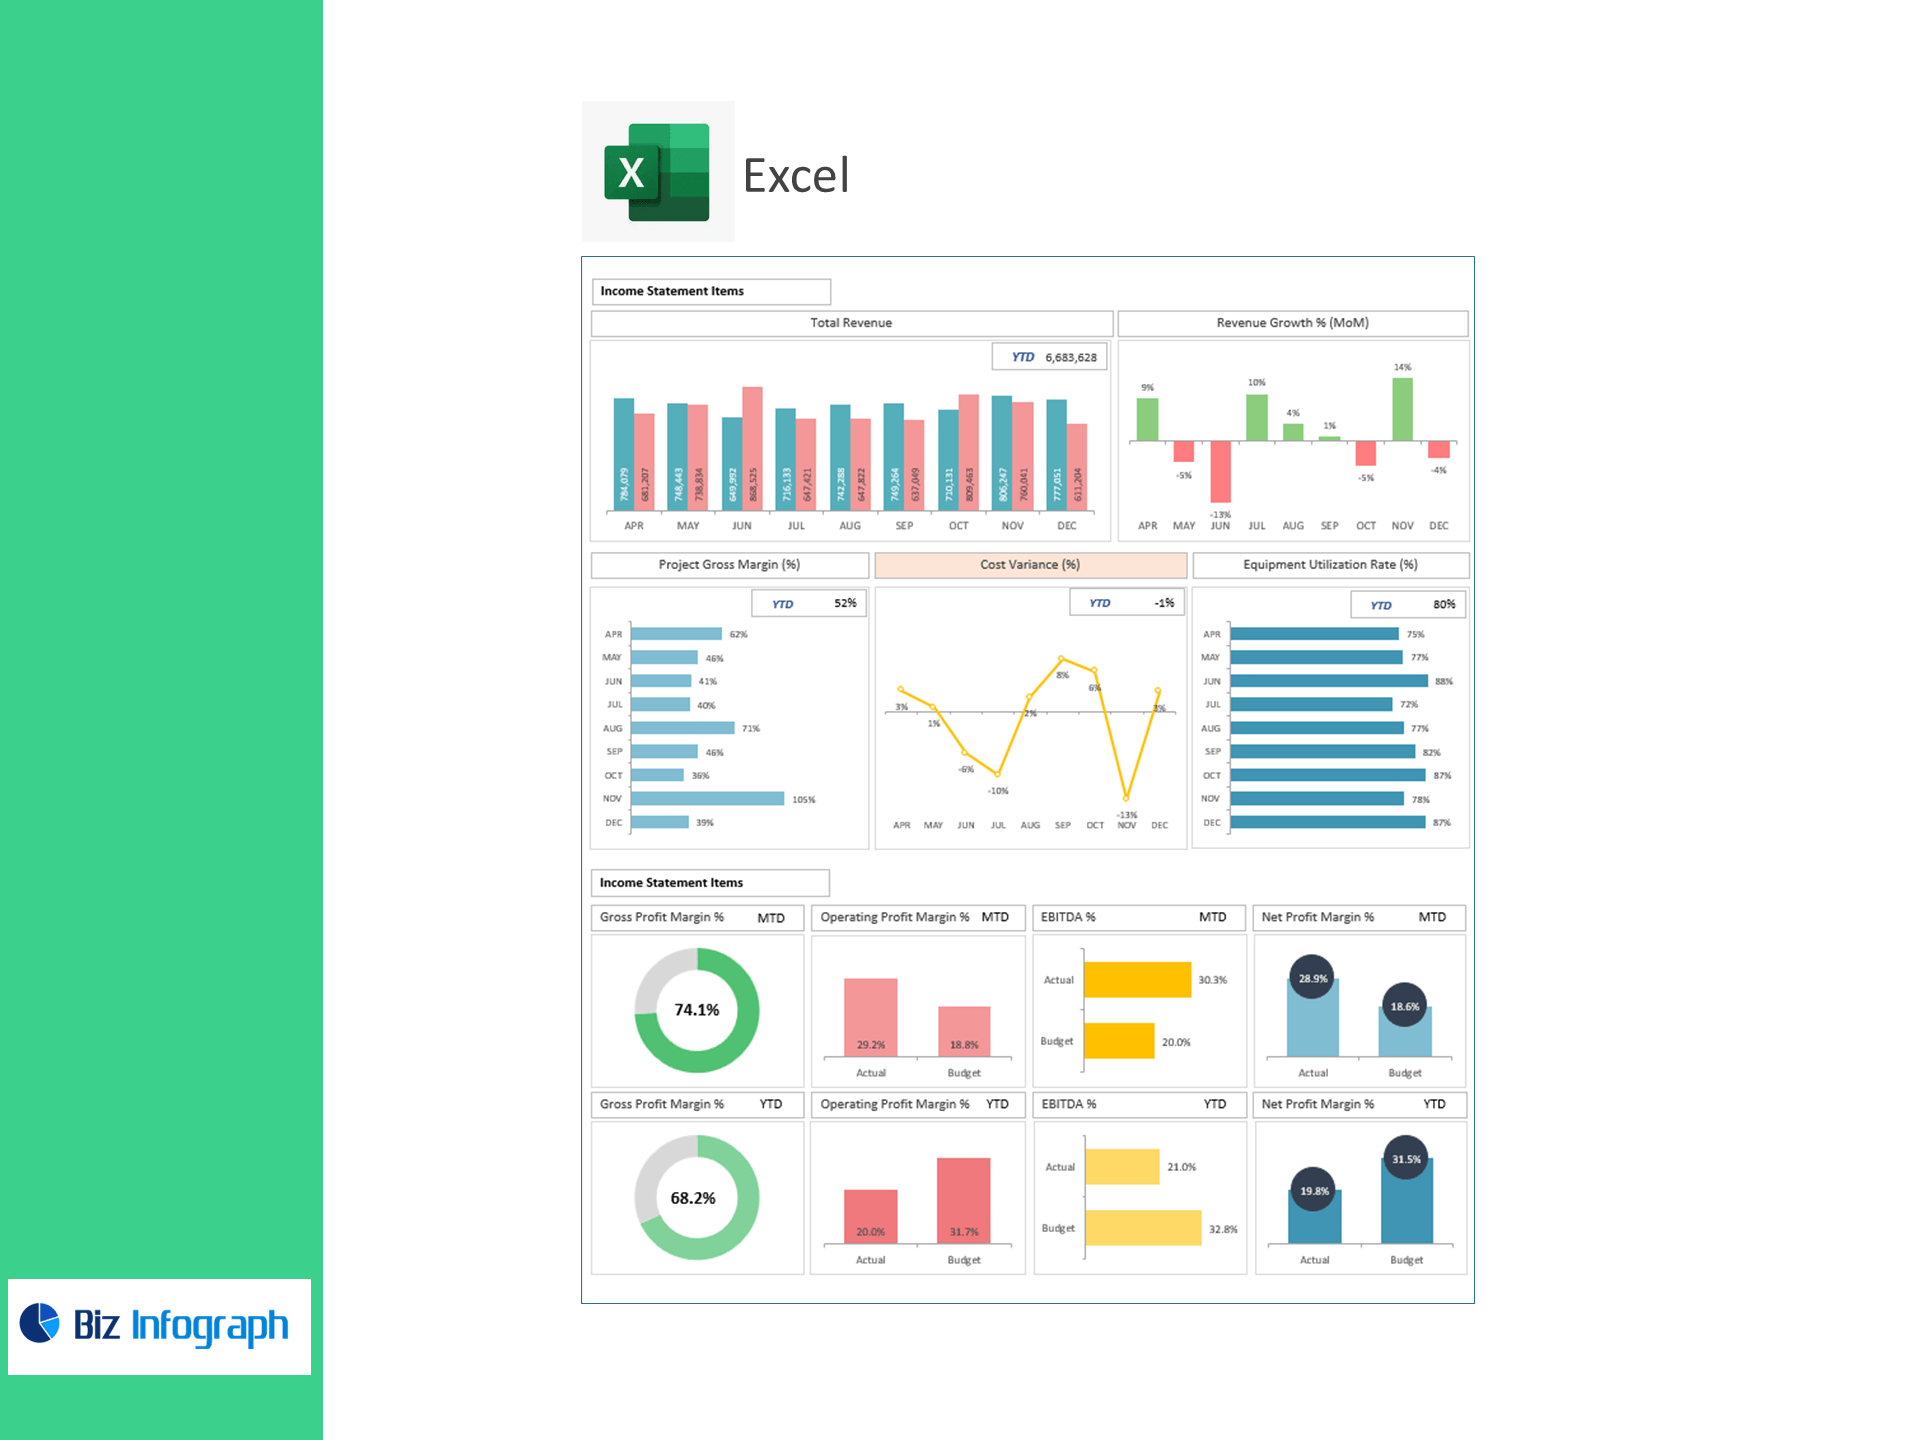
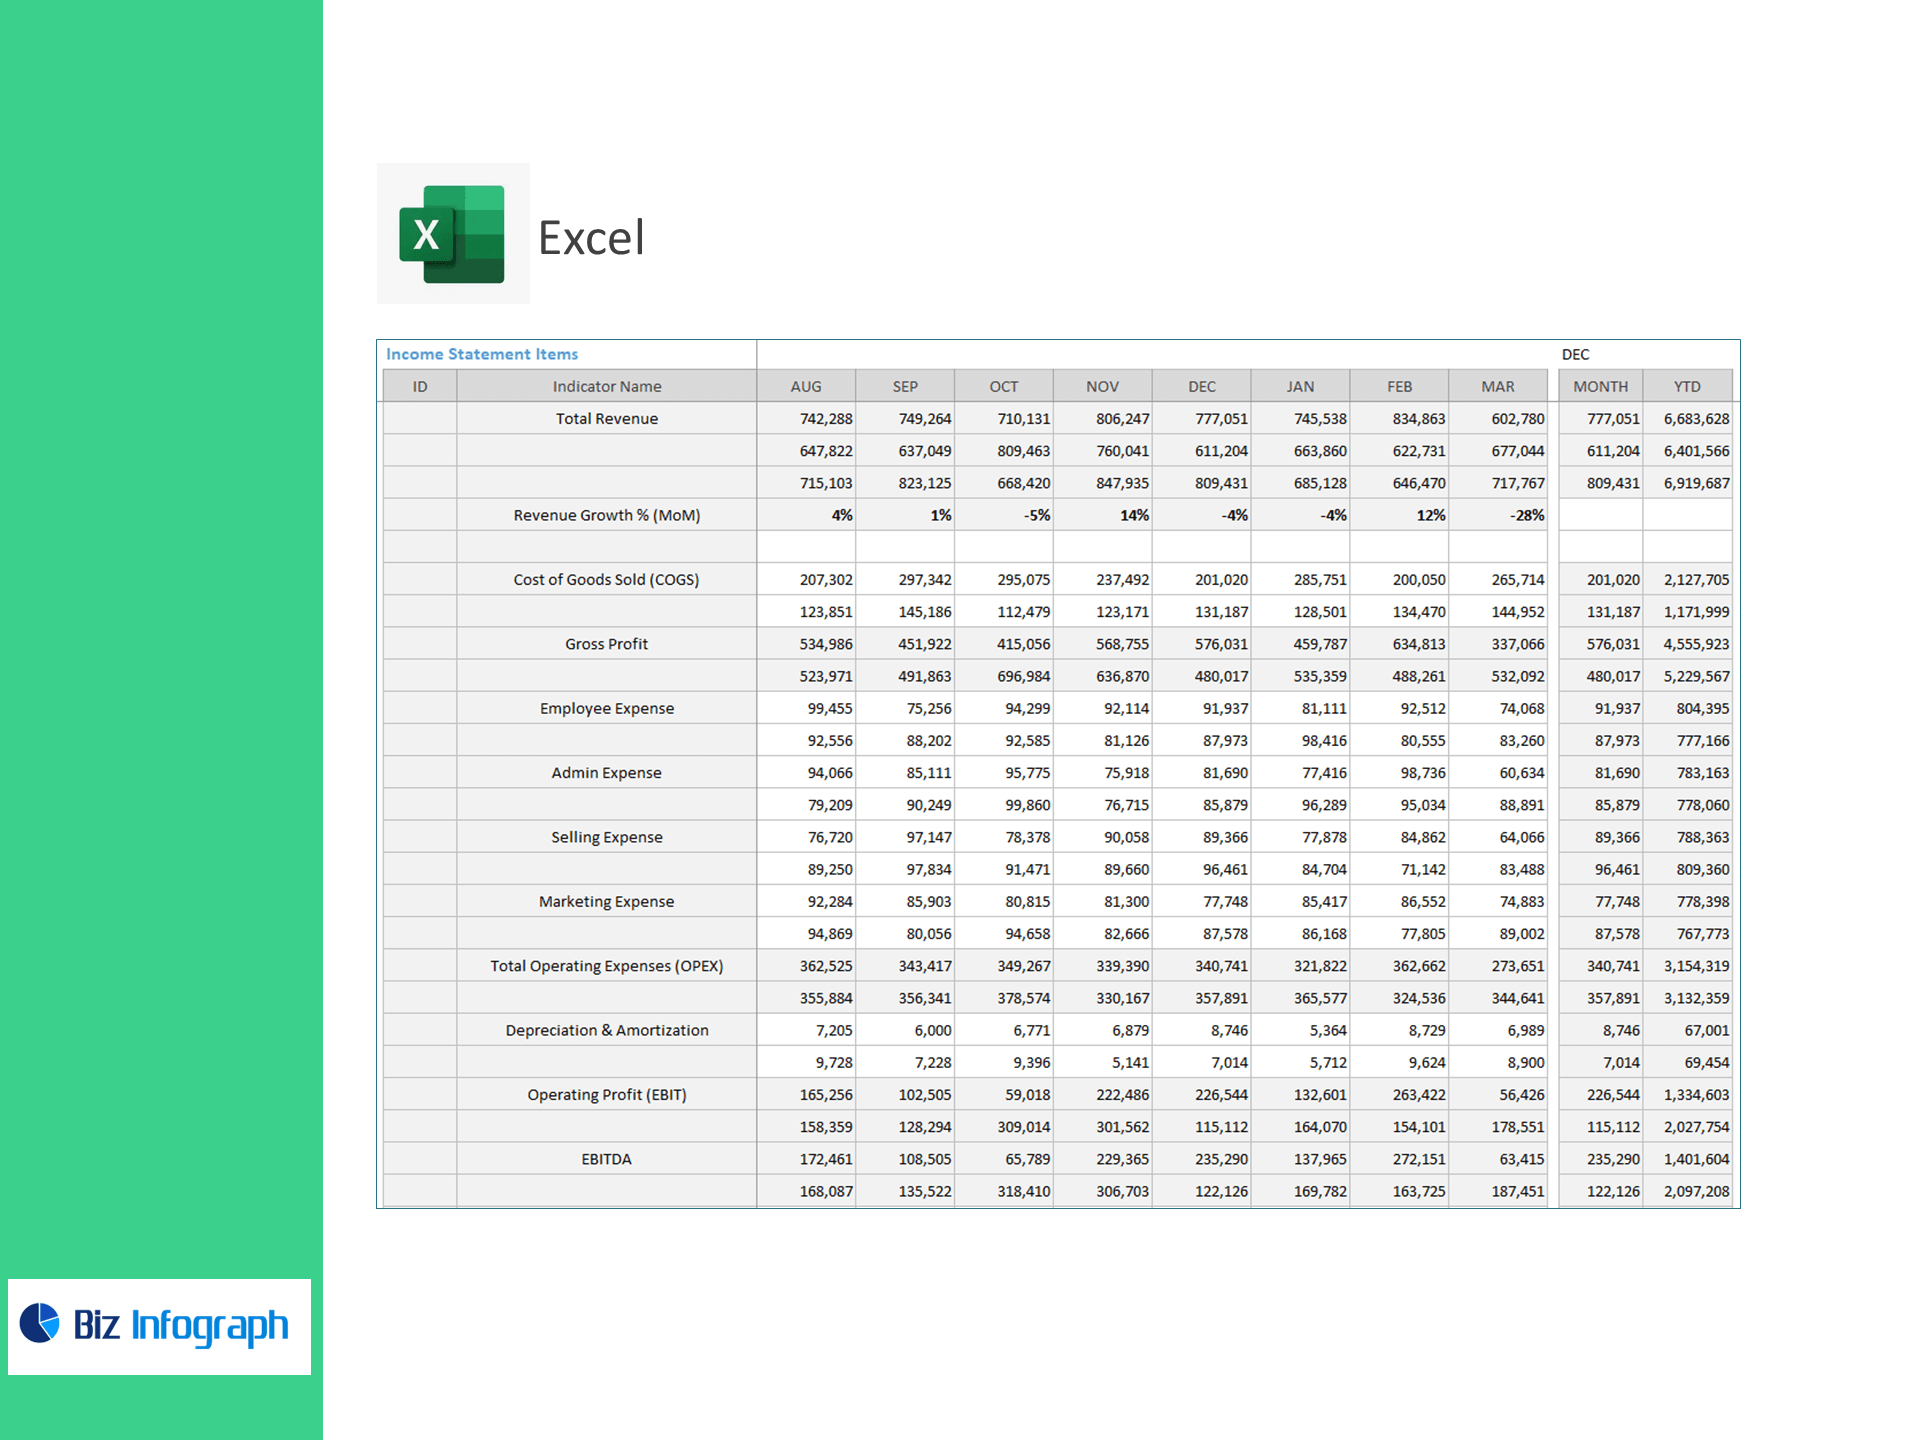
Income Statement & Profitability
-
Total Revenue; Revenue Growth % (MoM)
-
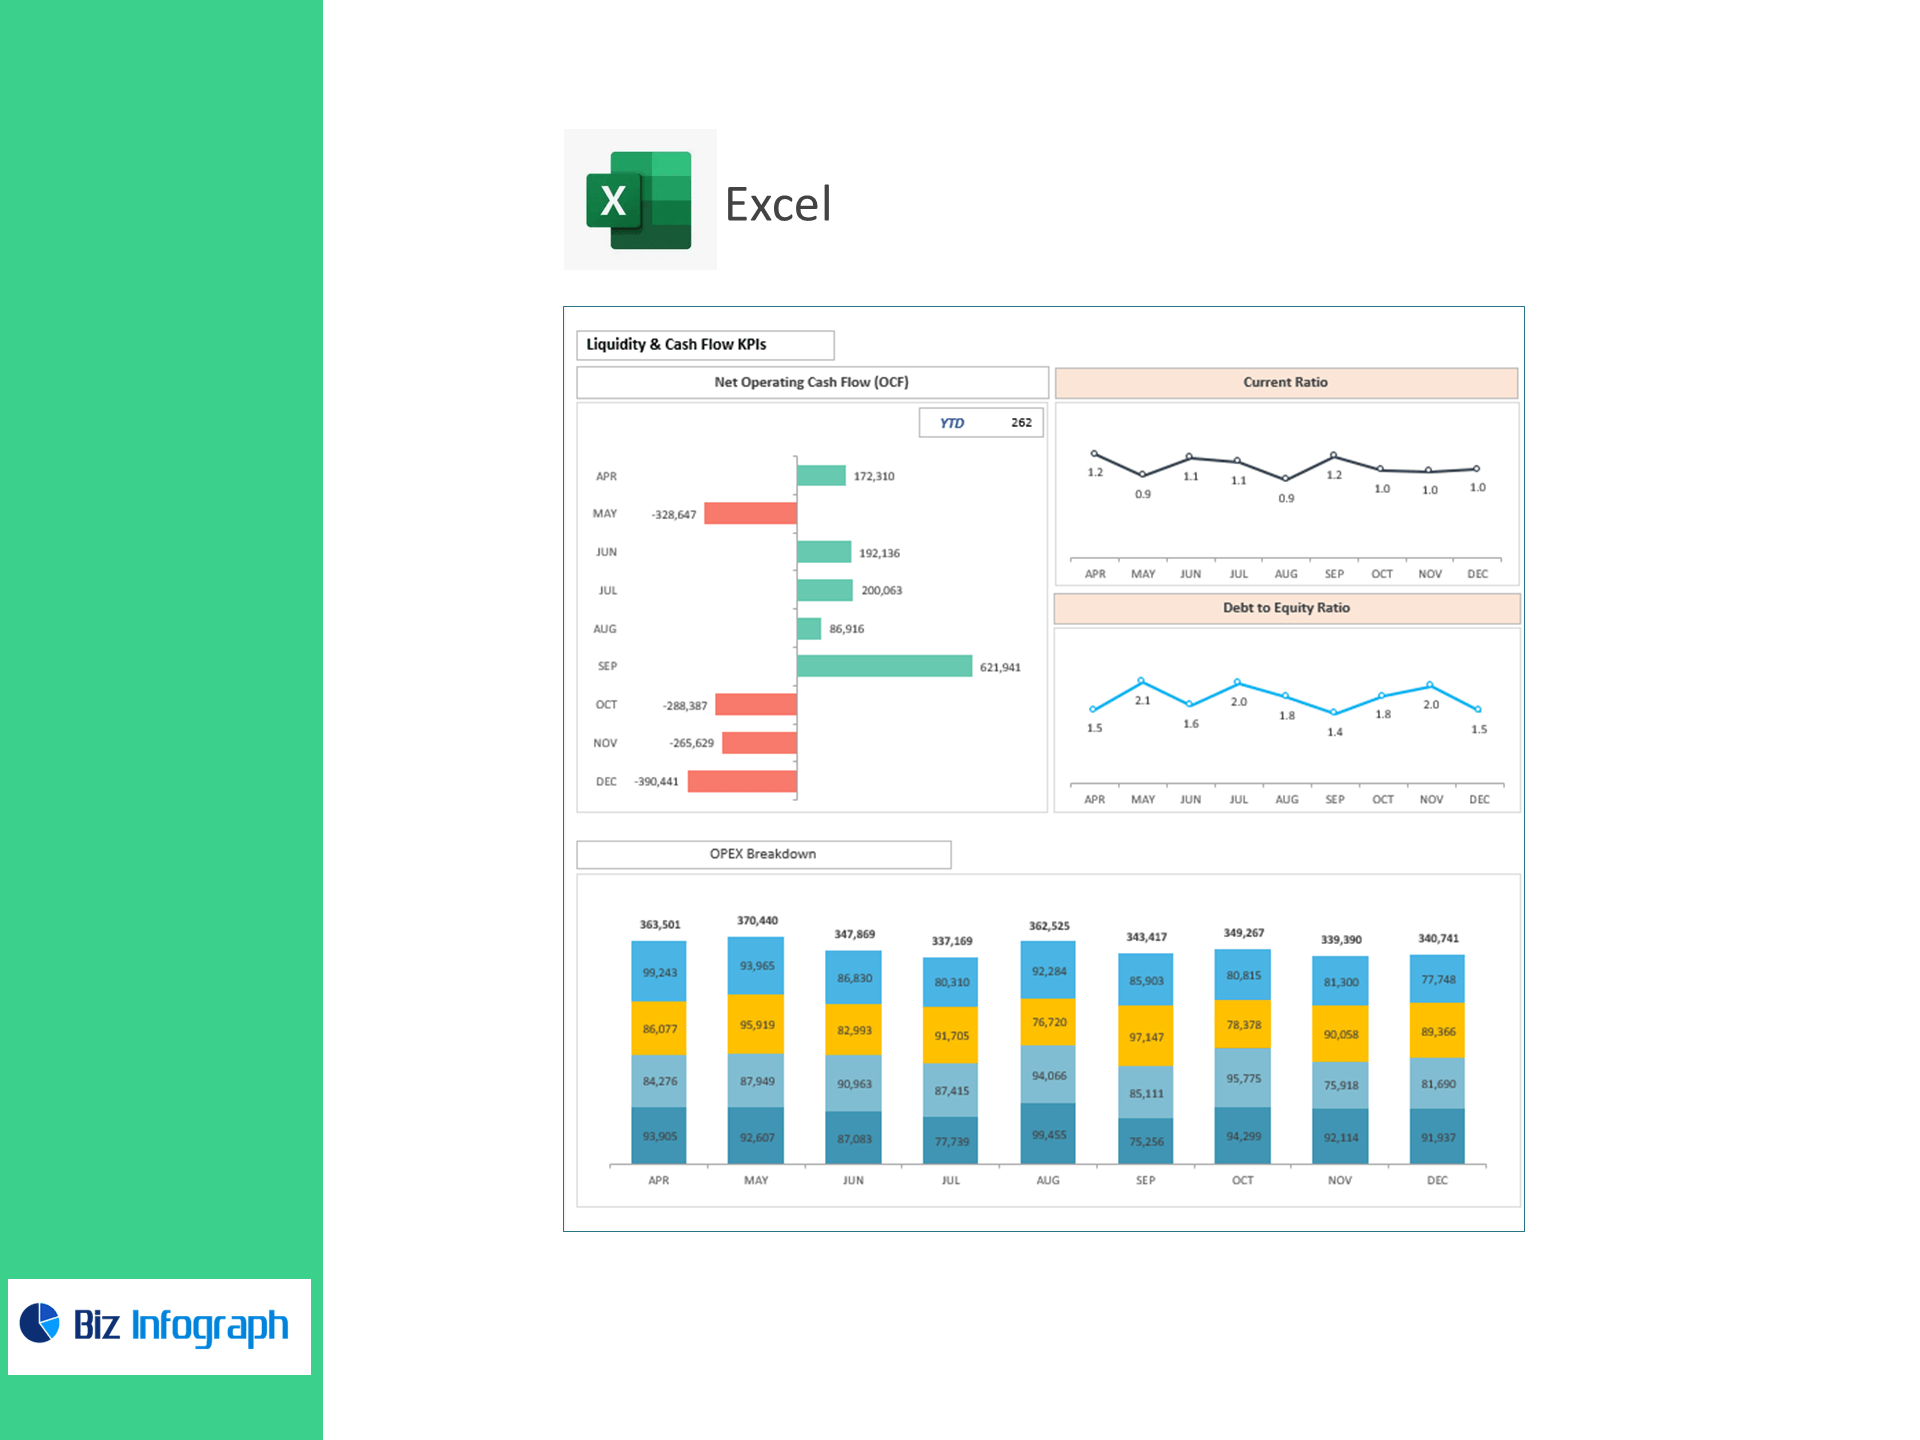
COGS, Gross Profit, Employee/Admin/Selling/Marketing → Total OPEX (+ OPEX breakdown)
-
Depreciation & Amortization, Operating Profit (EBIT), EBITDA, Interest, Other Inc/(Exp), Taxes, Net Profit
-
Gross Profit Margin %, Operating Profit Margin %, EBITDA %, Net Profit Margin %
Liquidity & Cash Flow
-
Operating Cash Inflow & Outflow → OCF = Inflow − Outflow
-
Current Ratio = Current Assets ÷ Current Liabilities
-
Debt-to-Equity = Total Debt ÷ Total Equity
Operational / Project Controls
-
Project Gross Margin (%) = (Project Revenue − Direct Project Costs) ÷ Project Revenue × 100
-
Cost Variance (%) = (Budgeted Cost − Actual Cost) ÷ Budgeted Cost × 100
-
Equipment Utilization (%) = Hours Used ÷ Total Available Hours × 100
What’s inside
-
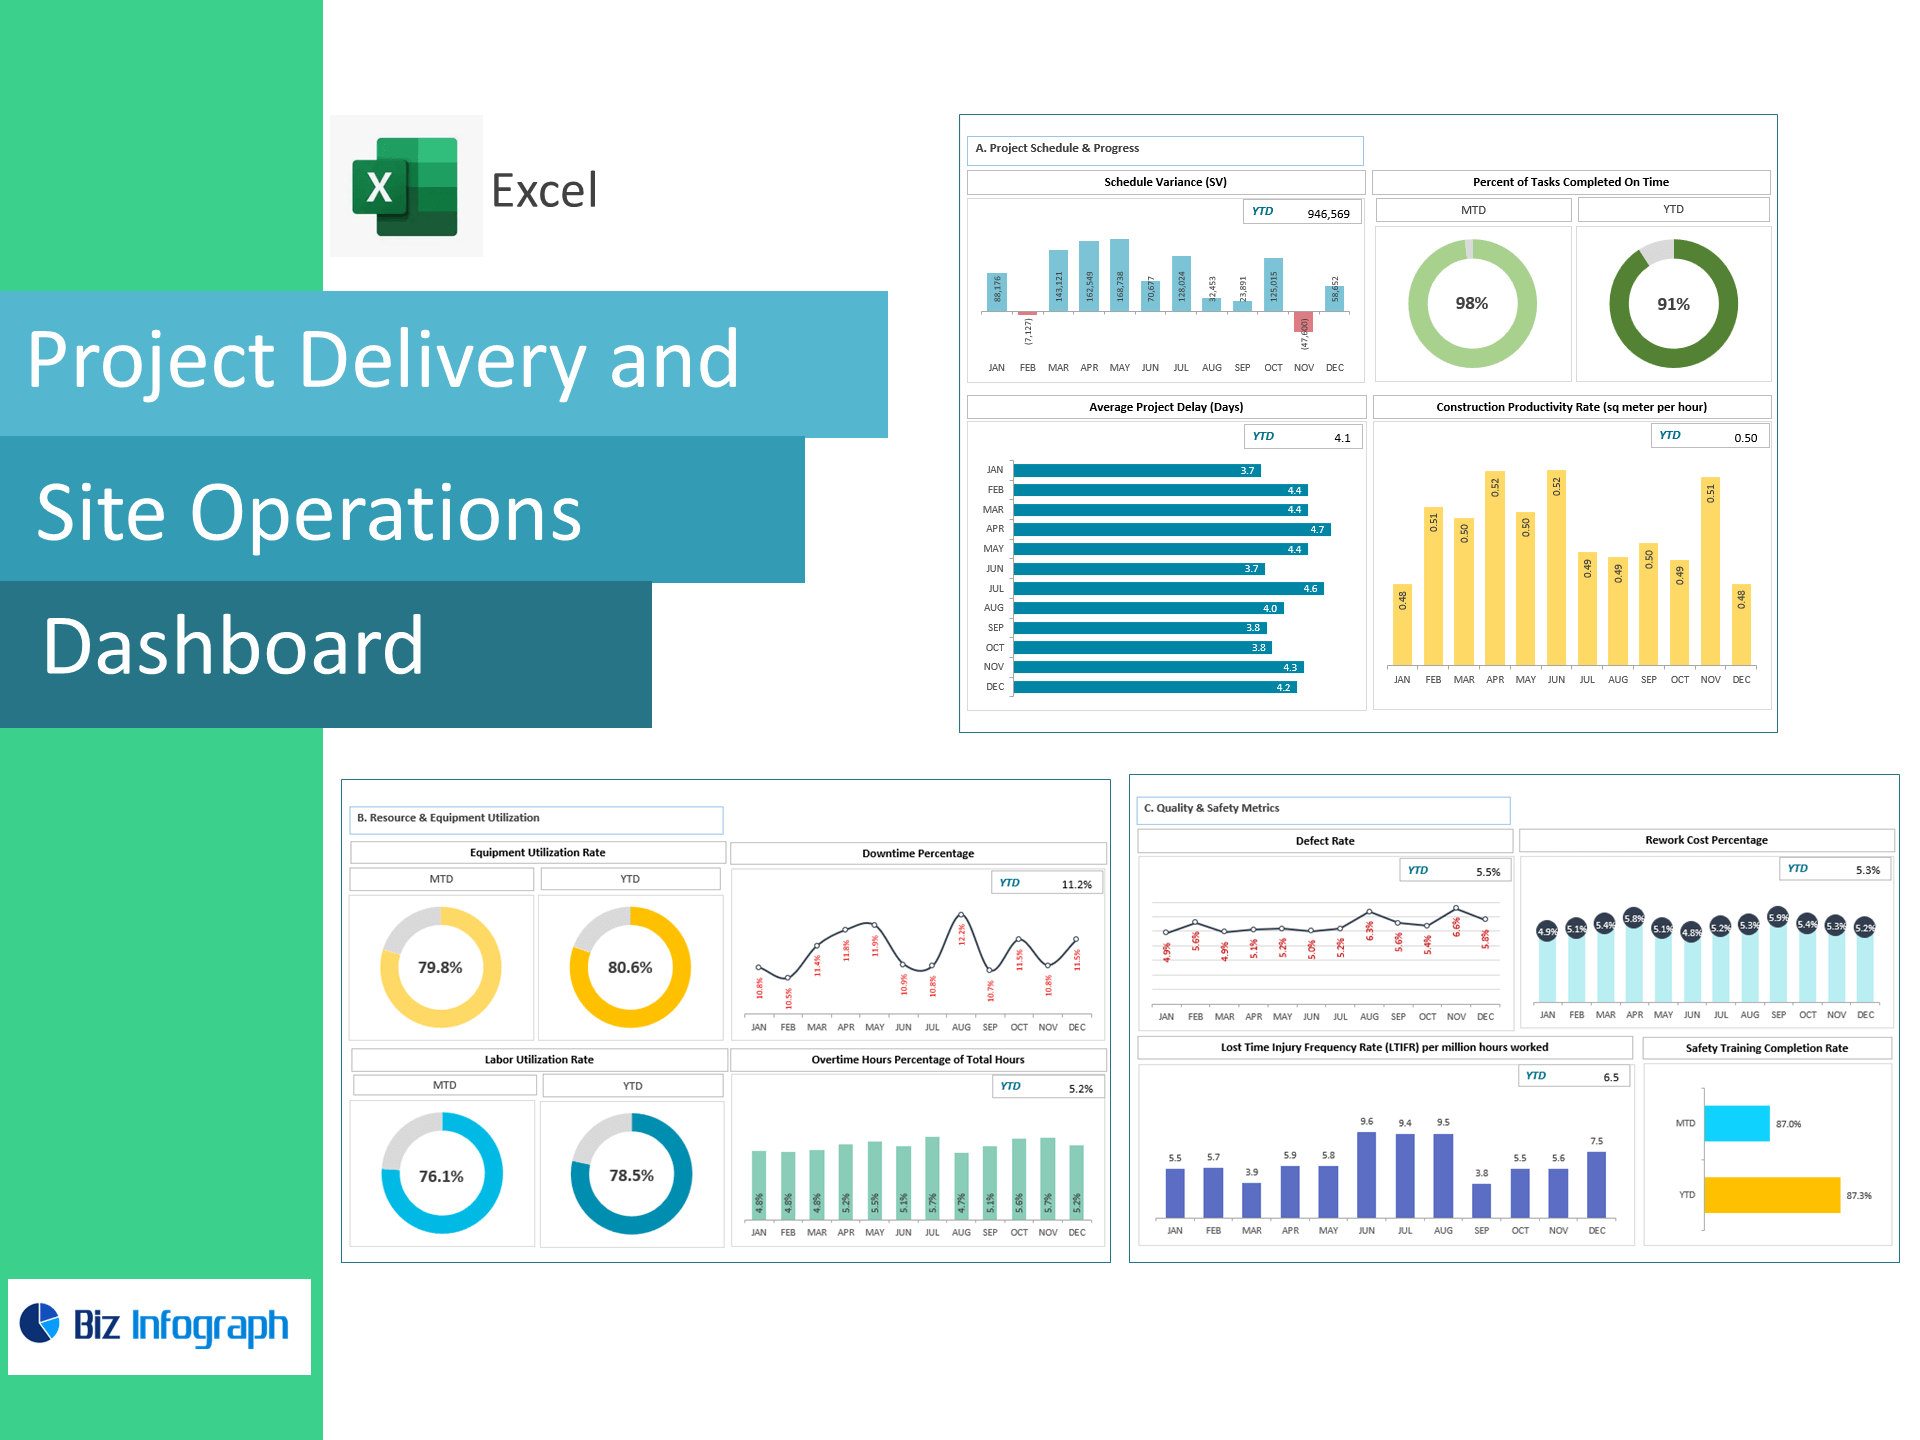
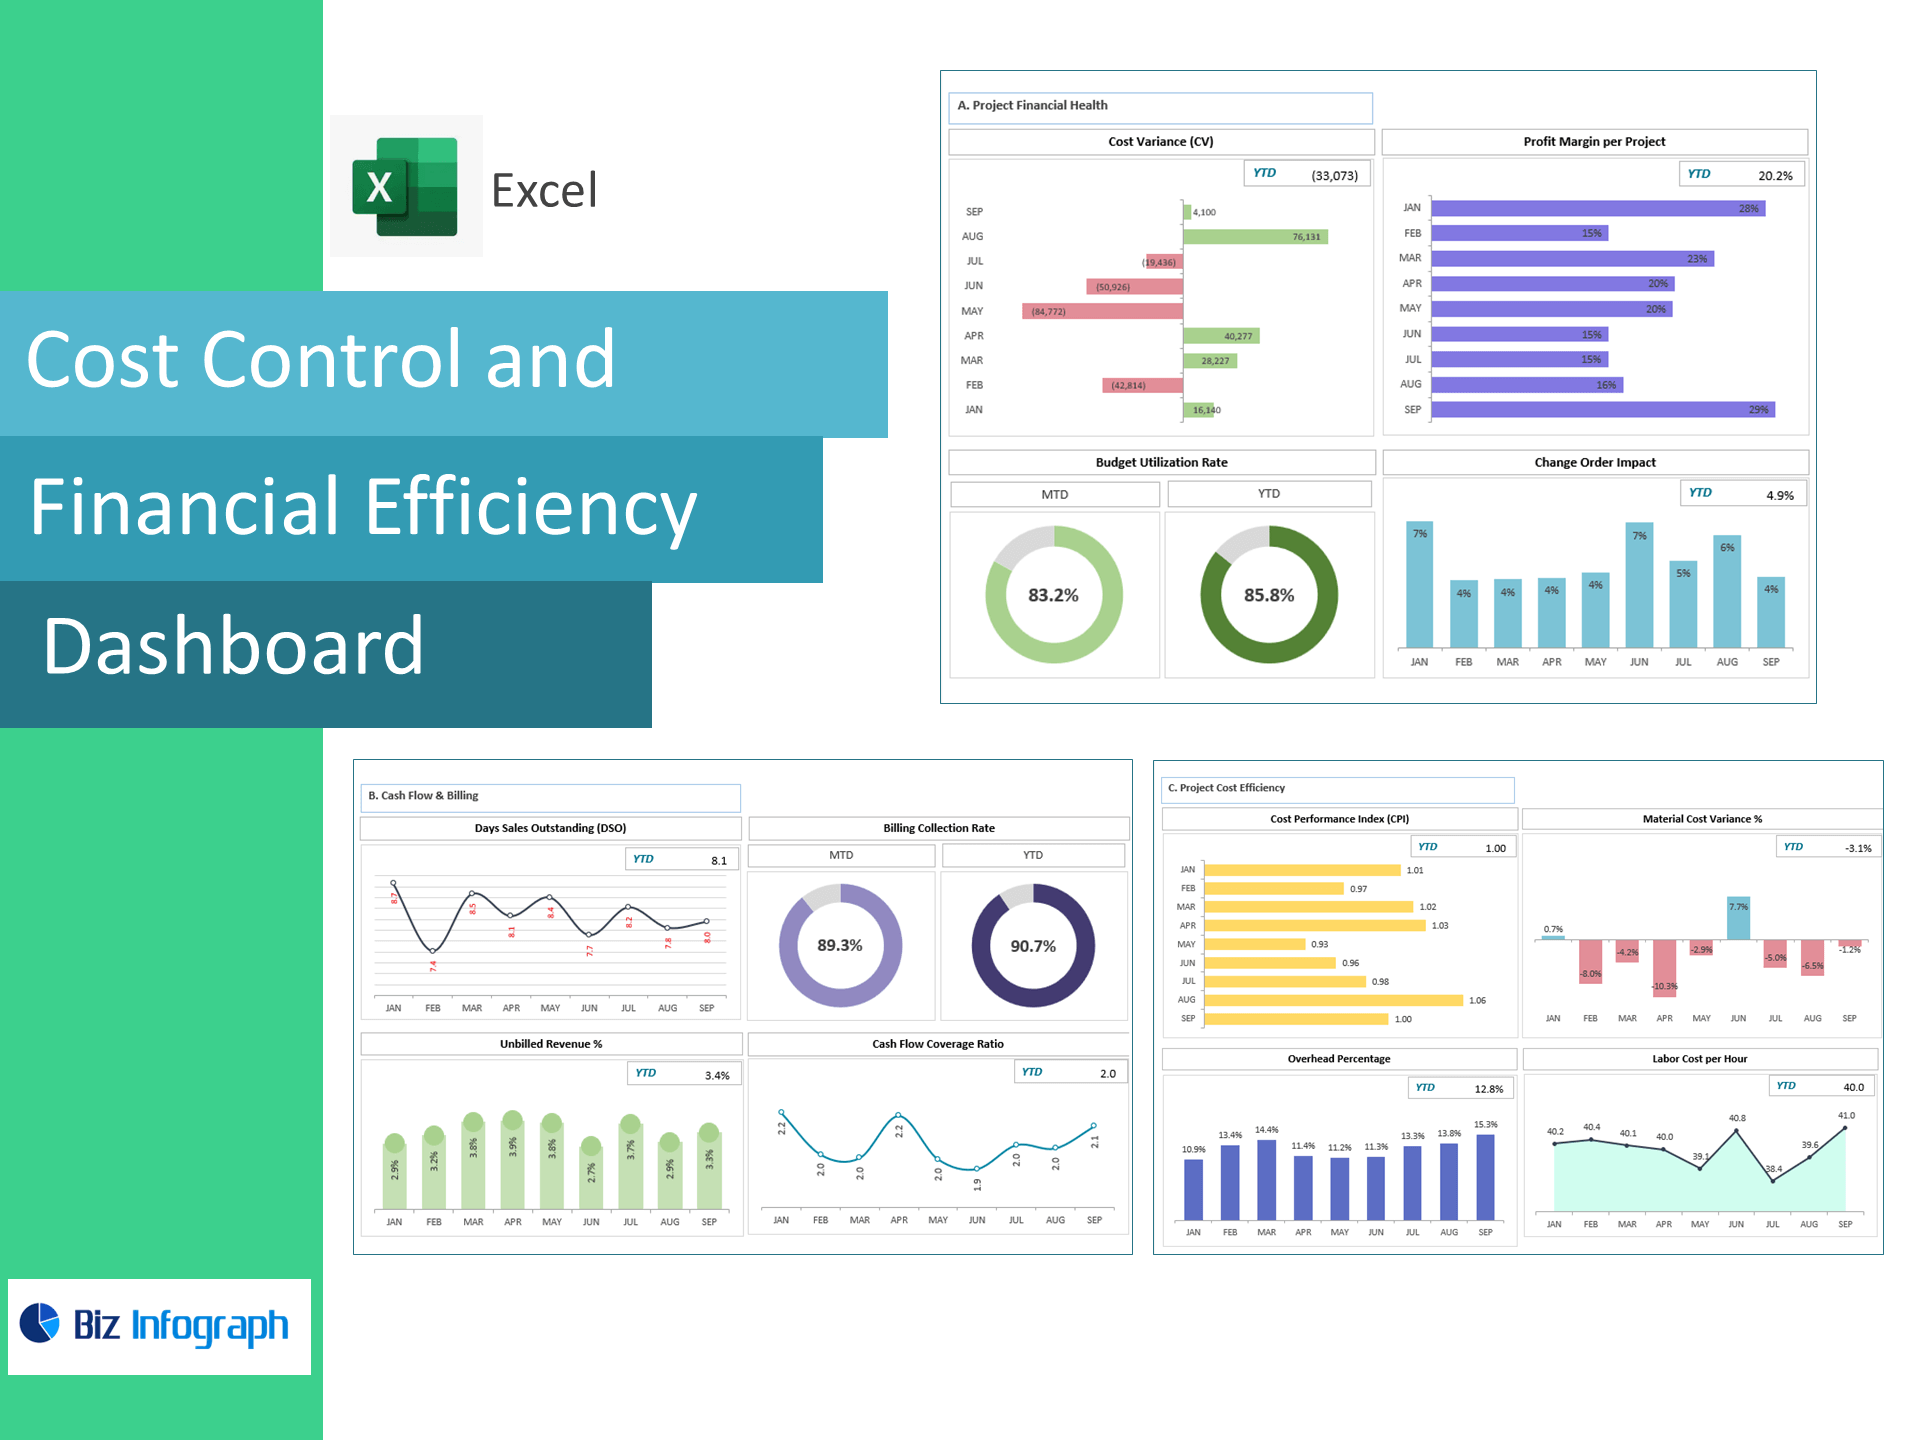
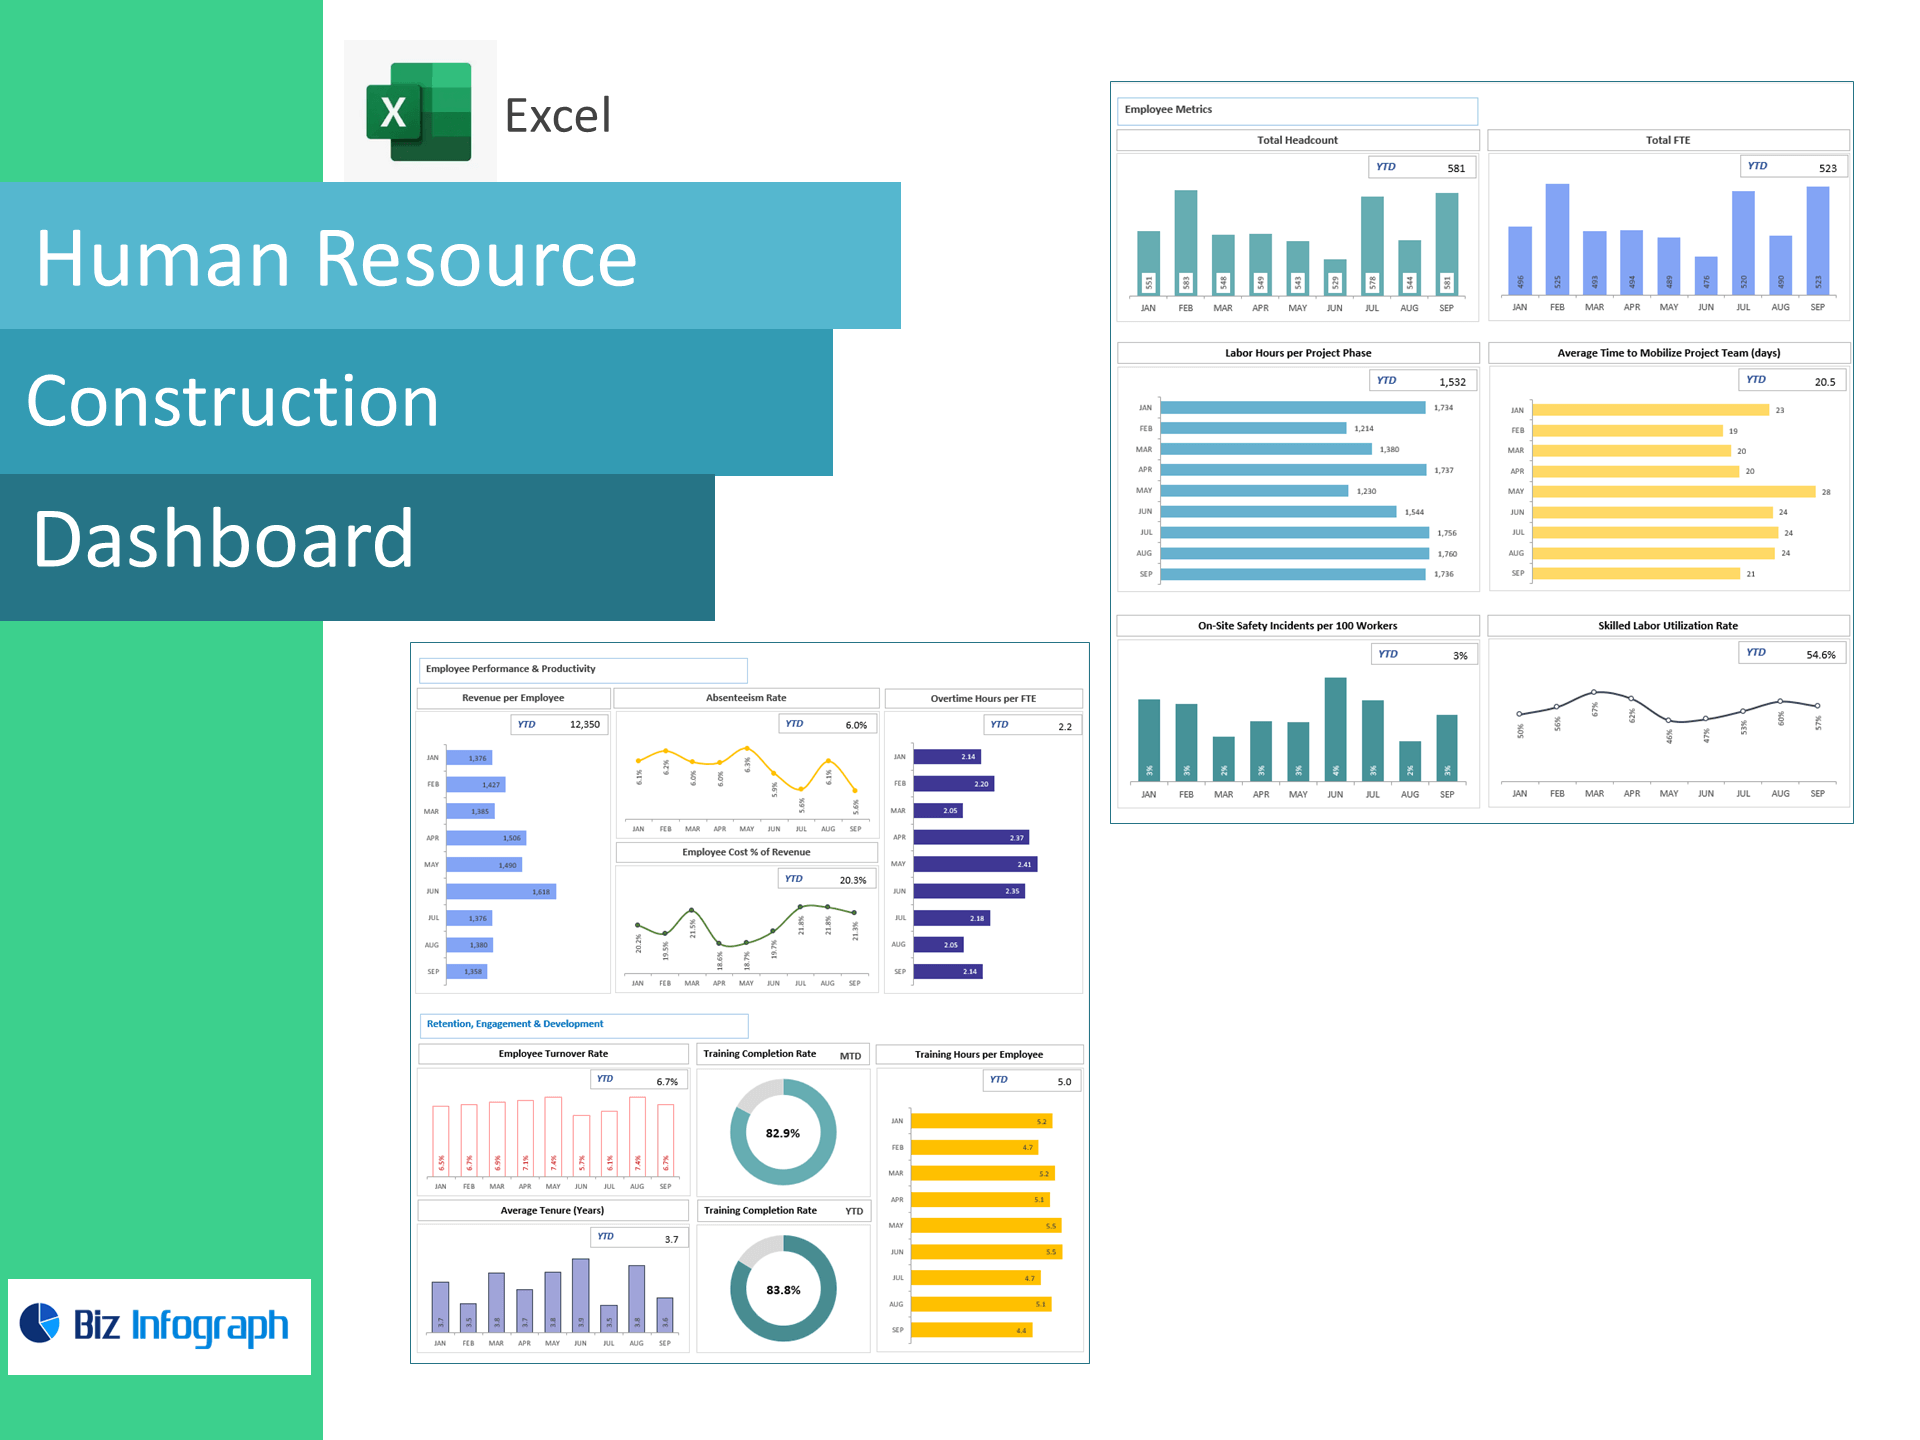
Executive Dashboard: Tiles & trends for profit, OCF, liquidity, leverage, and margins with variance to target.
-
Job Margin Tracker: Project revenue, direct costs, project GM%, and cost variance by job/phase.
-
Cash & Leverage Panel: OCF history, current ratio, and D/E covenant view.
-
Utilization Monitor: Equipment hours vs. availability by asset and site.
-
Targets & Assumptions: Enter KPI targets; automatic Above/Below Target flags.
-
Clean Data Sheets: Import-ready tables for P&L, cash flow, balance sheet, job costs, budgets, and equipment hours.
Benefits
-
Protect margins: Spot budget overruns and slippage early.
-
Safeguard liquidity: Manage OCF and current ratio through draw schedules and payables.
-
Use assets better: Lift equipment utilization and reduce idle time.
-
Decide faster: Investor-ready visuals with transparent, audit-friendly formulas.
For ready-to-use Dashboard Templates: