Supply Chain Performance & Risk Dashboard — Excel Template
Monitor supplier reliability, inventory health, and disruption risk—directly in Excel. This template turns procurement, inventory, and logistics data into a live dashboard tracking Supplier On-Time Rate, Defect Rate, Lead Time Variance, Fill Rate, Days of Supply, Stockout Rate, Carrying Cost, Cycle Stock Accuracy, Disruption Rate, Cost per Unit, Emergency Order Rate, and Risk-Adjusted Delivery Rate—so you can stabilize service levels and cut costs.
Why teams choose this template
-
End-to-end visibility: Supplier, inventory, and risk metrics in one actionable view.
-
Service + cost balance: Reduce stockouts and expedite spend while lowering carrying costs.
-
Risk ready: Track disruptions and high-risk zone performance to protect OTIF.
-
Excel-native: Paste data and go—no add-ins or BI setup required.
KPIs included (with ready-made formulas)
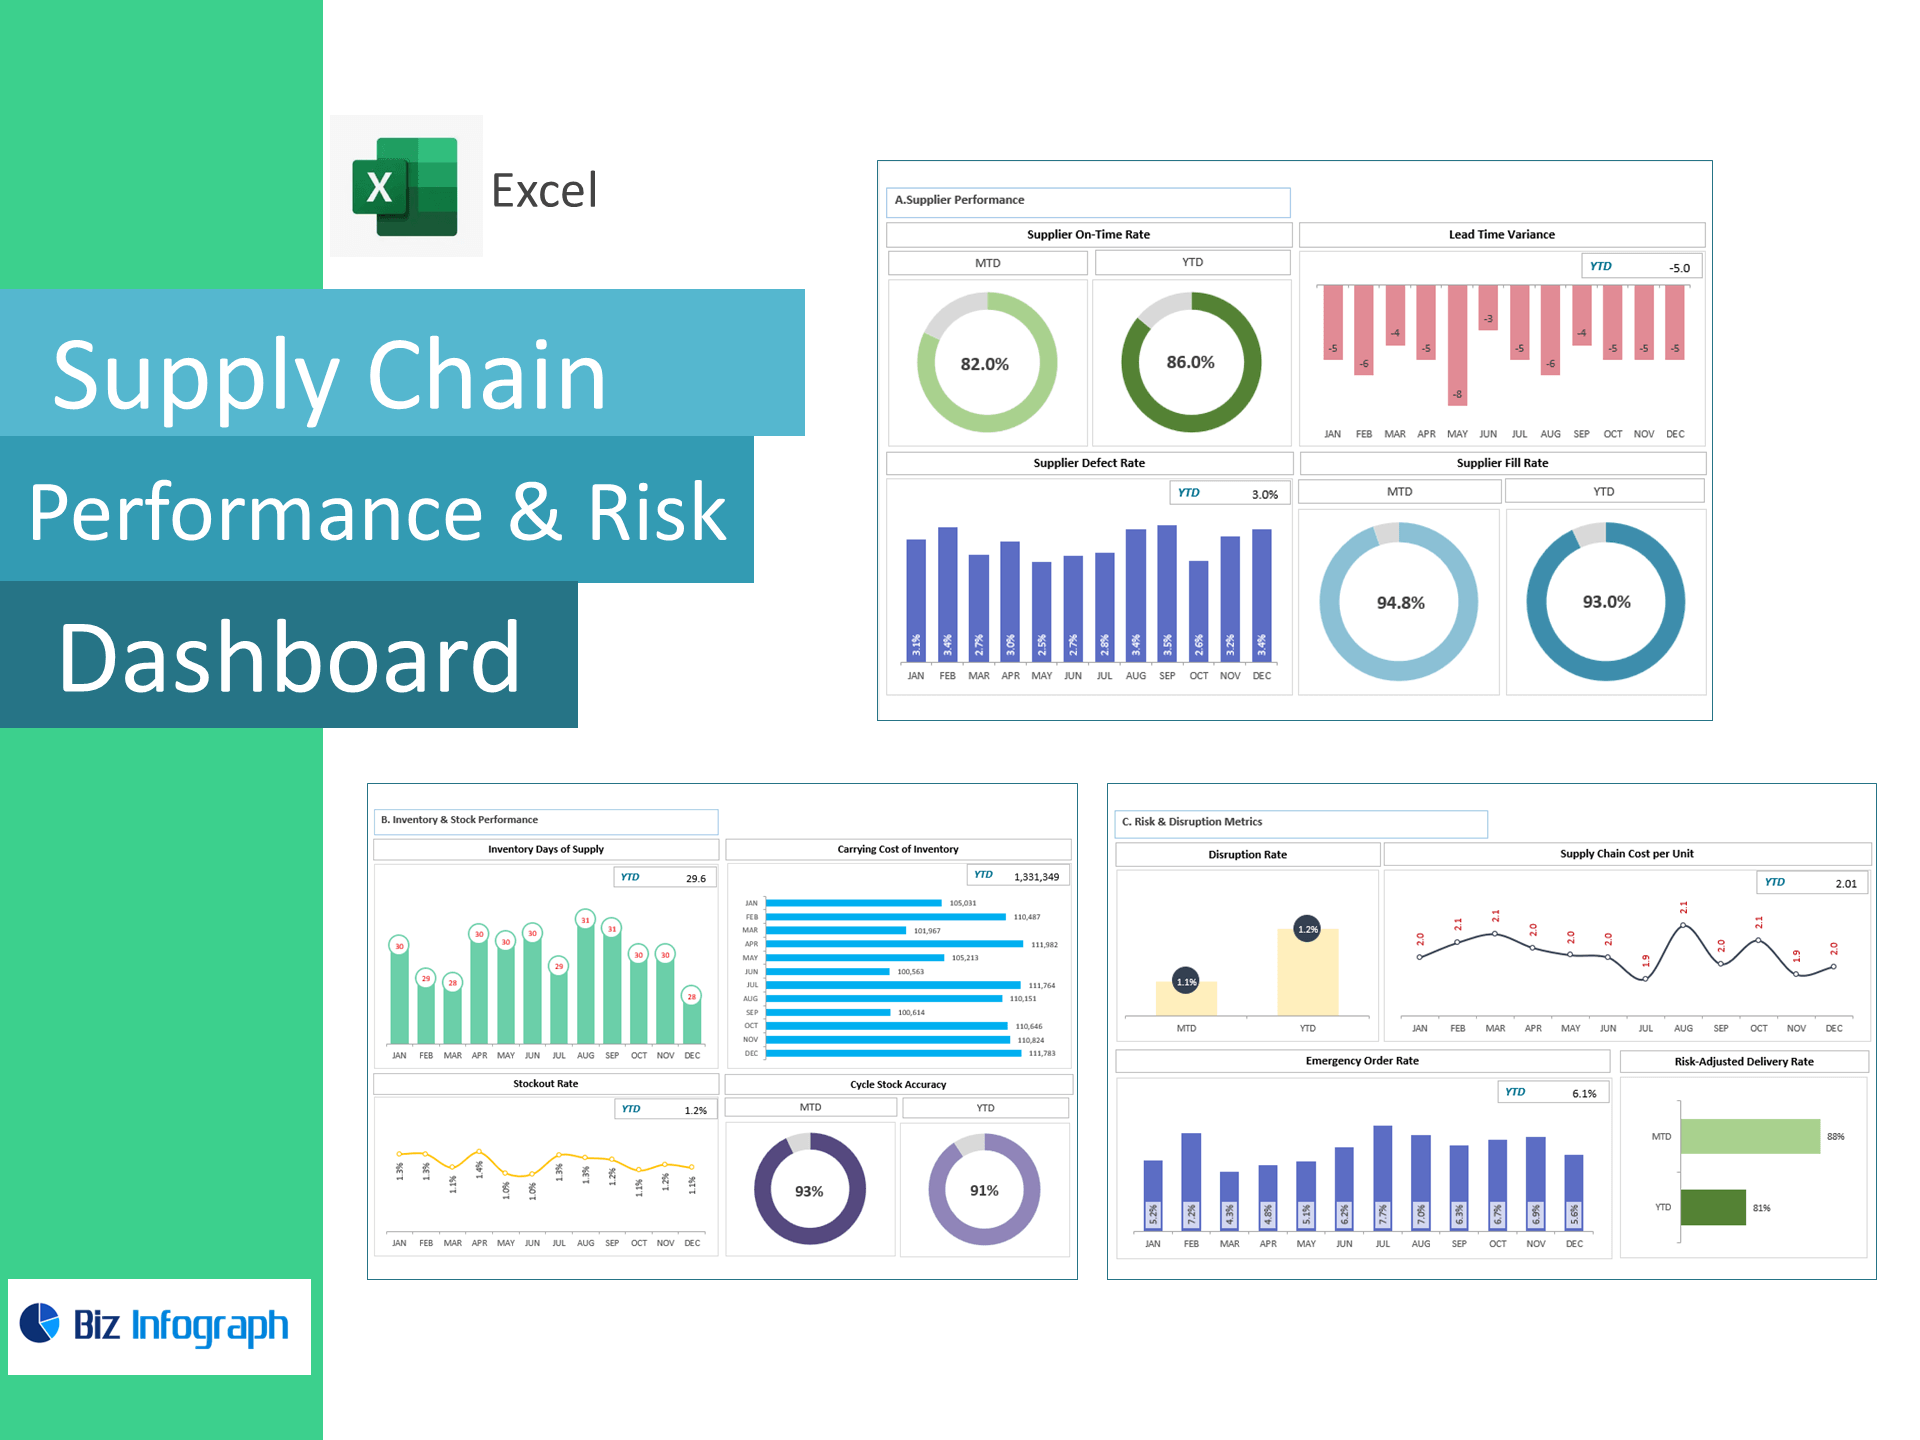
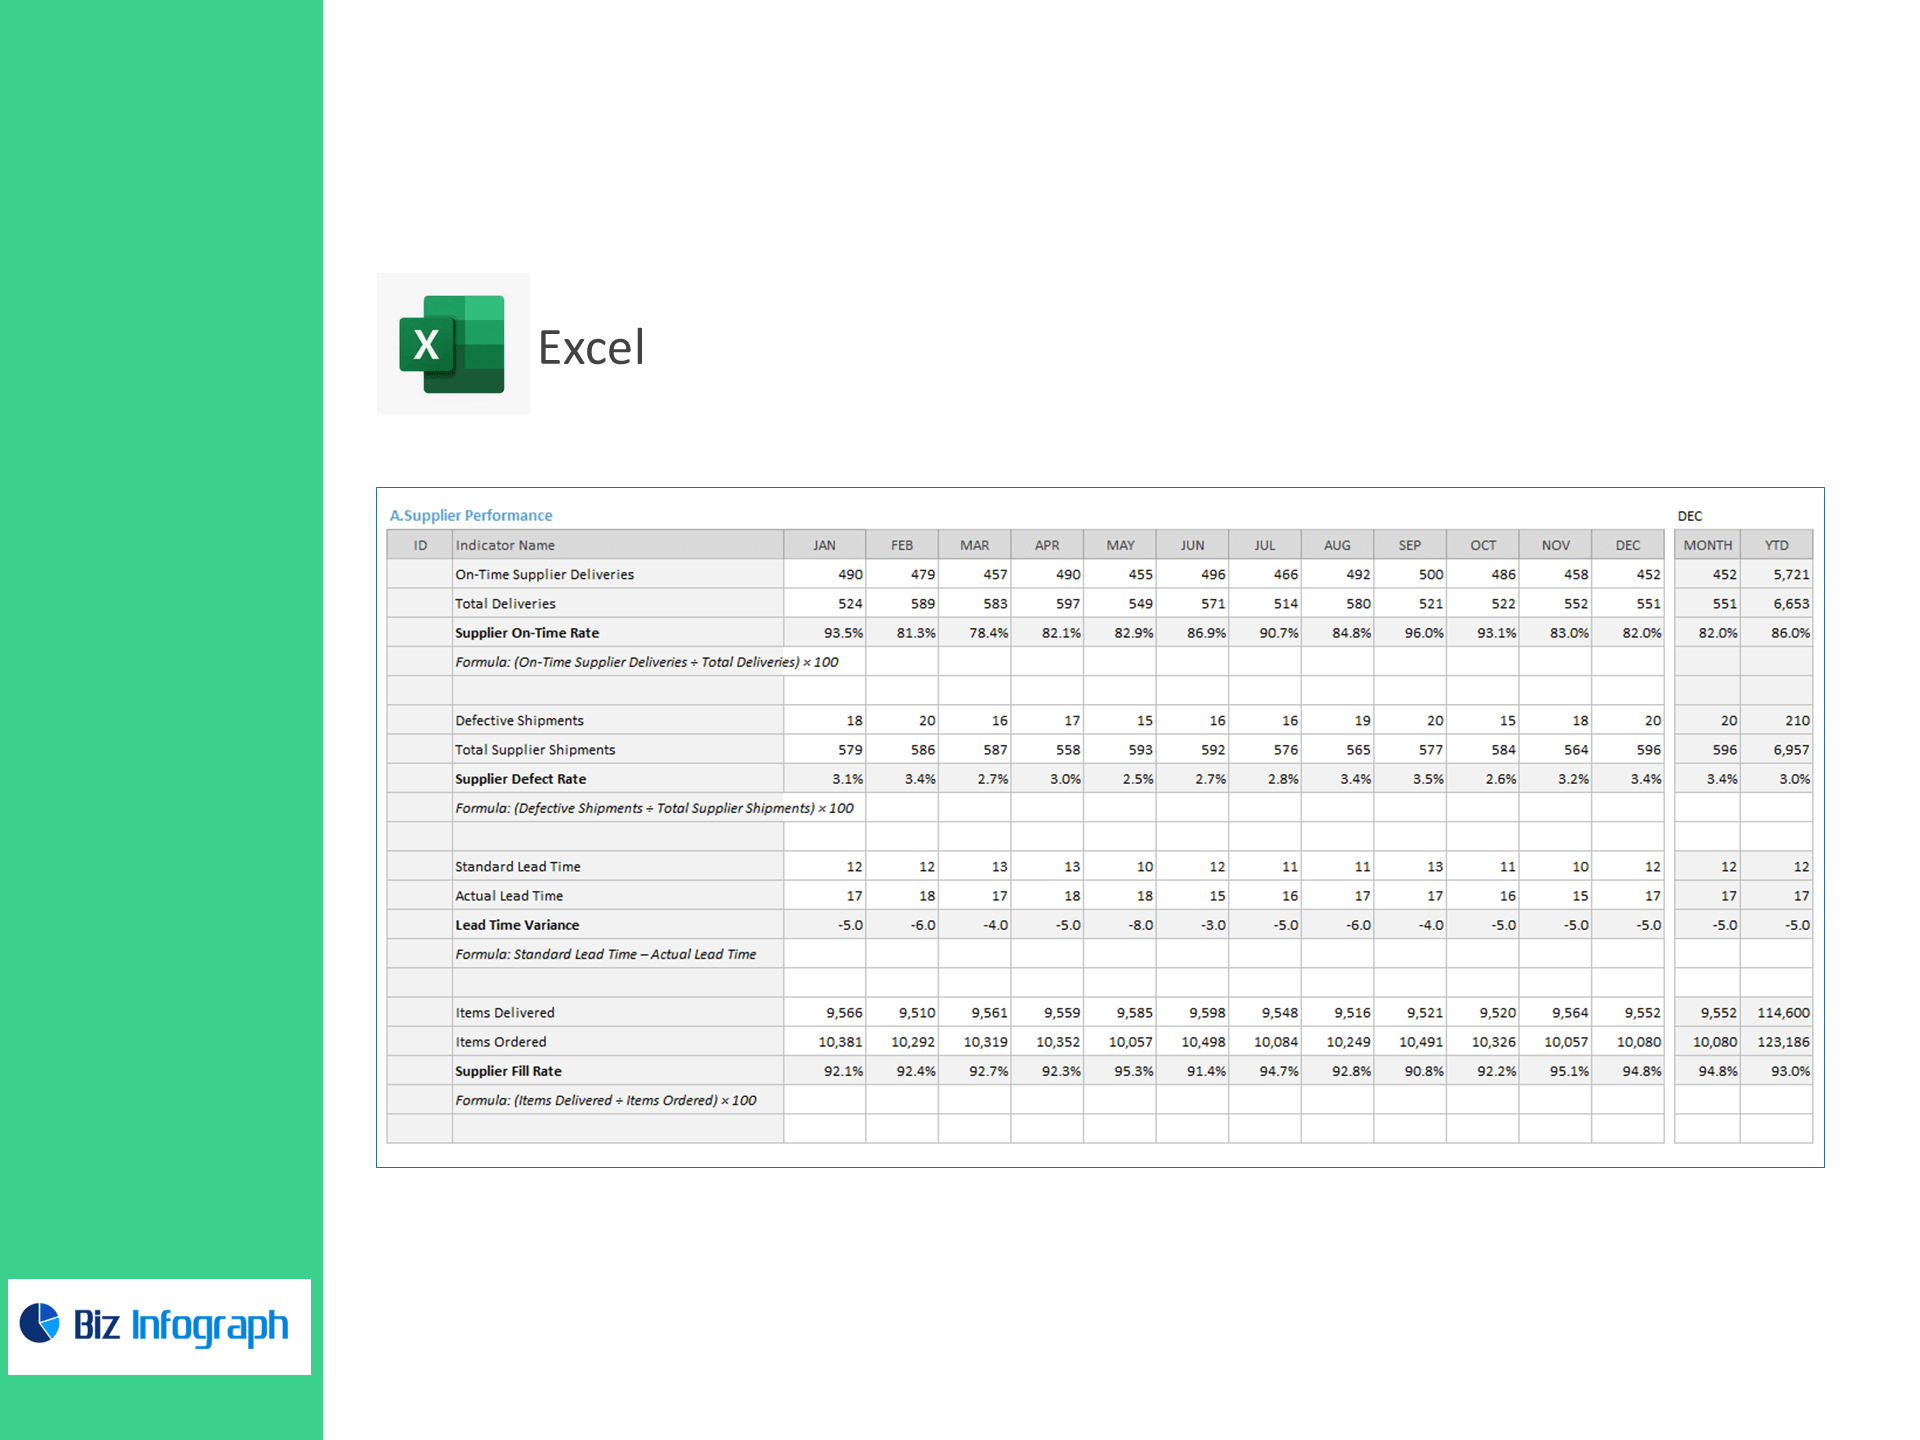
A) Supplier Performance
-
Supplier On-Time Rate (%) = (On-Time Supplier Deliveries ÷ Total Deliveries) × 100
-
Supplier Defect Rate (%) = (Defective Shipments ÷ Total Supplier Shipments) × 100
-
Lead Time Variance (days) = Standard Lead Time − Actual Lead Time
-
Supplier Fill Rate (%) = (Items Delivered ÷ Items Ordered) × 100
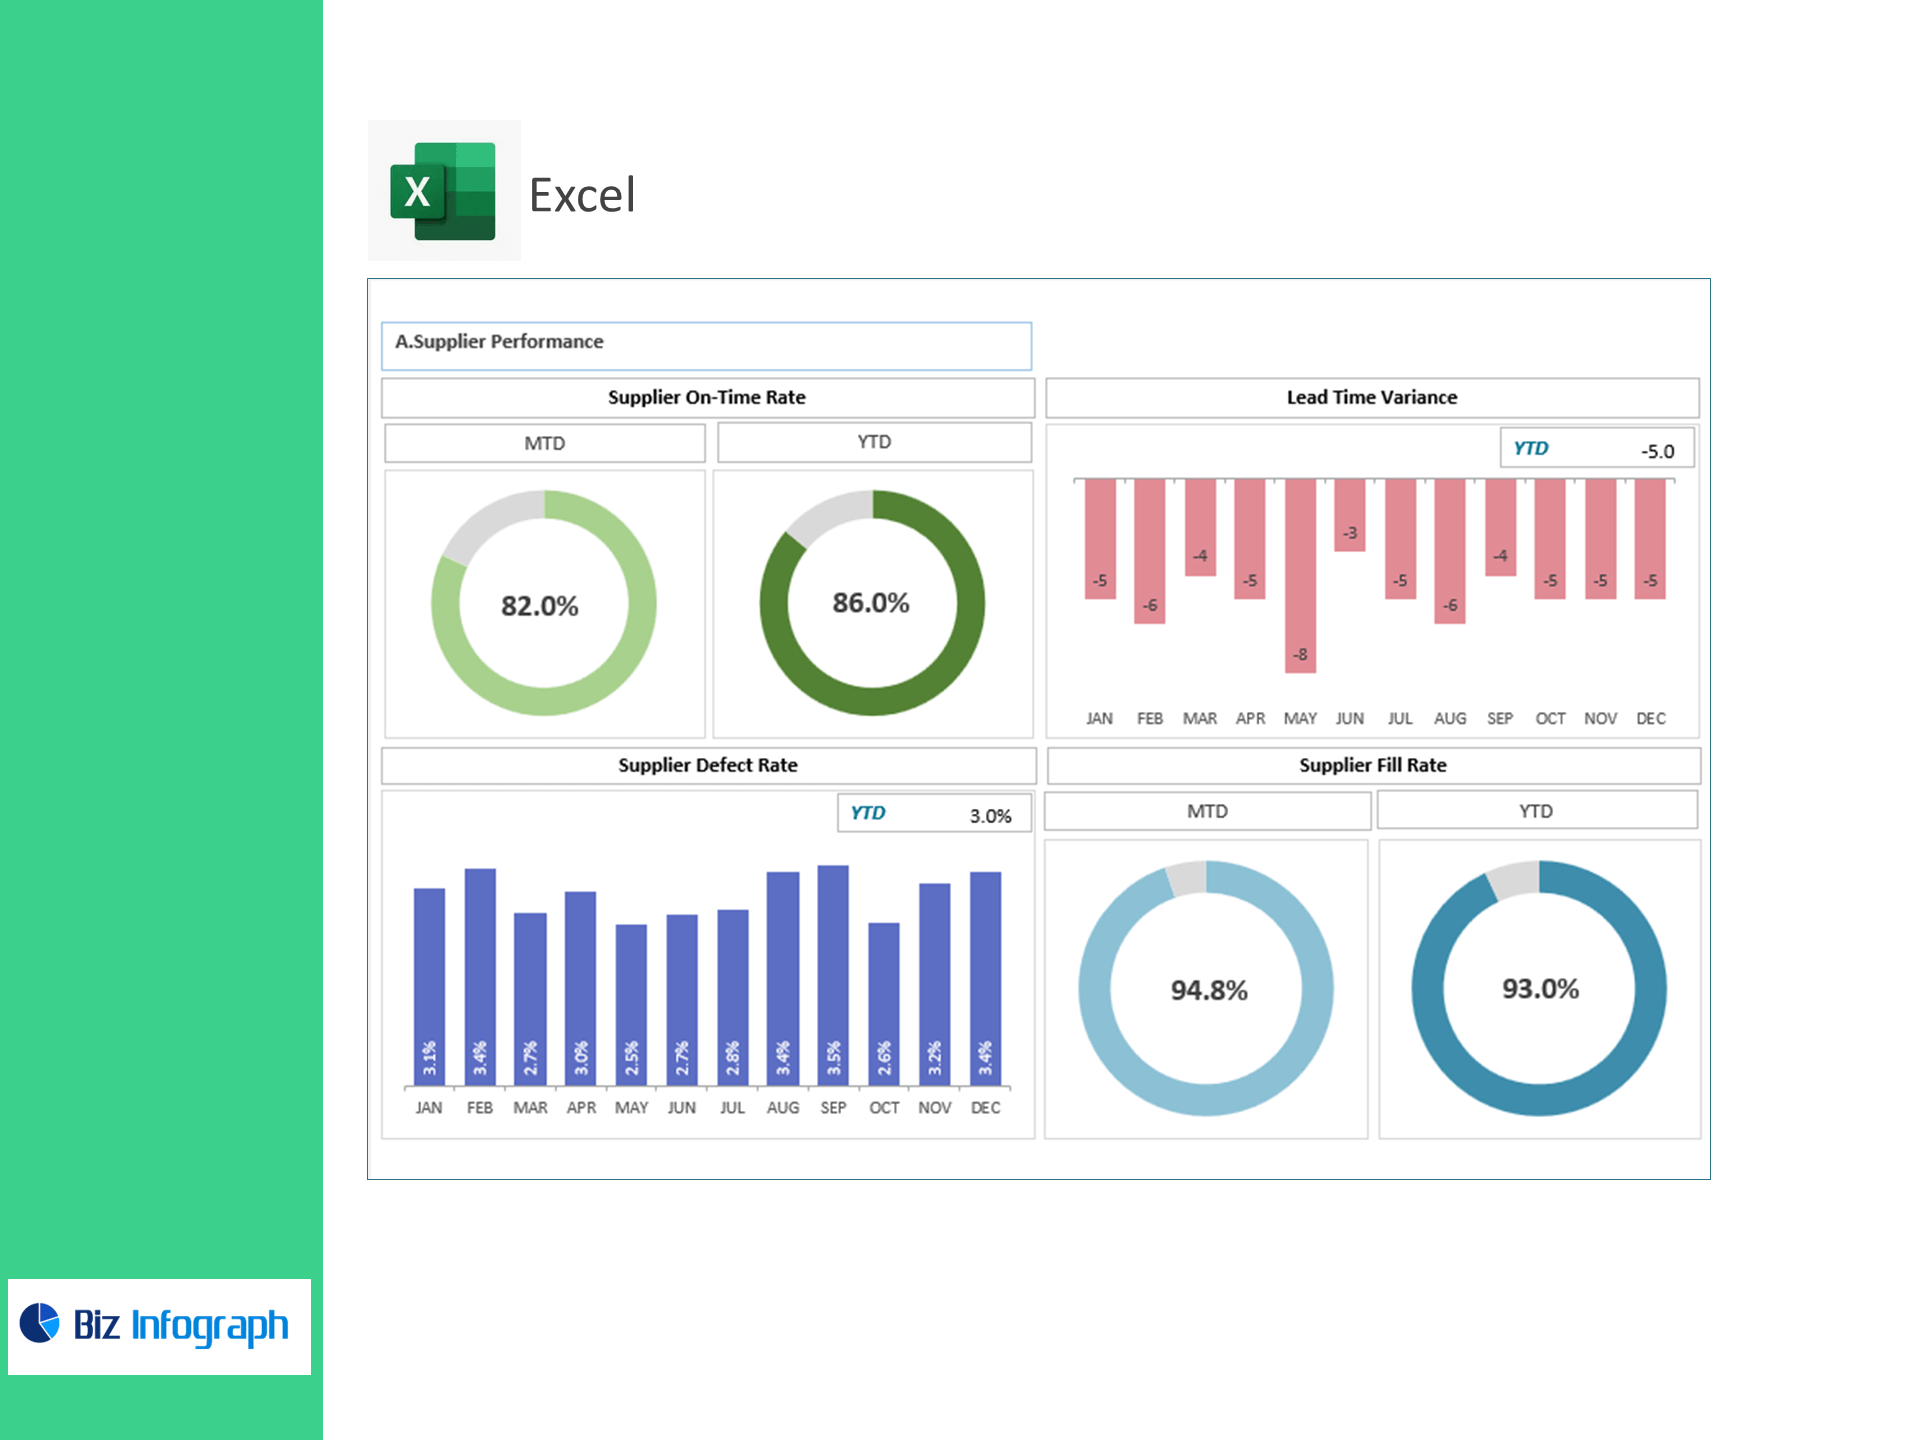
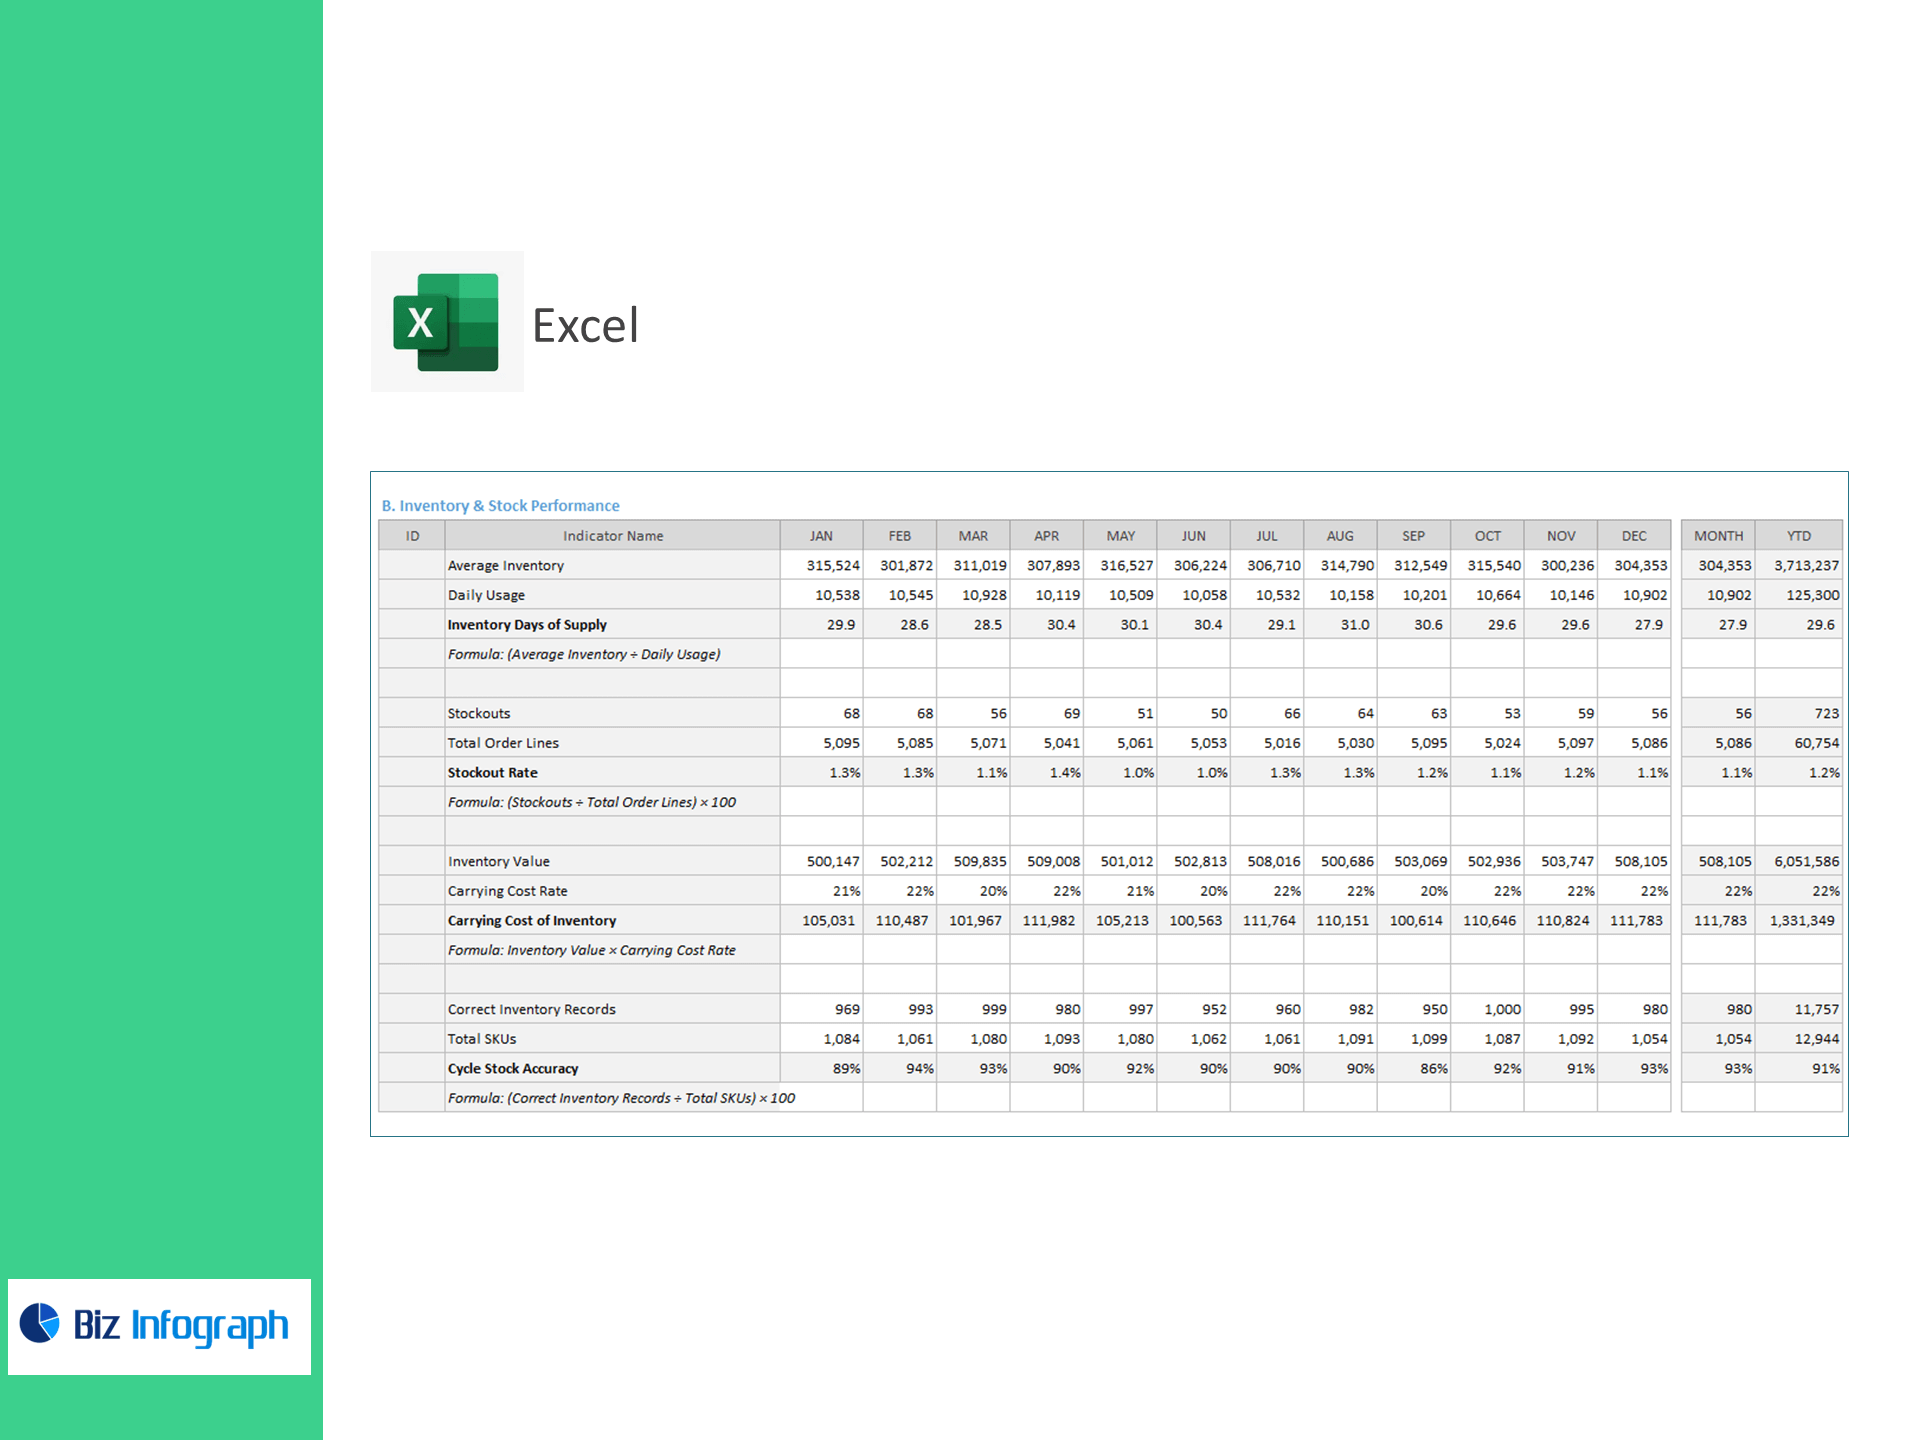
B) Inventory & Stock Performance
-
Inventory Days of Supply = Average Inventory ÷ Daily Usage
-
Stockout Rate (%) = (Stockouts ÷ Total Order Lines) × 100
-
Carrying Cost of Inventory = Inventory Value × Carrying Cost Rate
-
Cycle Stock Accuracy (%) = (Correct Inventory Records ÷ Total SKUs) × 100
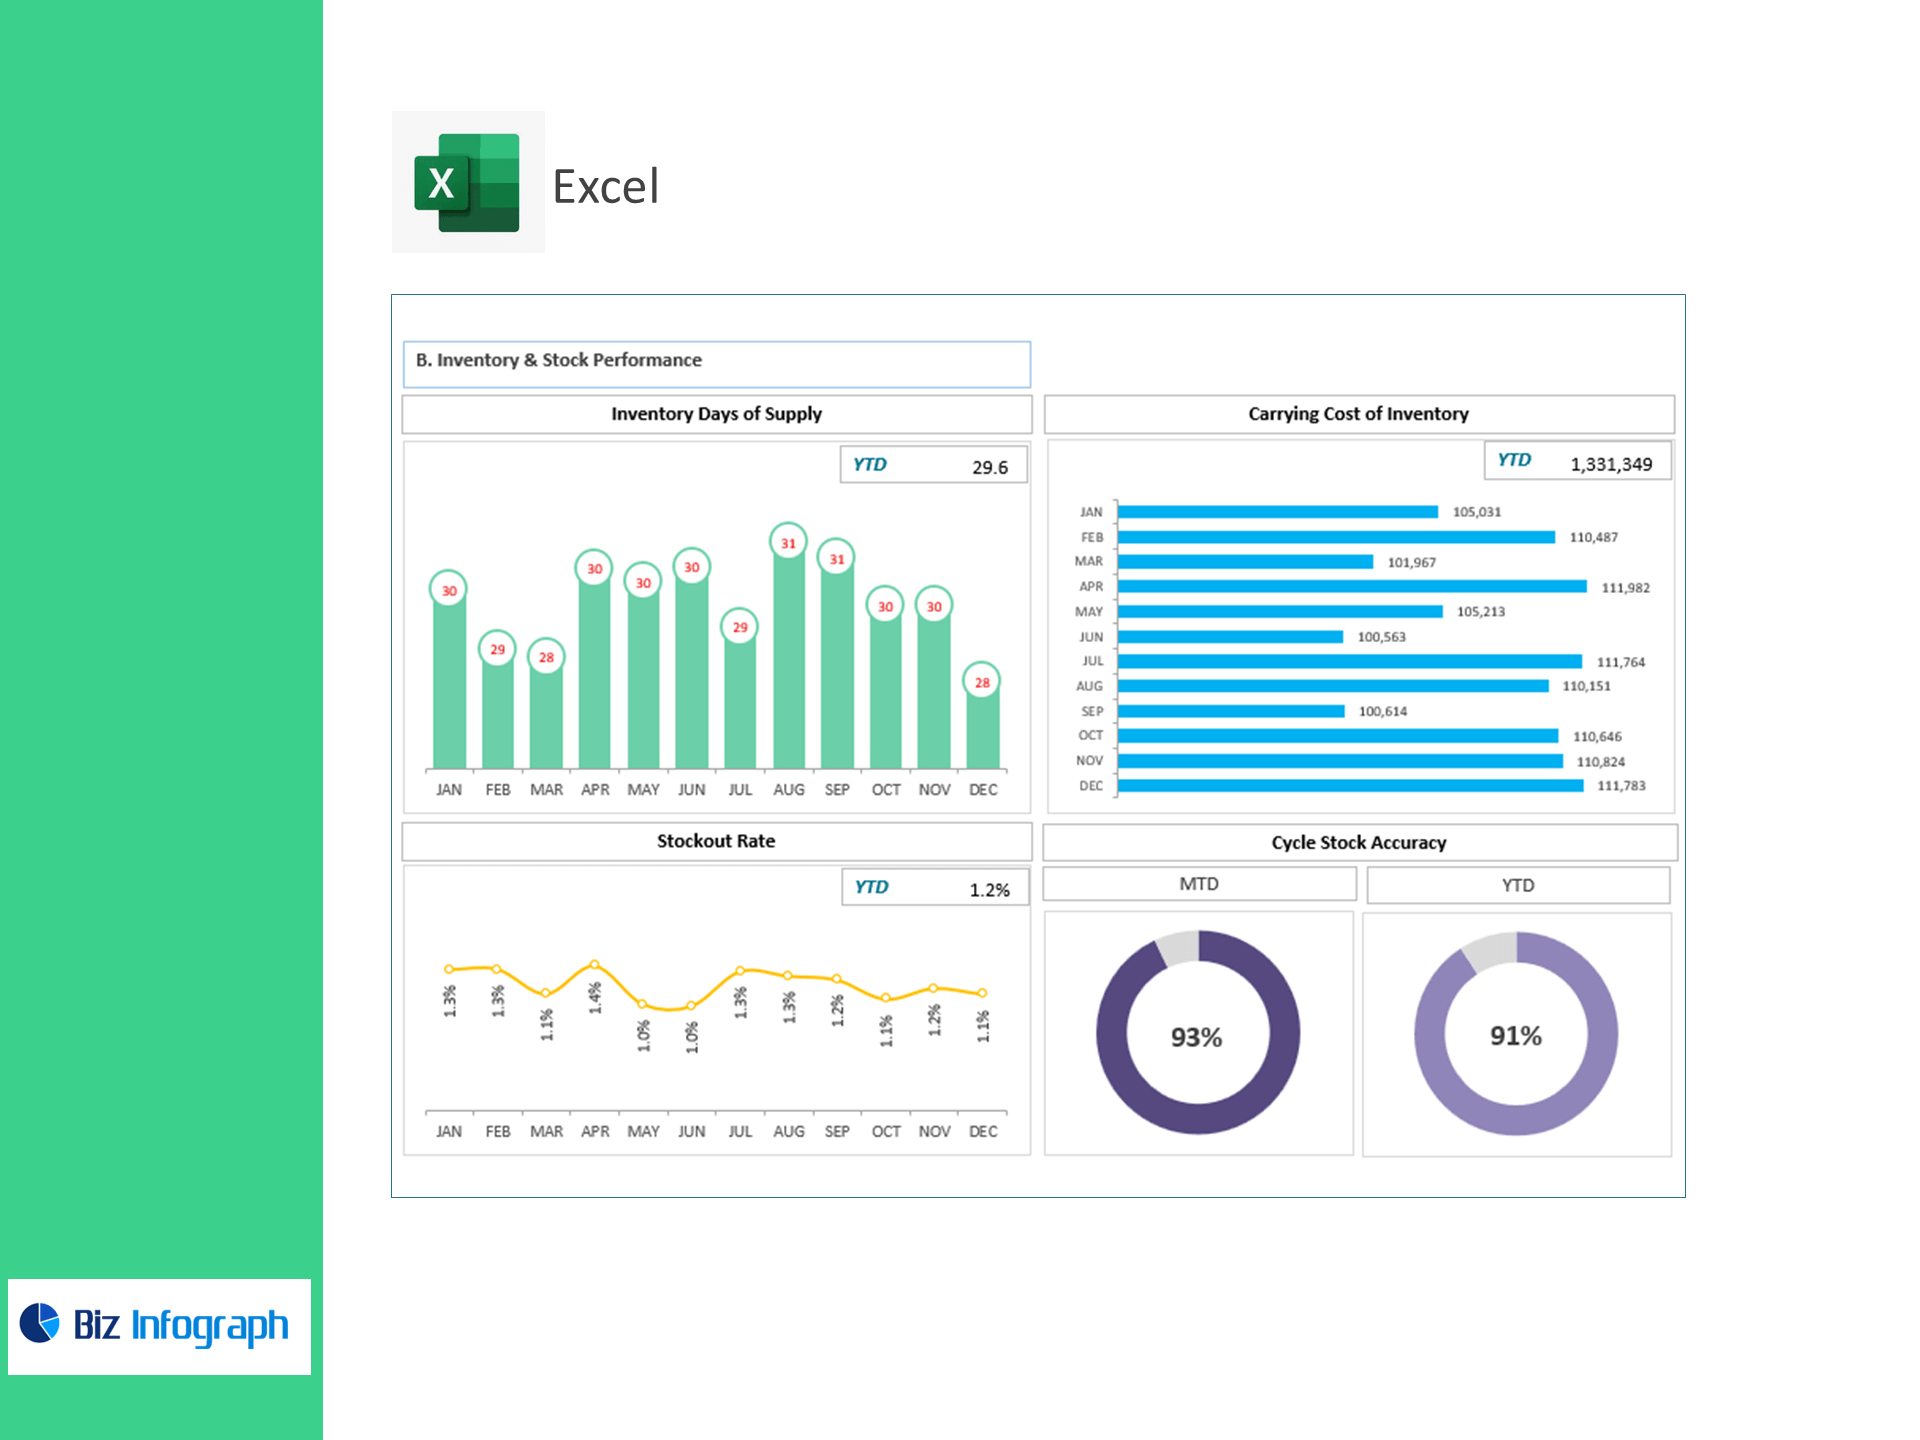
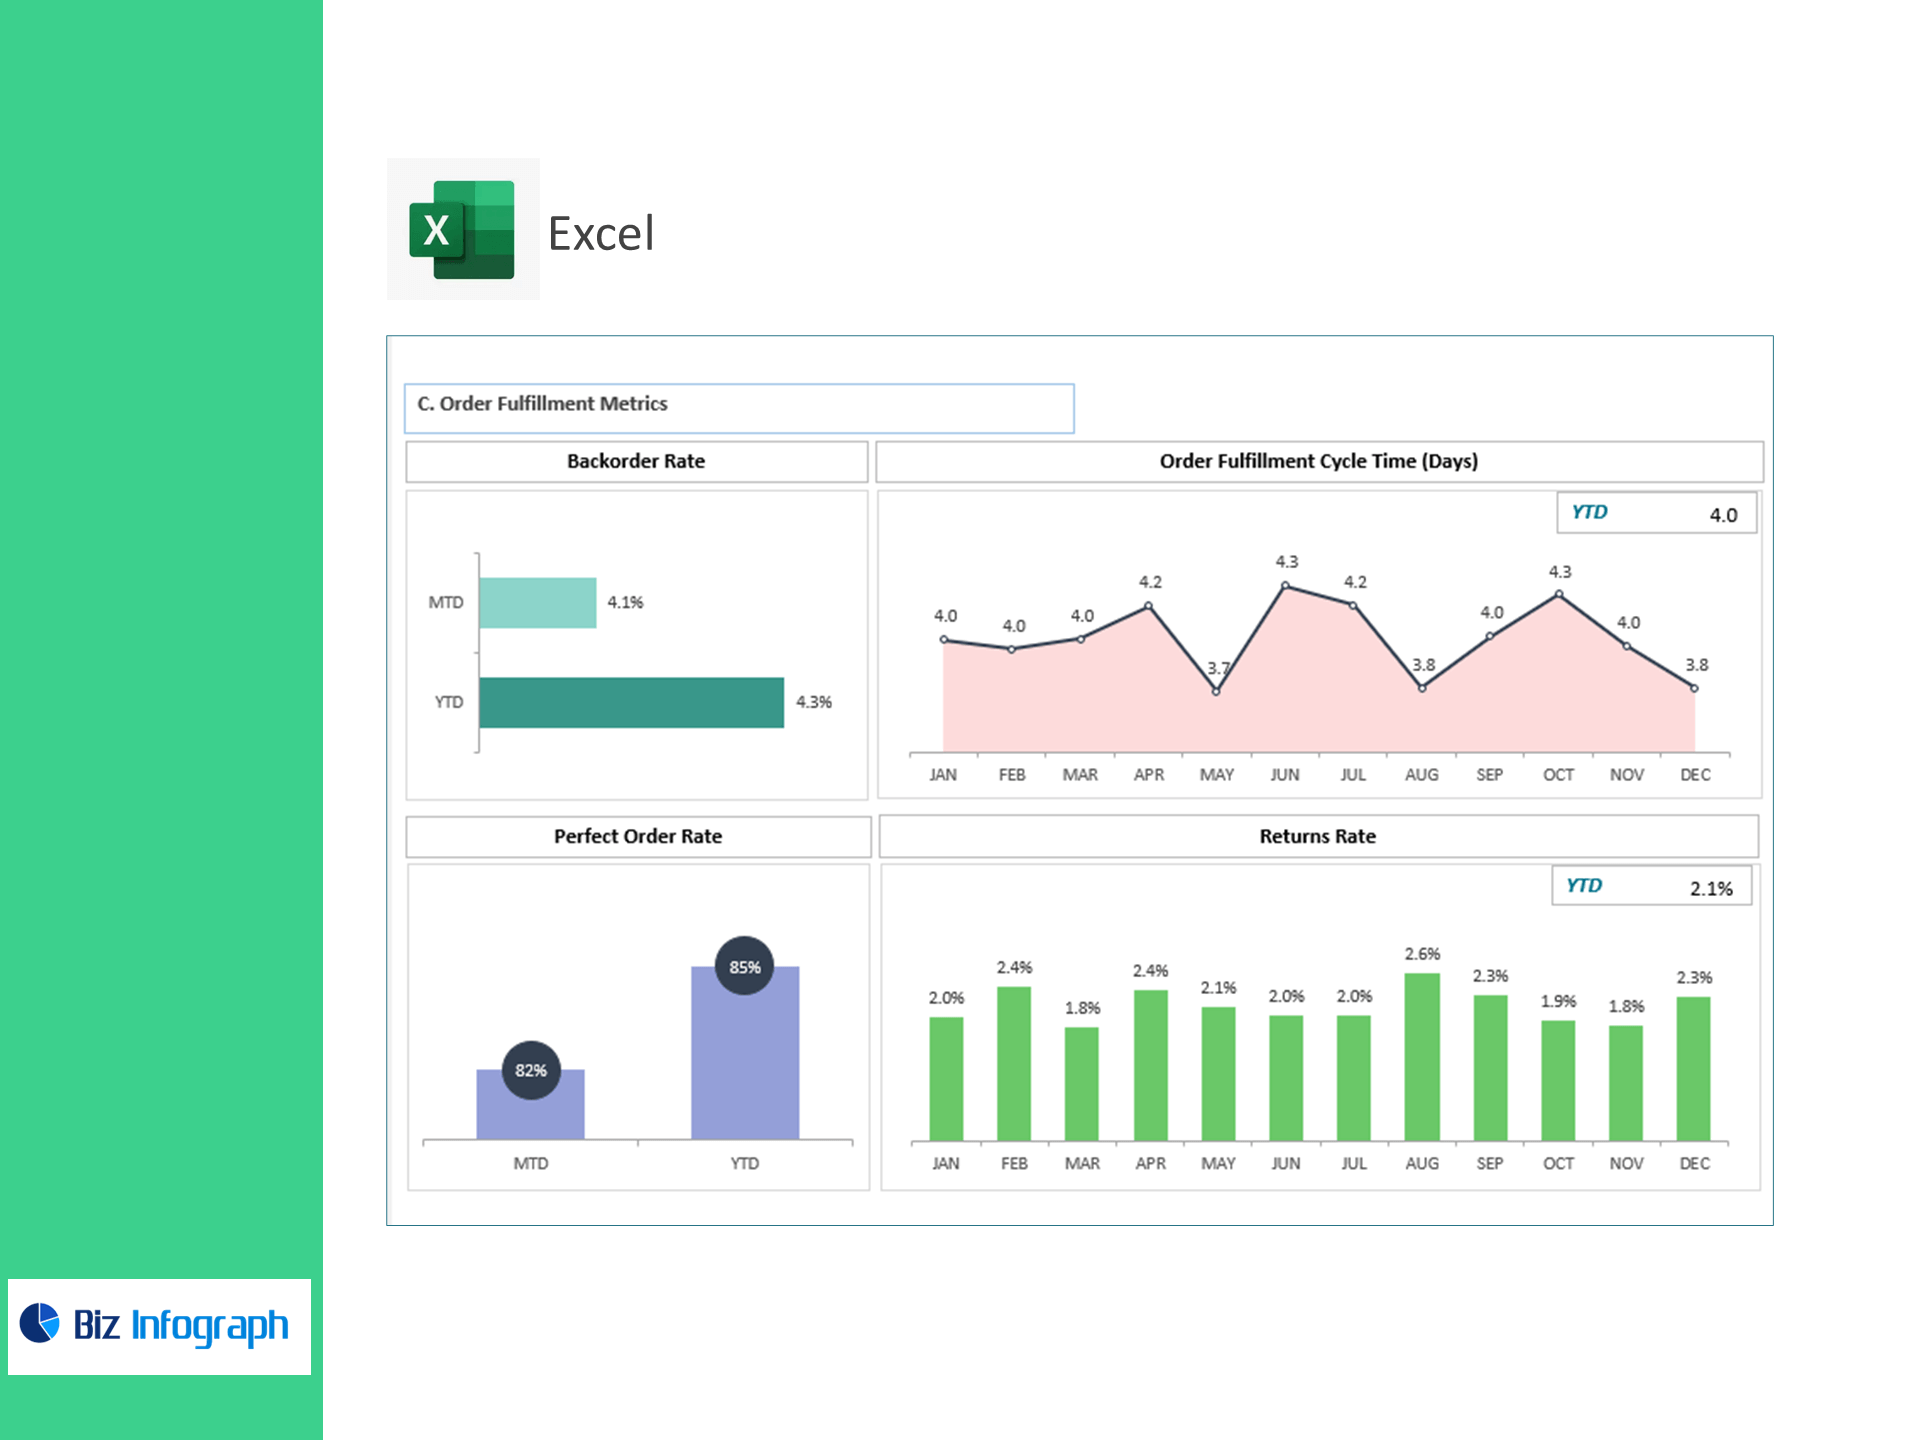
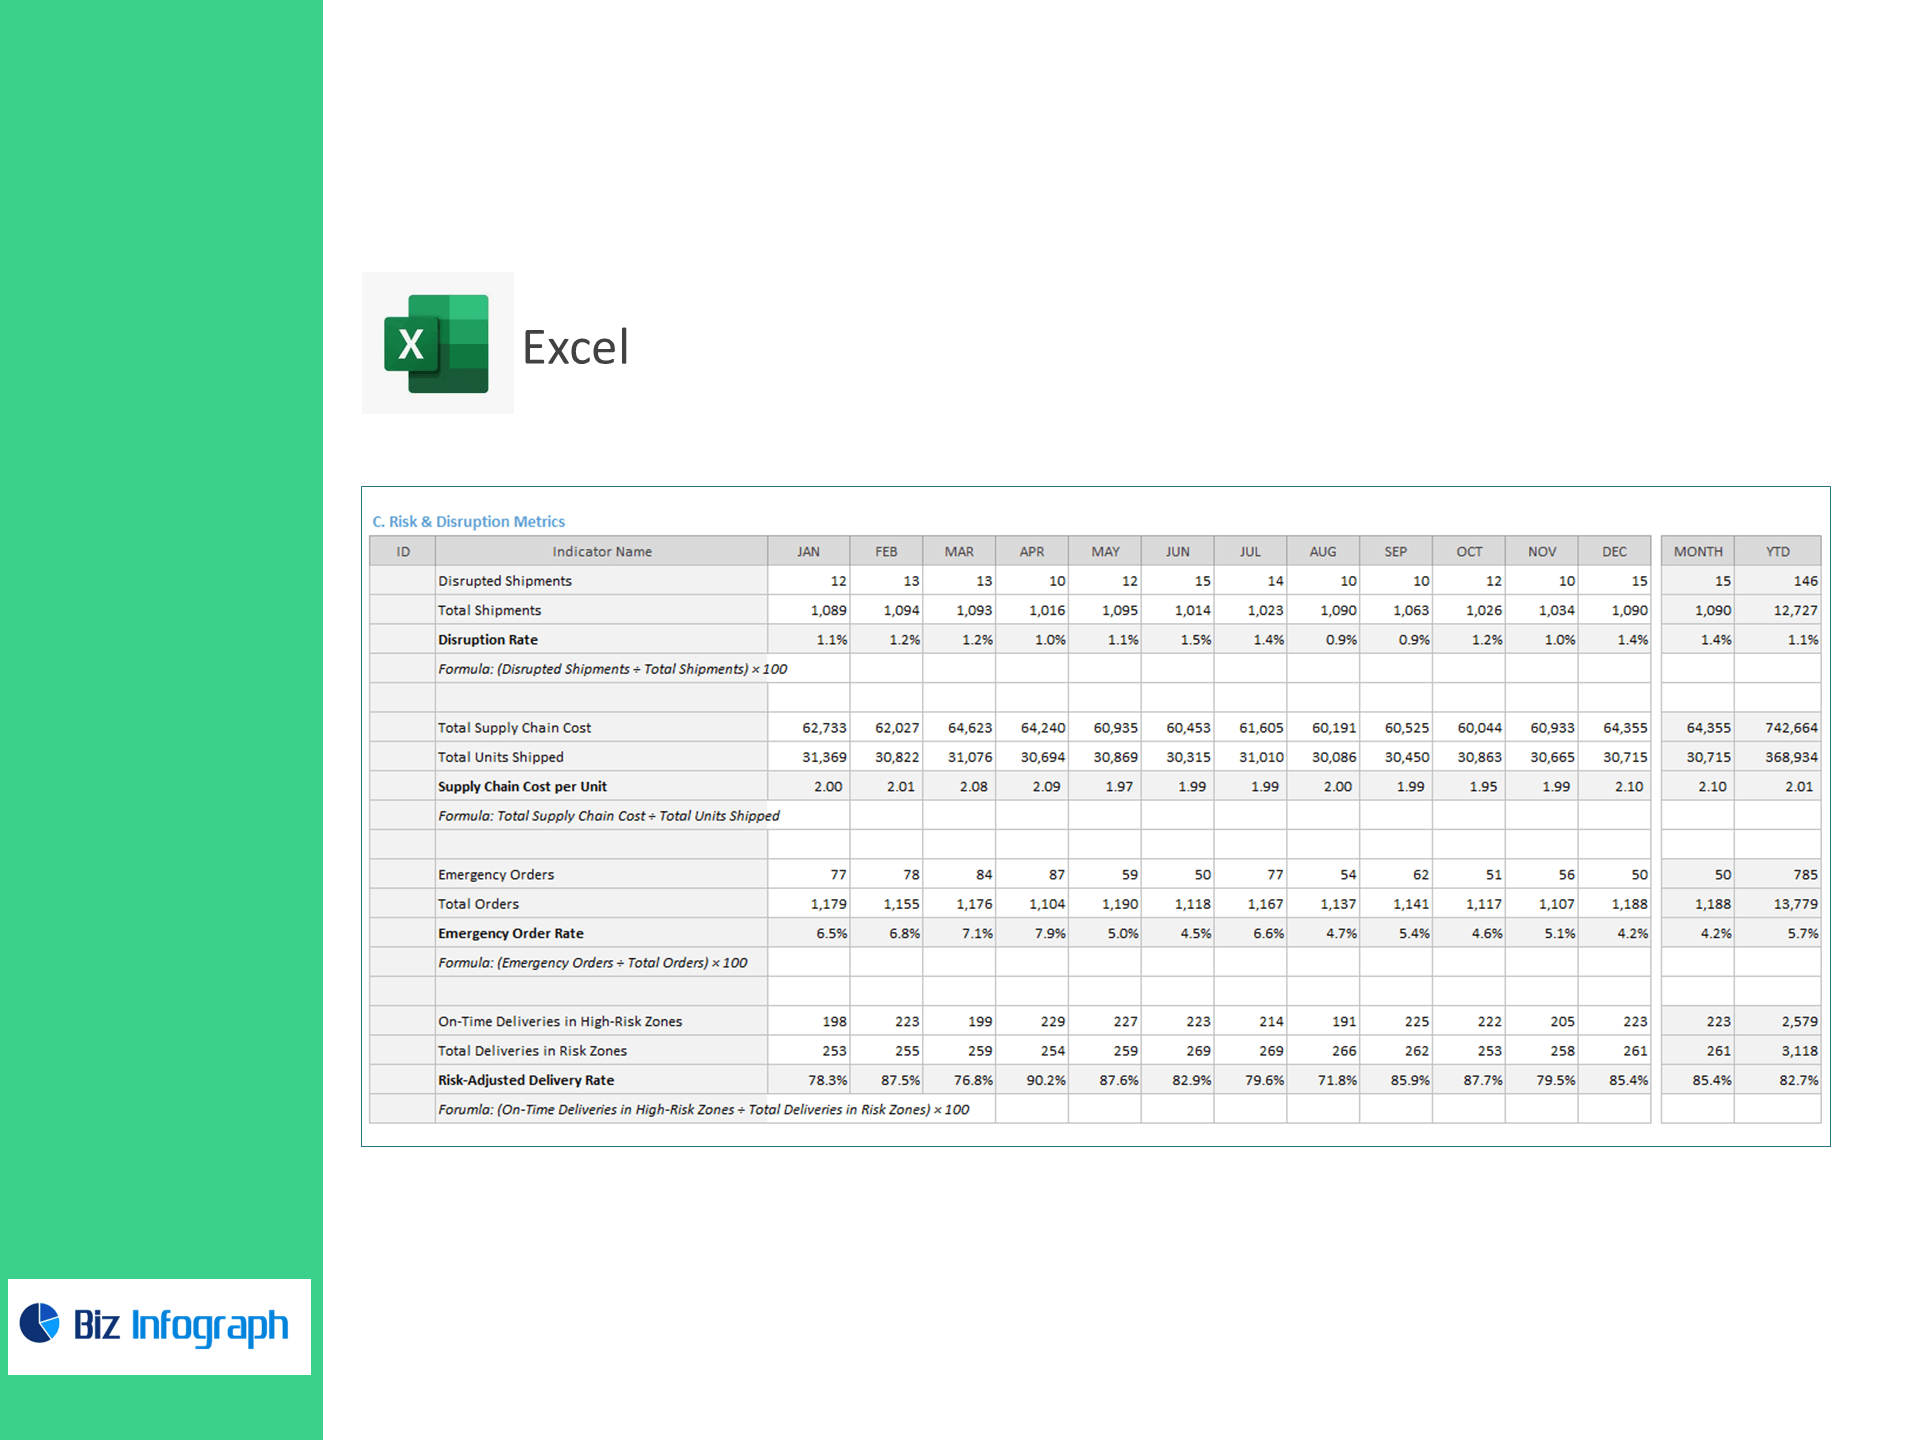
C) Risk & Disruption Metrics
-
Disruption Rate (%) = (Disrupted Shipments ÷ Total Shipments) × 100
-
Supply Chain Cost per Unit = Total Supply Chain Cost ÷ Total Units Shipped
-
Emergency Order Rate (%) = (Emergency Orders ÷ Total Orders) × 100
-
Risk-Adjusted Delivery Rate (%) = (On-Time Deliveries in High-Risk Zones ÷ Total Deliveries in Risk Zones) × 100
What’s inside
-
Executive Dashboard: Tiles for On-Time, Defect, Lead-Time Variance, Fill Rate, Days of Supply, Stockouts, Cost/Unit, Disruption, Emergency Orders, and Risk-Adjusted Delivery—plus trend & target variance.
-
Supplier Scorecards: Rank vendors by on-time %, defects, lead time, and fill rate.
-
Inventory Health View: DOS, accuracy, carrying cost, and stockout hotspots by category/SKU.
-
Risk & Continuity Panel: Disruptions by lane/region and high-risk zone delivery performance.
-
Targets & Assumptions: Enter KPI targets; automatic Above/Below Target flags.
-
Clean Data Sheets: Import-ready tables for Deliveries, Shipments, Inventory, Orders, Costs, and Risk Zones.
How it works
-
Paste CSV/Excel exports into the provided Enter Data tab.
-
Review visuals to rebalance inventory, manage suppliers, and mitigate risk.
Benefits
-
Raise OTIF: Improve on-time and fill rates while reducing lead-time variance.
-
Cut total cost: Lower carrying cost, emergency orders, and cost per unit.
-
Build resilience: Monitor disruptions and sustain service in high-risk corridors.
-
Decide faster: One dashboard for procurement, planning, and operations.
For ready-to-use Dashboard Templates: