Farm Operations Performance Dashboard – Excel Template
Optimize field productivity, resource usage, and sustainability—all in one Excel workbook. This template turns your raw farm data into clear KPIs, trend charts, and action-ready insights. No add-ins, no code—just plug in your numbers and start managing like a pro.
What this template tracks (built-in KPIs)
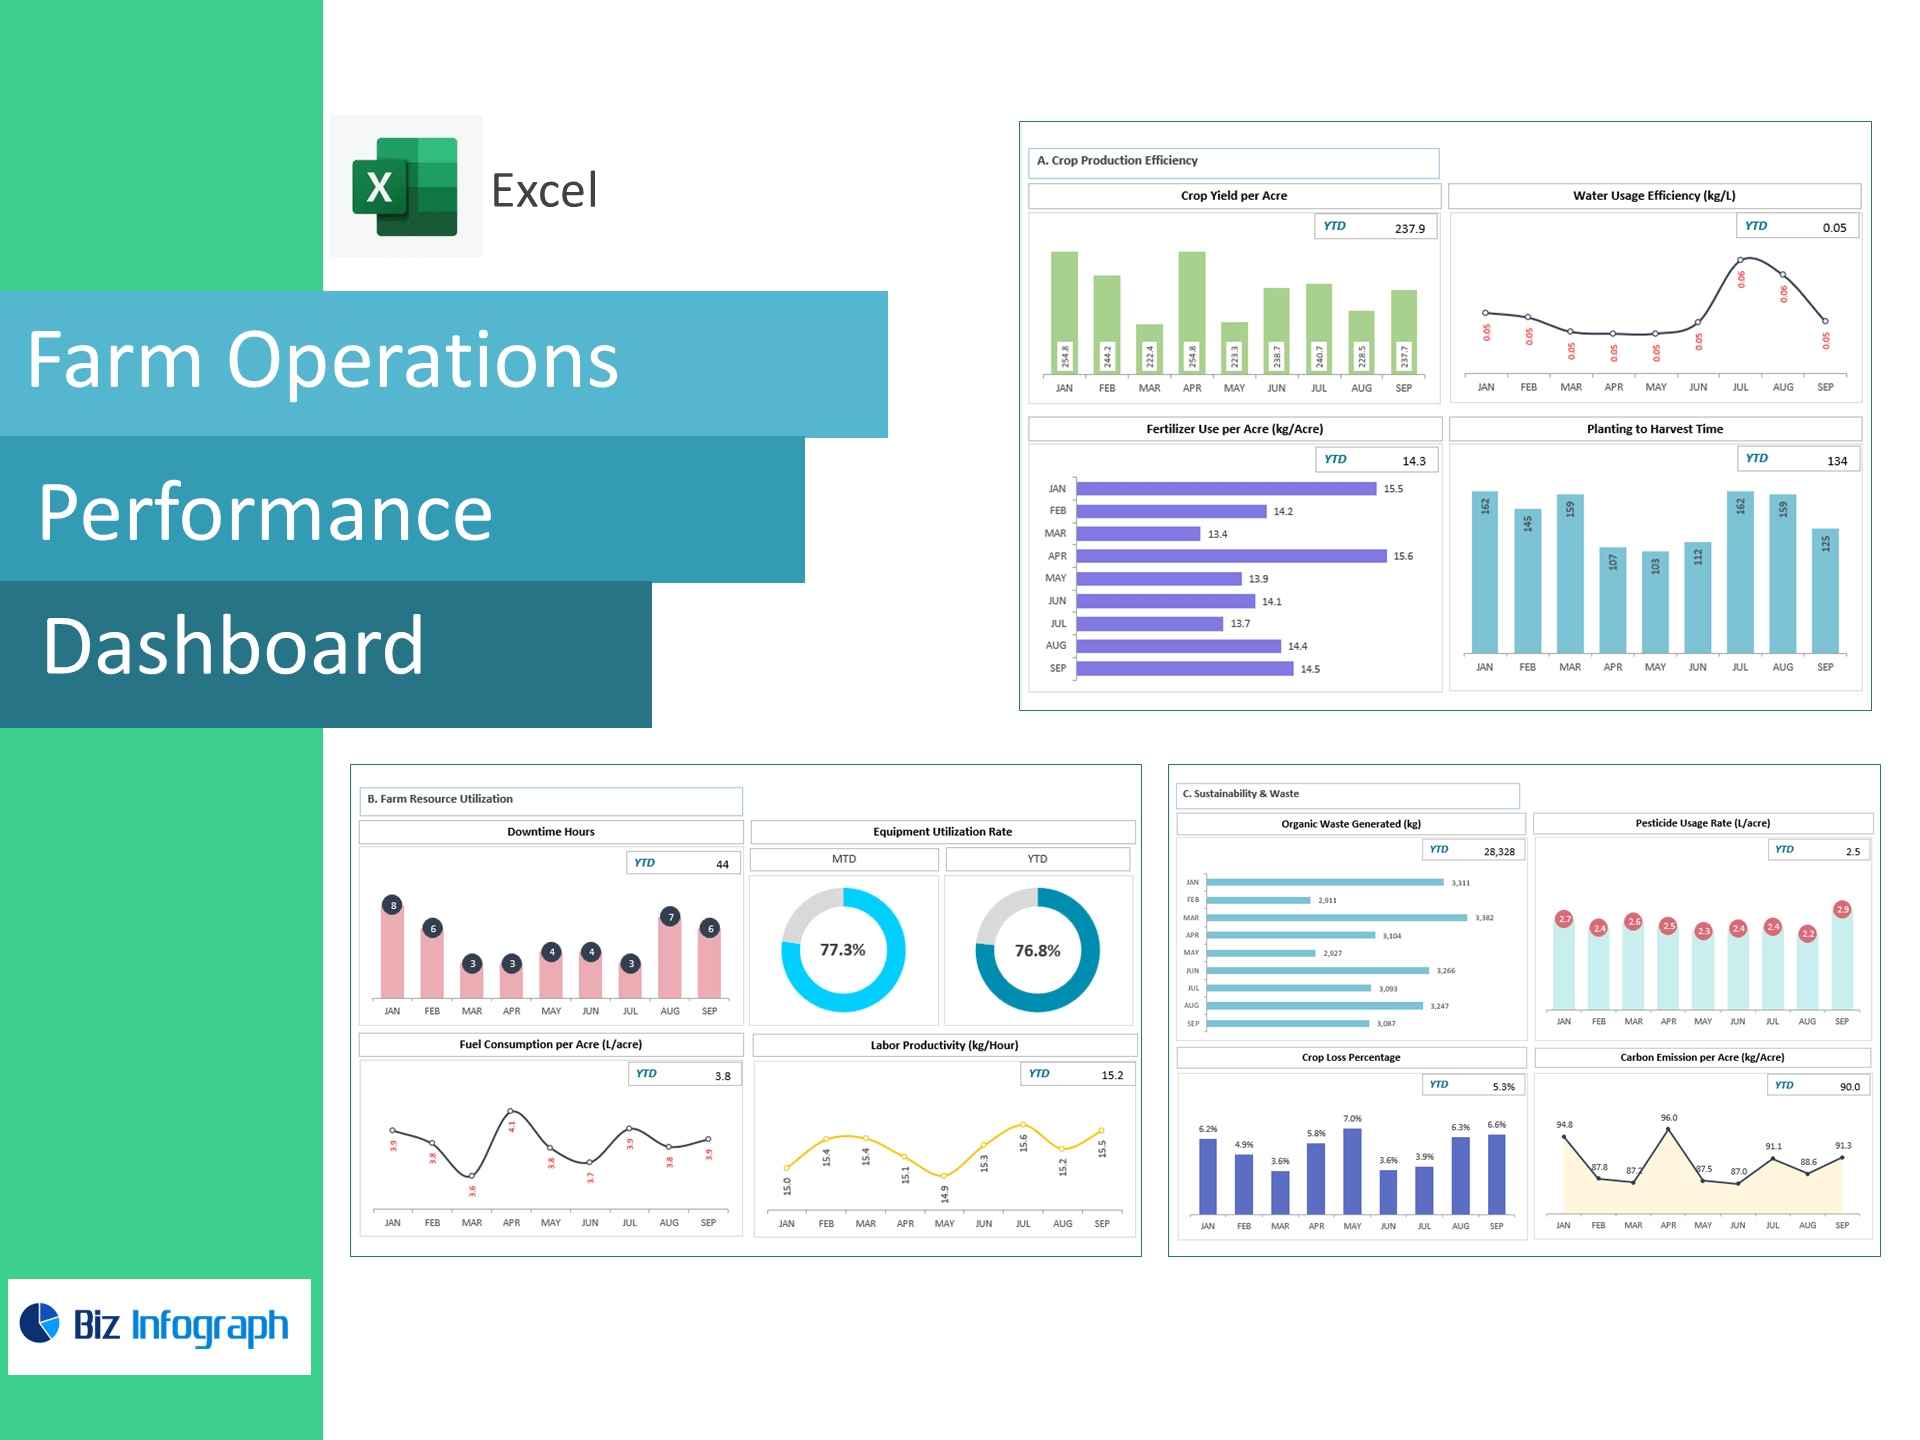
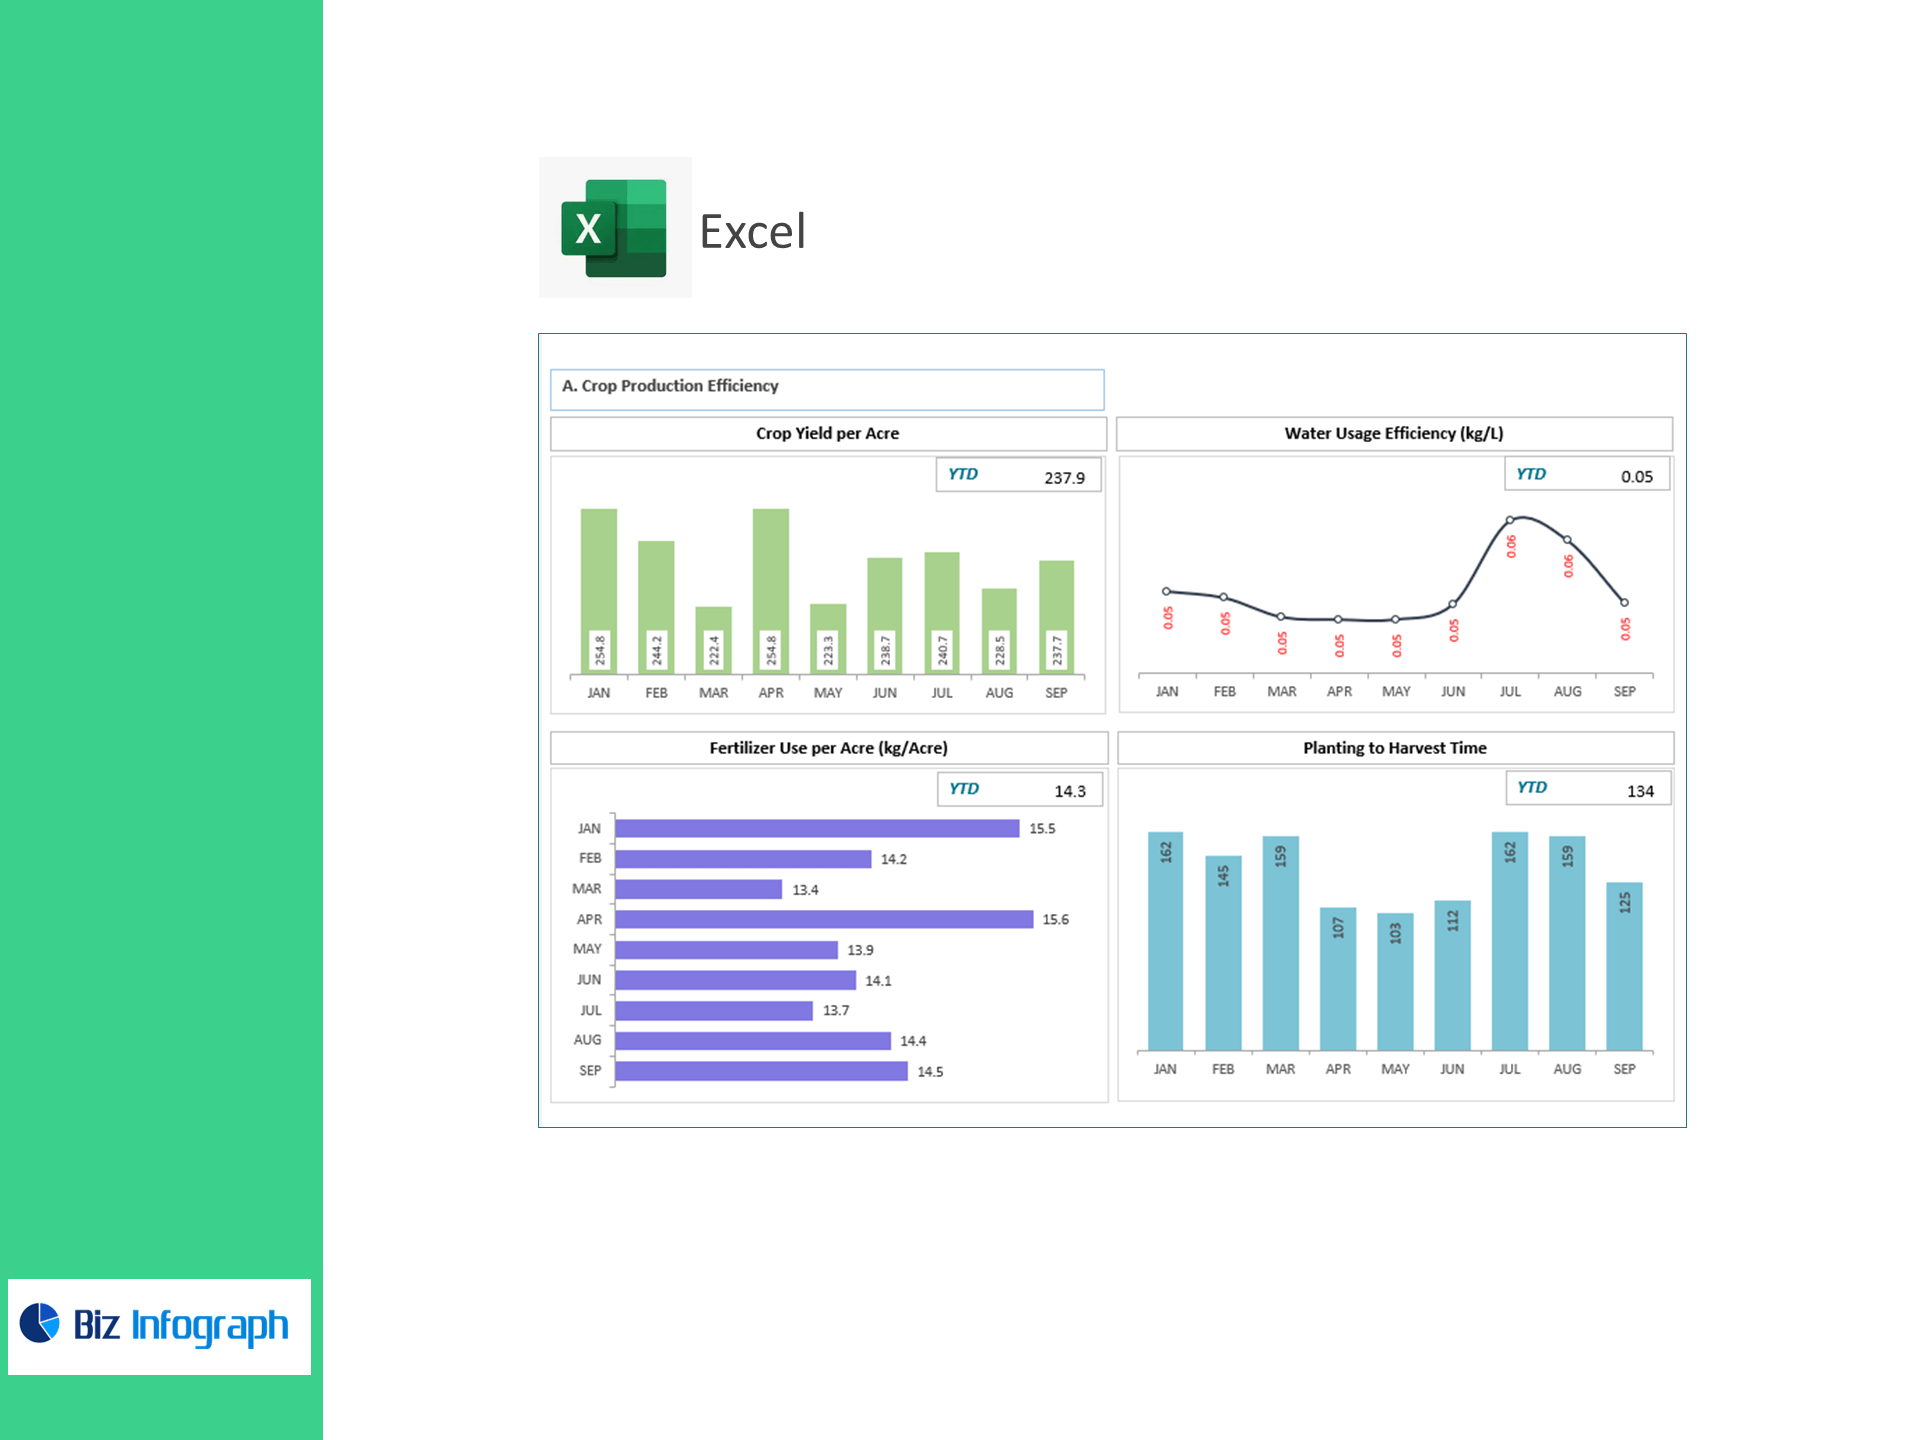
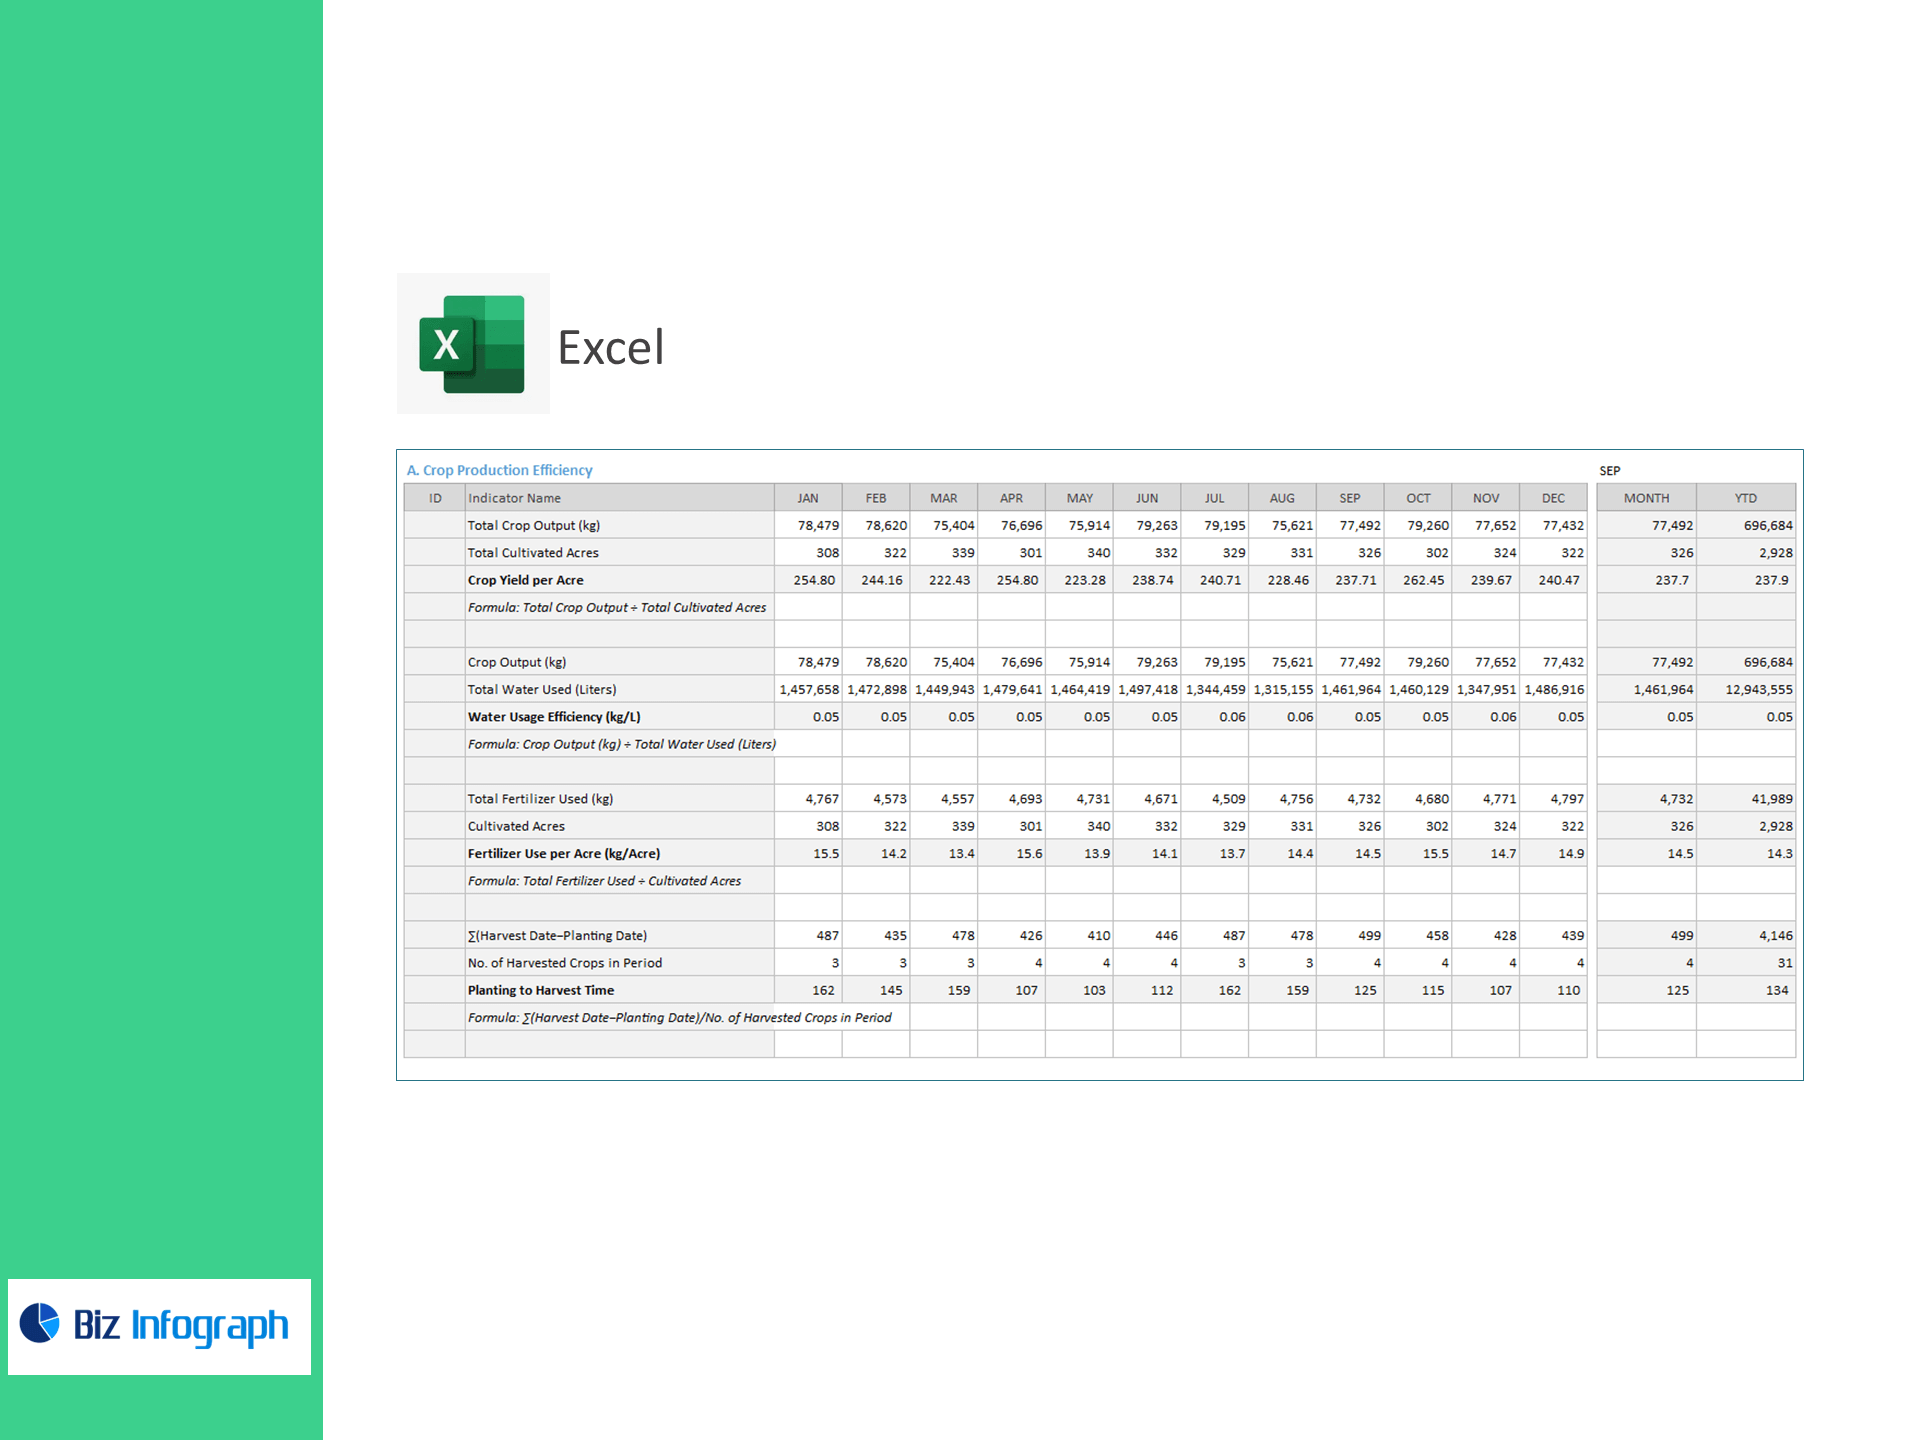
A) Crop Production Efficiency
-
Total Crop Output (kg), Total Cultivated Acres
-
Crop Yield per Acre (Total Crop Output ÷ Total Cultivated Acres)
-
Water Usage Efficiency (kg/L) (Crop Output ÷ Total Water Used)
-
Fertilizer Use per Acre (kg/acre) (Total Fertilizer Used ÷ Cultivated Acres)
-
Planting to Harvest Time ([Σ(Harvest Date − Planting Date)] ÷ Number of Harvested Crops)
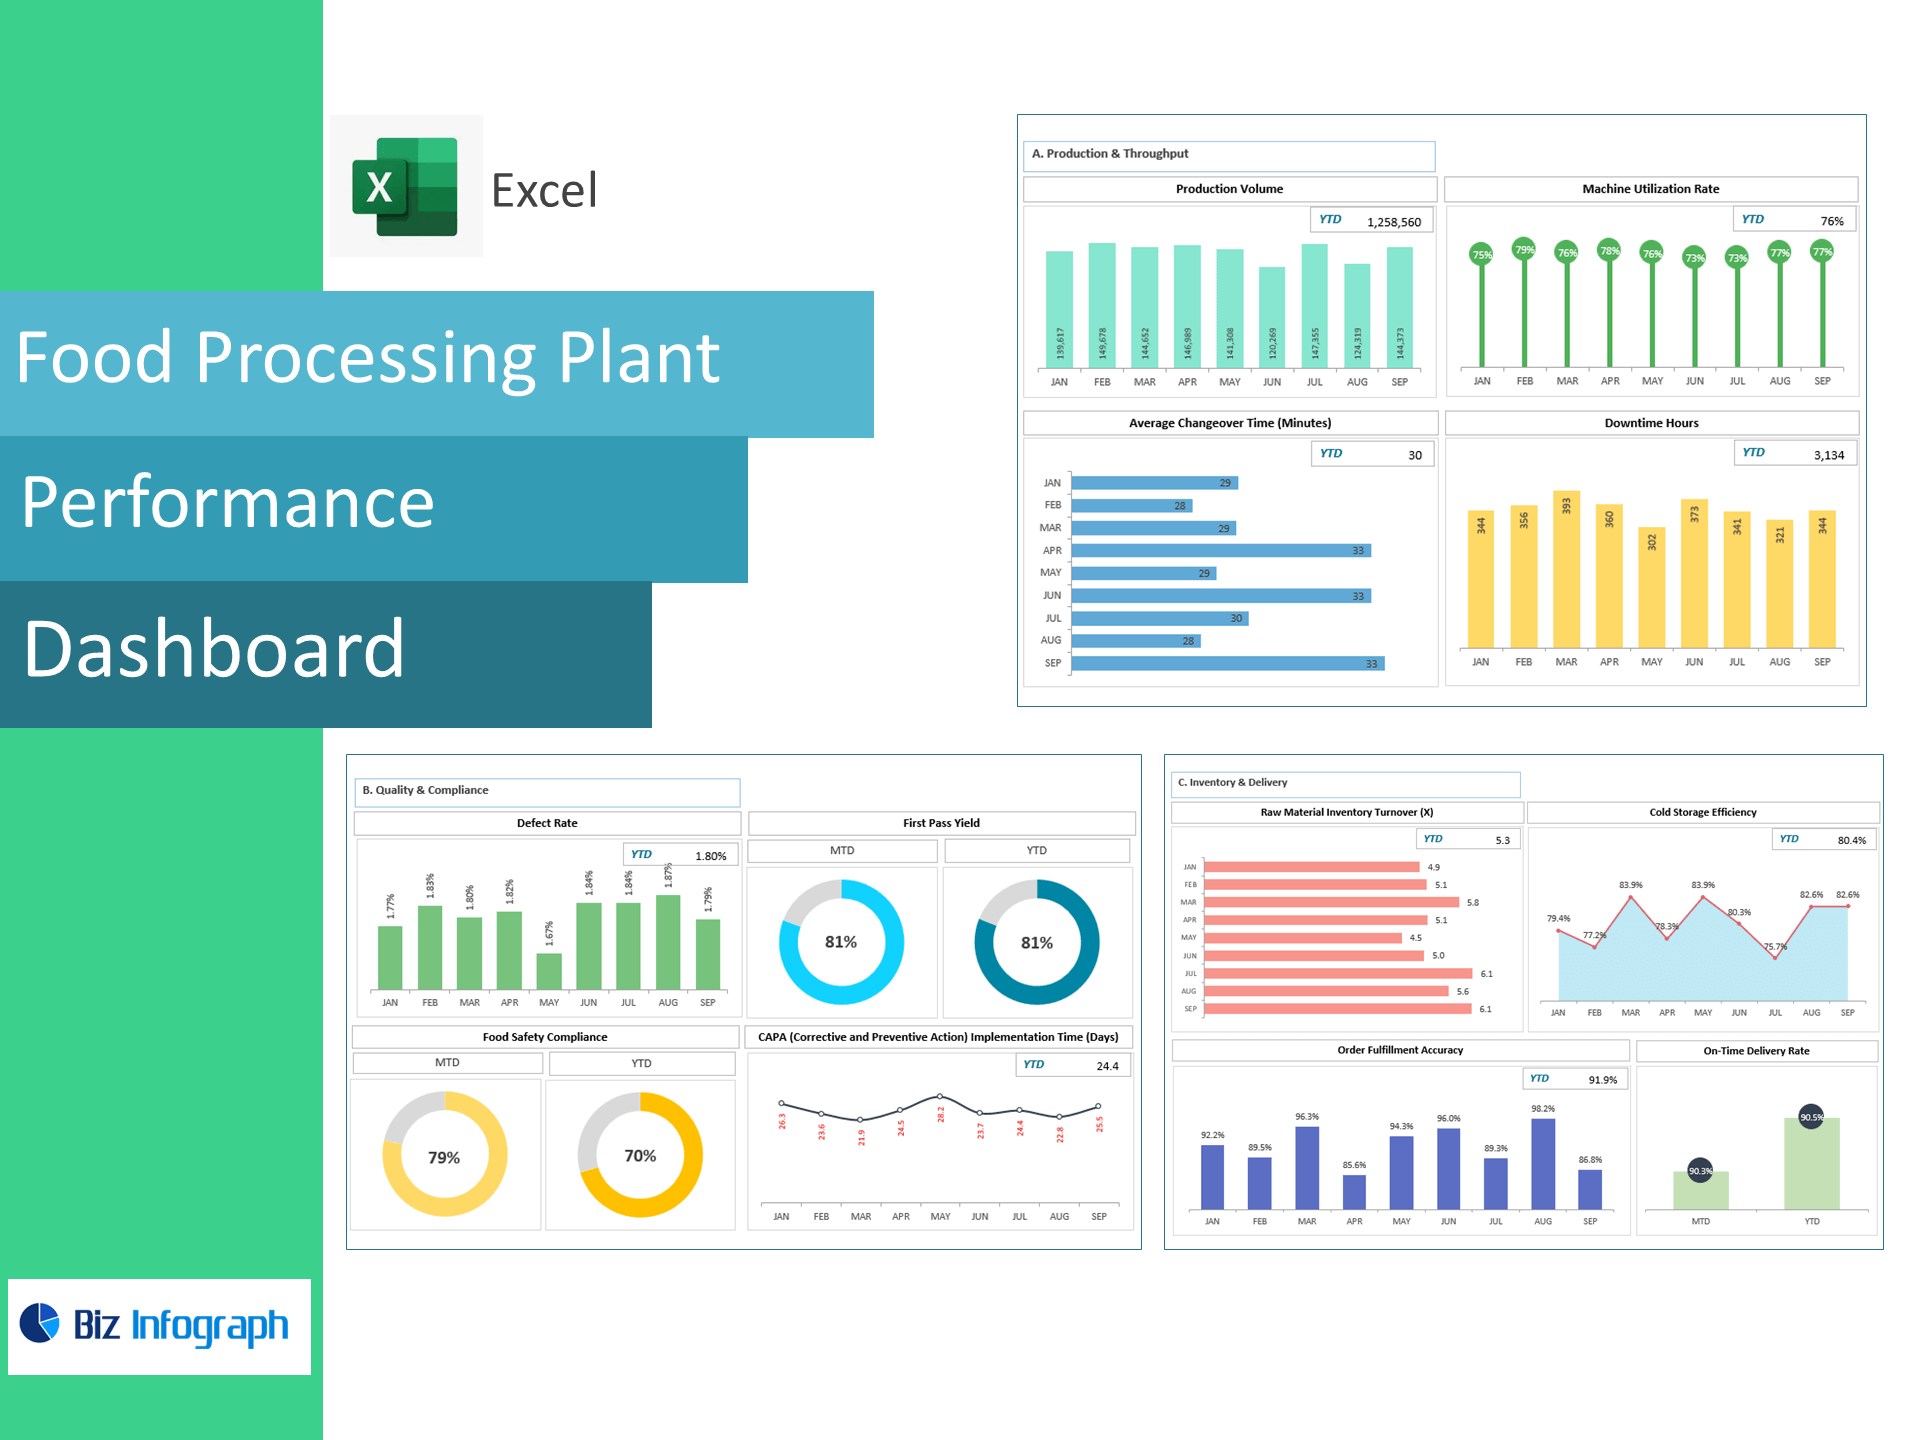
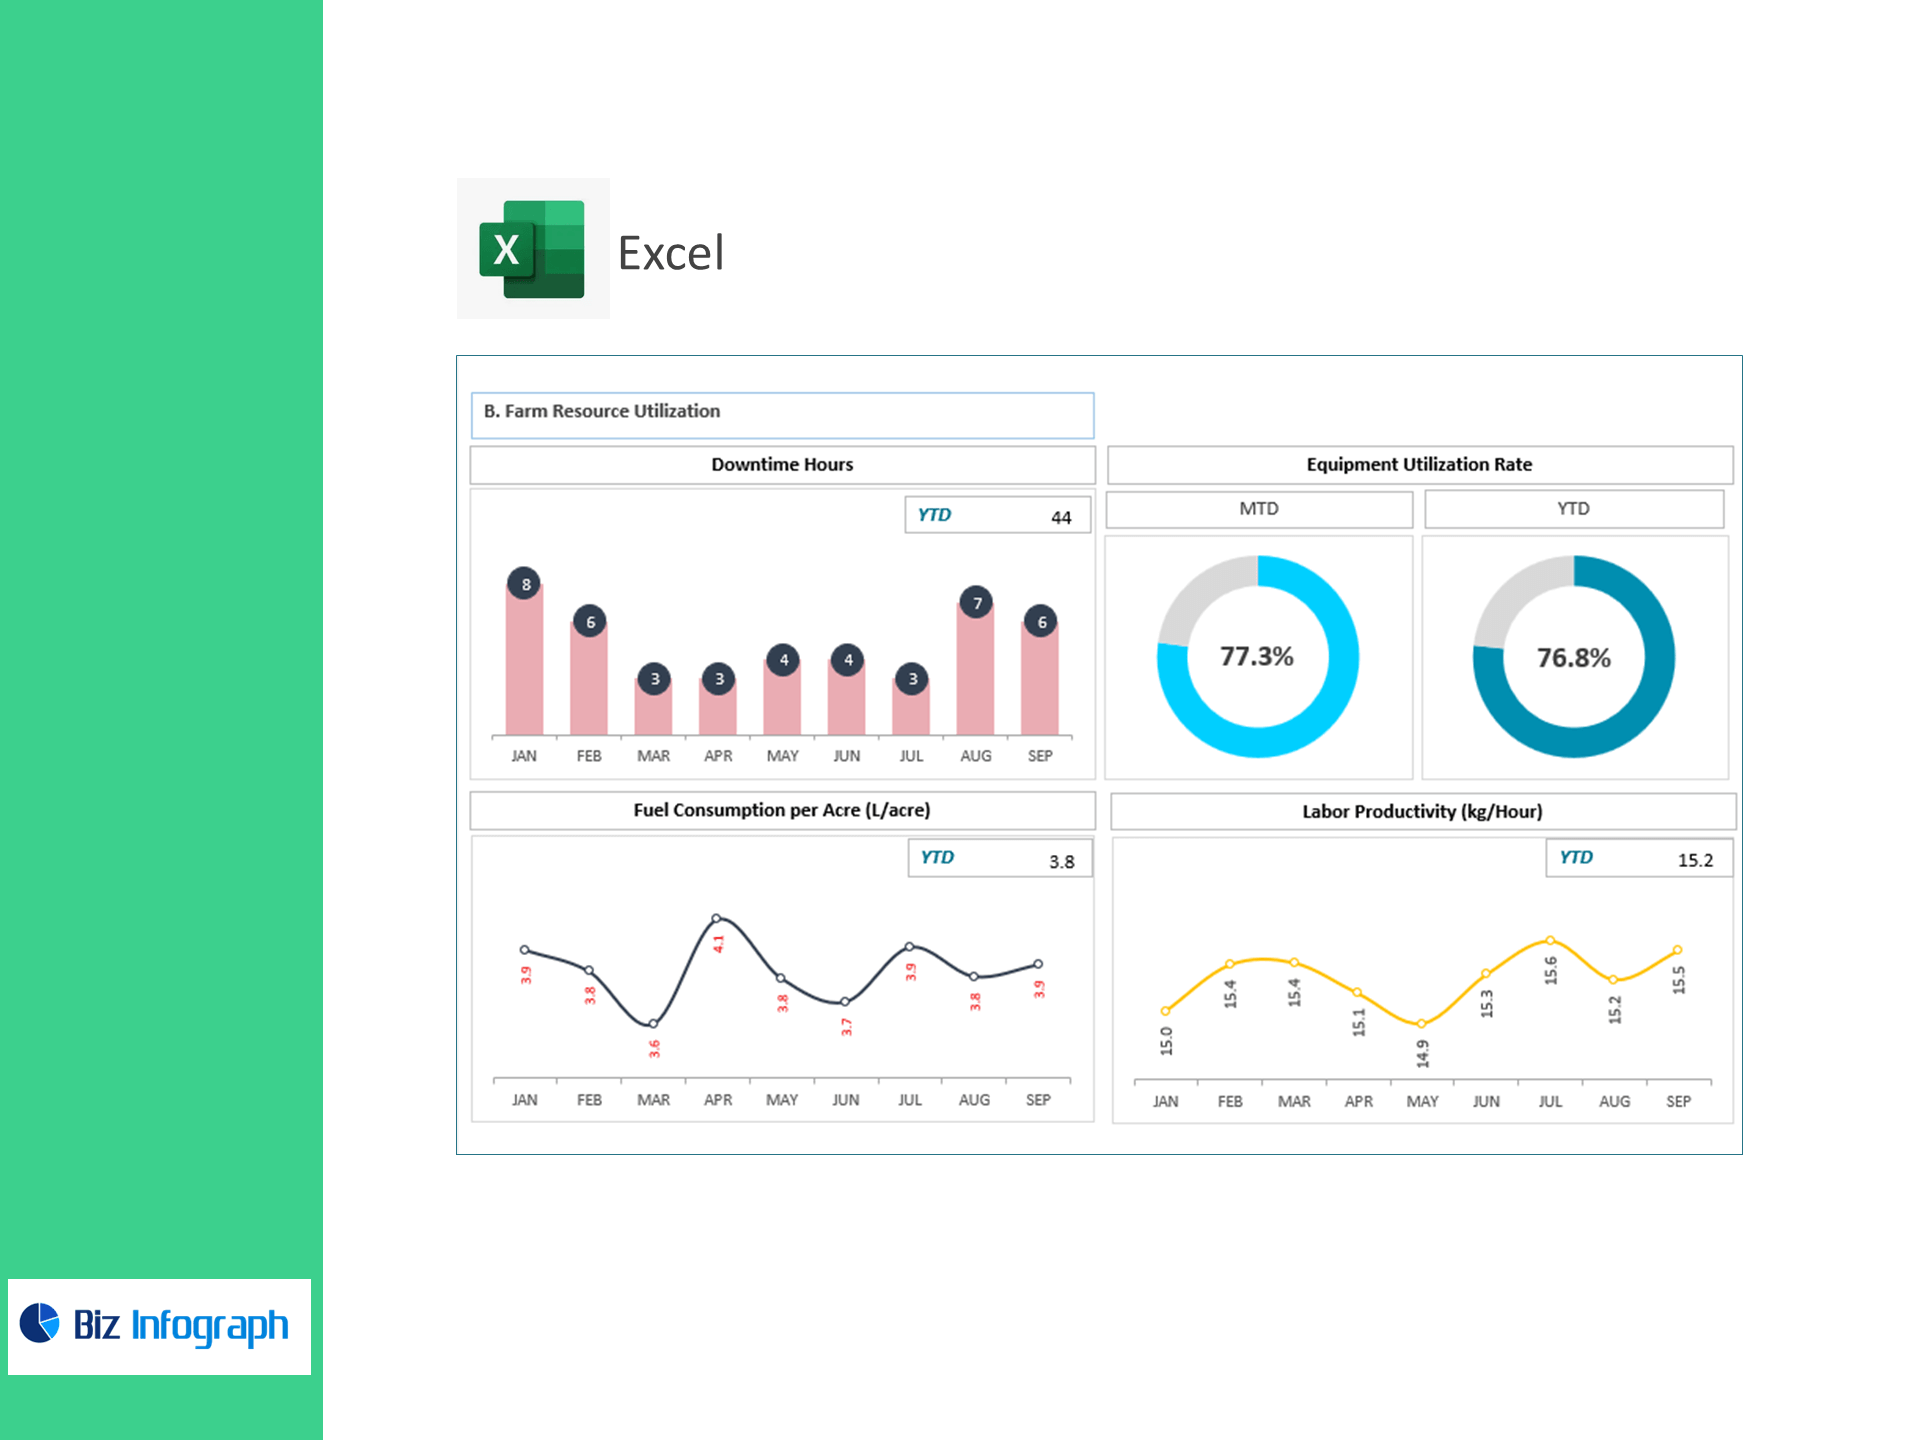
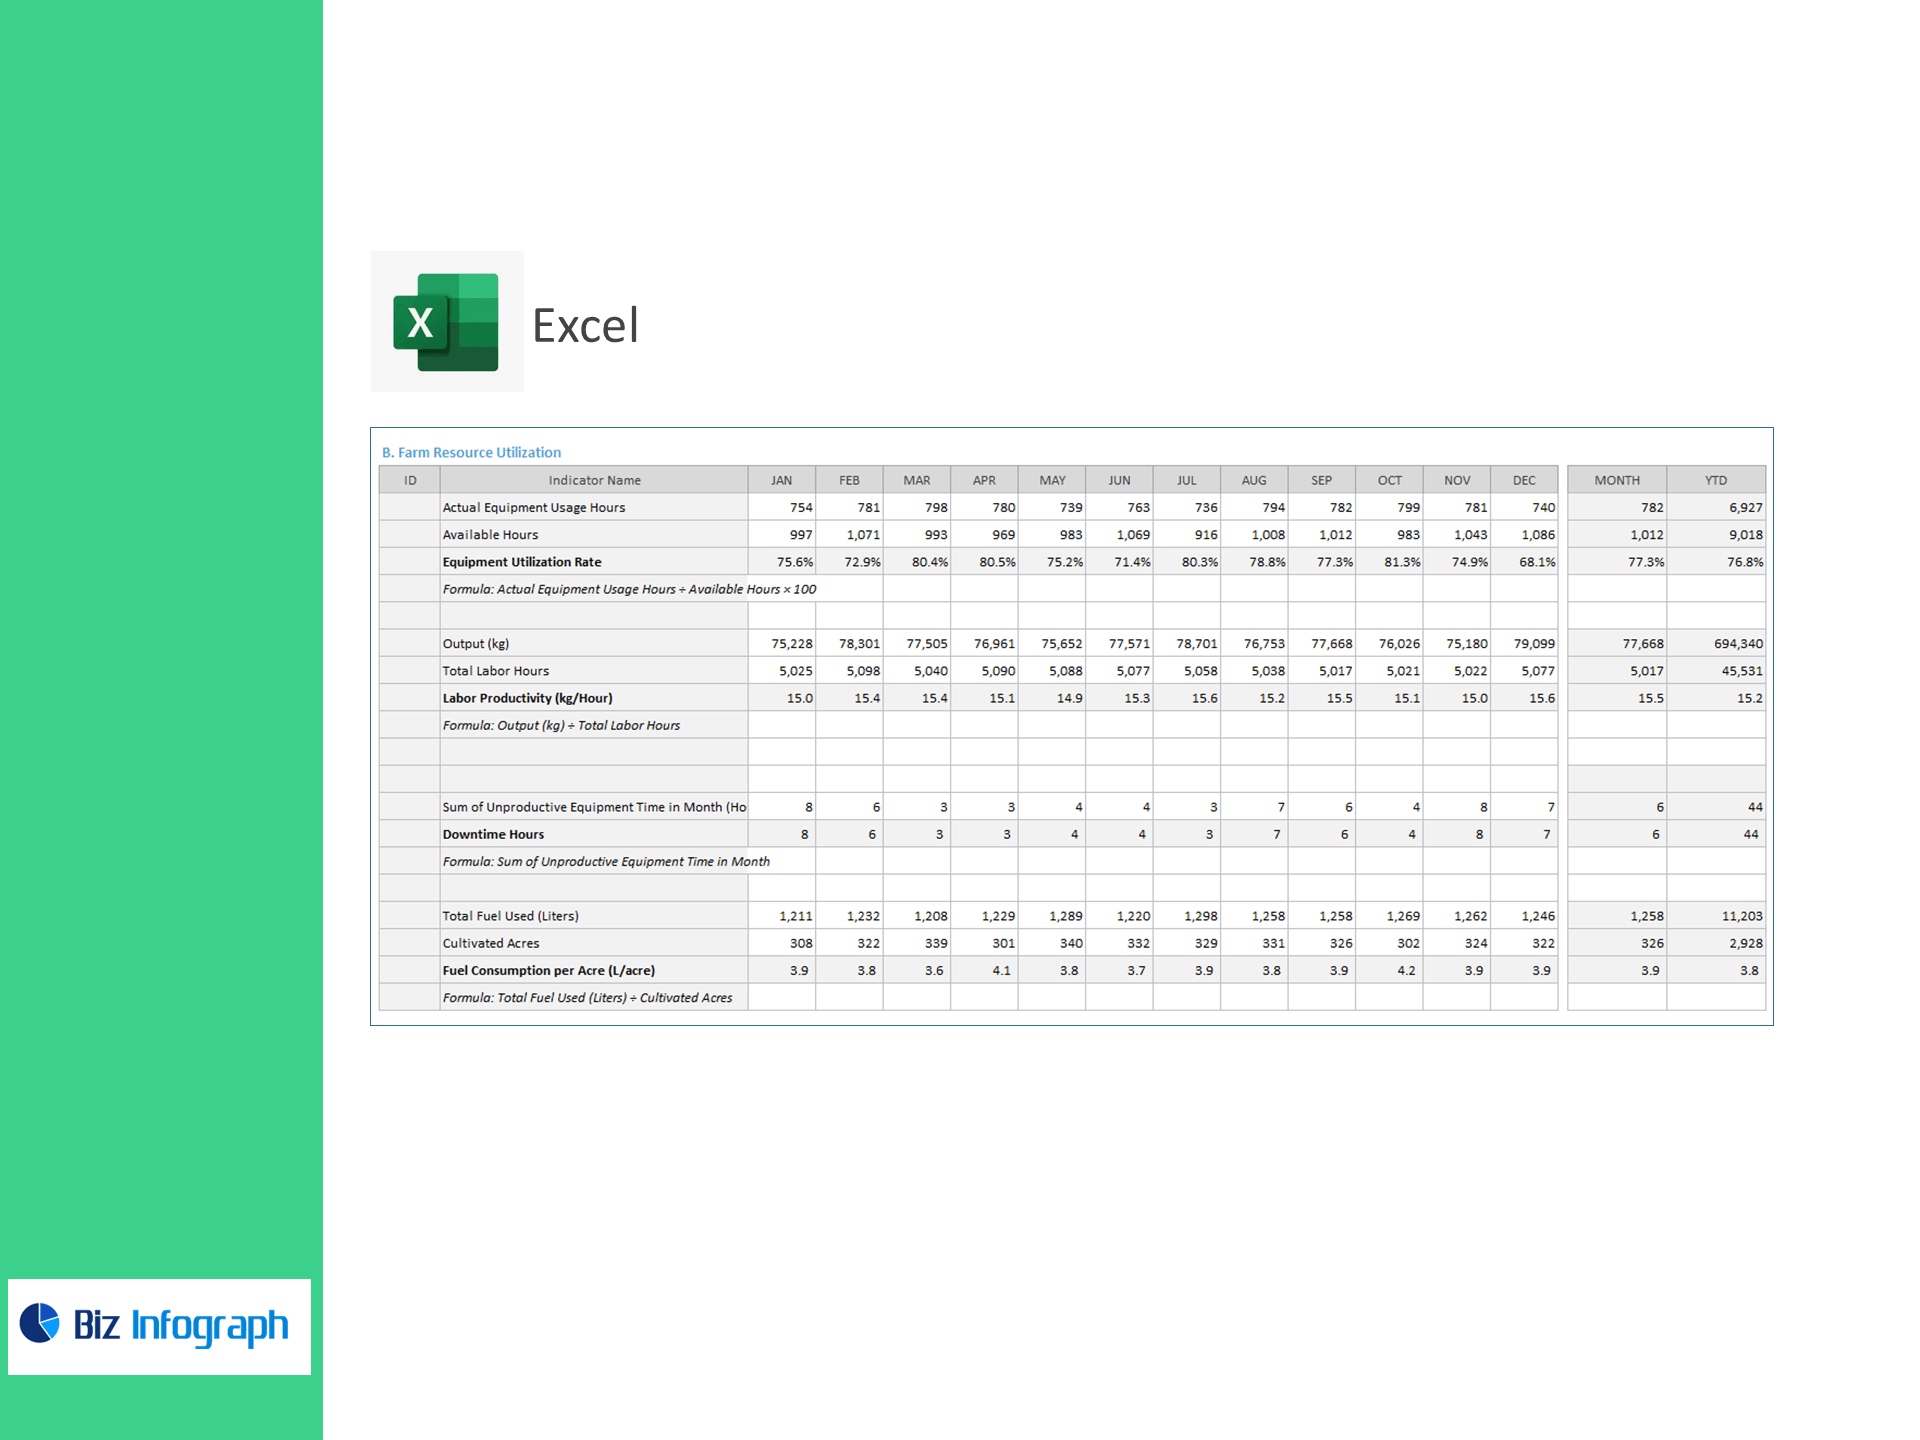
B) Farm Resource Utilization
-
Equipment Utilization Rate (%) (Actual Equipment Usage Hours ÷ Available Hours × 100)
-
Labor Productivity (kg/hour) (Output ÷ Total Labor Hours)
-
Downtime Hours (Sum of Unproductive Equipment Time in Month)
-
Fuel Consumption per Acre (L/acre) (Total Fuel Used ÷ Cultivated Acres)
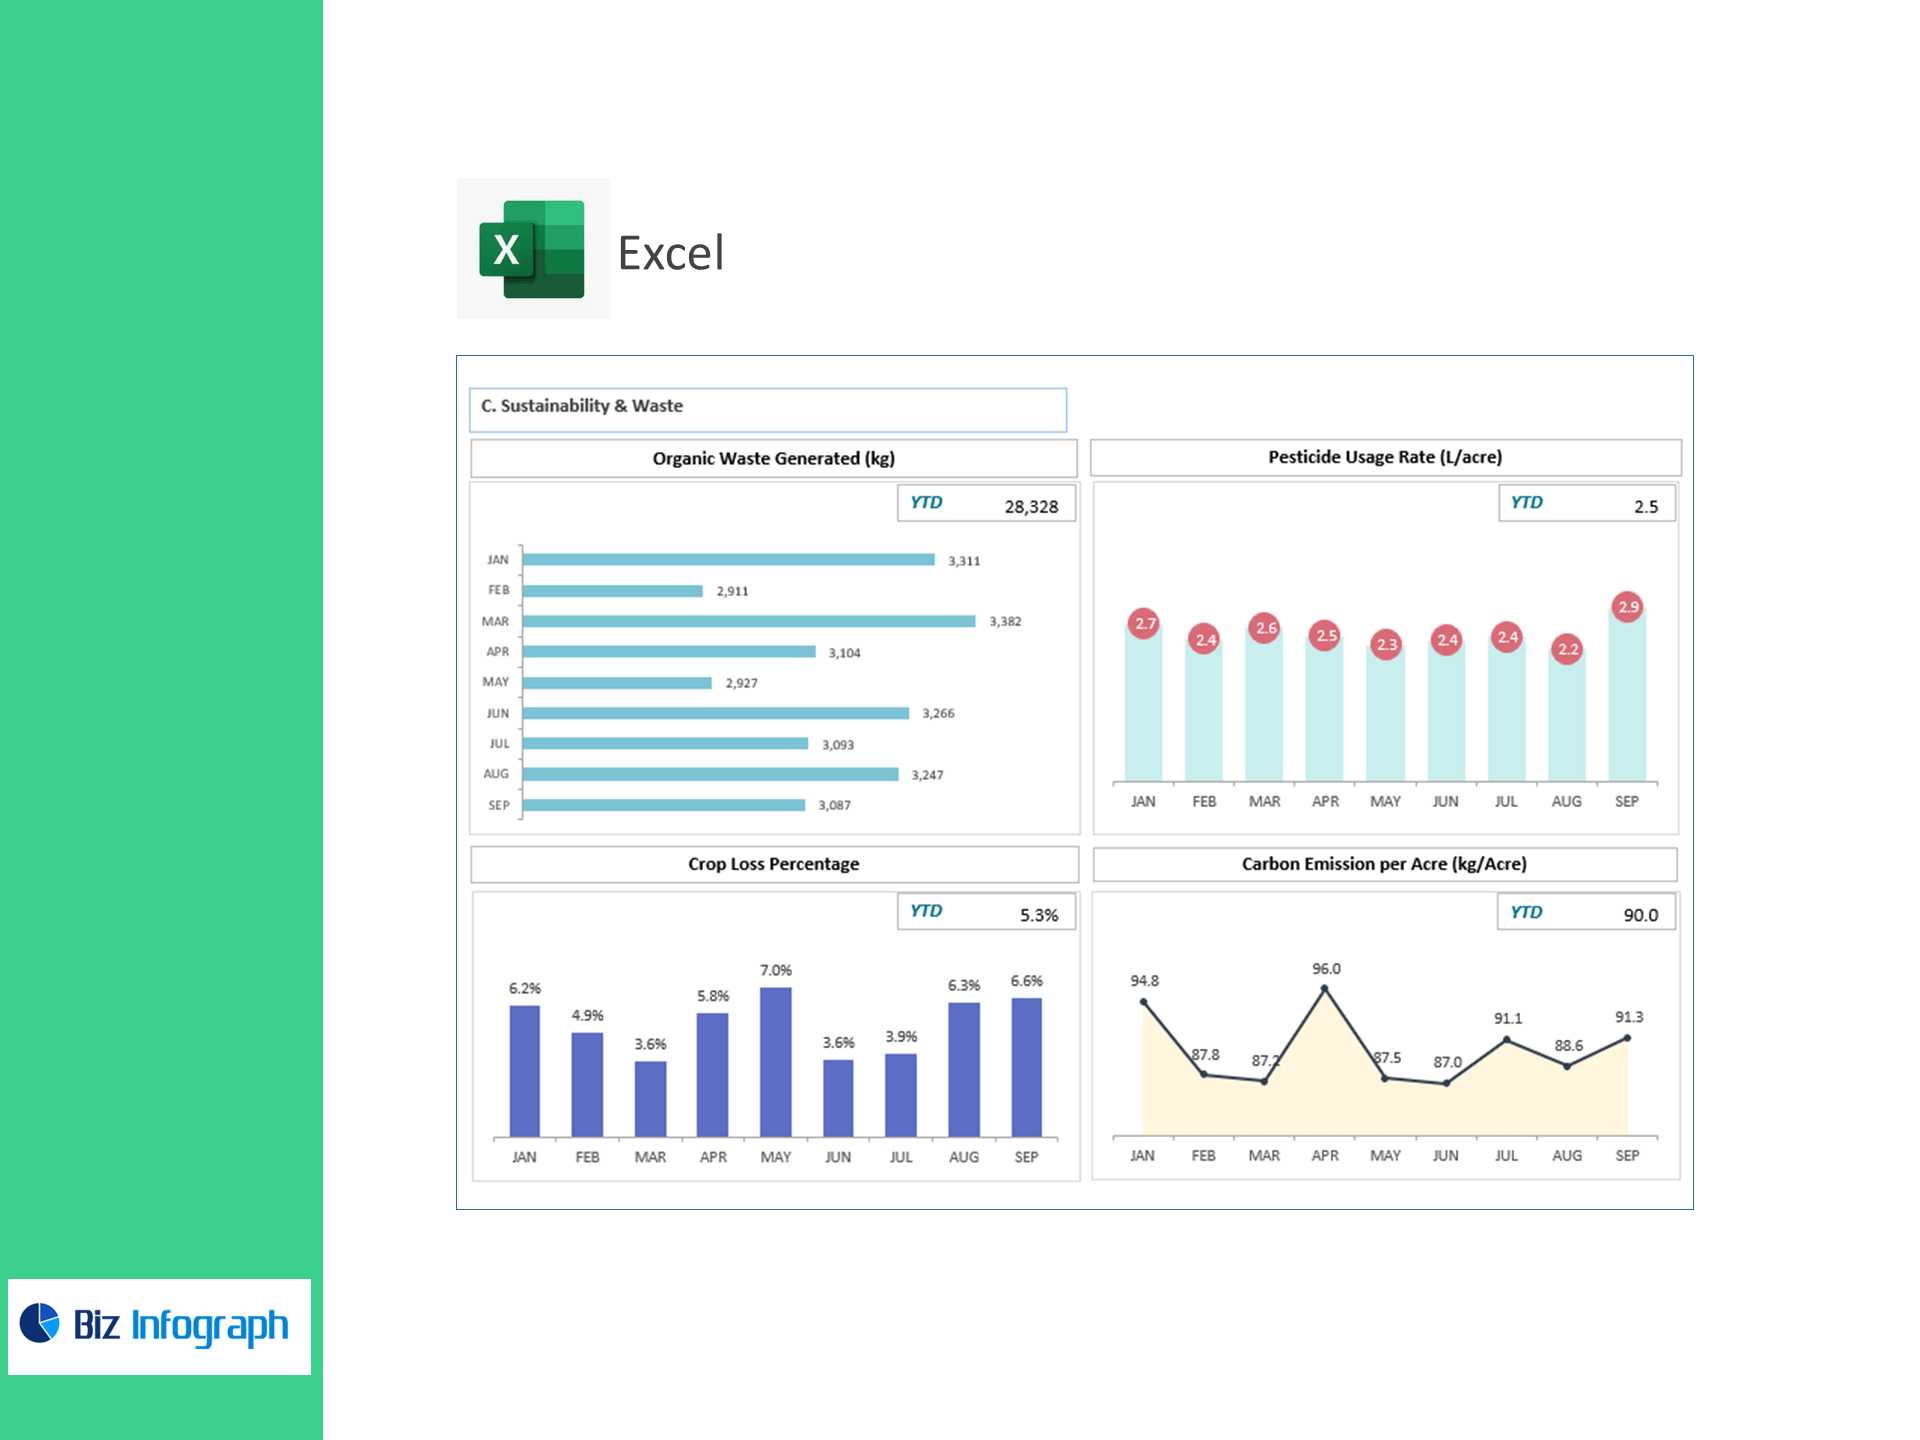
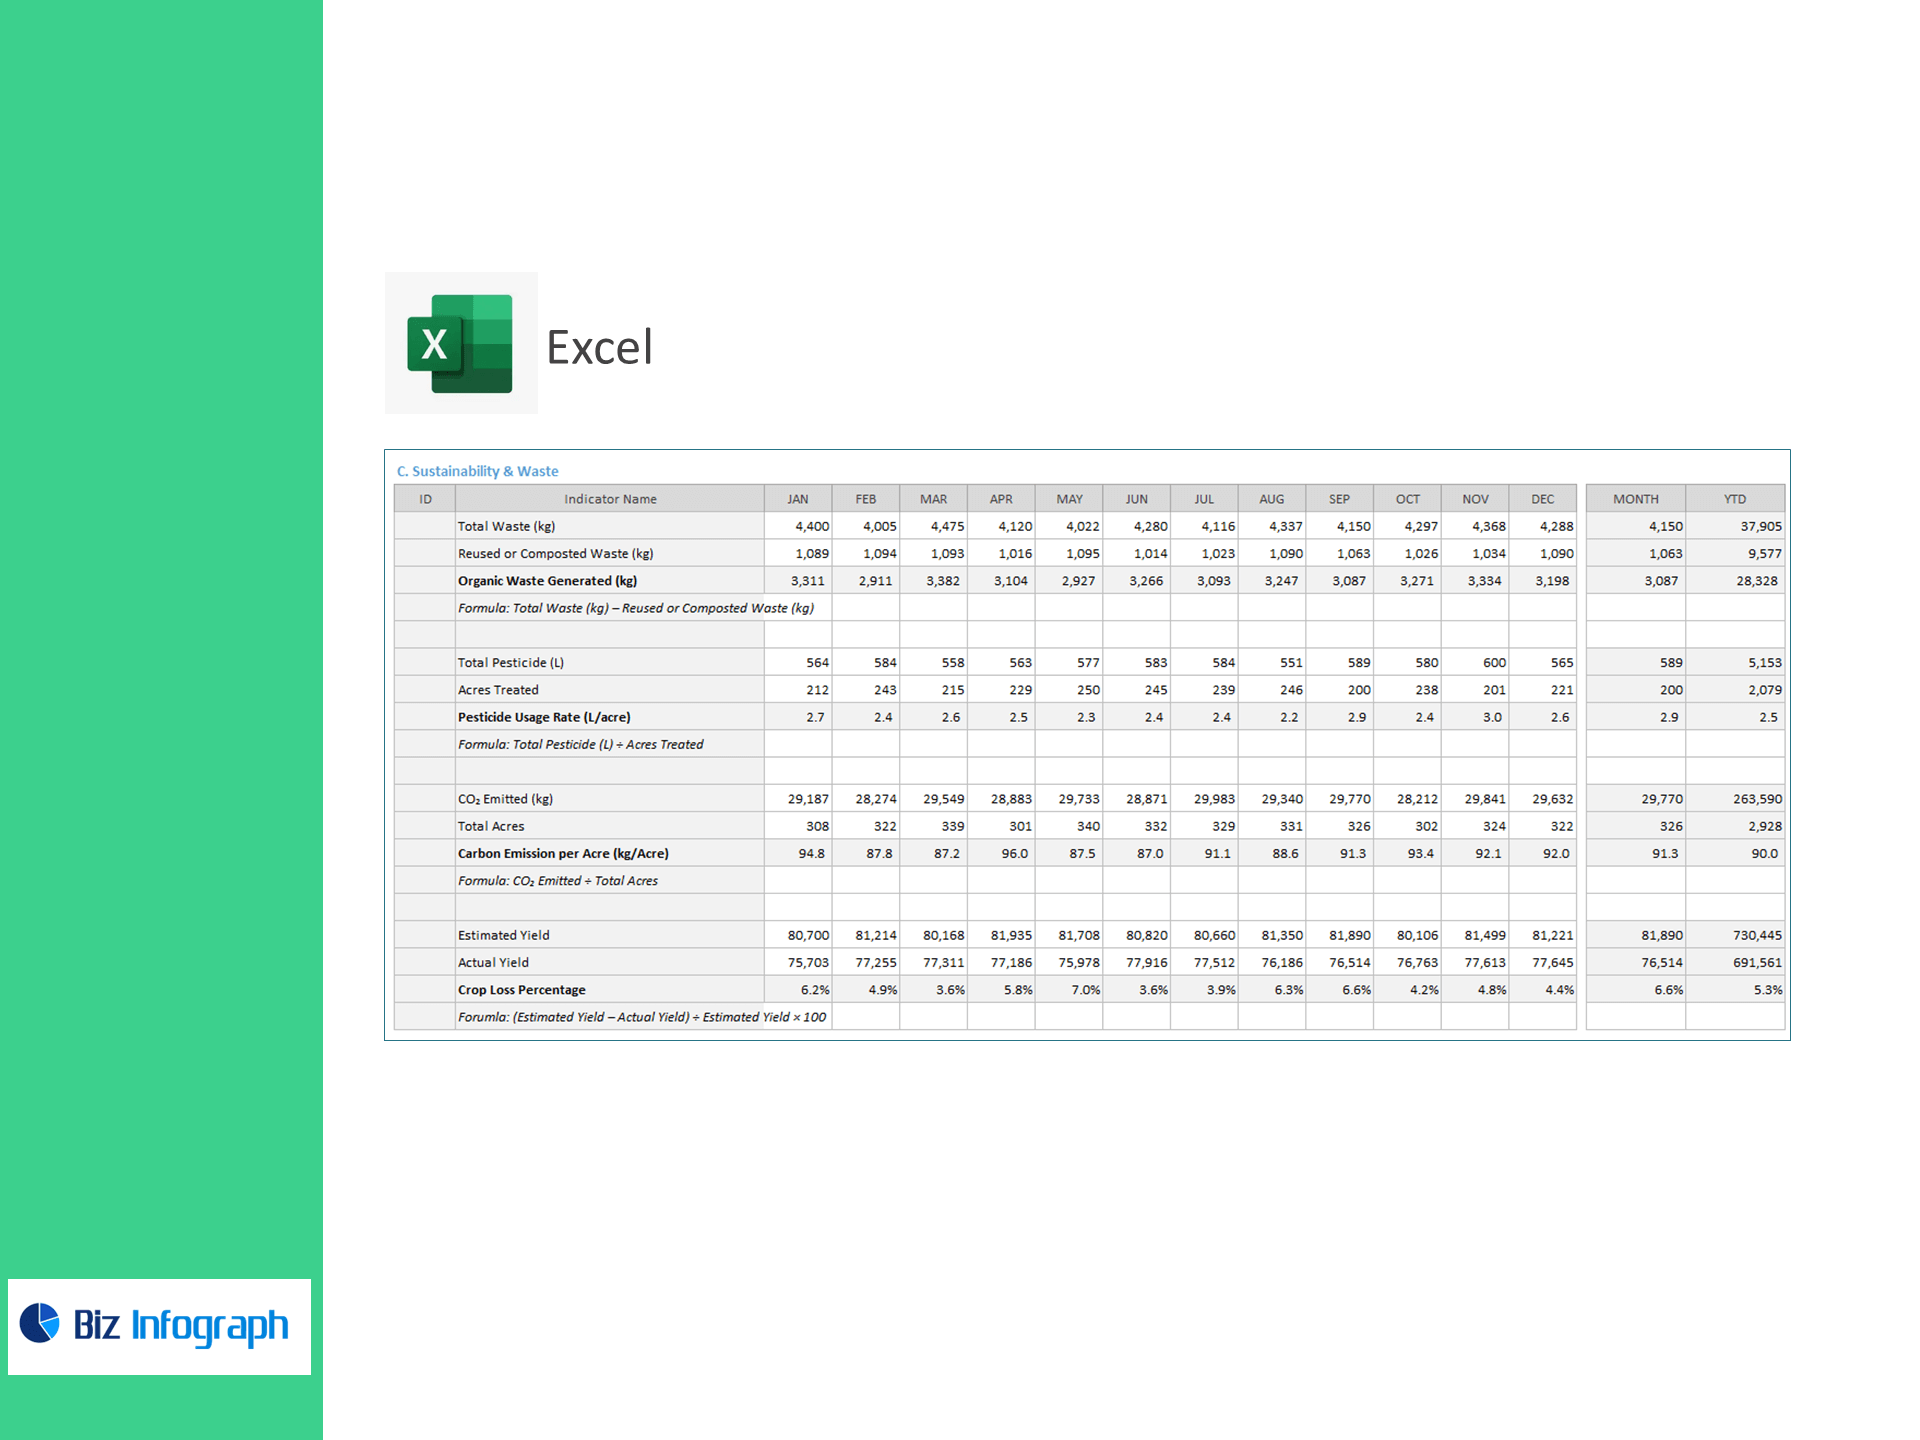
C) Sustainability & Waste
-
Organic Waste Generated (kg) (Total Waste − Reused/Composted)
-
Pesticide Usage Rate (L/acre) (Total Pesticide ÷ Acres Treated)
-
Carbon Emission per Acre (kg/acre) (CO? Emitted ÷ Total Acres)
-
Crop Loss % [(Estimated Yield − Actual Yield) ÷ Estimated Yield × 100]
Why farmers and agribusiness teams love it
-
One view of operations: From yield per acre to downtime hours, see the full picture of your farm’s performance.
-
Faster decisions: Red-flag alerts and MoM trends highlight where to fix water, fertilizer, labor, and equipment bottlenecks.
-
Lower costs & waste: Track inputs per acre, optimize fuel and pesticide use, and reduce post-harvest losses.
-
Sustainability ready: Monitor emissions, waste, and reuse rates to meet ESG targets and certification requirements.
What’s inside
-
Executive Dashboard: KPI scorecards, variance vs. plan, and trend lines.
-
Ops Analyzer: Yield, water, fertilizer, and labor productivity drill-downs.
-
Equipment & Downtime Monitor: Utilization %, idle time, and quick wins.
-
Sustainability Panel: Organic waste, pesticide rate, and CO? per acre.
-
Clean Data Sheets: Validated inputs with sample data to get started.
For ready-to-use Dashboard Templates: