Production, Inventory & Supply Chain Dashboard — Excel Template
Turn factory, warehouse, and supplier data into decisions with a ready-to-use Excel dashboard that fuses production efficiency, inventory health, logistics cost, and supplier performance in one view.
What it measures (prebuilt KPIs)
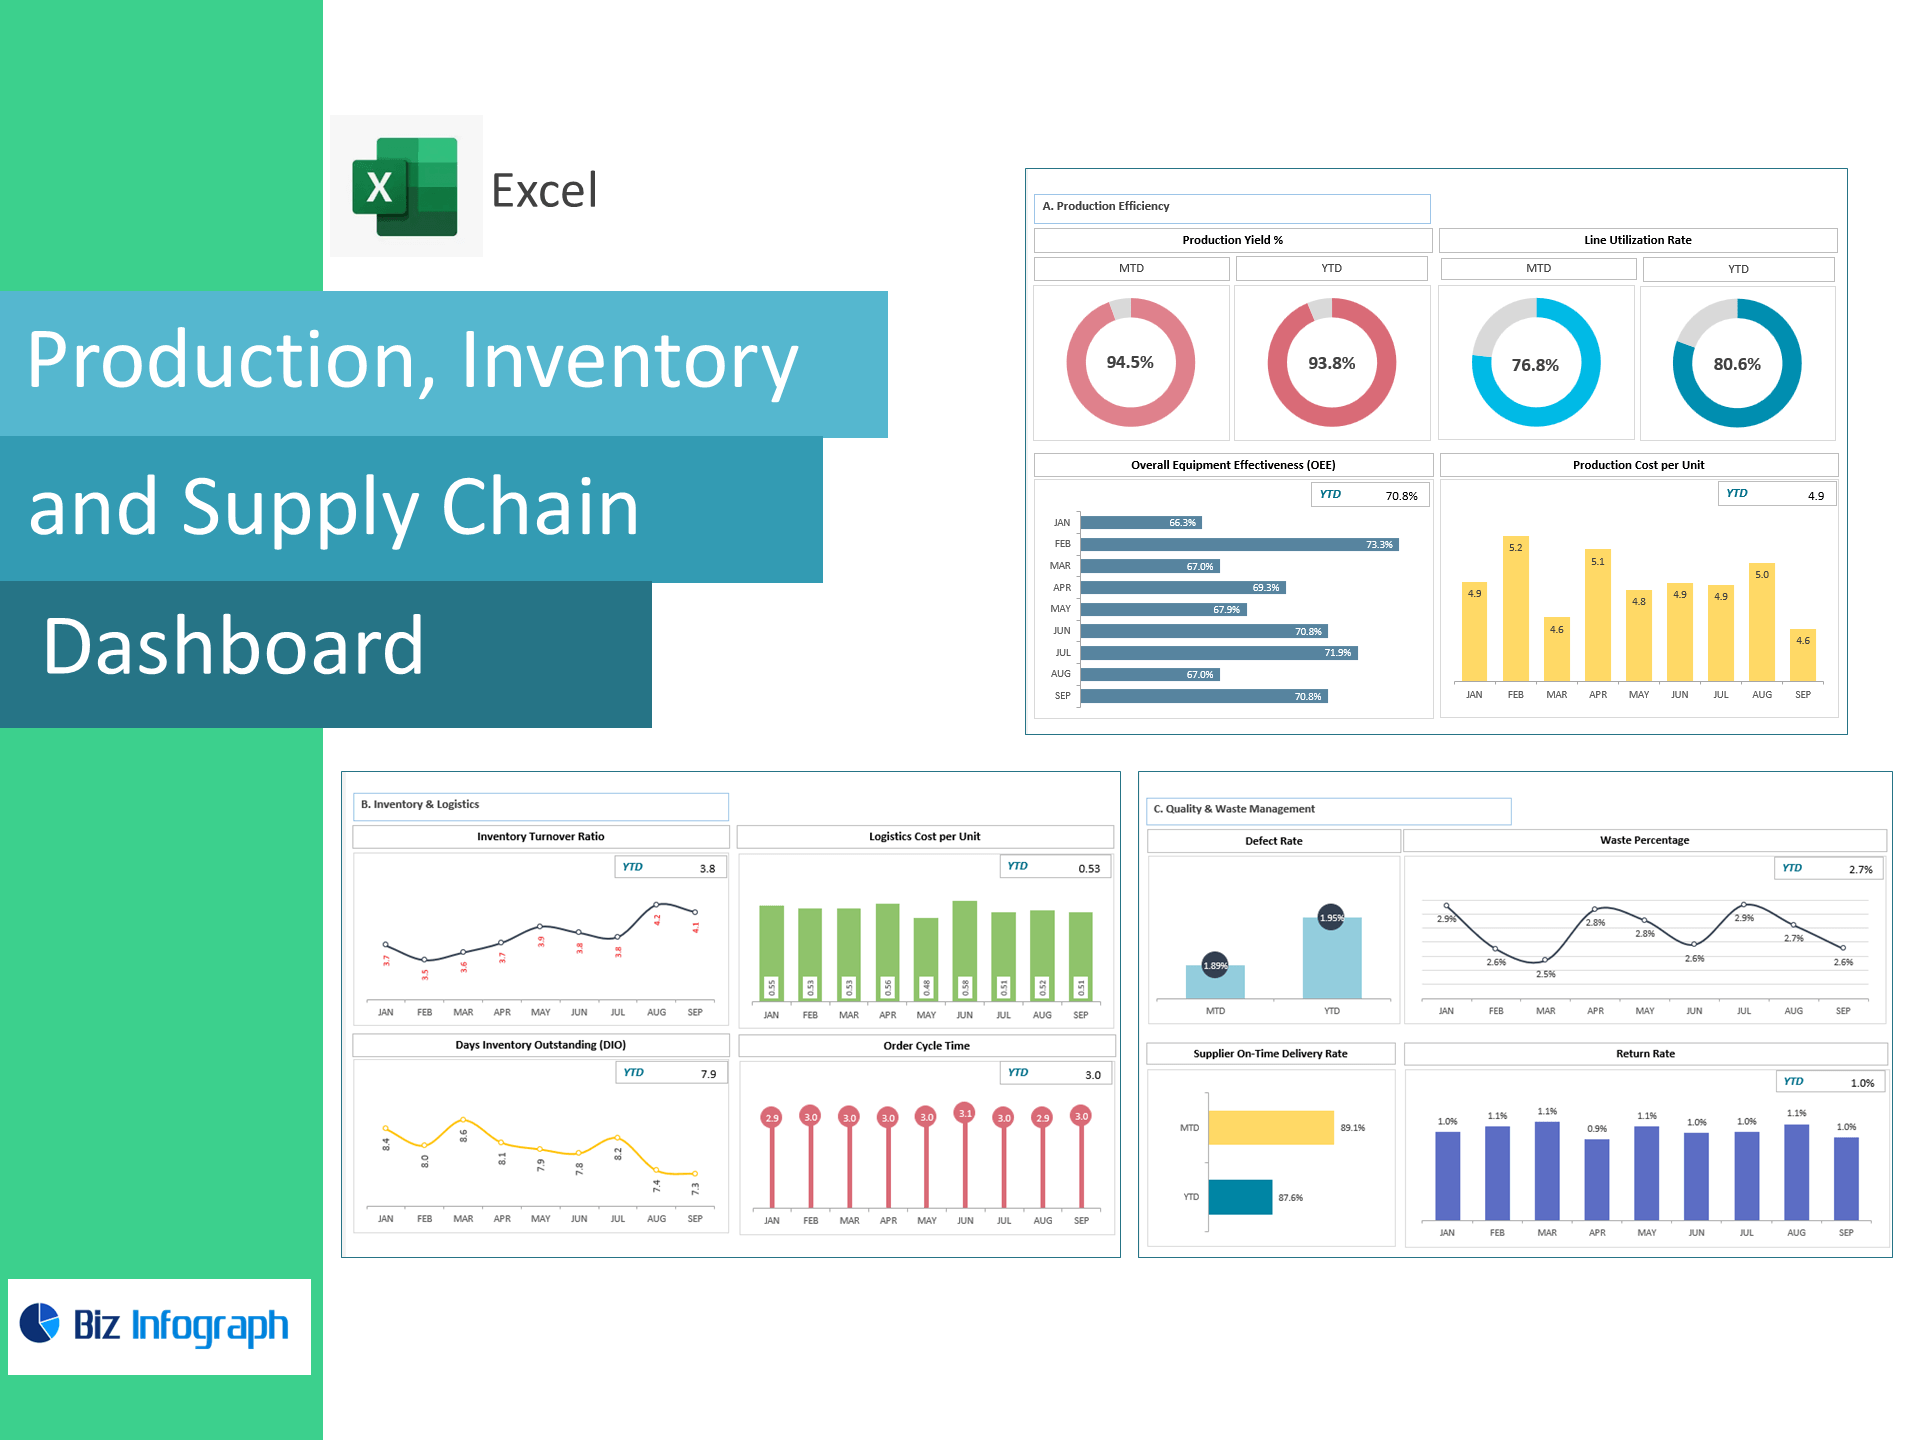
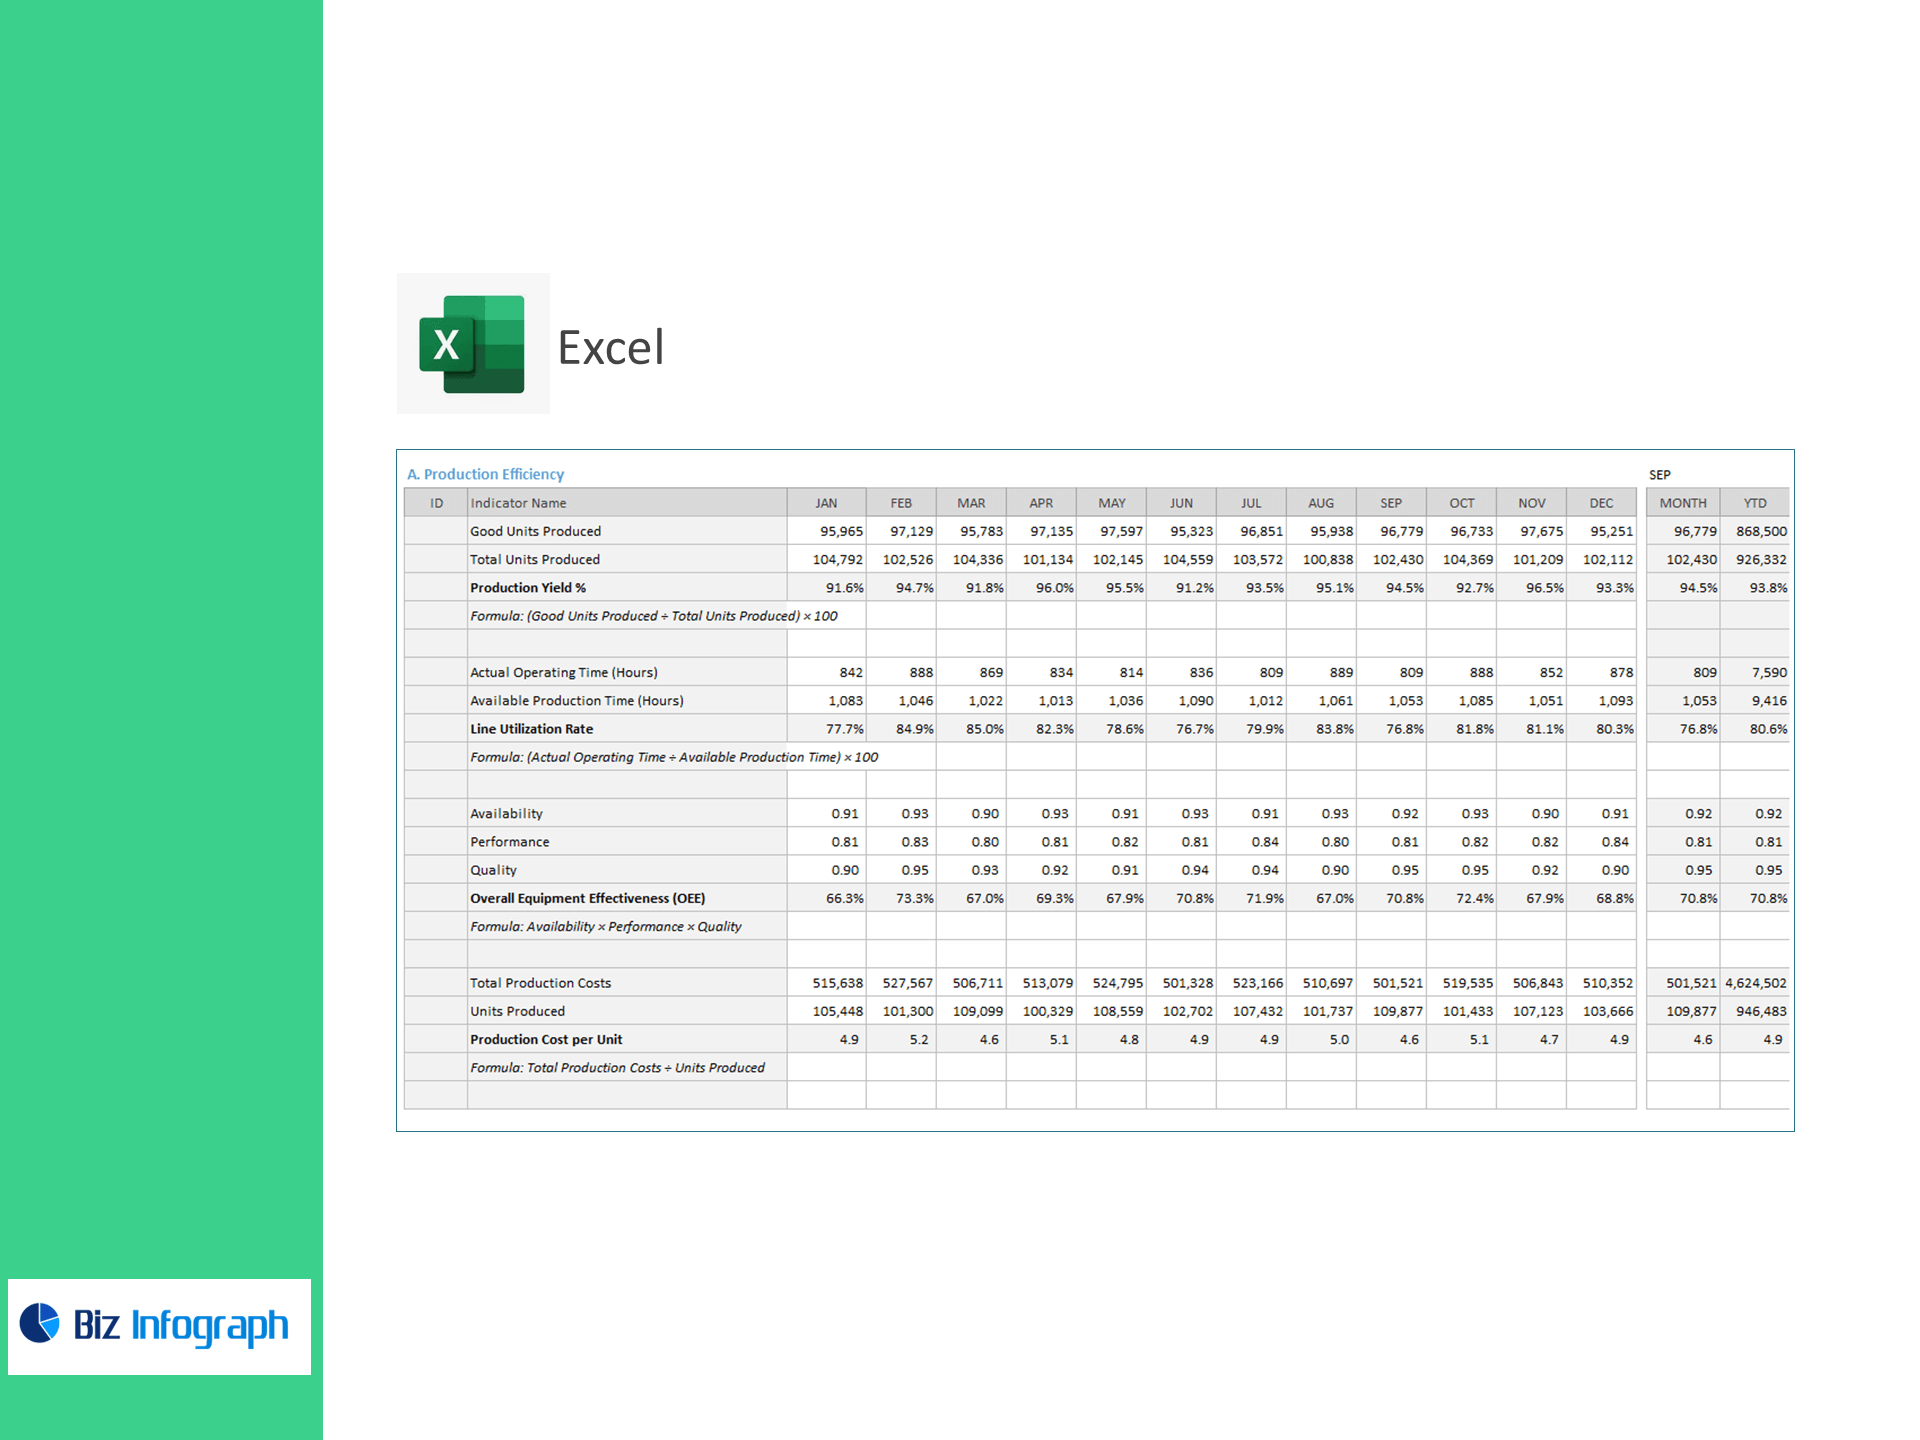
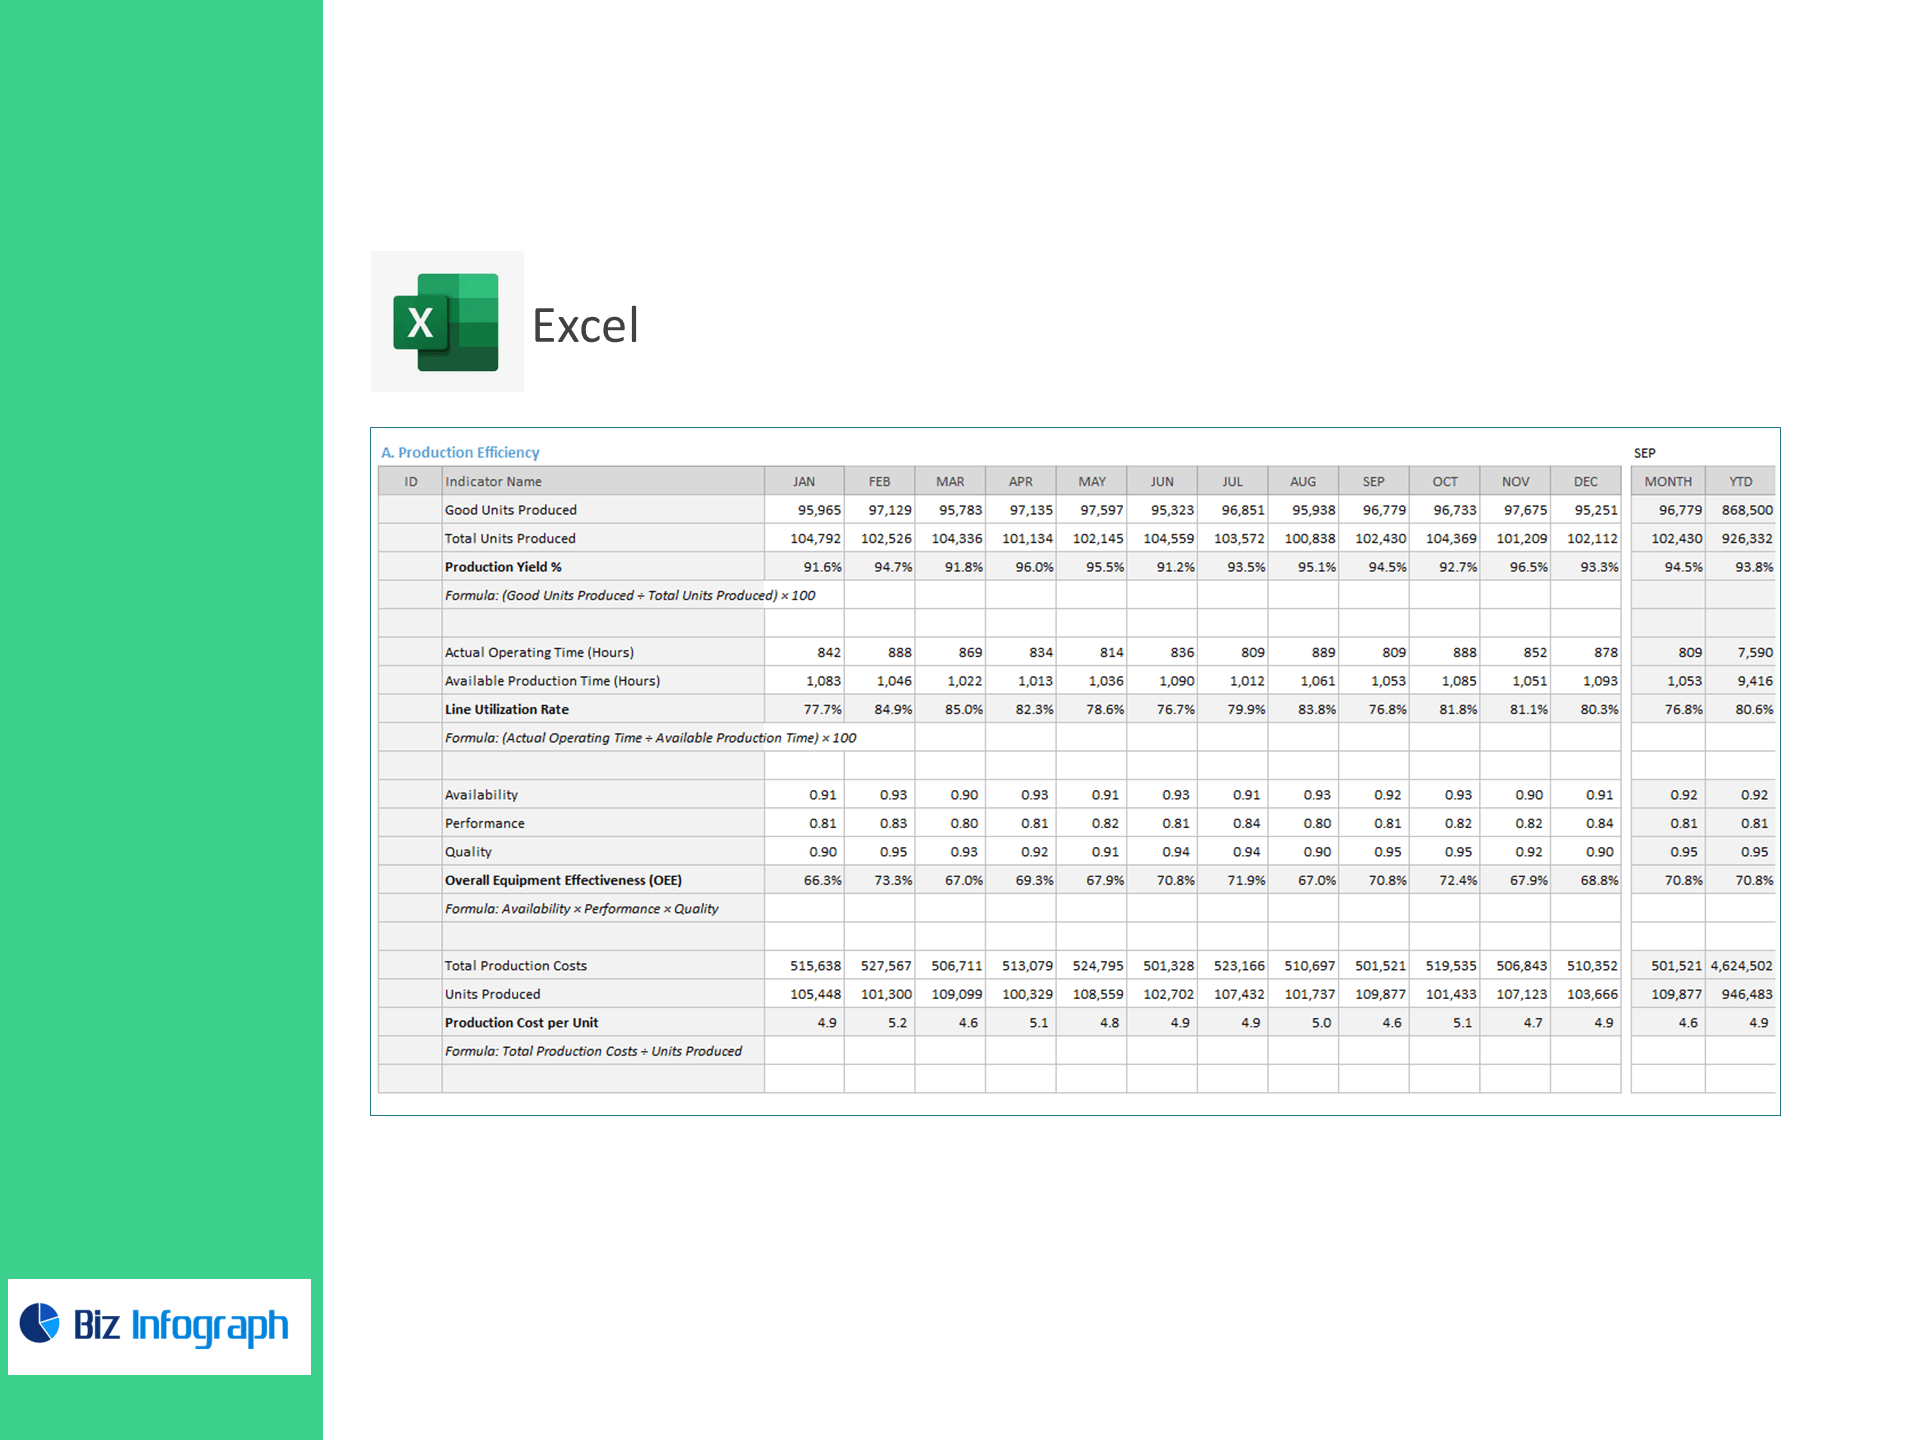
A) Production Efficiency
-
Production Yield % (good units ÷ total units)
-
Line Utilization Rate (actual vs available hours)
-
Overall Equipment Effectiveness (OEE) = Availability × Performance × Quality
-
Production Cost per Unit
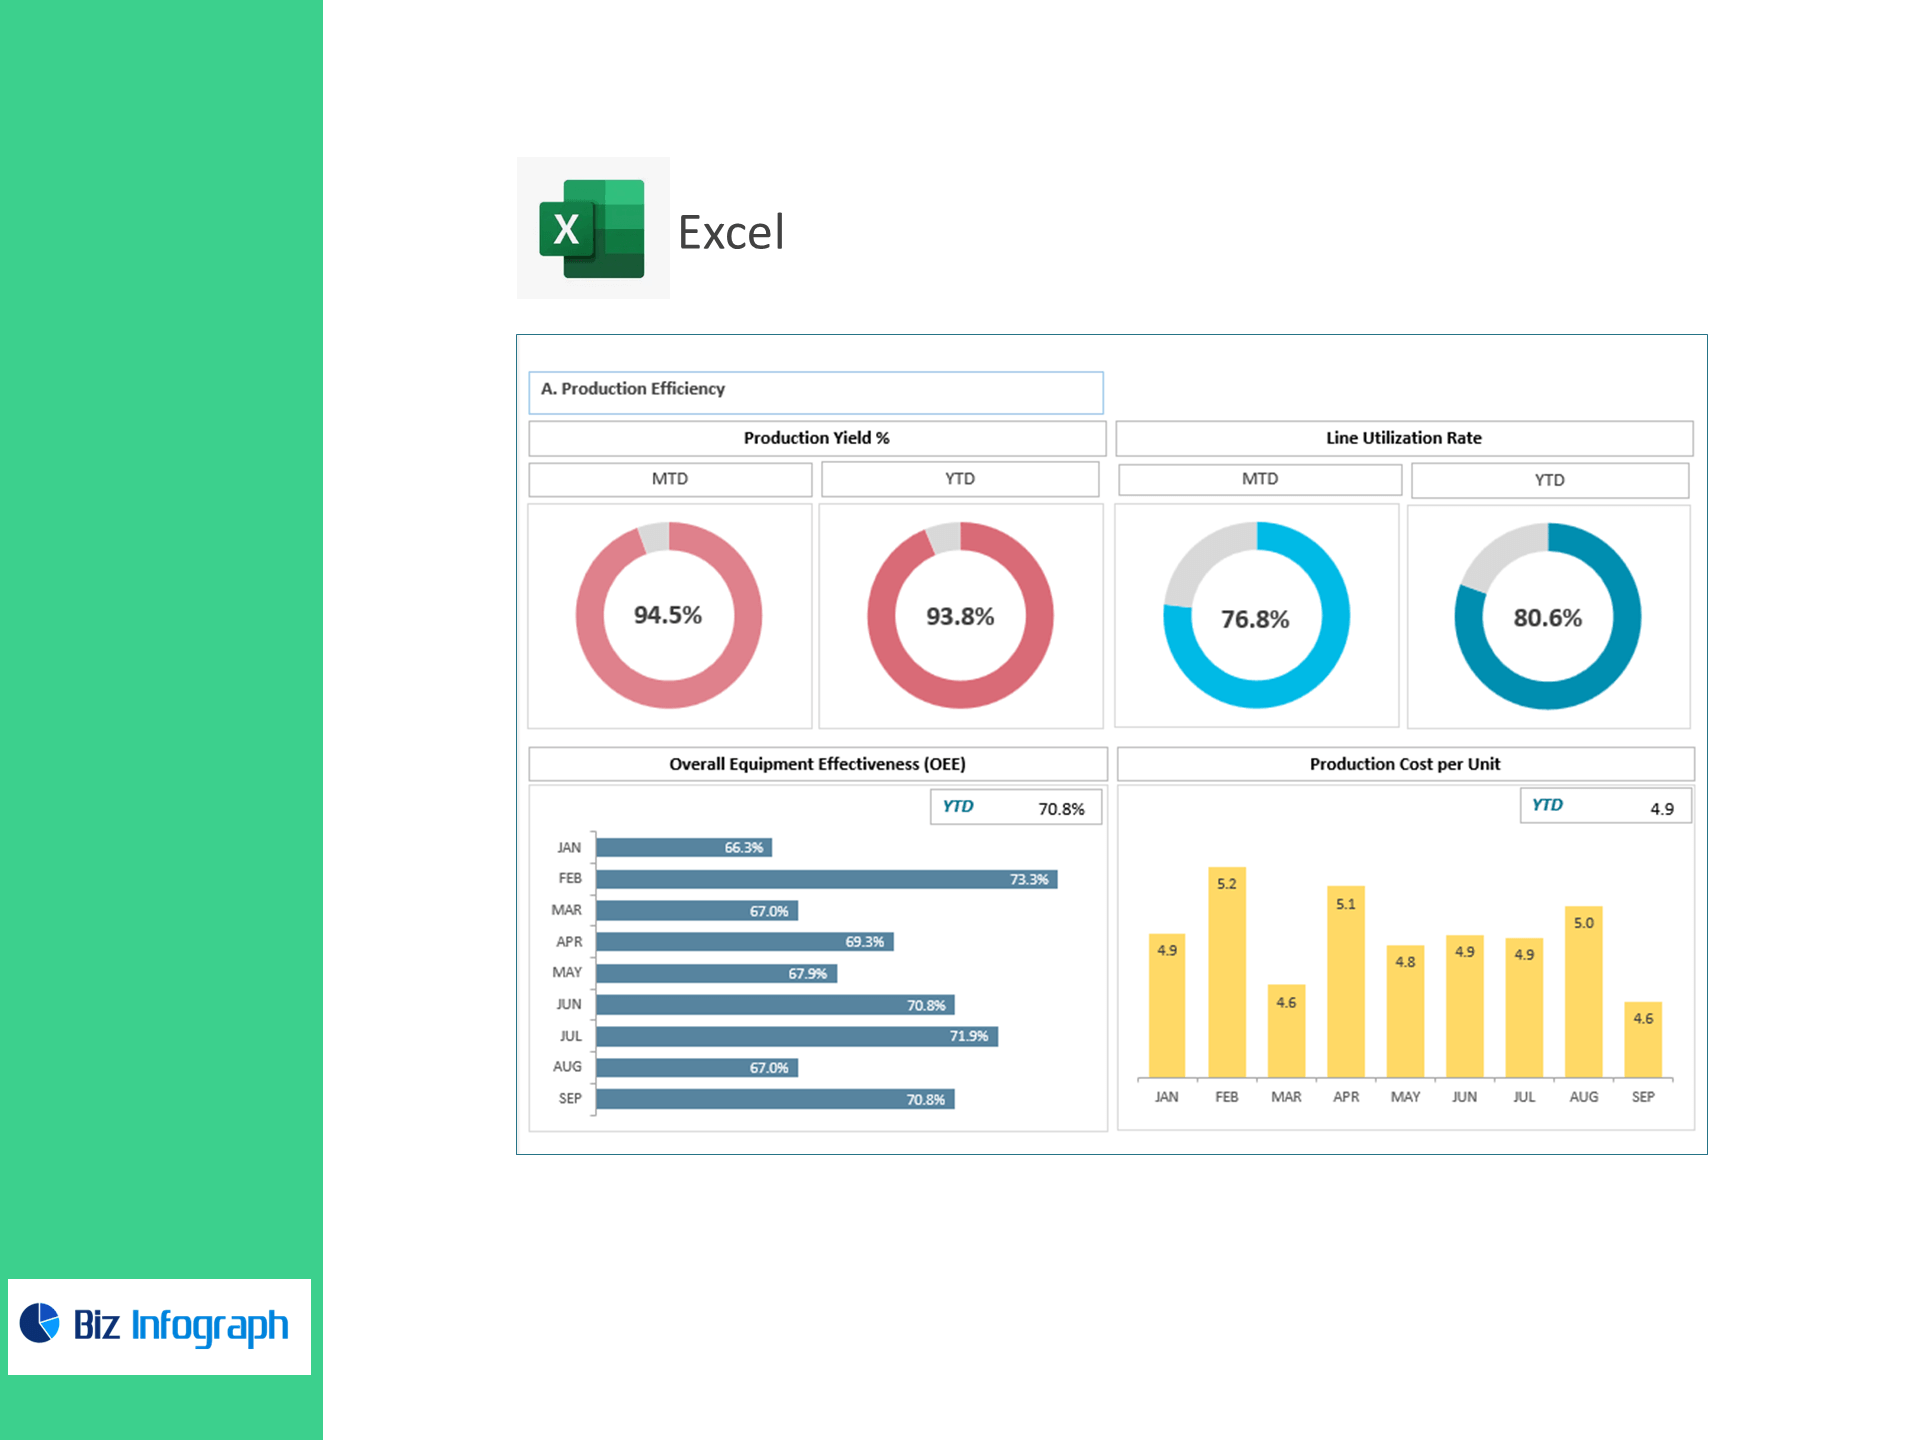
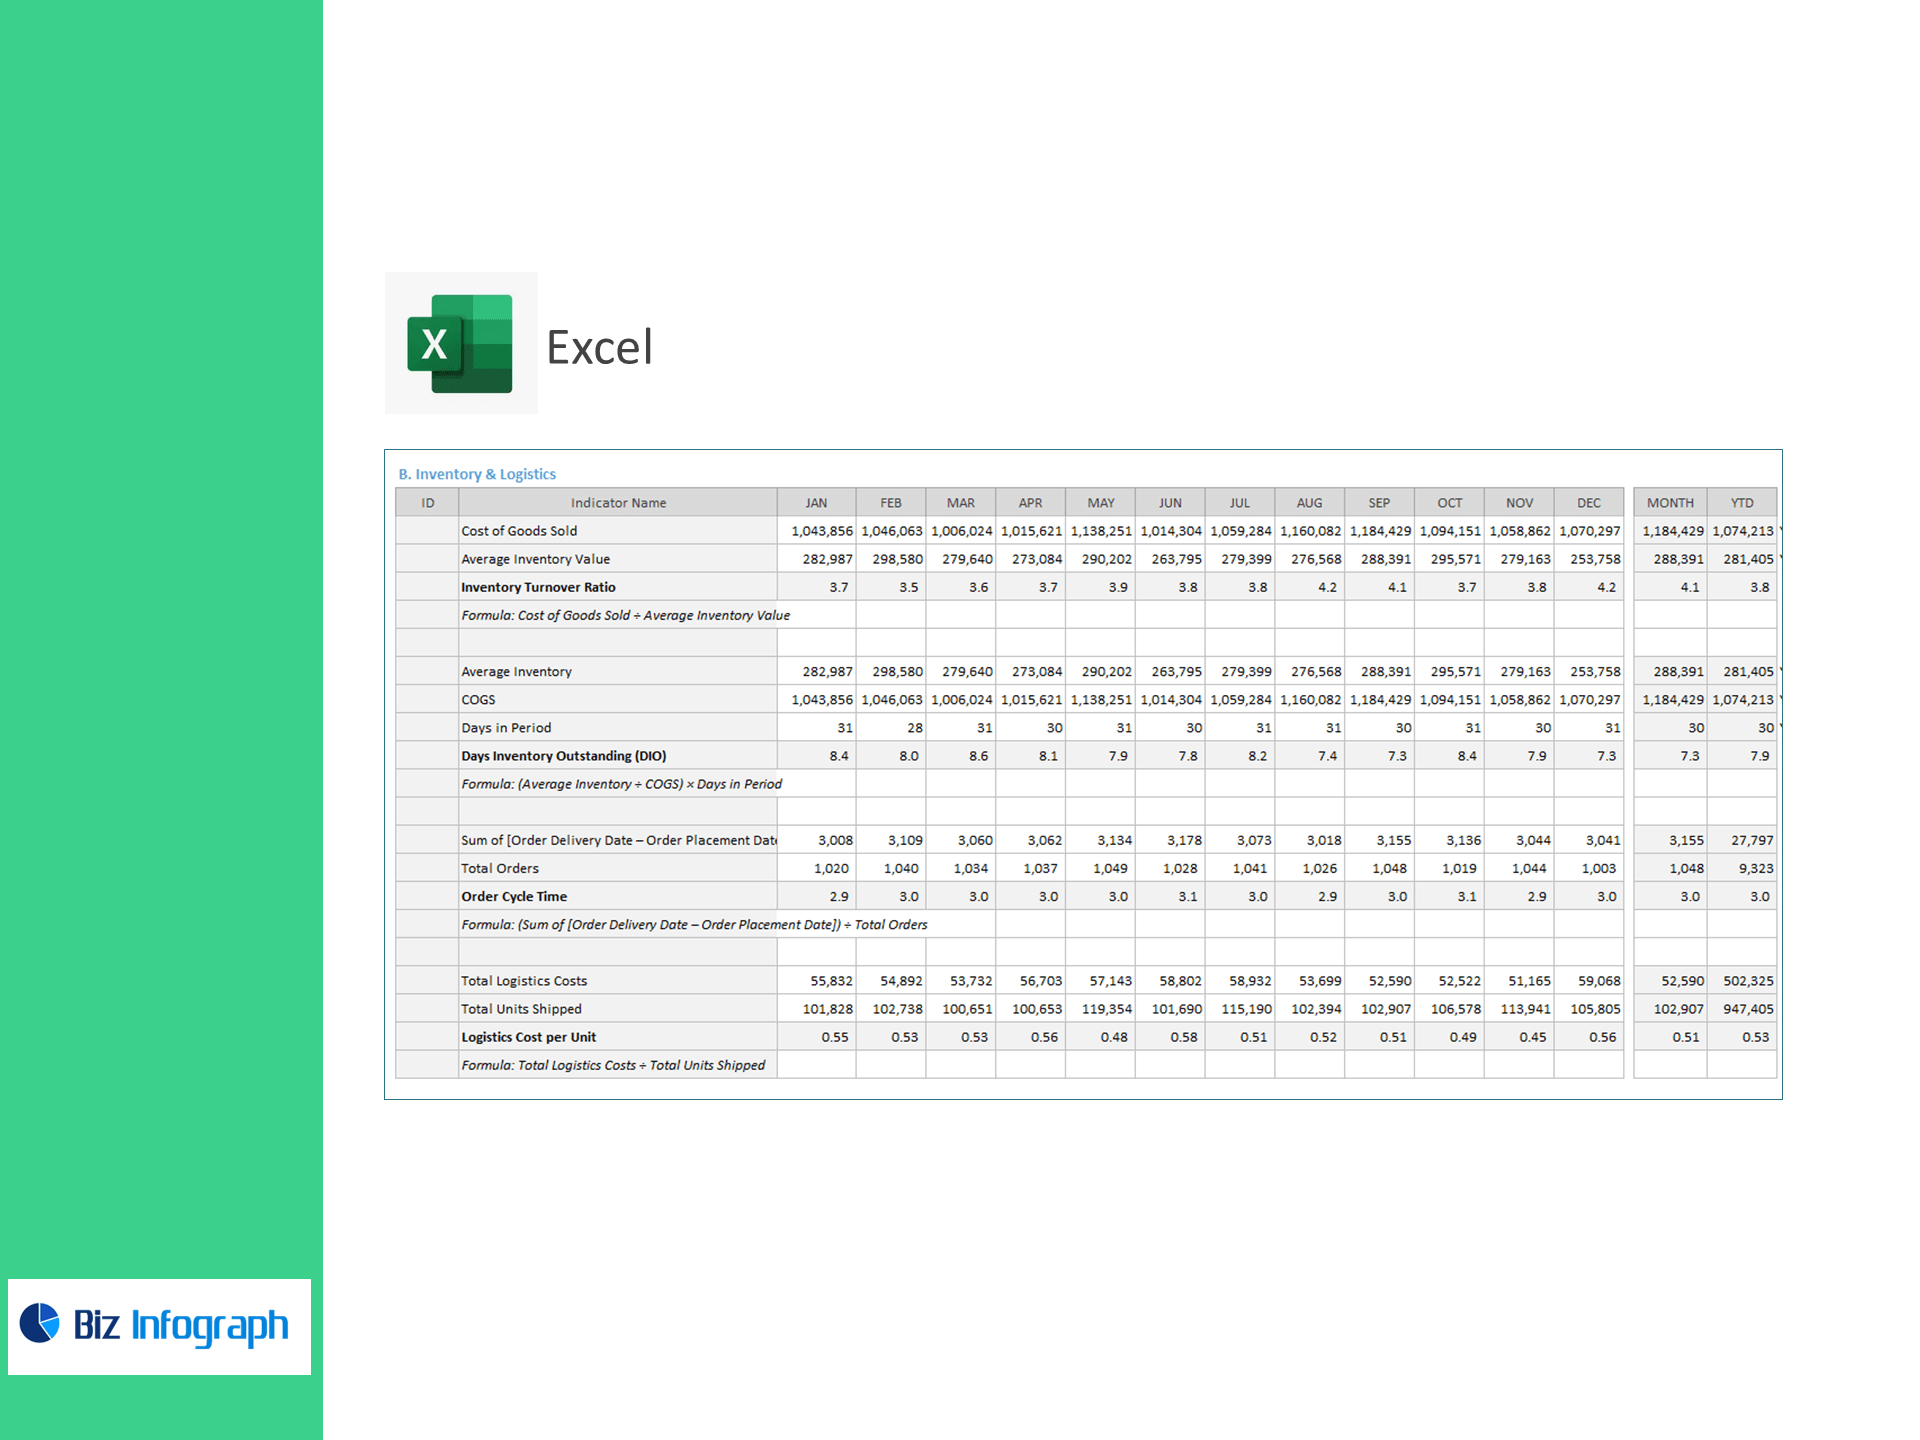
B) Inventory & Logistics
-
Inventory Turnover Ratio and DIO (Days Inventory Outstanding)
-
Order Cycle Time (order to delivery)
-
Logistics Cost per Unit
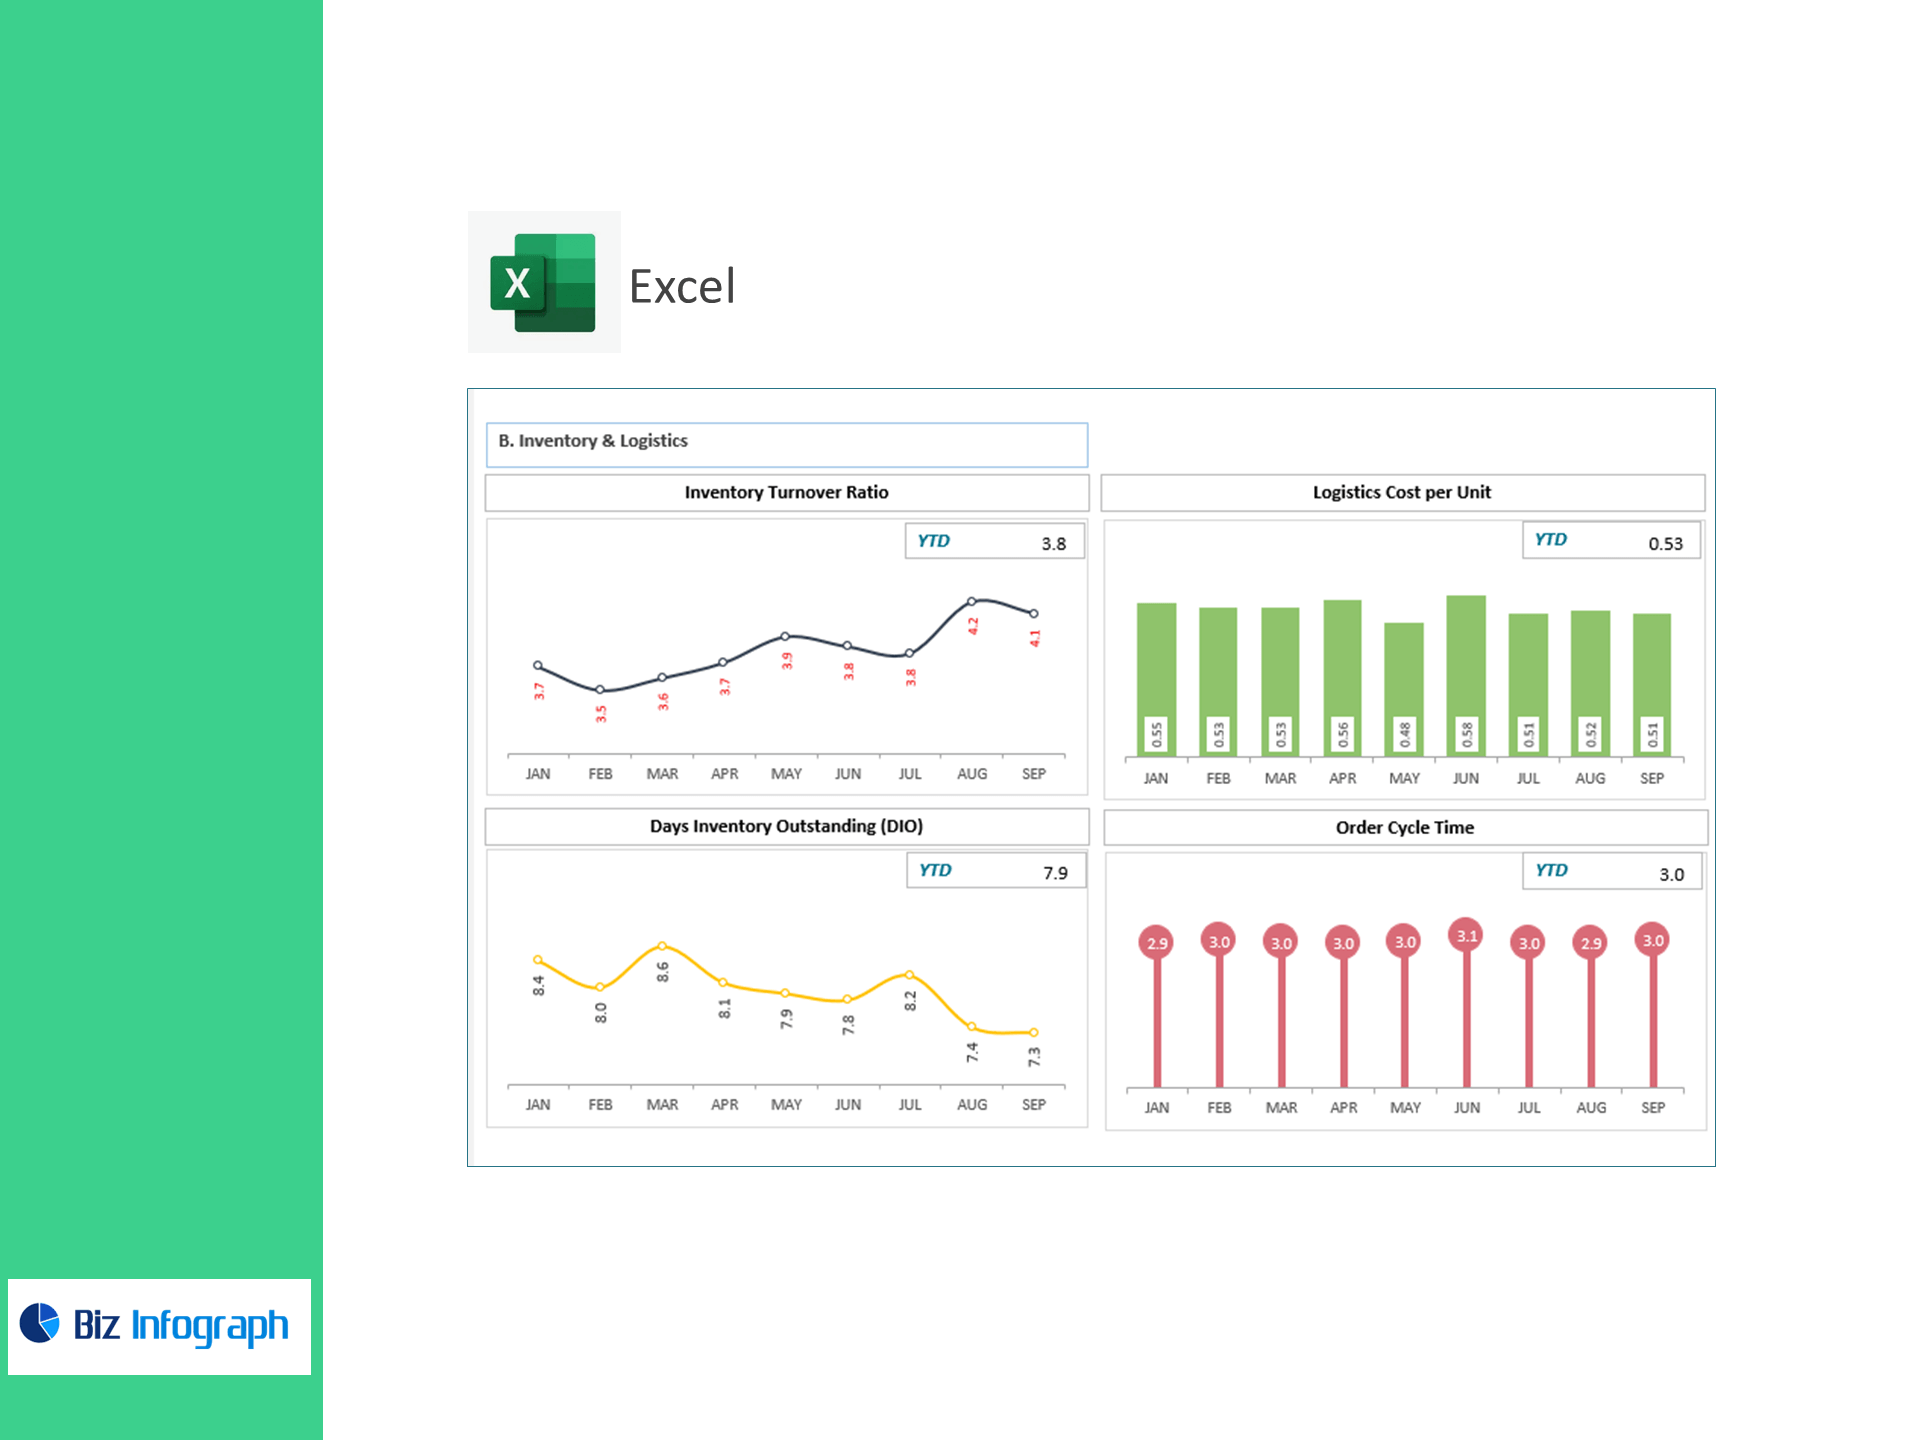
C) Quality & Waste Management
-
Defect Rate and Return Rate
-
Waste % (raw material wasted ÷ used)
-
Supplier On-Time Delivery Rate
Why operations teams love it
-
Find hidden losses fast: OEE + Yield pinpoint where throughput and quality leak.
-
Right-size stock: Turnover & DIO reveal slow movers and cash tied up on shelves.
-
Deliver on time, cheaper: Track cycle time and cost per unit across lanes and carriers.
-
Close the loop with suppliers: On-time rate and returns expose upstream issues.
What’s inside
-
Executive dashboard (KPIs, trends, variance vs target)
-
OEE & utilization analysis by line/shift
-
Inventory & DIO tracker with ABC and aging views
-
Order-to-delivery cycle time and lane benchmarking
-
Quality & scrap module with Pareto of defect sources
-
Supplier scorecard (on-time, returns, defect fallout)
-
Clean data map for easy CSV/XLSX paste (ERP/MES/WMS/TMS)
-
Works with Excel 365/2021 (Windows/Mac). No macros required.
For ready-to-use Dashboard Templates: