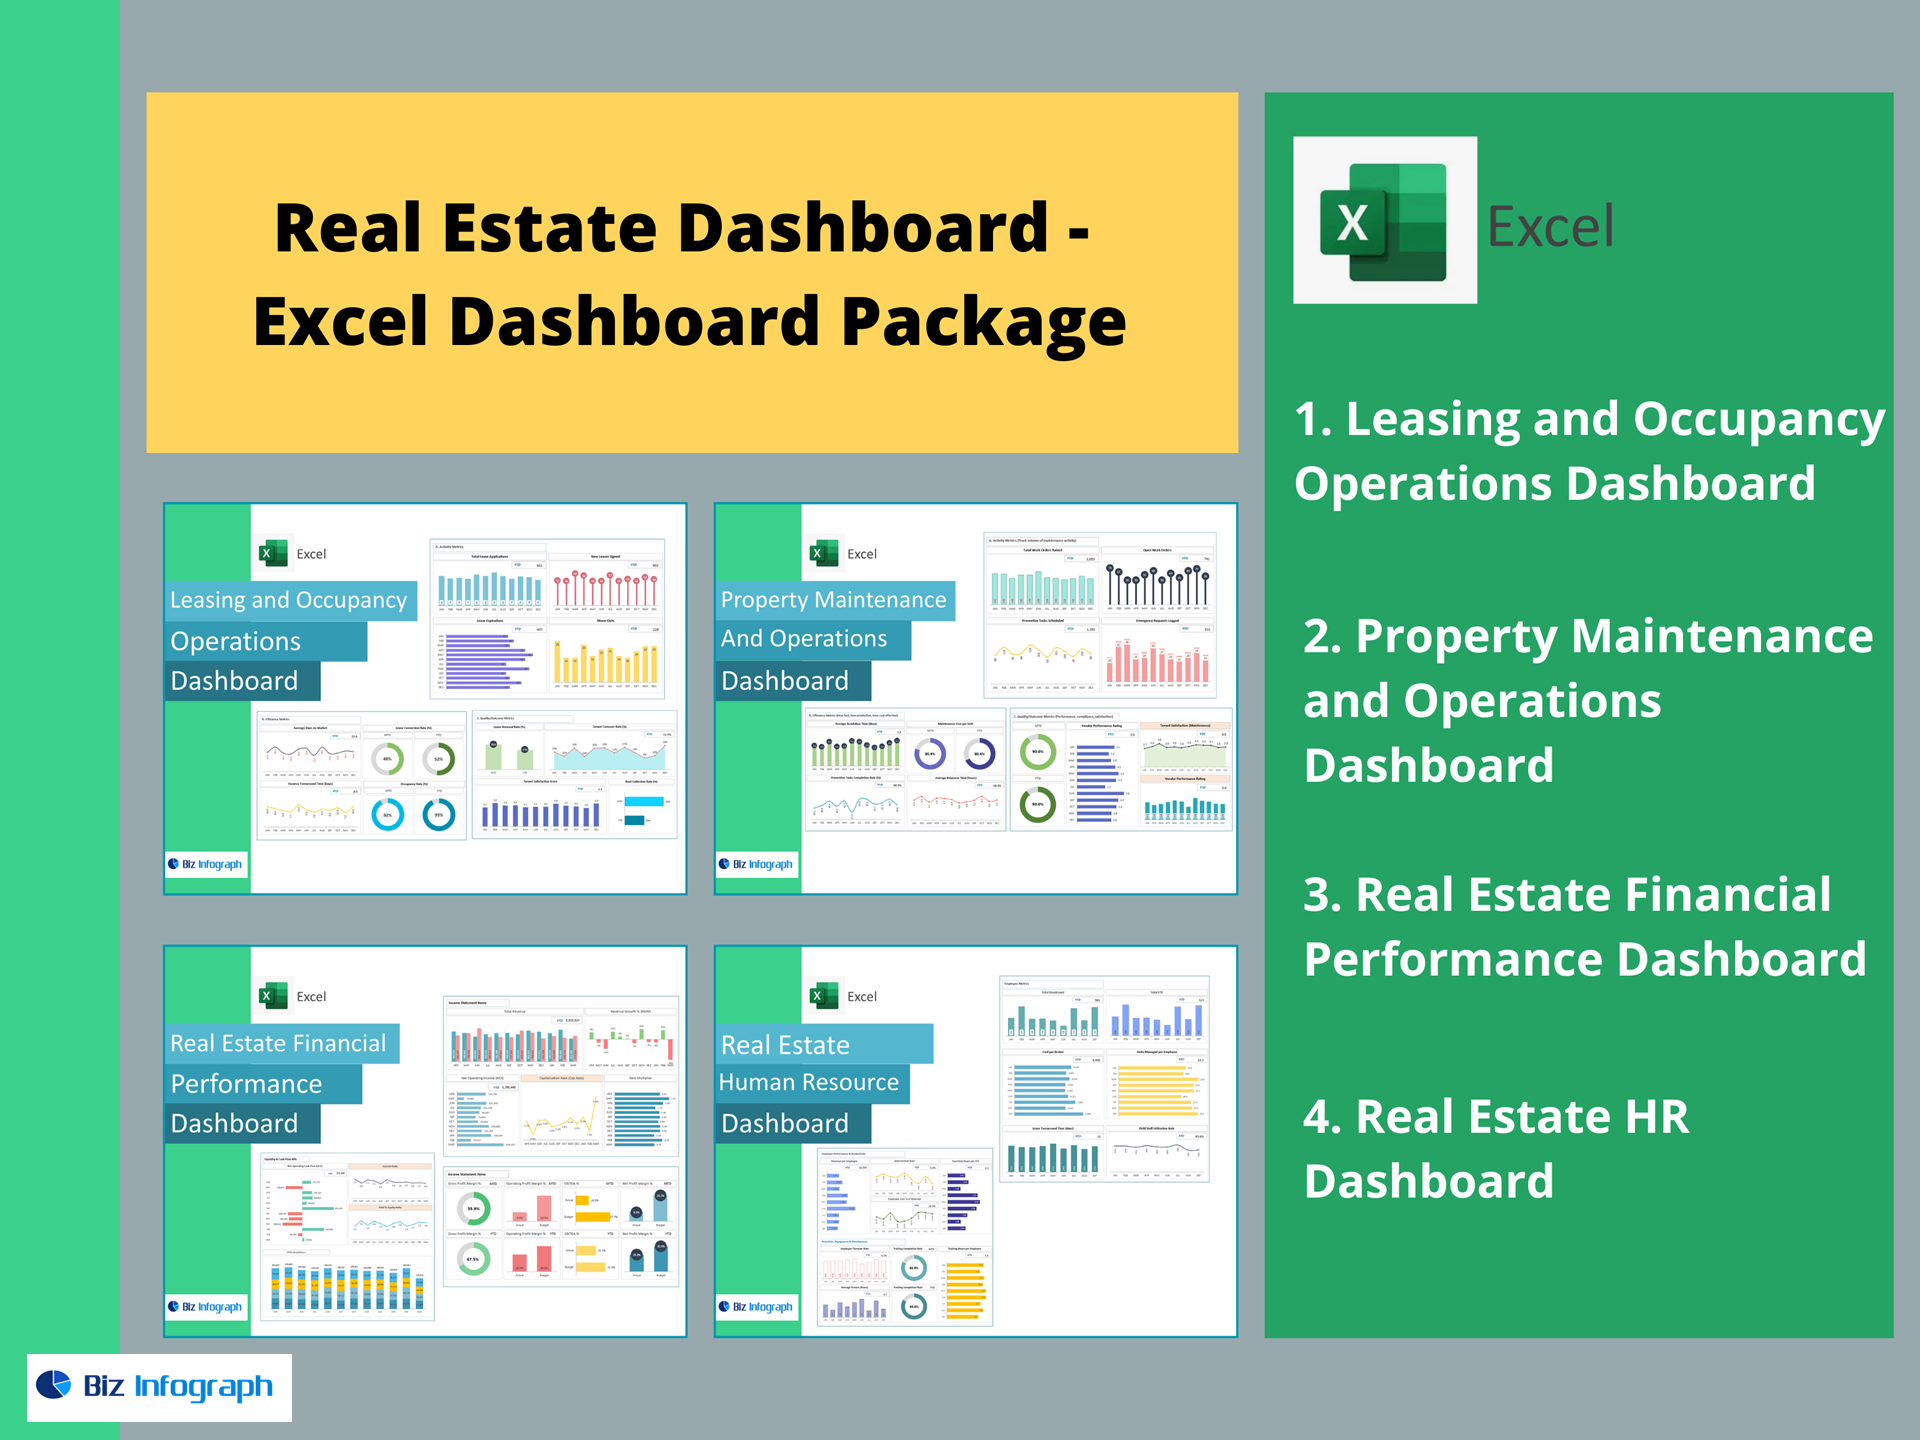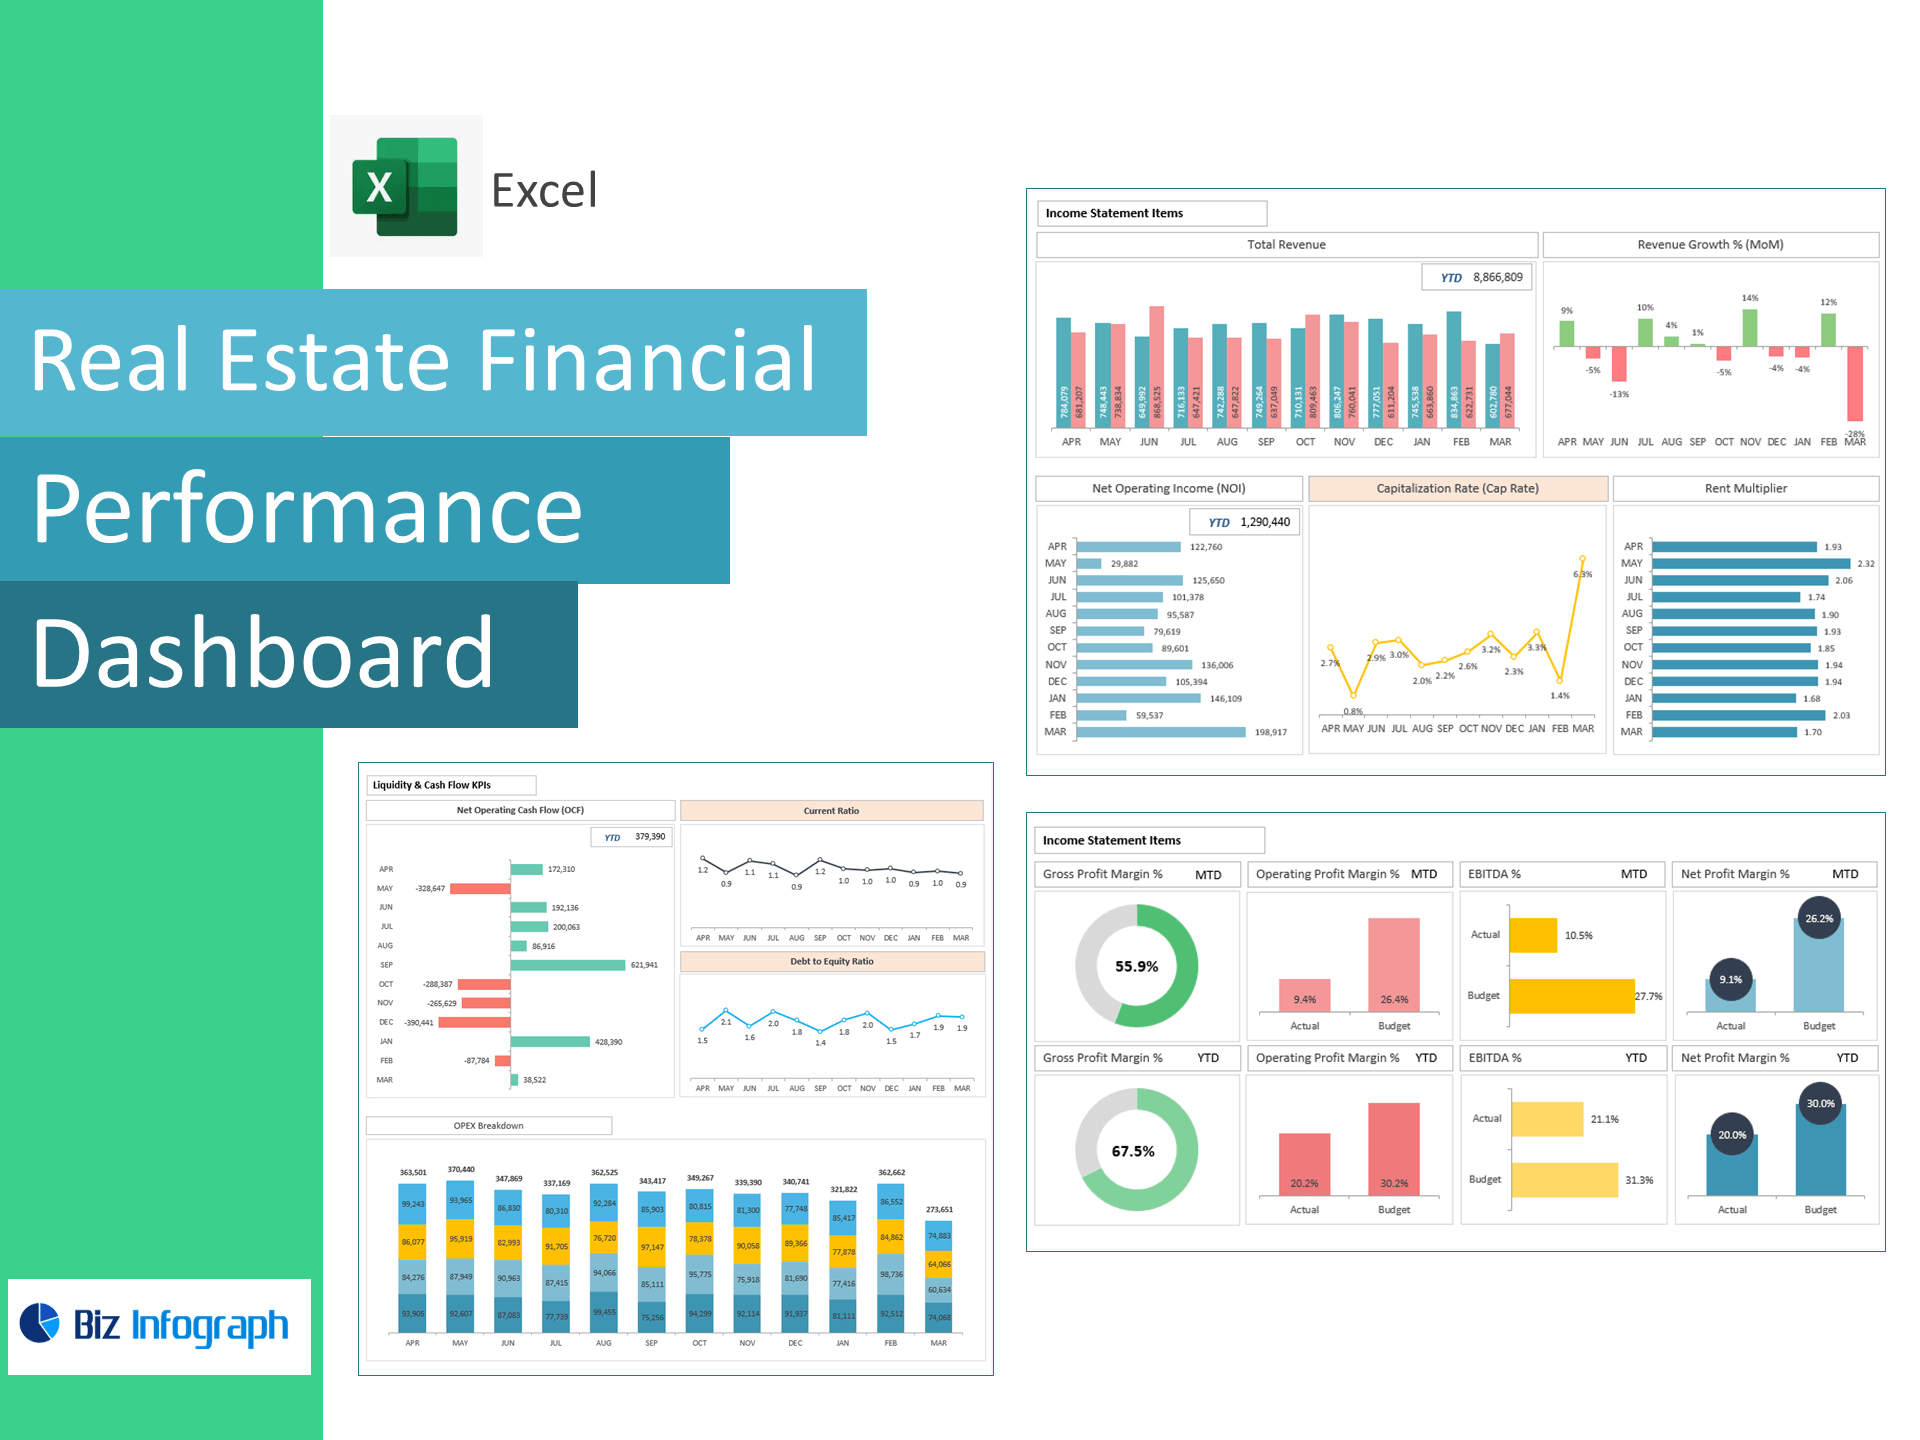
Real Estate Financial Performance Dashboard — Excel Template
Track NOI, margins, cash flow, and leverage—without a BI stack. Purpose-built for property owners, asset managers, and real estate FP&A, this Excel template converts monthly financials into a board-ready dashboard that highlights NOI, Cap Rate, EBITDA %, Current Ratio, Debt-to-Equity, and variance to target so you can protect cash and grow returns.
Why teams choose this template
-
All-in-one view: Income statement, cash flow, liquidity, and property-level KPIs in one workbook.
-
Investor-ready: Instantly compute NOI, Cap Rate, Rent Multiplier, and profitability margins.
-
Faster decisions: Spot rising OPEX, margin pressure, and leverage risks early.
KPIs included (ready-made formulas)
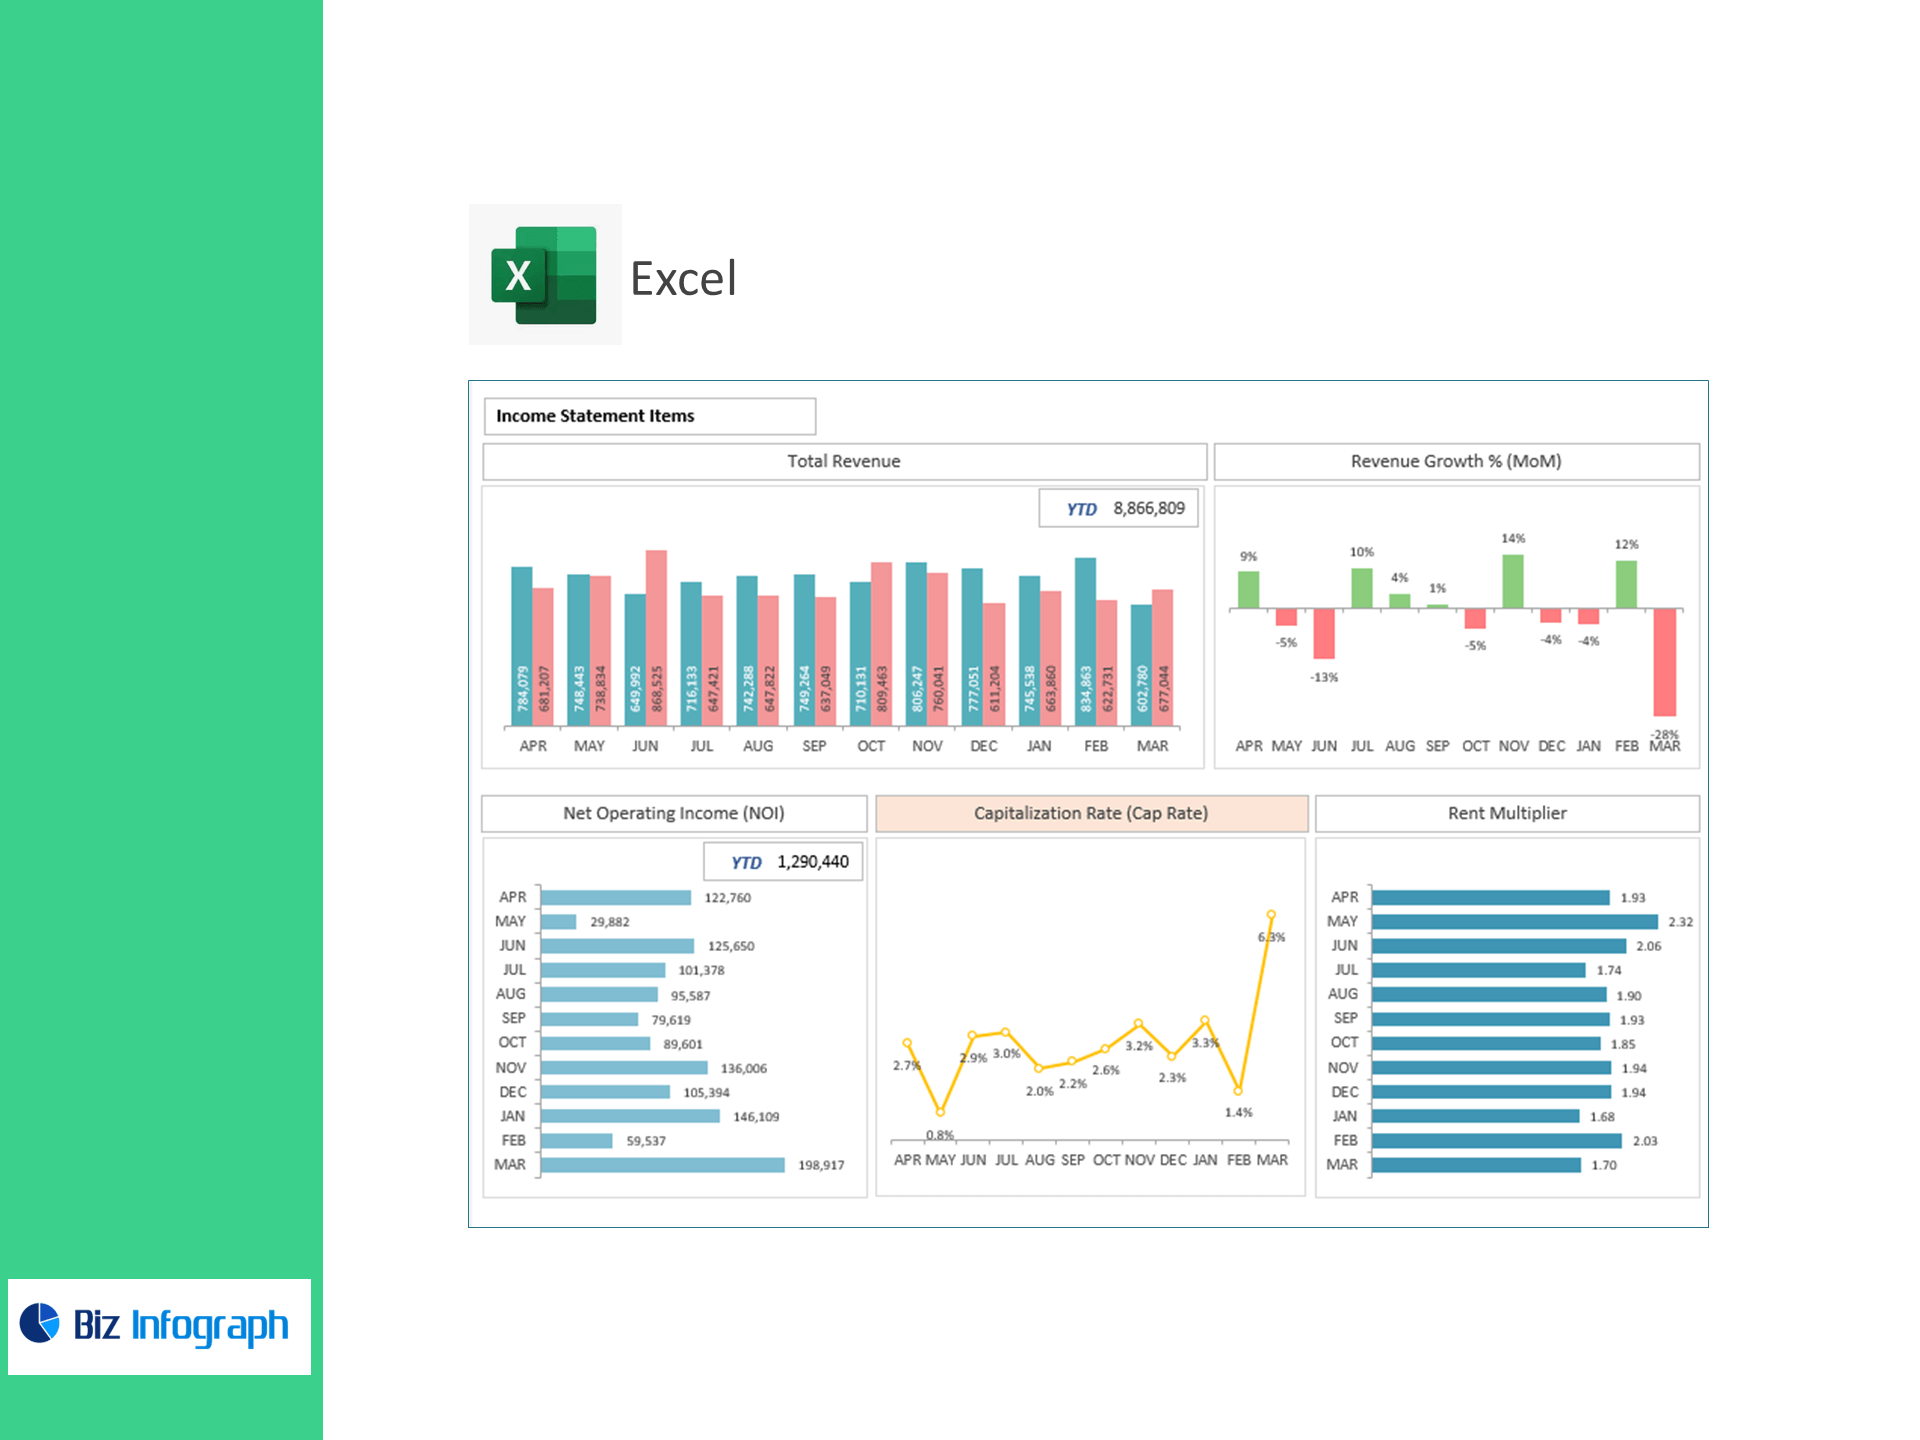
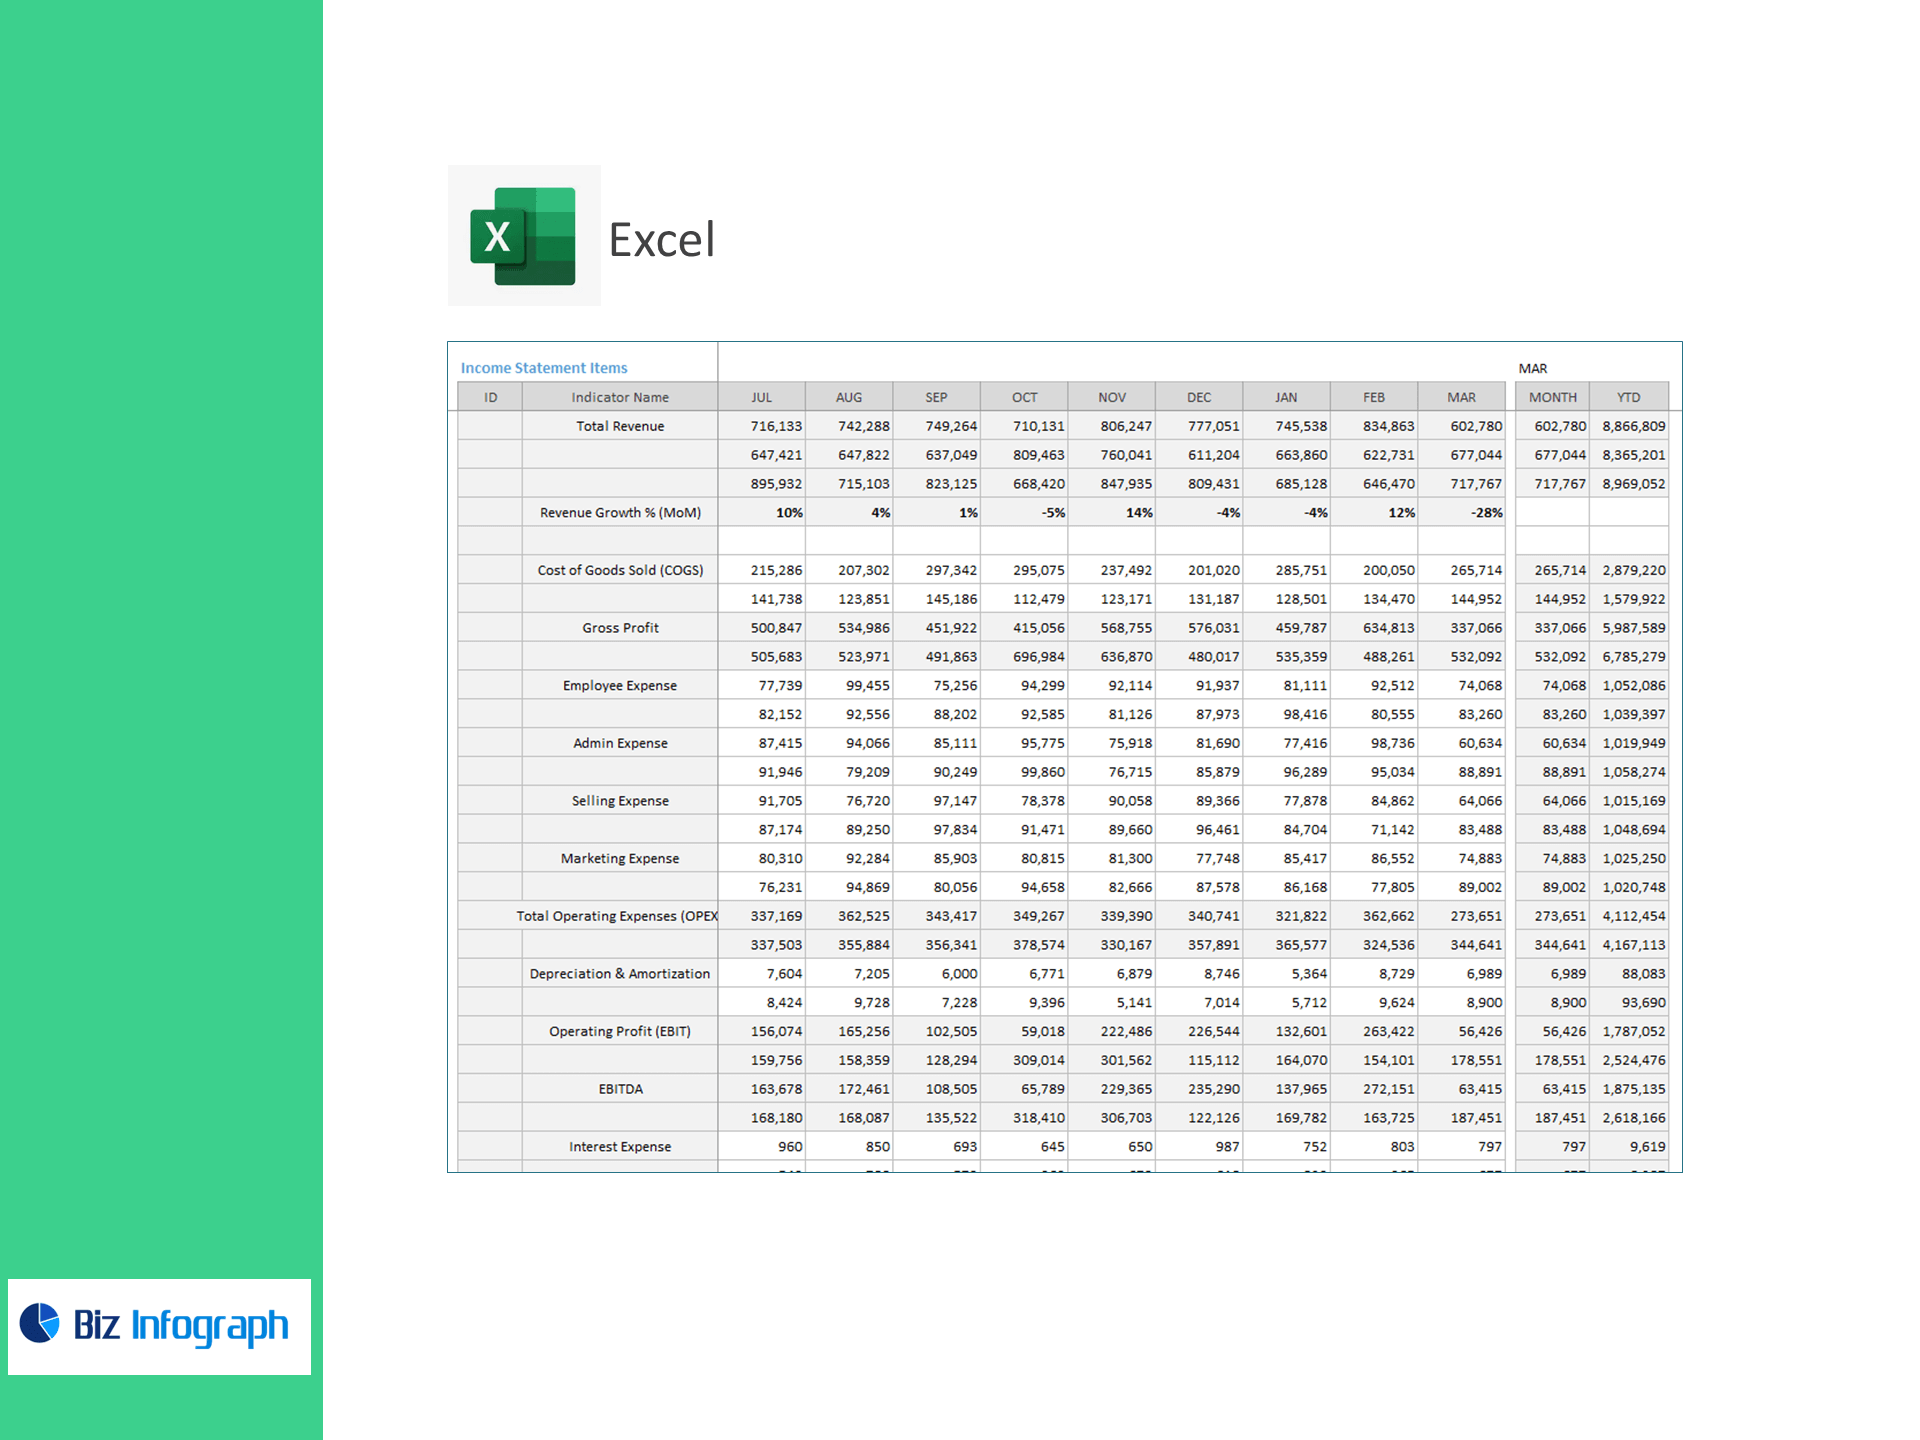
Income Statement
-
Total Revenue, Revenue Growth % (MoM)
-
COGS, Gross Profit
-
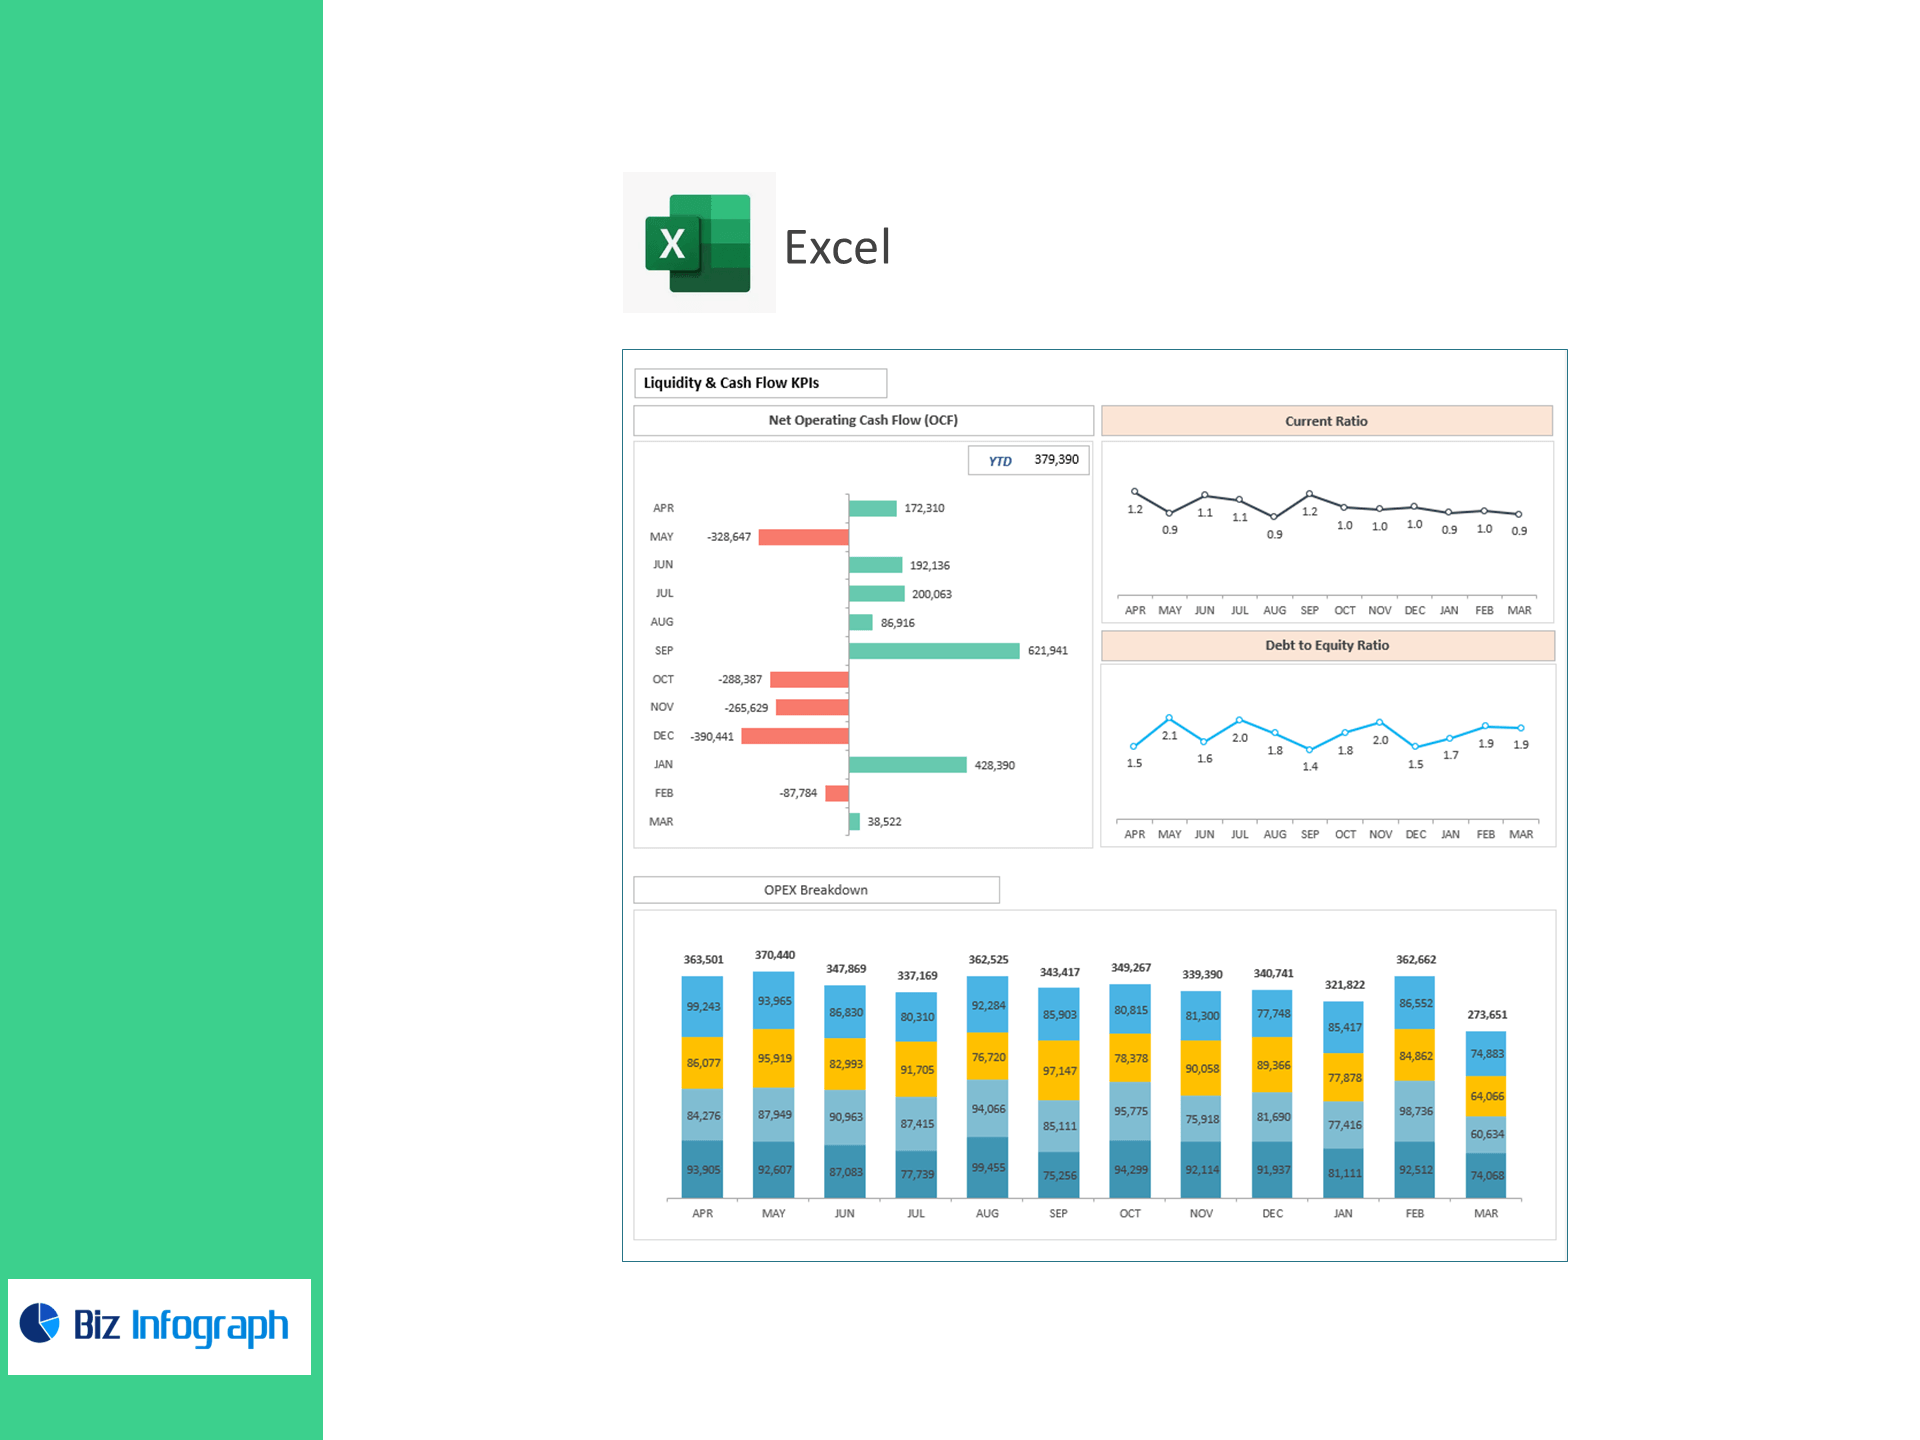
Employee, Admin, Selling, Marketing Expense; Total OPEX with OPEX Breakdown
-
Depreciation & Amortization
-
Operating Profit (EBIT), EBITDA, Interest, Other Inc/(Exp), Taxes, Net Profit
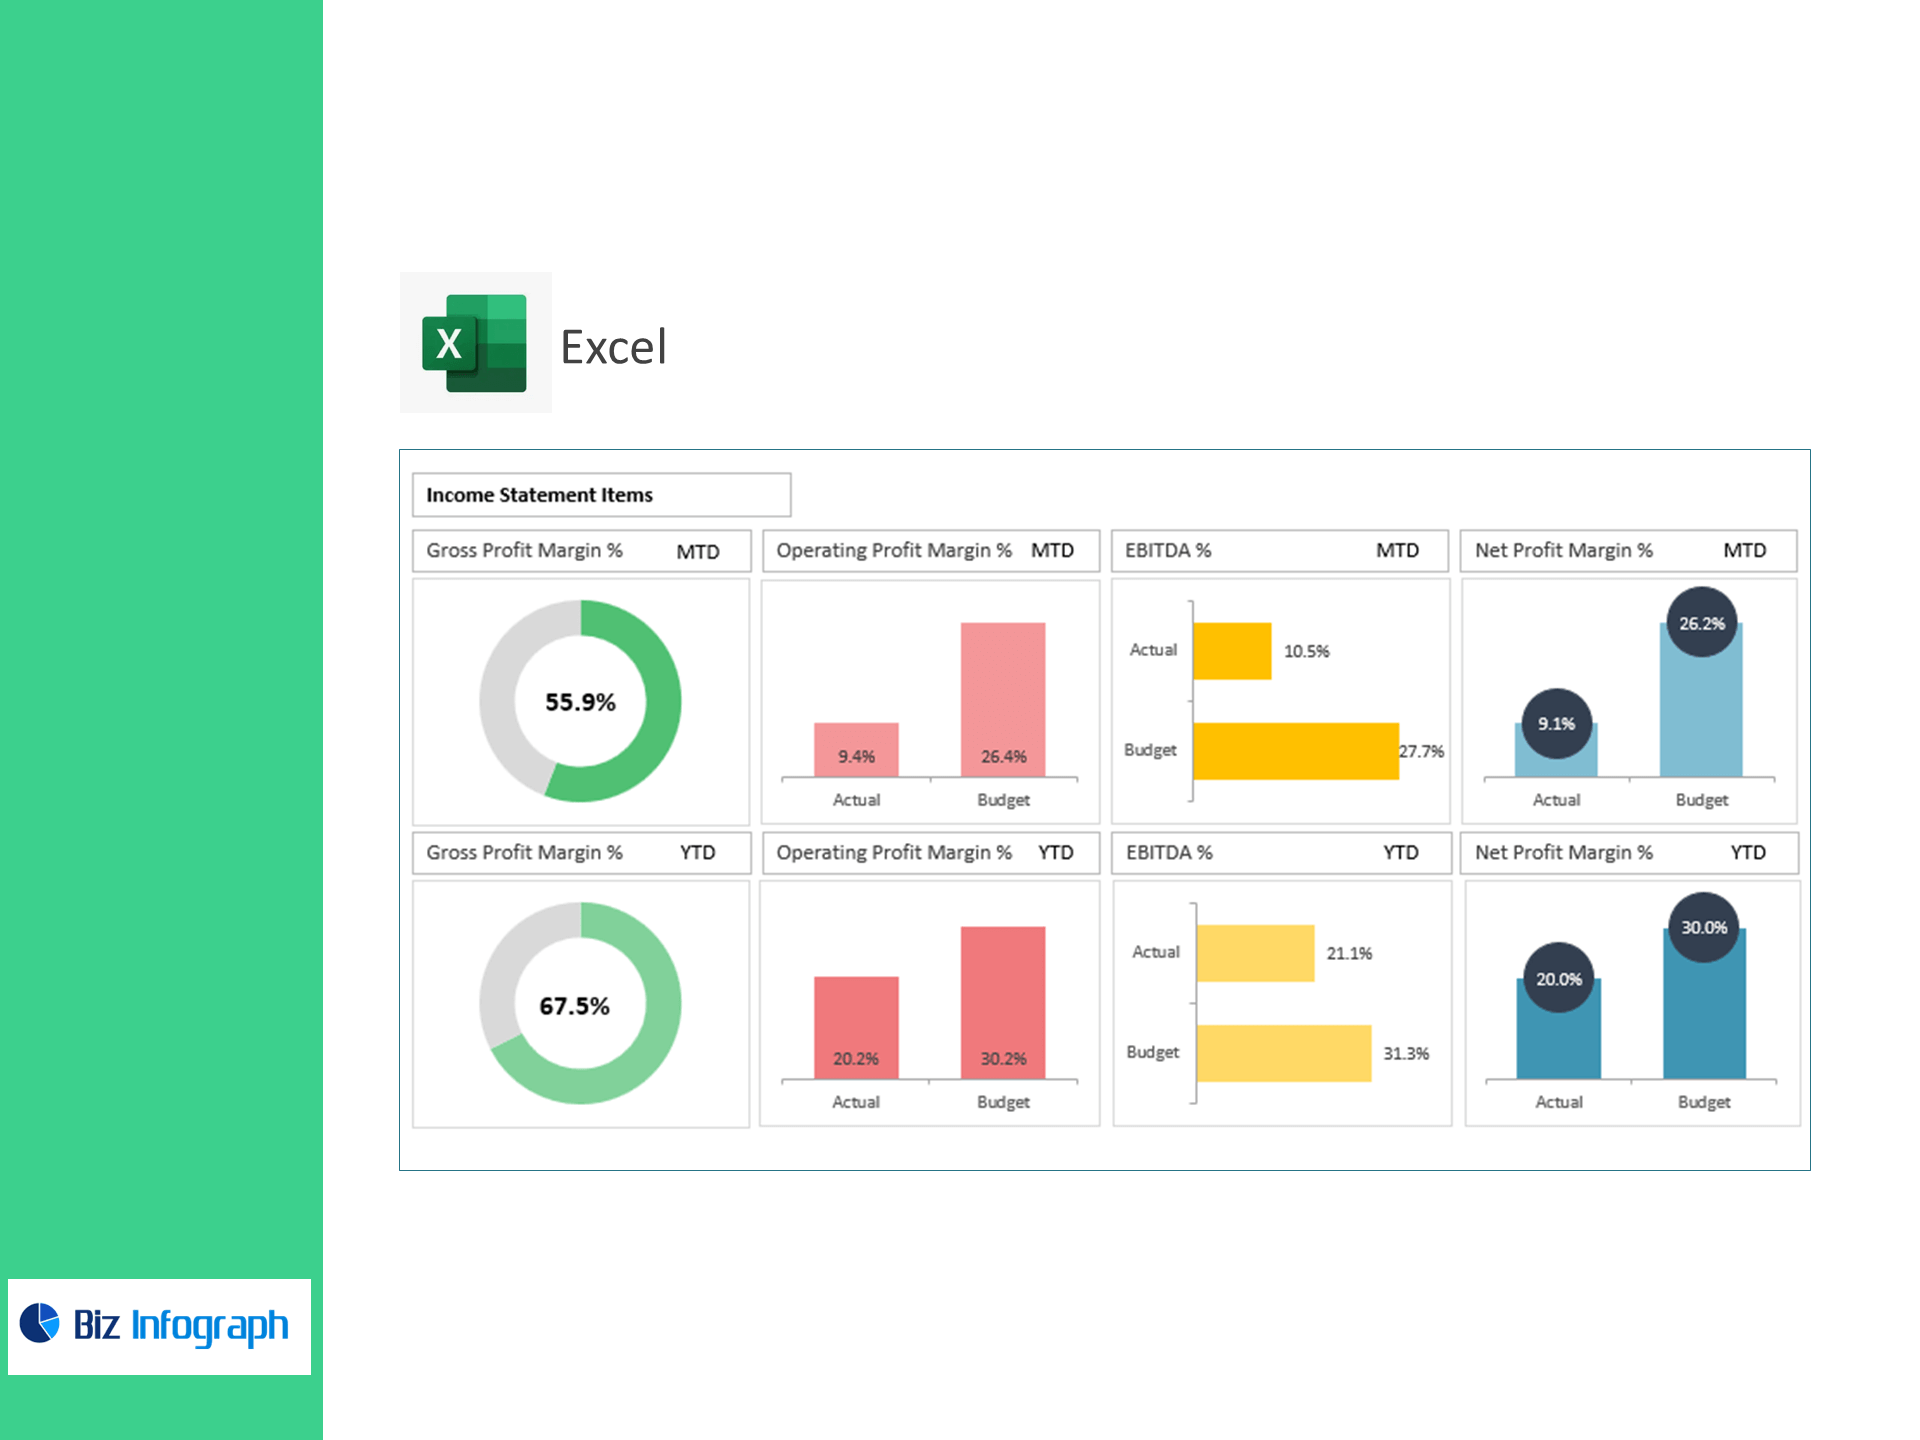
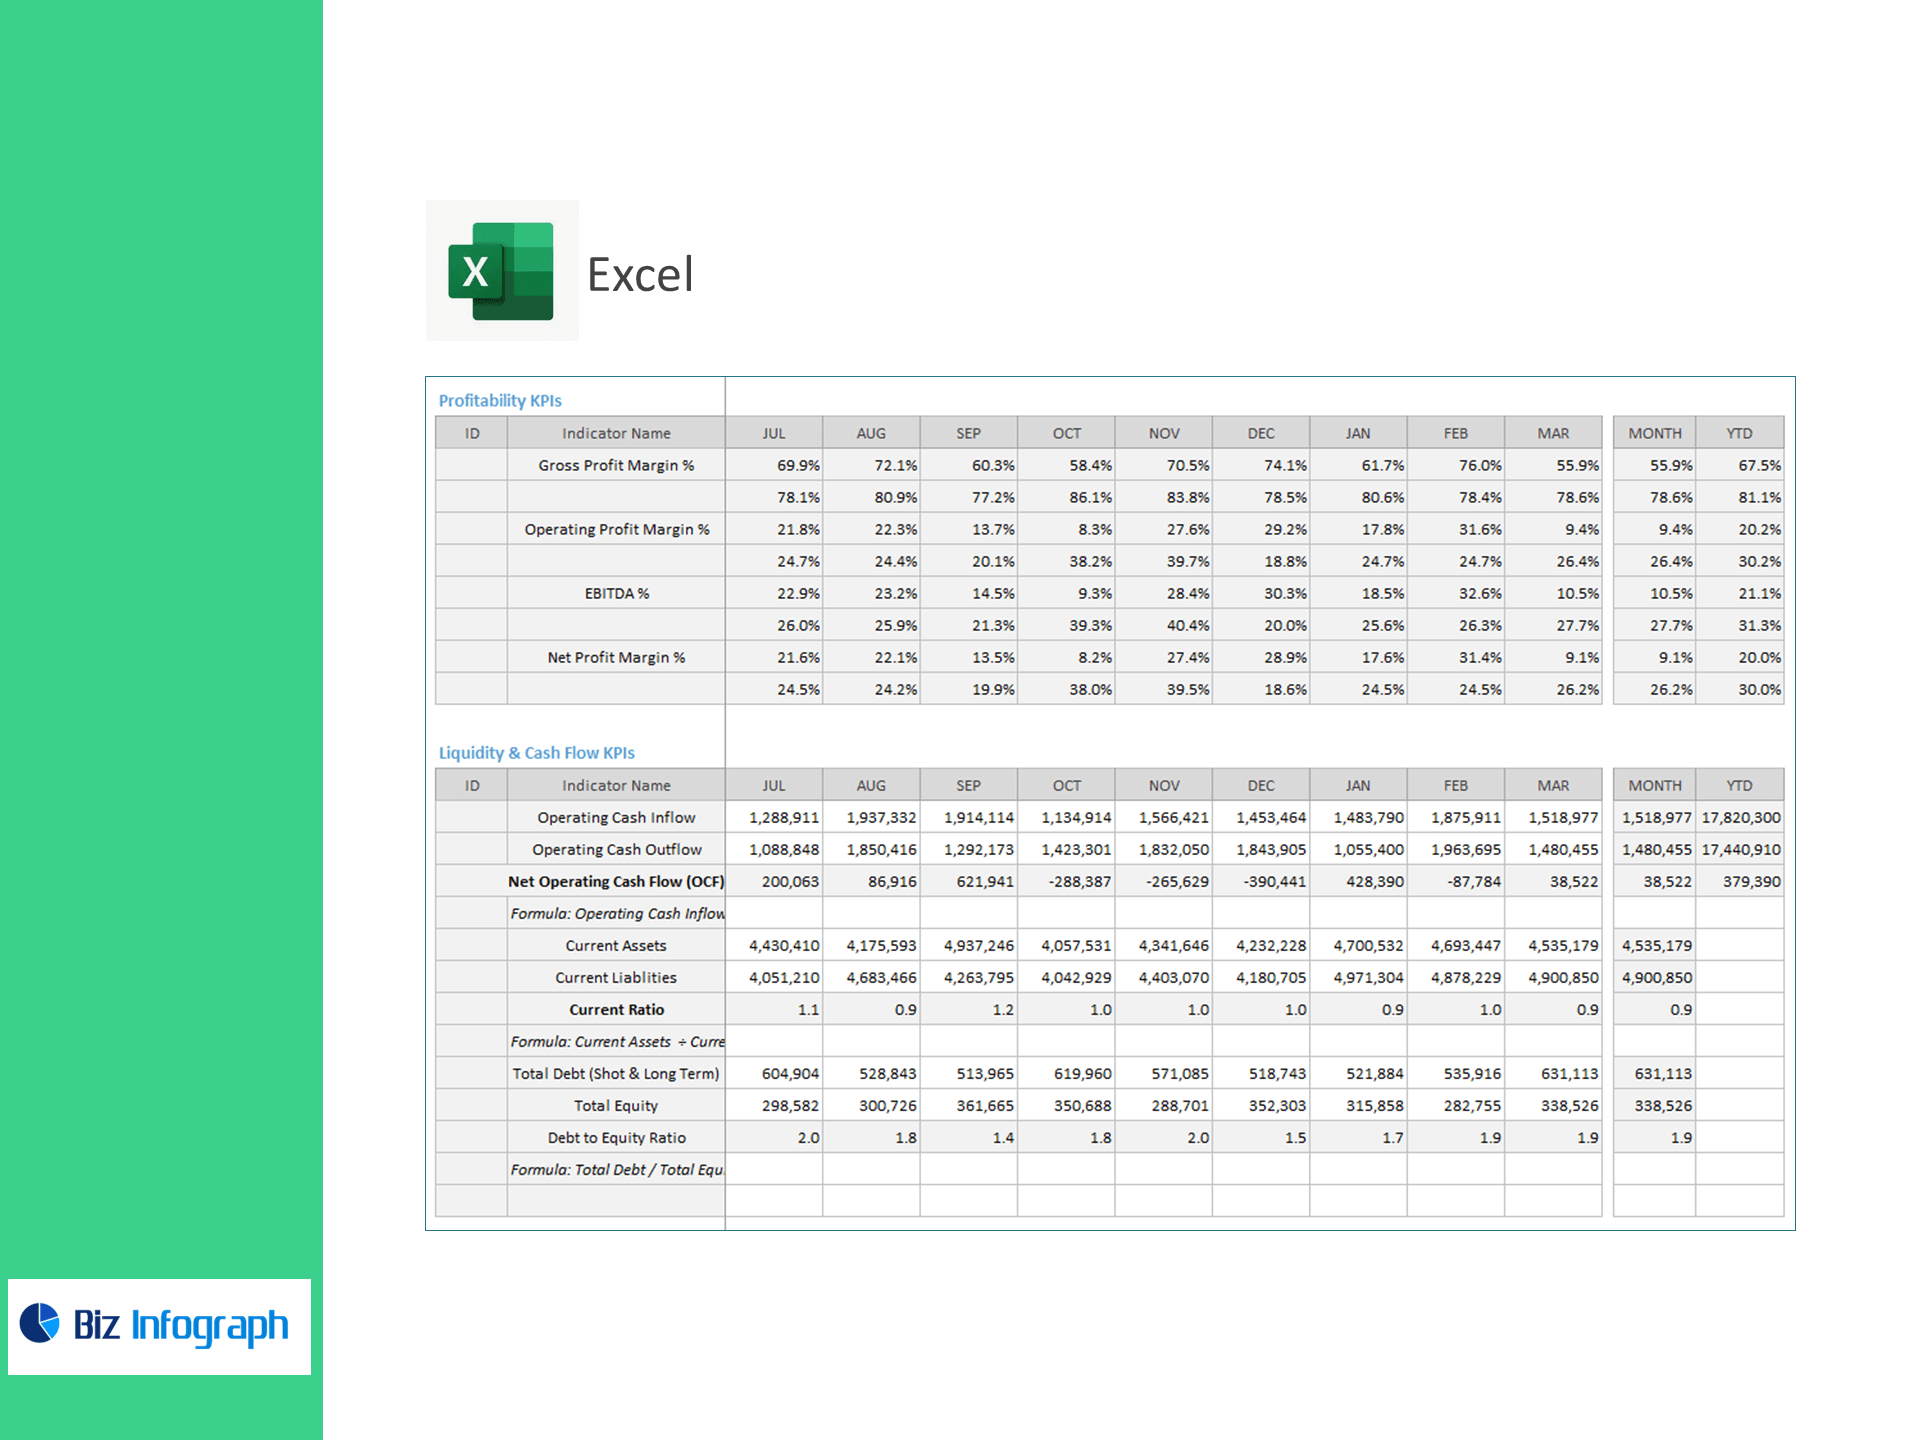
Profitability
-
Gross Profit Margin %
-
Operating Profit Margin % (EBIT Margin)
-
EBITDA %
-
Net Profit Margin %
Liquidity & Cash Flow
-
Operating Cash Inflow/Outflow; Net Operating Cash Flow (OCF) = Inflow − Outflow
-
Current Assets, Current Liabilities; Current Ratio = Current Assets ÷ Current Liabilities
-
Total Debt (Short & Long), Total Equity; Debt-to-Equity = Debt ÷ Equity
Operational (Real Estate)
-
Rental Income
-
Net Operating Income (NOI) = Rental Income − Operating Expenses
-
Property Value
-
Capitalization Rate (Cap Rate) = (NOI ÷ Property Value) × 100
-
Average Annual Rent Revenue, Property Price, Rent Multiplier = Property Price ÷ Avg. Annual Rent
What’s inside
-
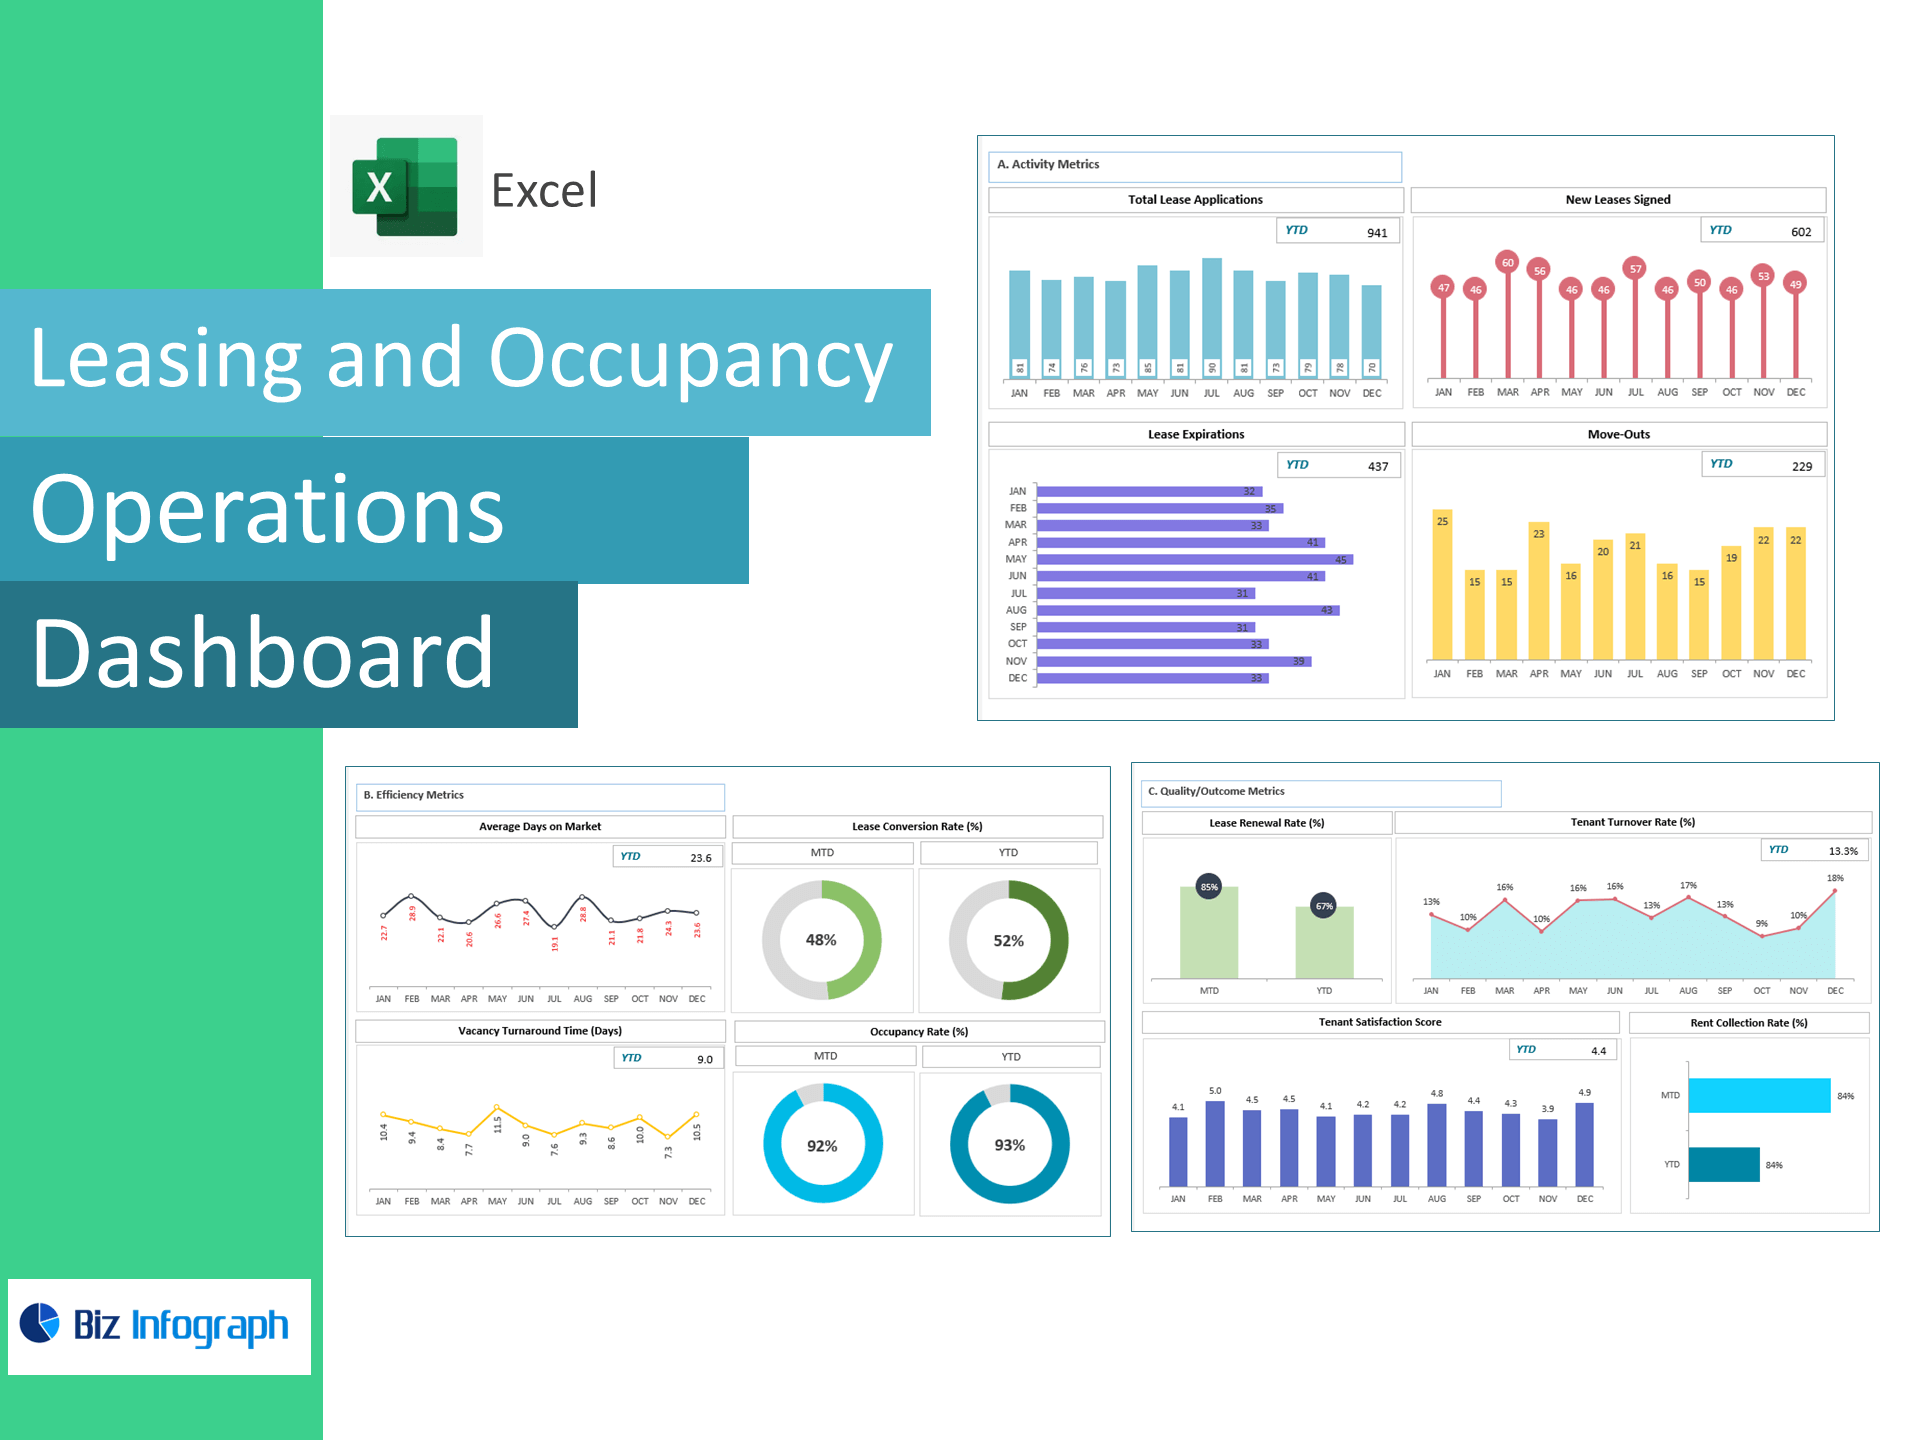
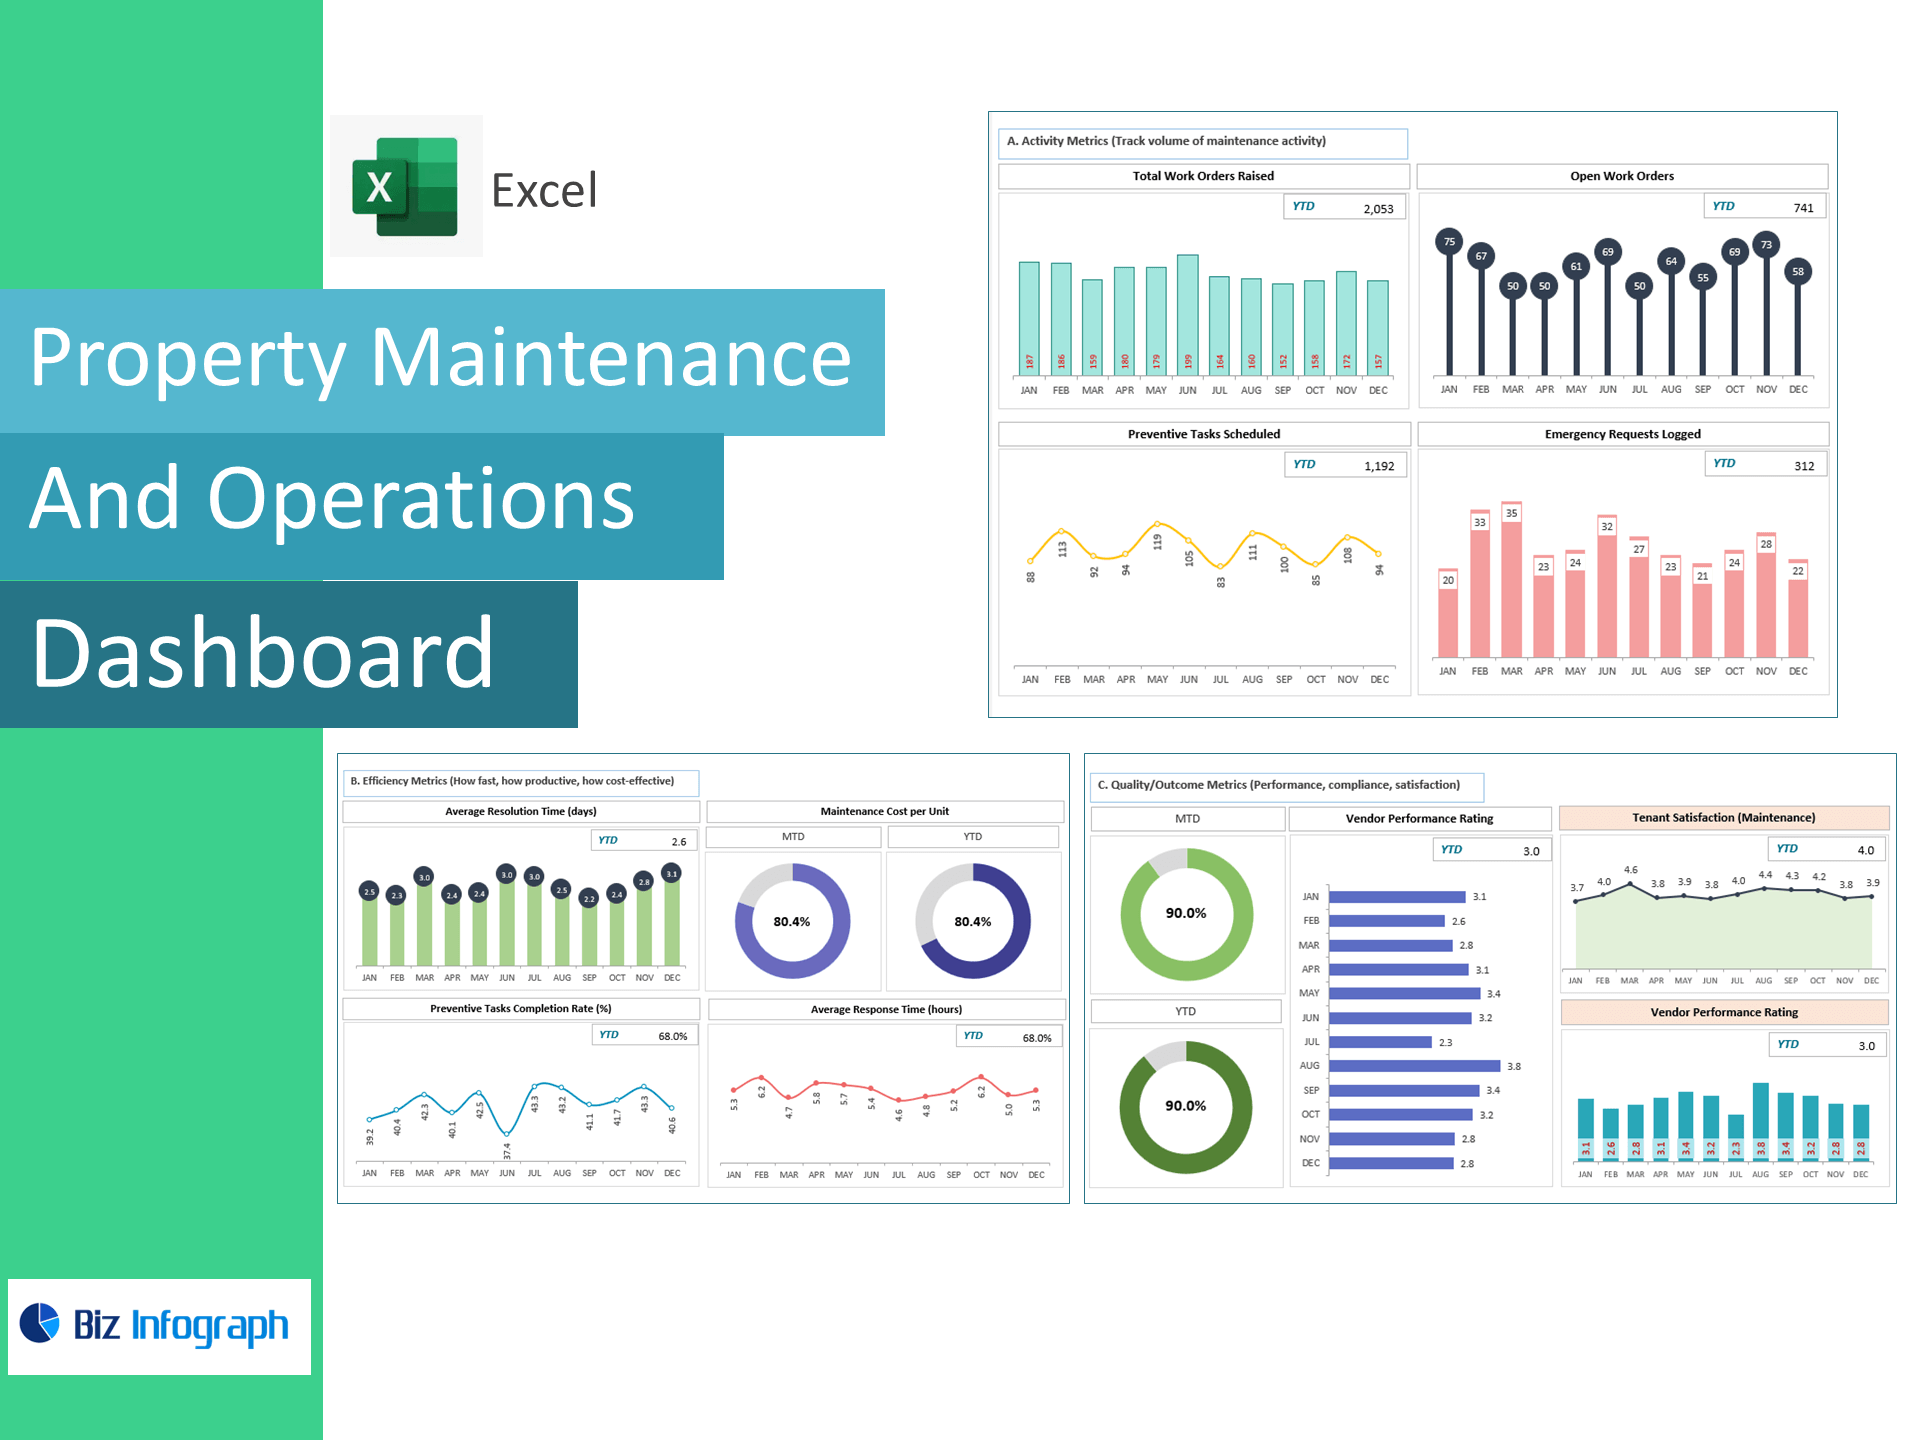
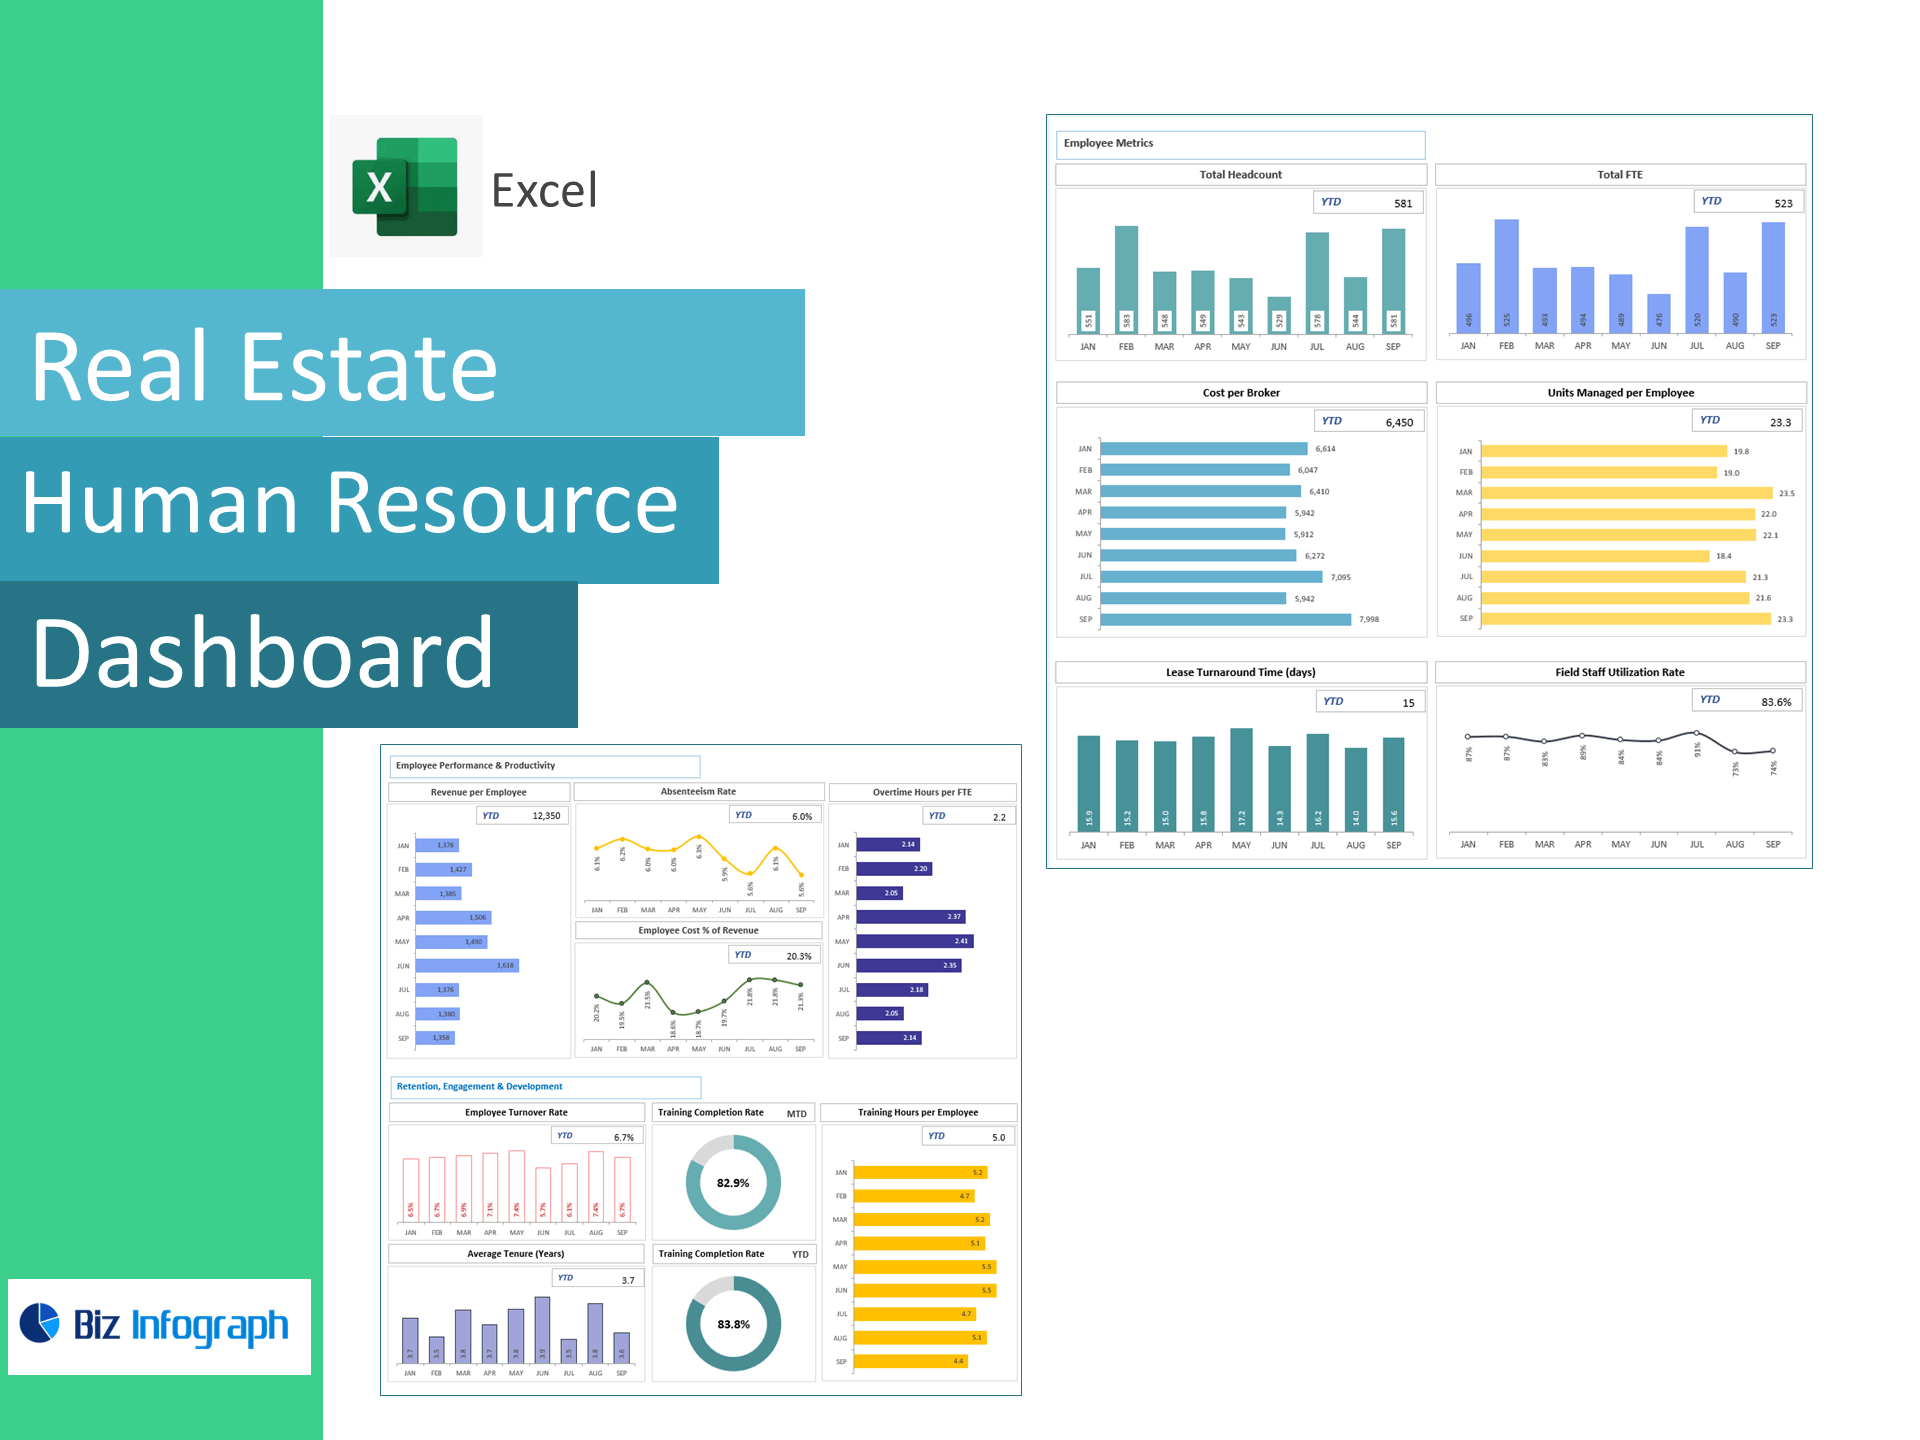
Executive Dashboard: Tiles for Revenue Growth, GP/EBIT/EBITDA/Net Profit, OCF, Current Ratio, D/E, NOI, Cap Rate, and Rent Multiplier with trend & target variance.
-
OPEX Analyzer: Drill into payroll, admin, selling, and marketing to control costs.
-
Cash & Leverage Panel: View cash generation, coverage, and balance-sheet health.
-
Property KPIs: Compare NOI and Cap Rate across properties or portfolios.
-
Assumptions & Targets: Enter KPI targets; automatic Above/Below Target highlighting.
-
Clean Data Tables: Import-ready sheets for IS, Cash Flow, Balance Sheet, and Property metrics.
How it works
-
Paste your monthly actuals (or CSV exports) into the provided tables.
-
Set portfolio targets and property values.
-
Review visuals to optimize OPEX, pricing, and leverage.
Benefits
-
Protect margins & cash: Monitor EBITDA %, OCF, and OPEX creep.
-
Strengthen balance sheet: Track liquidity and leverage with Current Ratio and D/E.
-
Maximize asset returns: Compare NOI and Cap Rate across properties to reallocate capital.
-
Present with confidence: Investor-ready visuals in minutes.
For ready-to-use Dashboard Templates: