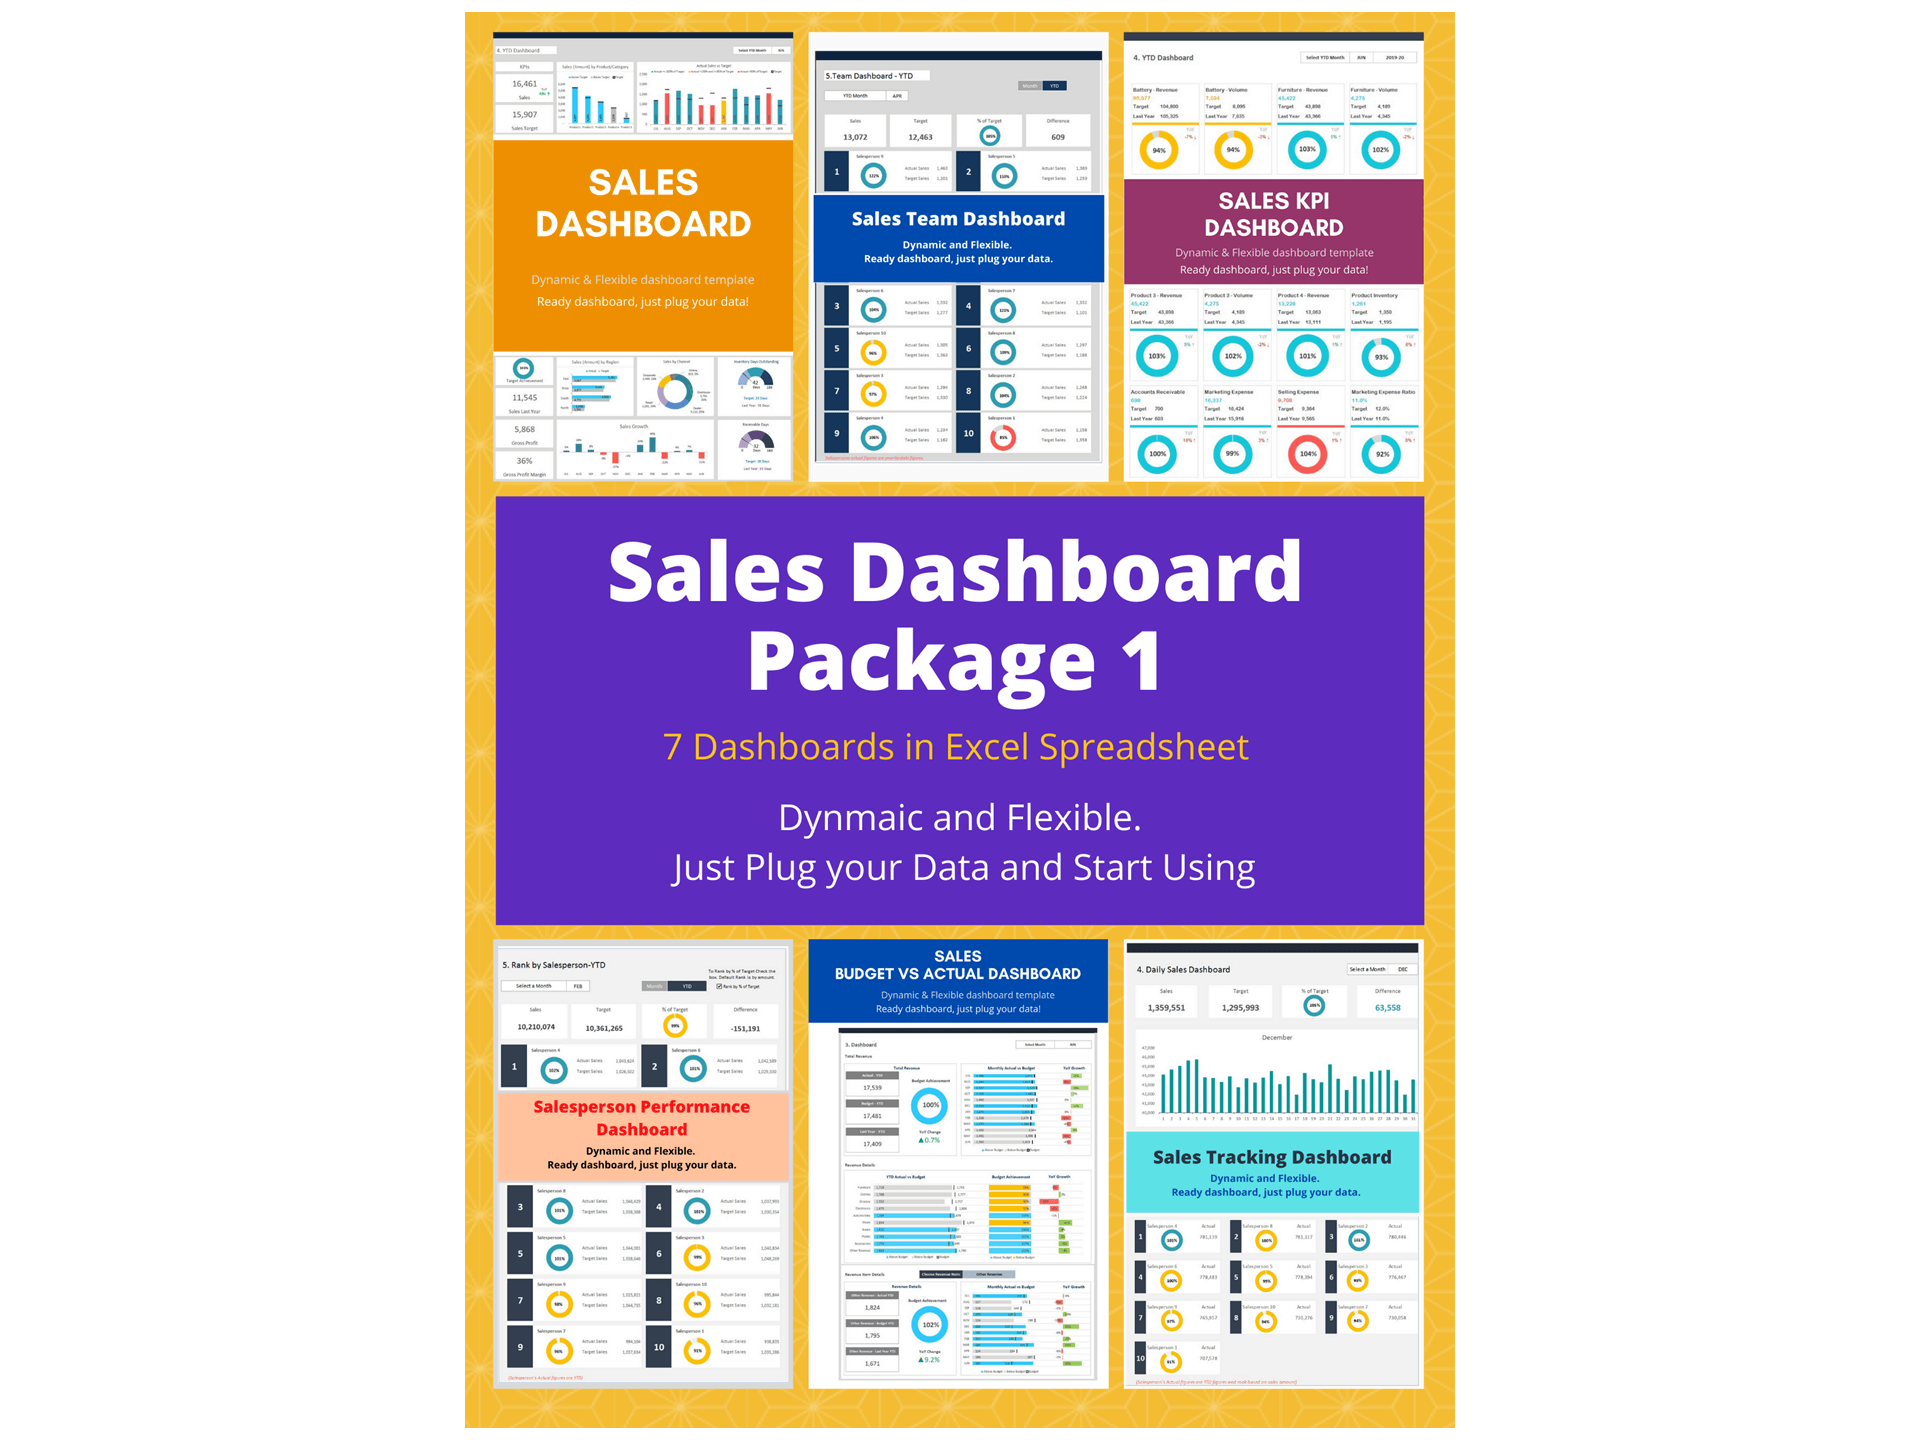
Sales Tracking Dashboard Excel Template and Google Sheets
The Sales Tracking Dashboard Excel Template is a powerful Dashboard in Excel designed to help businesses monitor and analyze their sales activities in a clear and organized way. This Sales Tracking Dashboard enables managers to follow sales progress, track revenue trends, and evaluate performance across products, regions, or sales teams.
As a comprehensive Sales Dashboard, the template brings together key sales data in one place, allowing users to easily review important metrics and performance indicators. It highlights critical Sales KPI measures such as total sales, target achievement, conversion rates, and monthly growth, helping businesses understand how effectively their sales strategies are performing.
Built as a Dynamic Dashboard, the template automatically updates charts and summaries when new sales data is entered. This feature ensures accurate and up-to-date reporting, making it easier for managers to identify sales opportunities and address performance gaps quickly.
Serving as a practical Business Dashboard, the template supports data-driven decision-making by providing valuable insights into Sales Performance. Overall, the Sales Tracking Dashboard Excel Template helps organizations improve sales monitoring, enhance forecasting accuracy, and develop stronger strategies to drive revenue growth and business success.
Streamline Sales Tracking with our Excel Sales Tracking Dashboard
In the dynamic world of business, keeping a close eye on sales performance is paramount. Successful businesses rely on accurate data analysis to make informed decisions and stay ahead of the competition. This is where our Sales Tracking Dashboard Excel template comes into play. This comprehensive tool is designed to help you efficiently monitor and analyze your sales data, enabling you to optimize your sales strategies and achieve your goals.
Understanding the Significance of Sales Tracking
Before we delve into the details of our Sales Tracking Dashboard, let's first grasp the importance of effective sales tracking. For any organization, sales are the lifeblood that keeps the business running. By tracking sales data, you gain valuable insights that can guide your decisions, increase revenue, and improve overall performance.
Here are some key reasons why sales tracking is crucial:
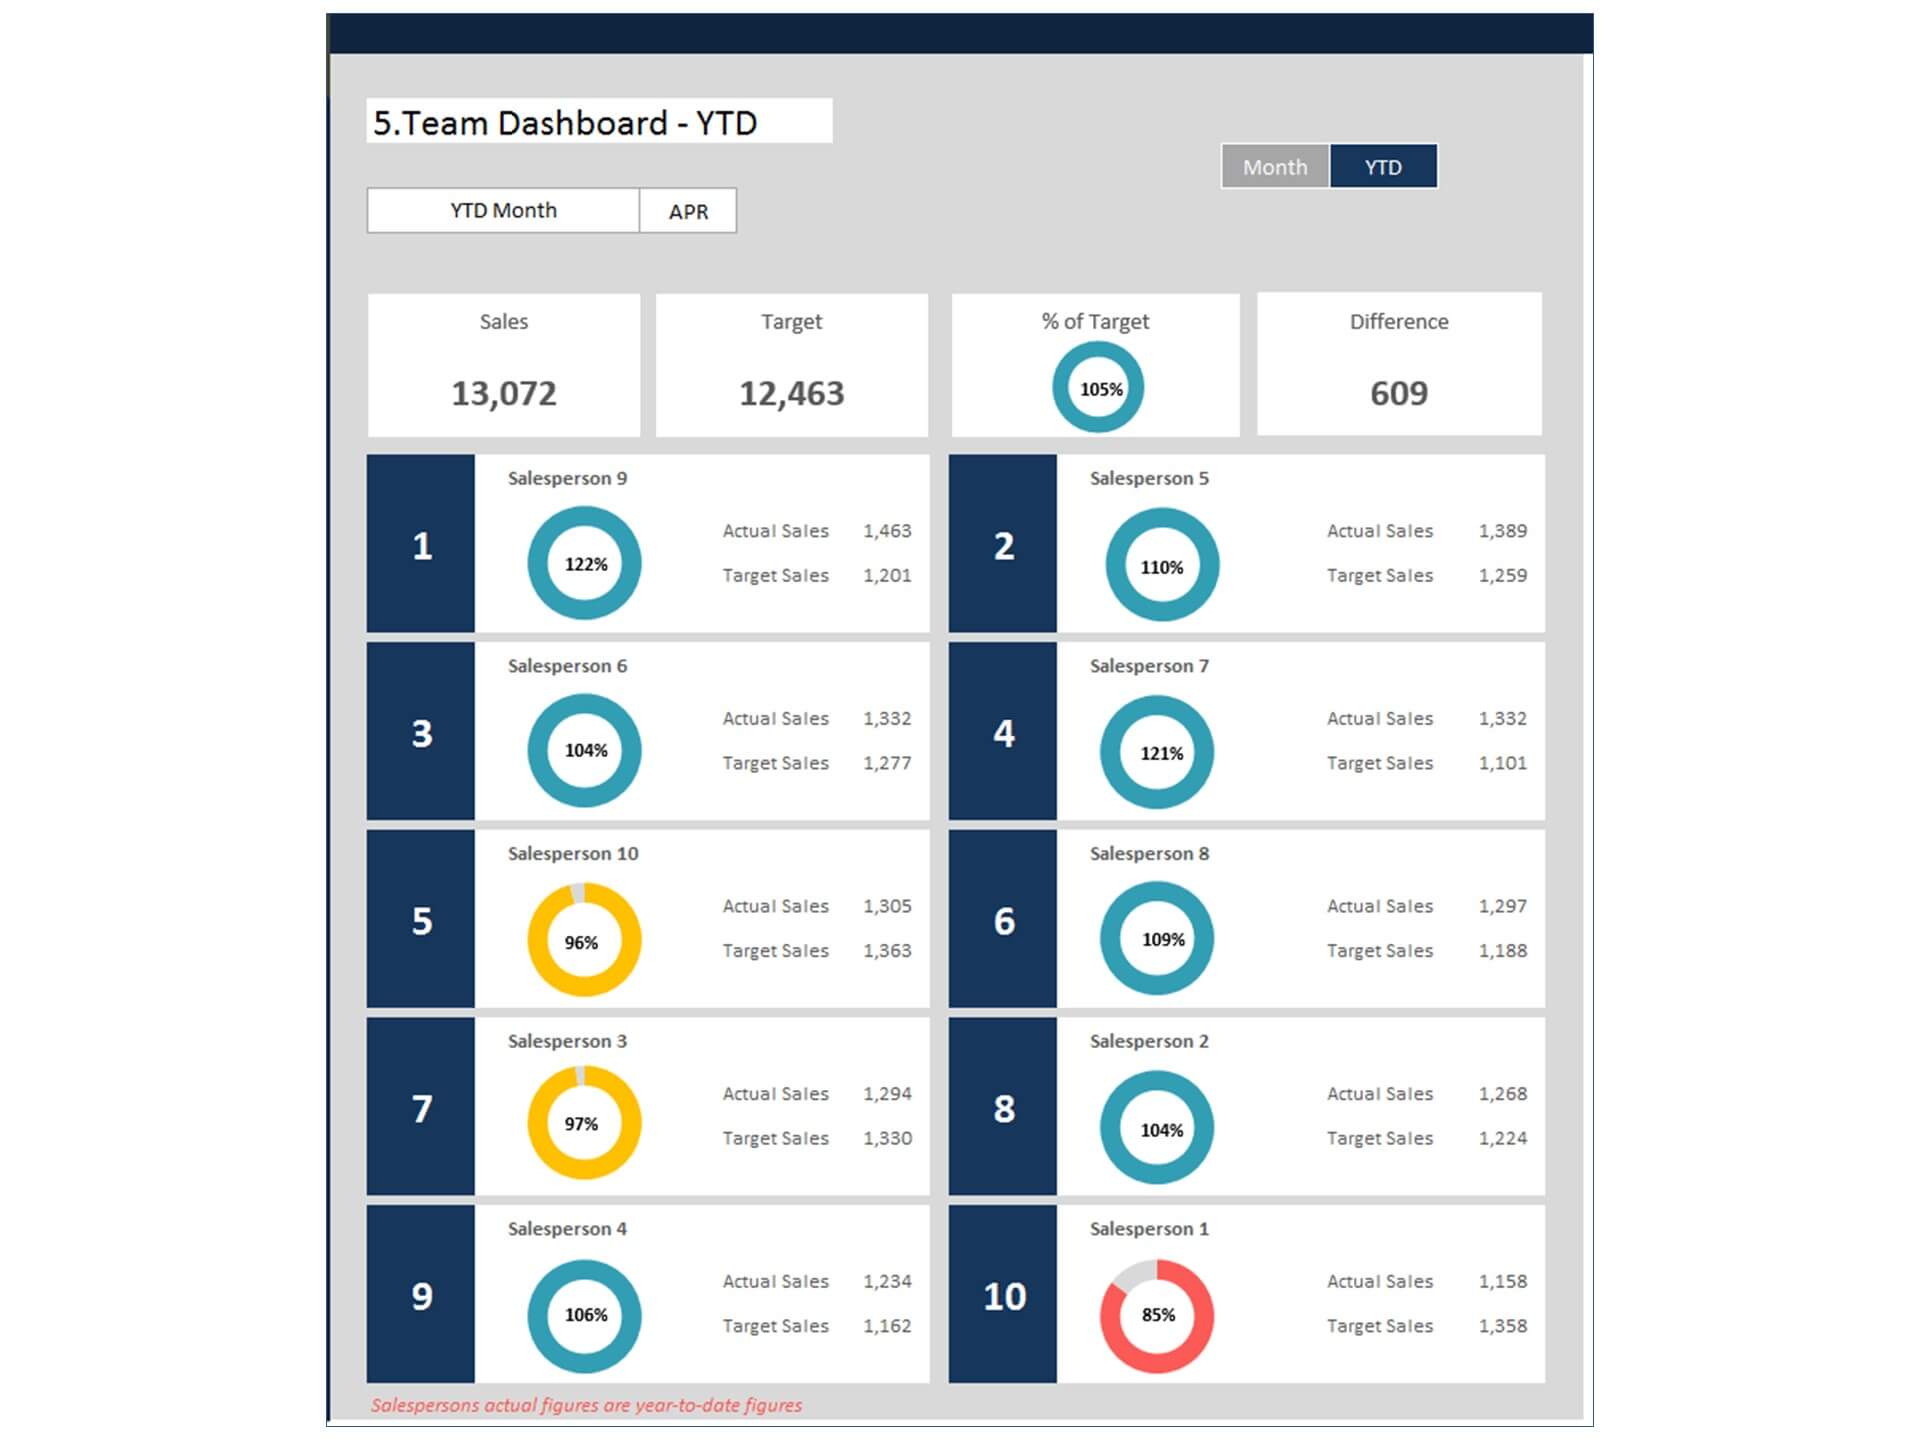
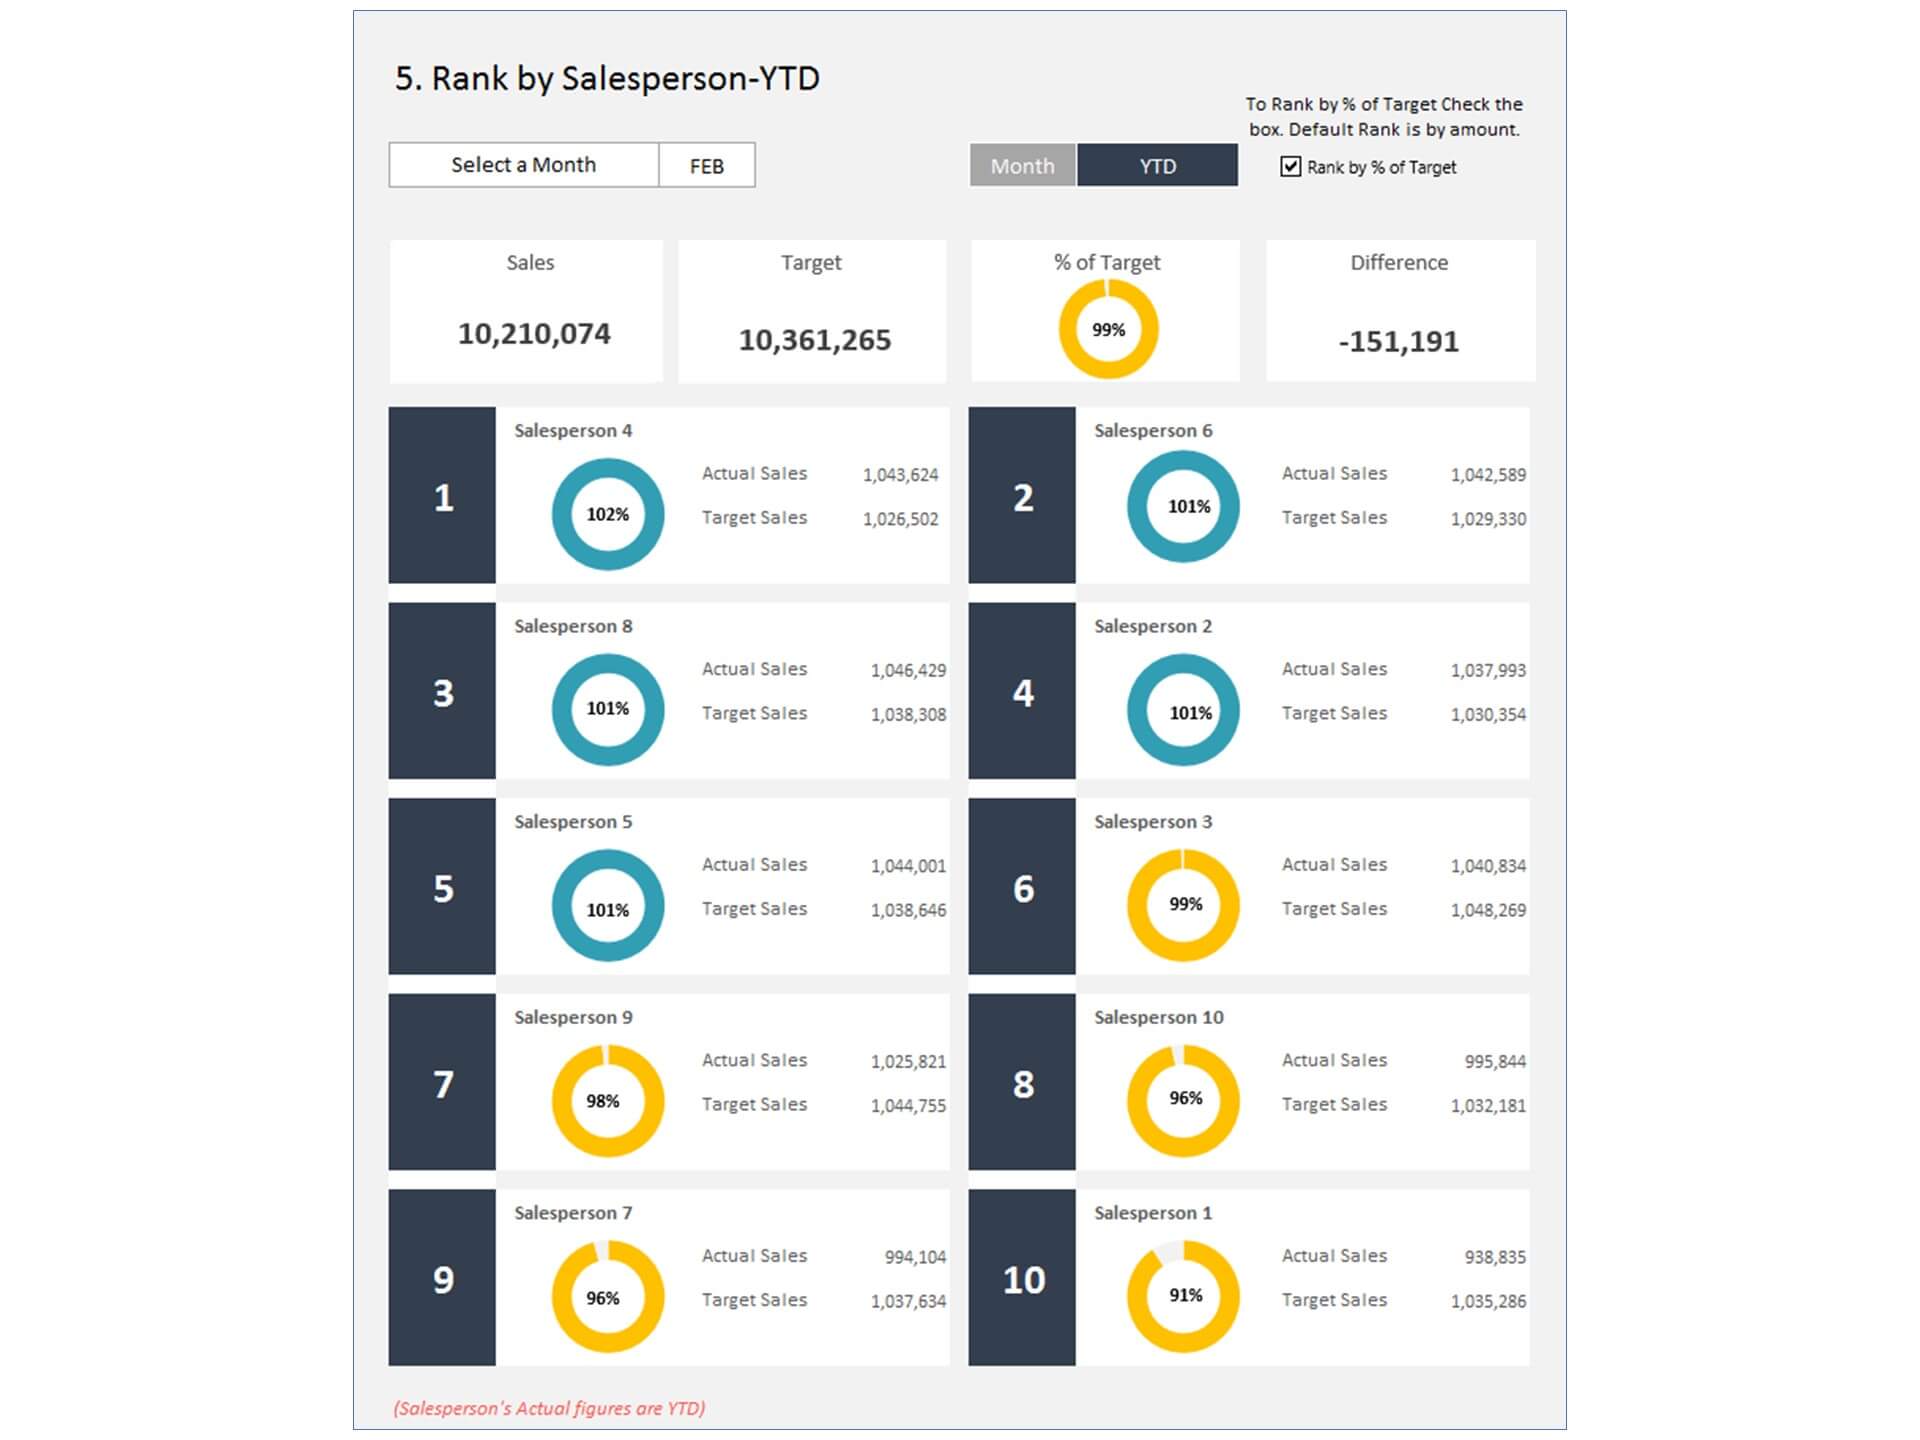
- Performance Evaluation: Sales tracking allows you to assess the performance of your sales team and individual sales reps. It helps identify top performers and areas that need improvement.
- Goal Achievement: Tracking sales progress against targets ensures that your business is on the right path to achieving its revenue and growth goals.
- Customer Insights: Analyzing sales data provides insights into customer behavior, preferences, and buying patterns, enabling you to tailor your marketing efforts accordingly.
- Cost Management: By monitoring sales and associated costs, you can identify areas where expenses can be optimized, leading to improved profitability.
Introducing Our Sales Tracking Dashboard Excel Template
Our Sales Tracking Dashboard Excel template is a powerful tool that simplifies the process of tracking and analyzing sales data. Whether you are a small business owner, a sales manager, or a data analyst, this template is designed to meet your needs.
Key Features:
- Visual Reports: Visualizations such as charts and graphs make it easy to interpret complex sales data, enabling quick decision-making.
- Customizable Dashboard: Tailor the dashboard to your specific requirements. Add or remove components as needed to focus on what matters most to your business.
- Monthly Sales Growth: Monitor month-over-month sales growth to identify trends and areas for improvement.
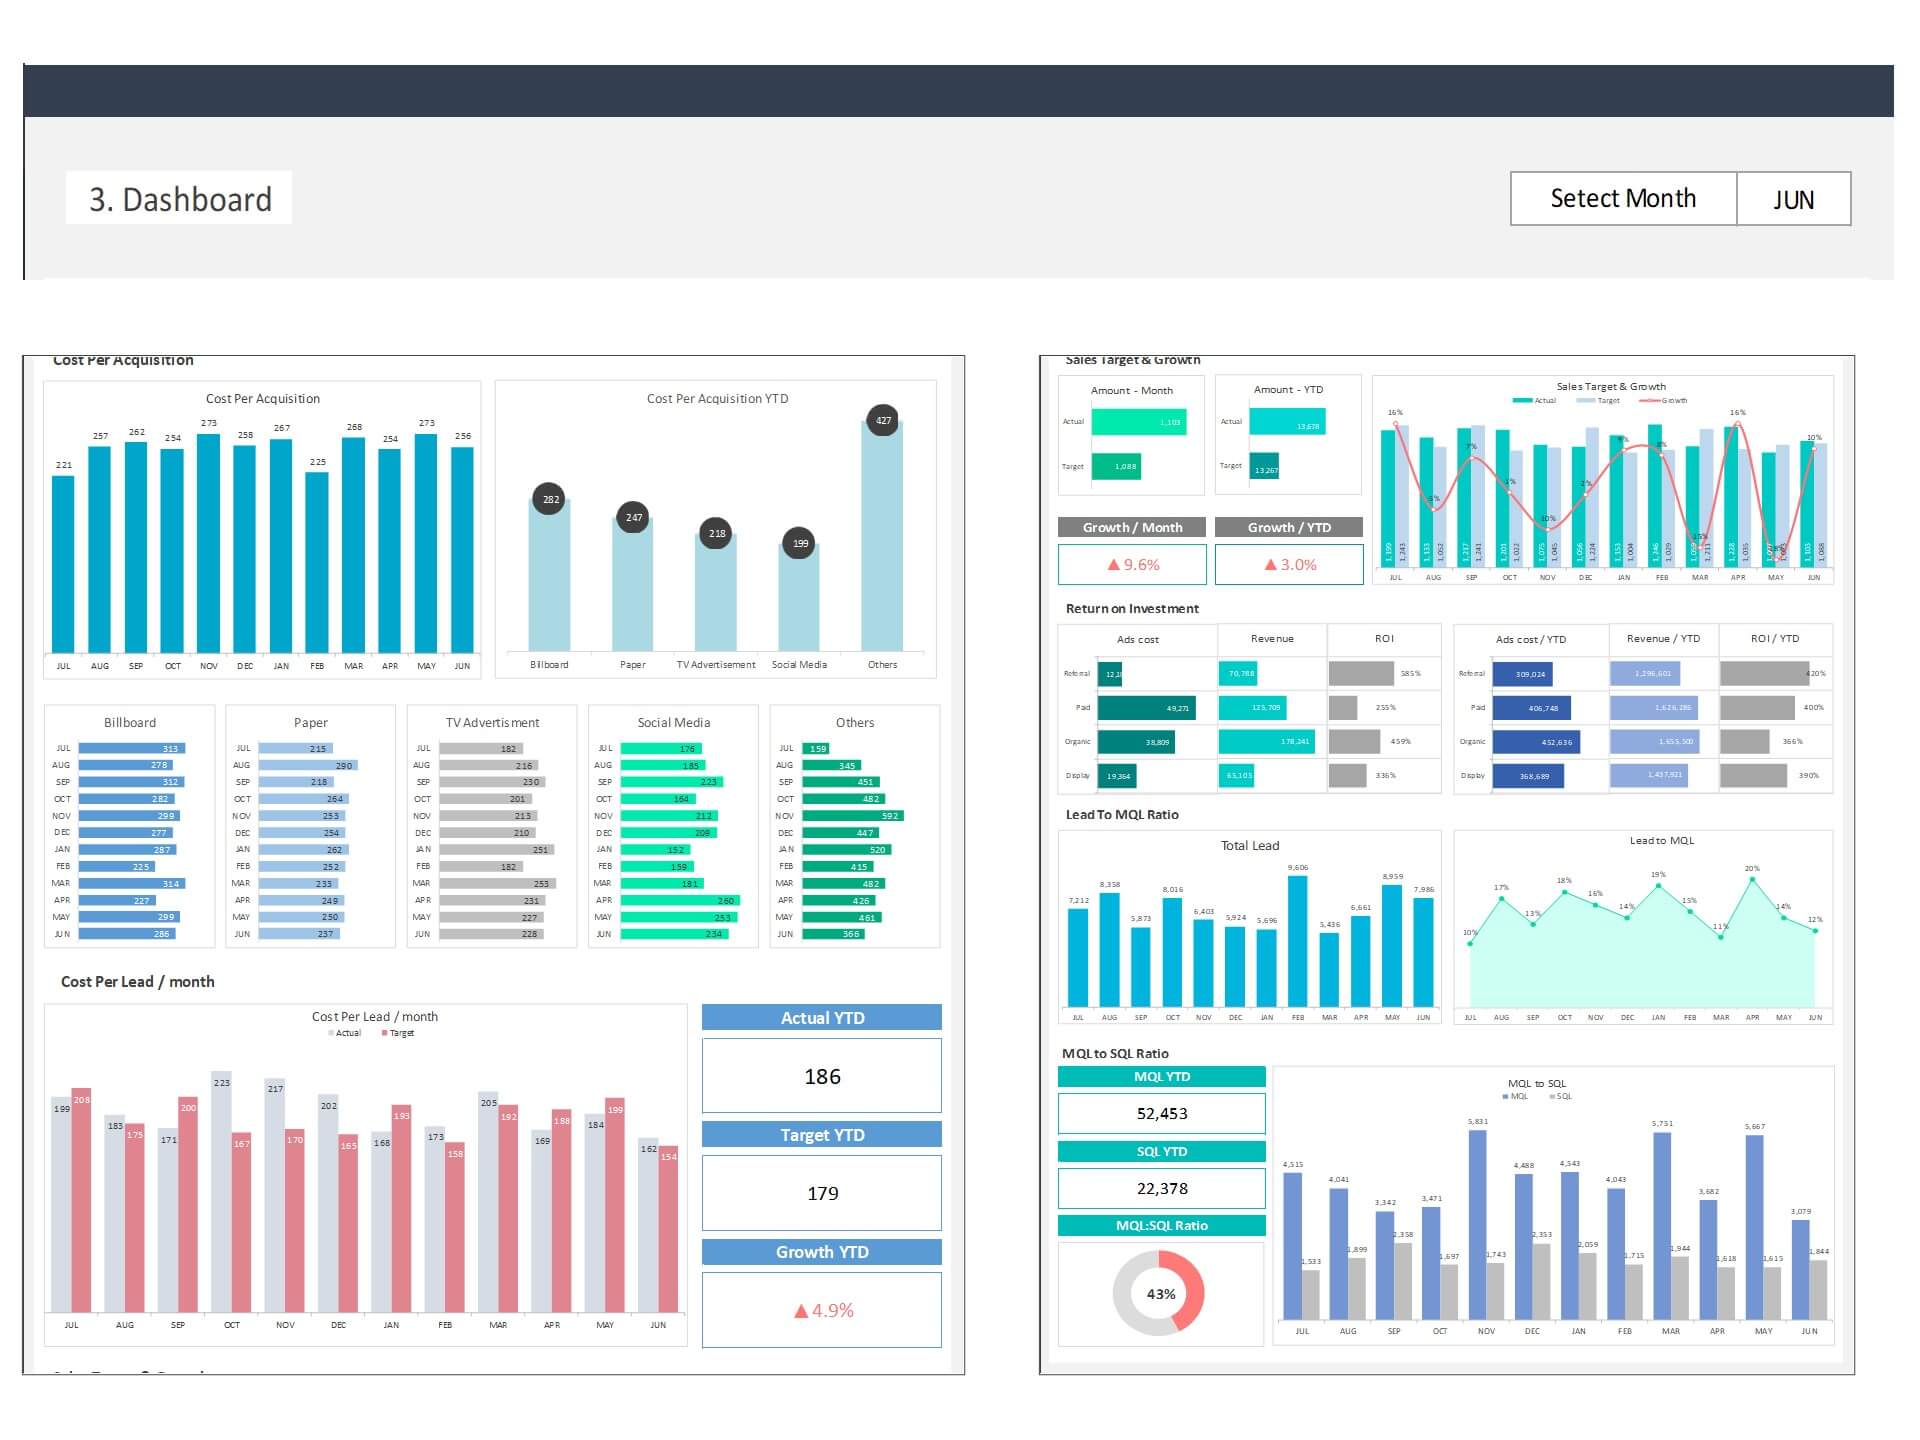
- Sales KPIs: Set and track key performance indicators (KPIs) like conversion rates, average order value, and customer acquisition cost.
- User-Friendly Interface: You don't need to be an Excel expert to use our template. It's user-friendly and comes with clear instructions.
How Our Sales Tracking Dashboard Empowers Your Business
Now, let's explore how our Excel template empowers your business by offering insights into key sales performance indicators:
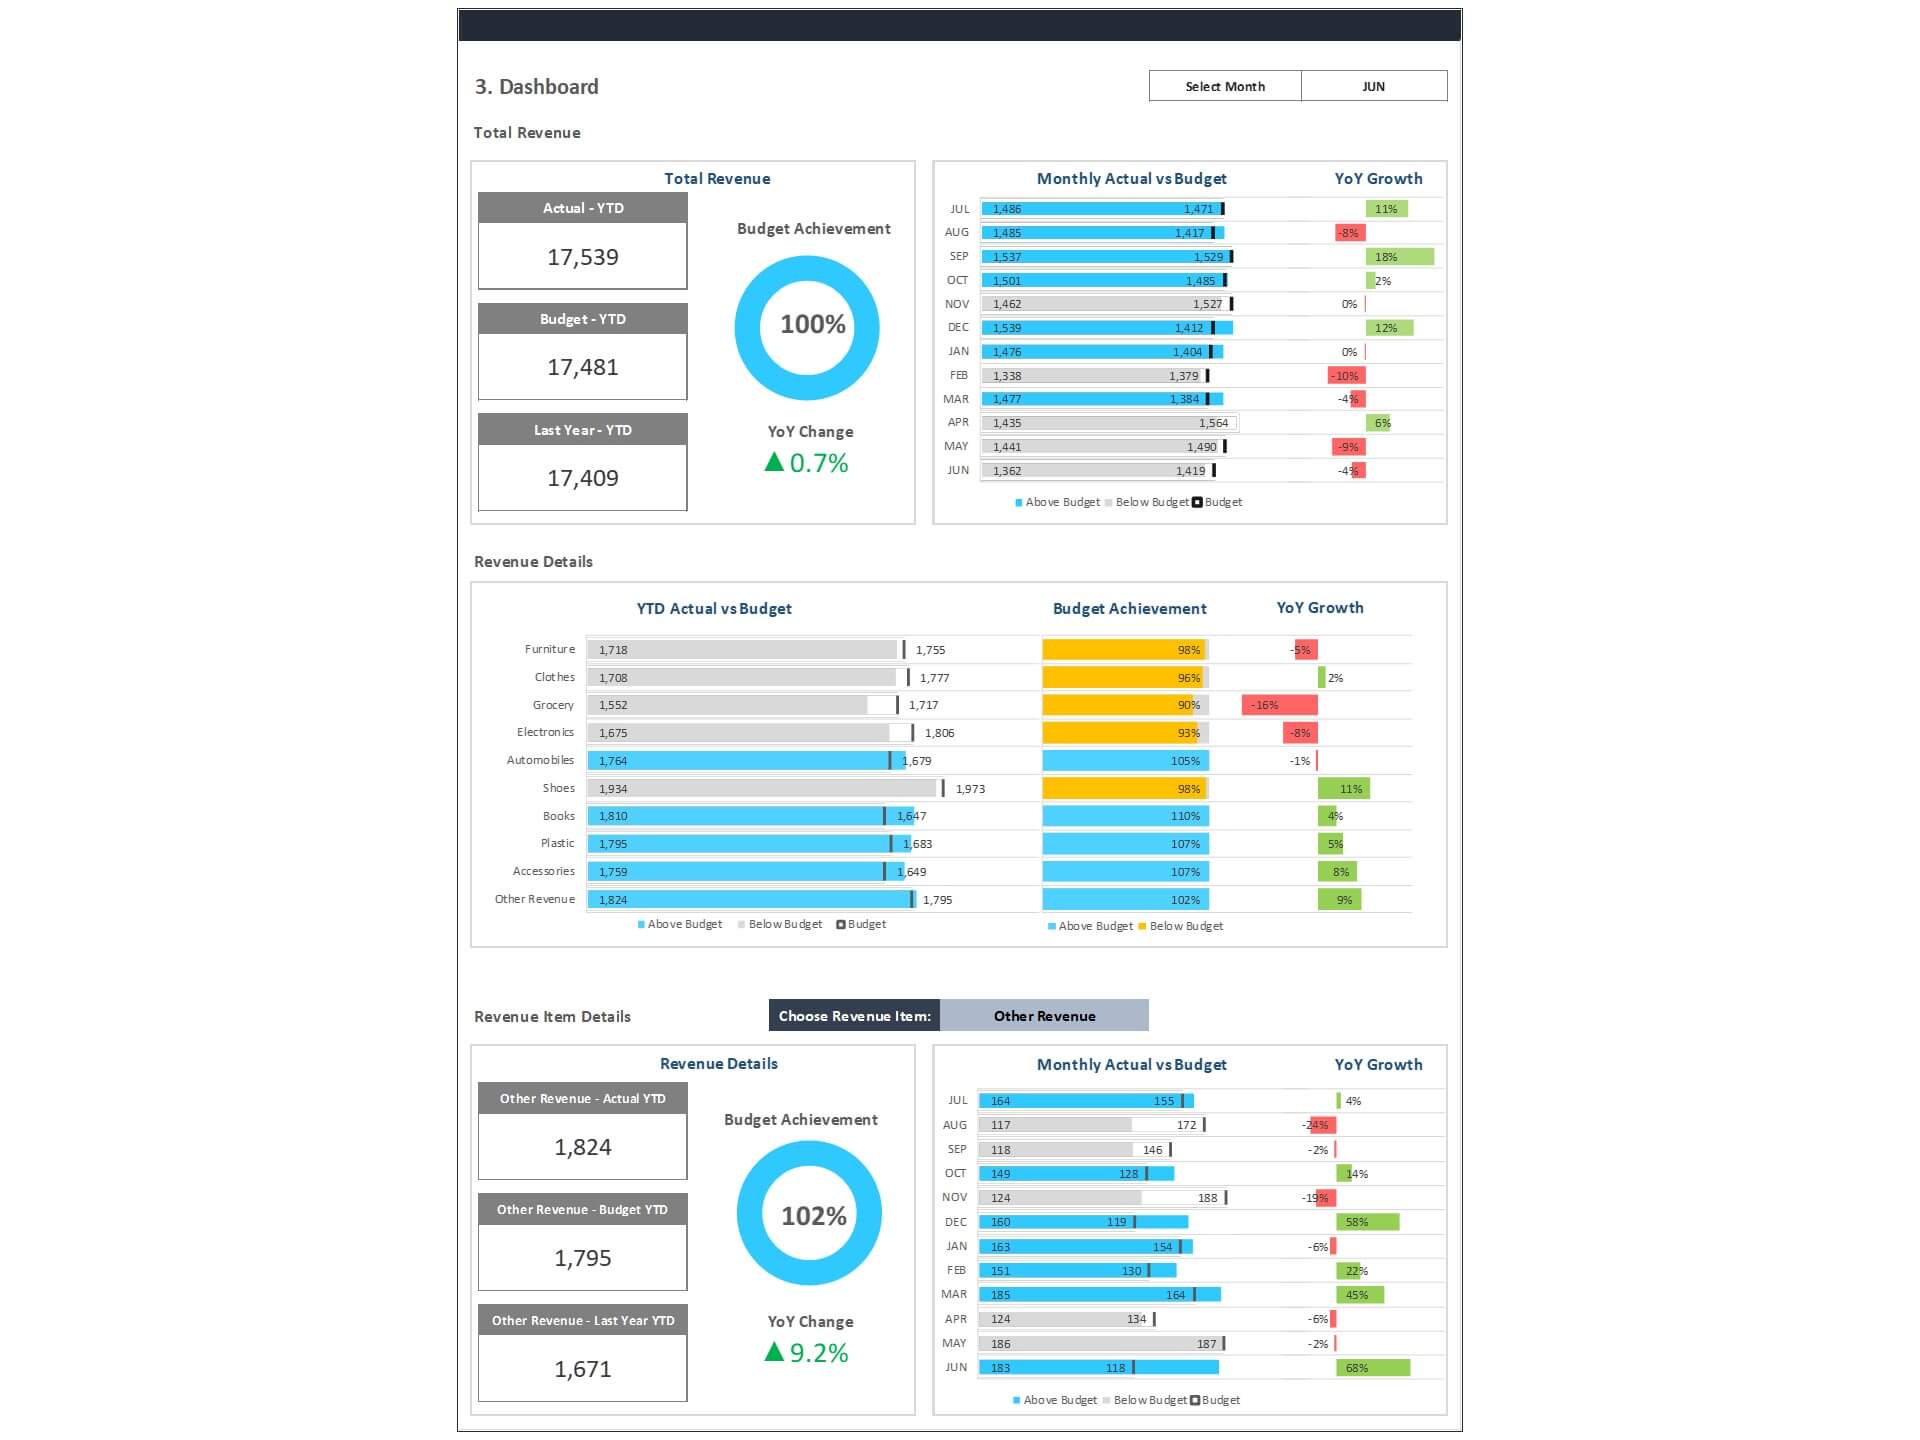
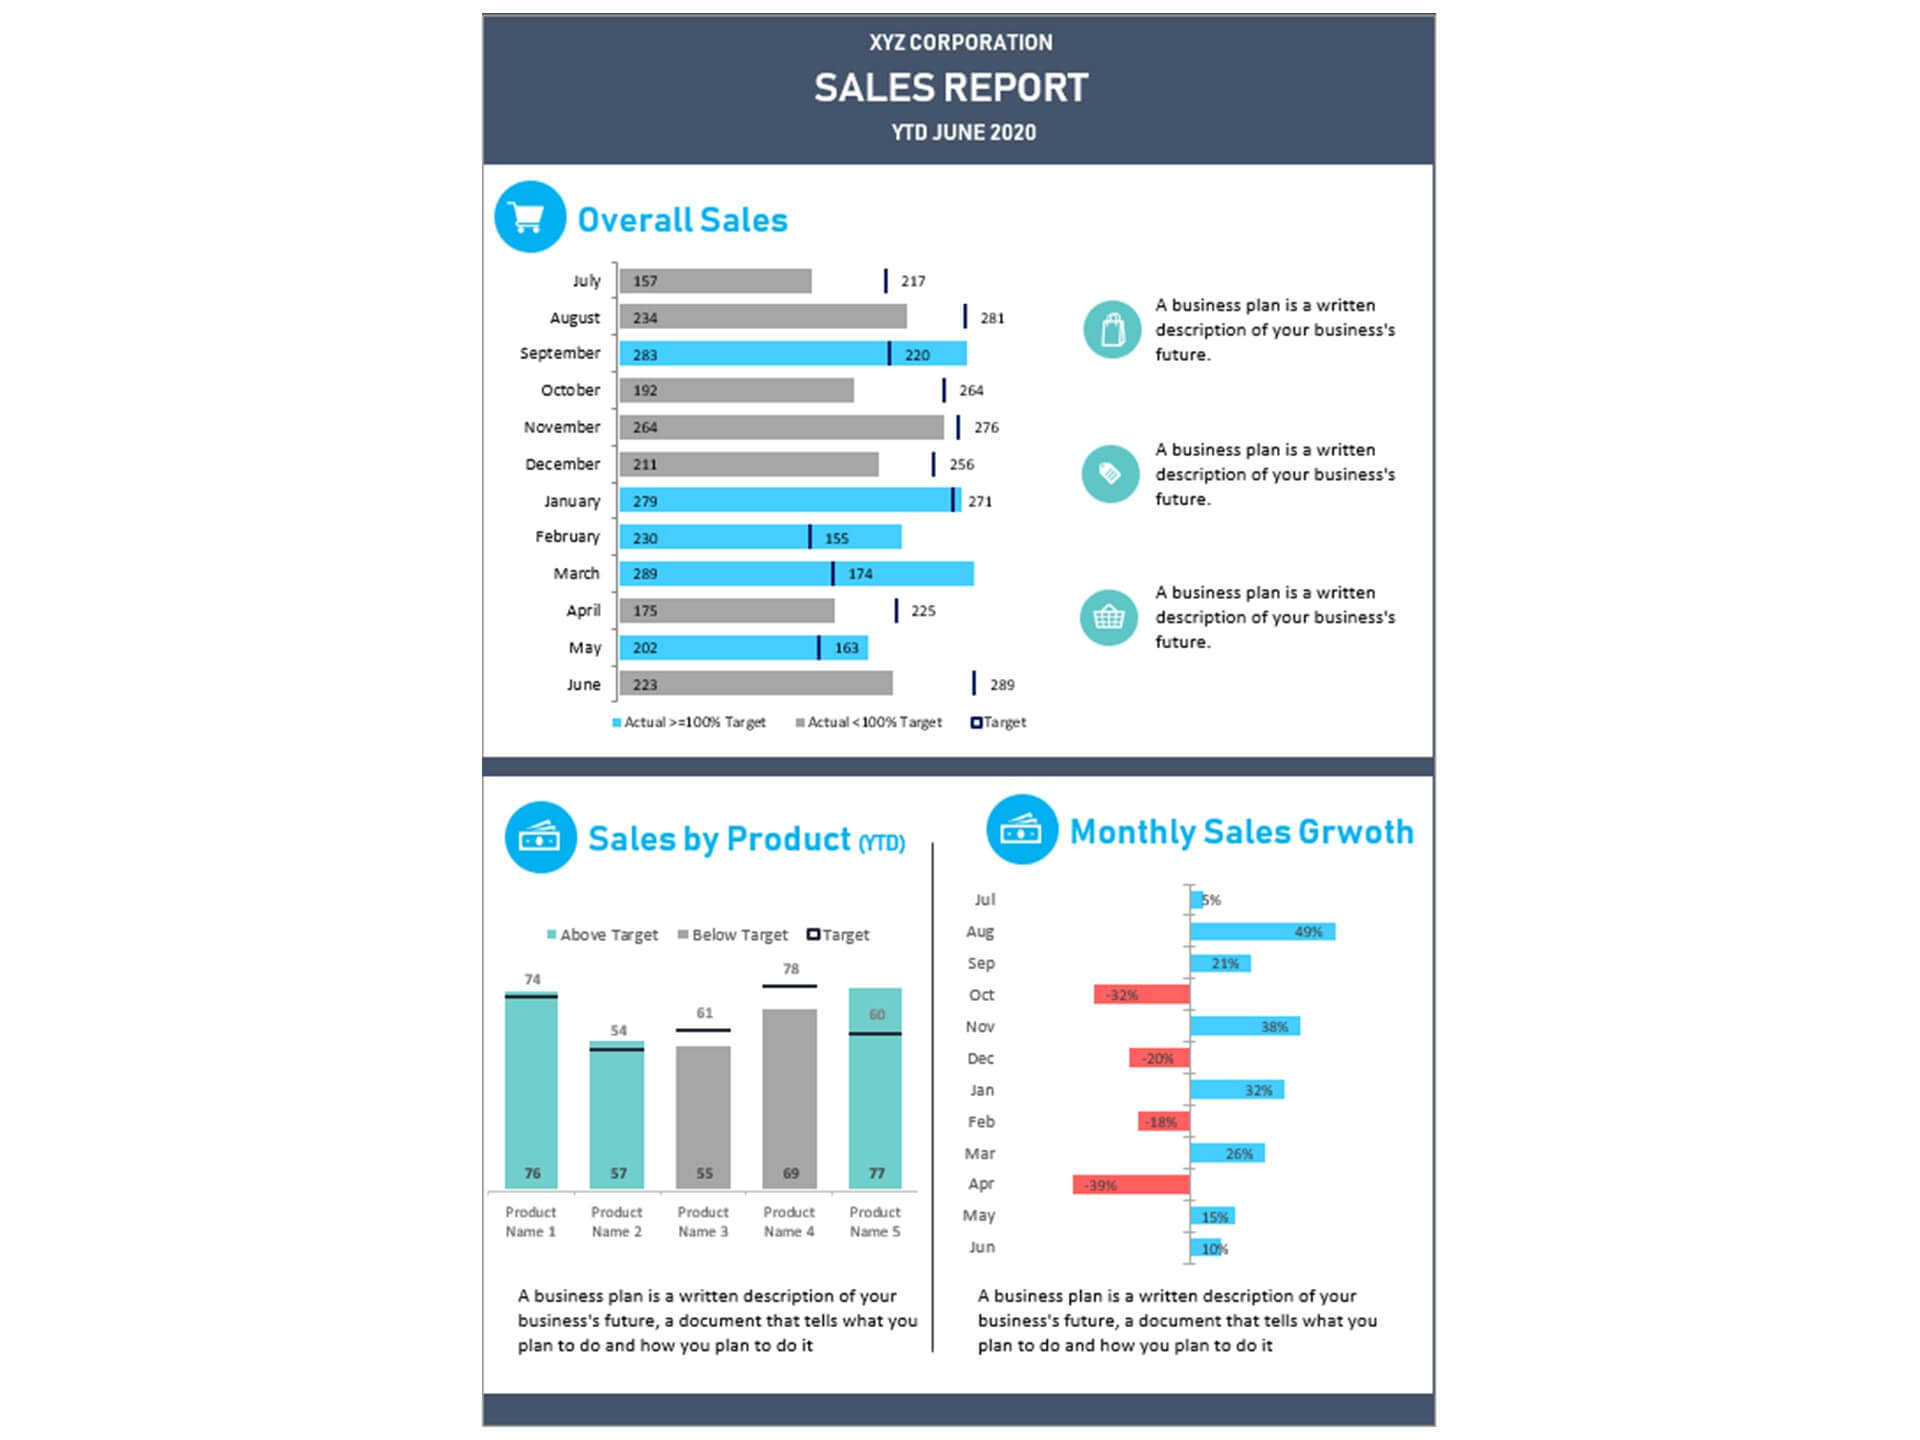
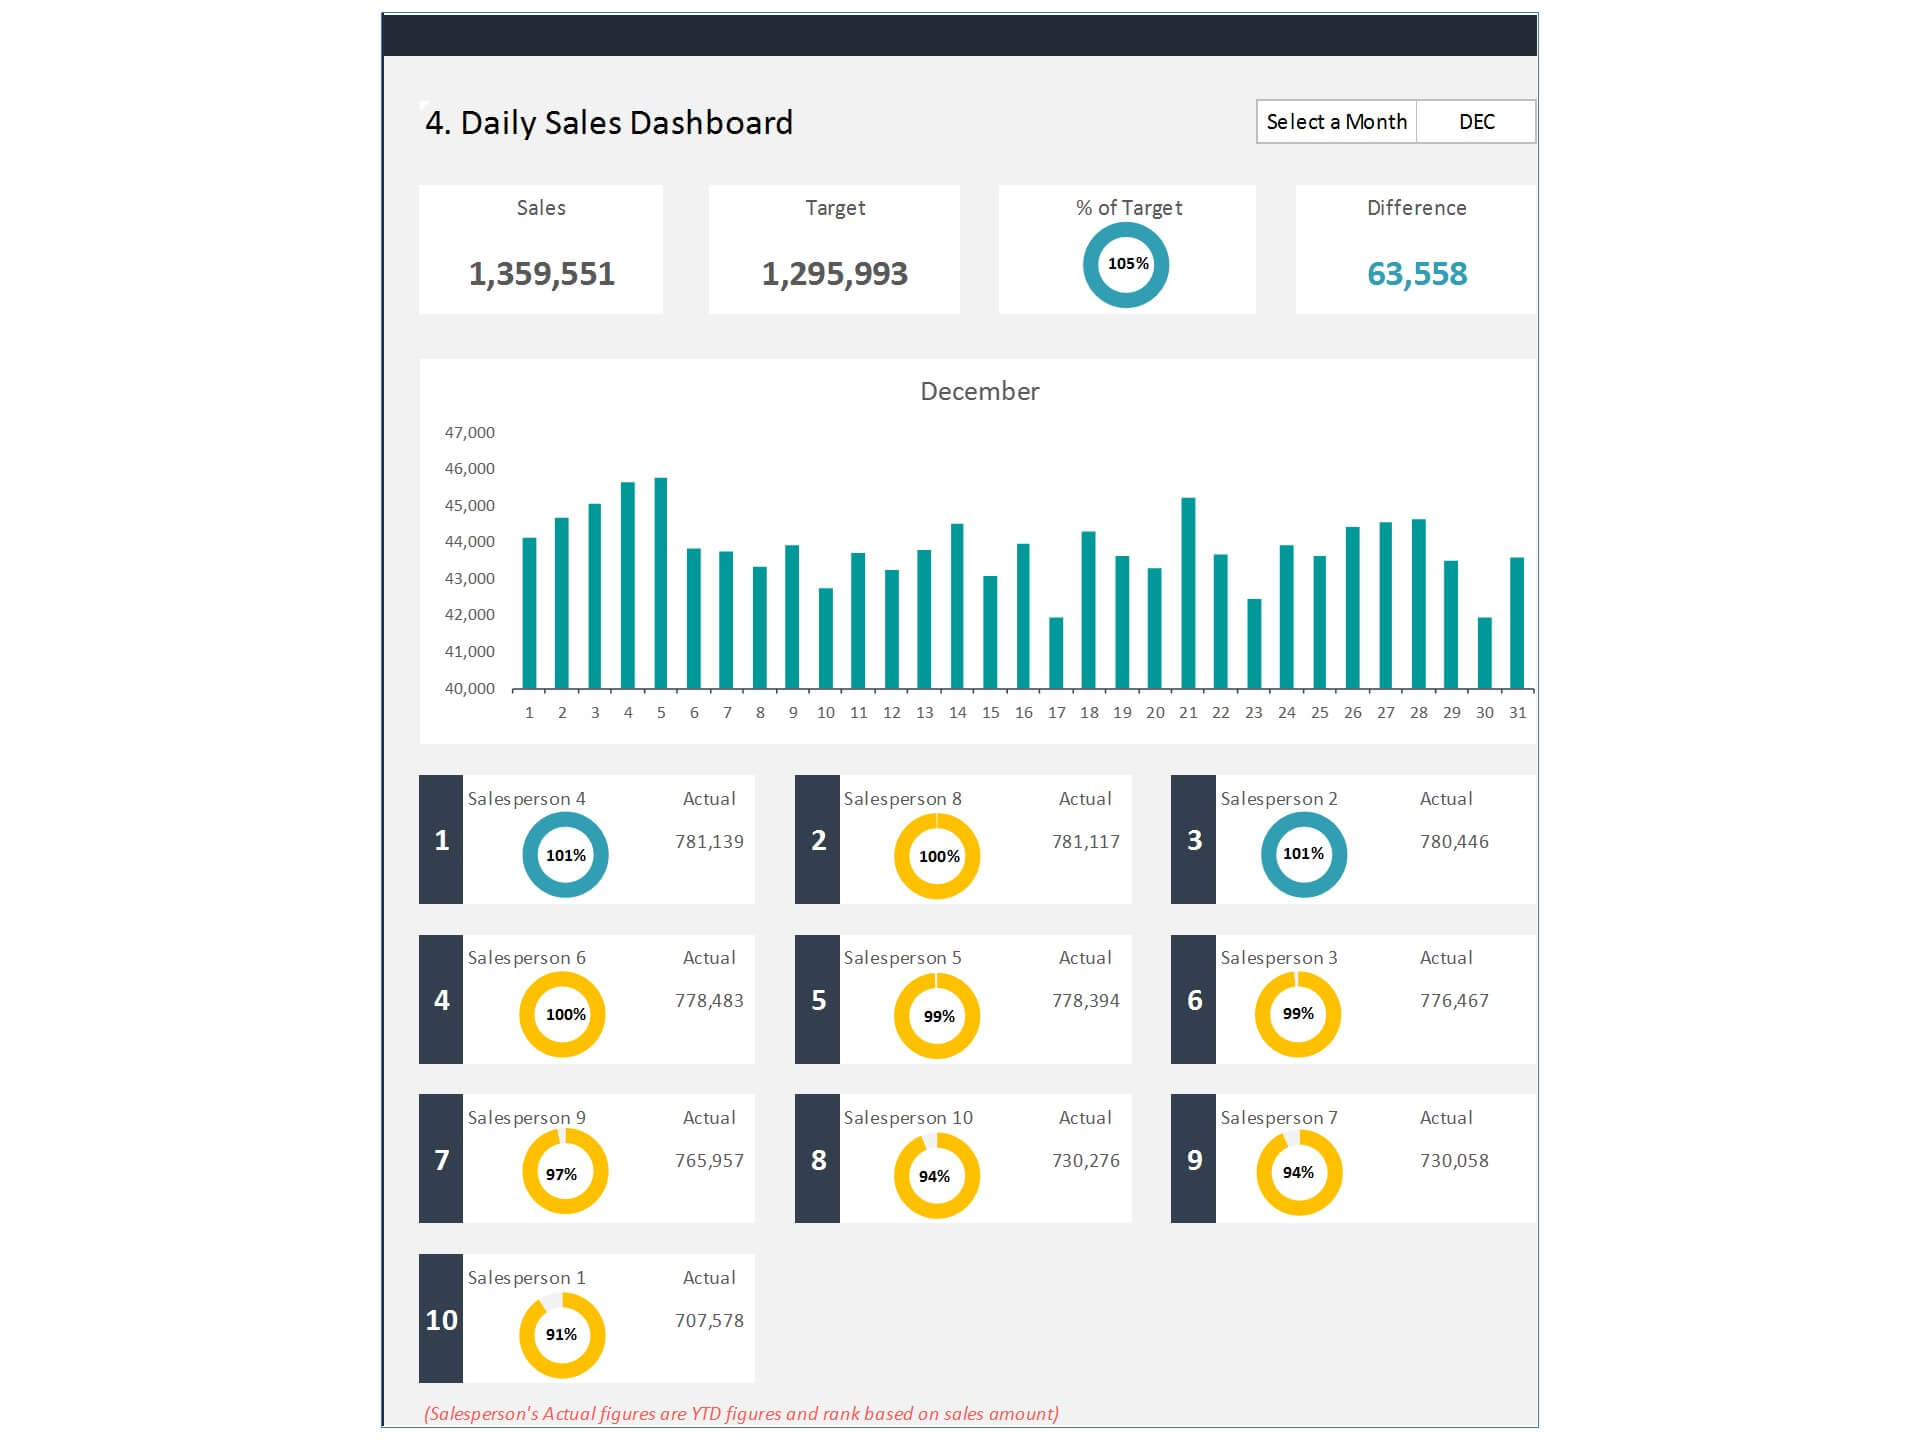
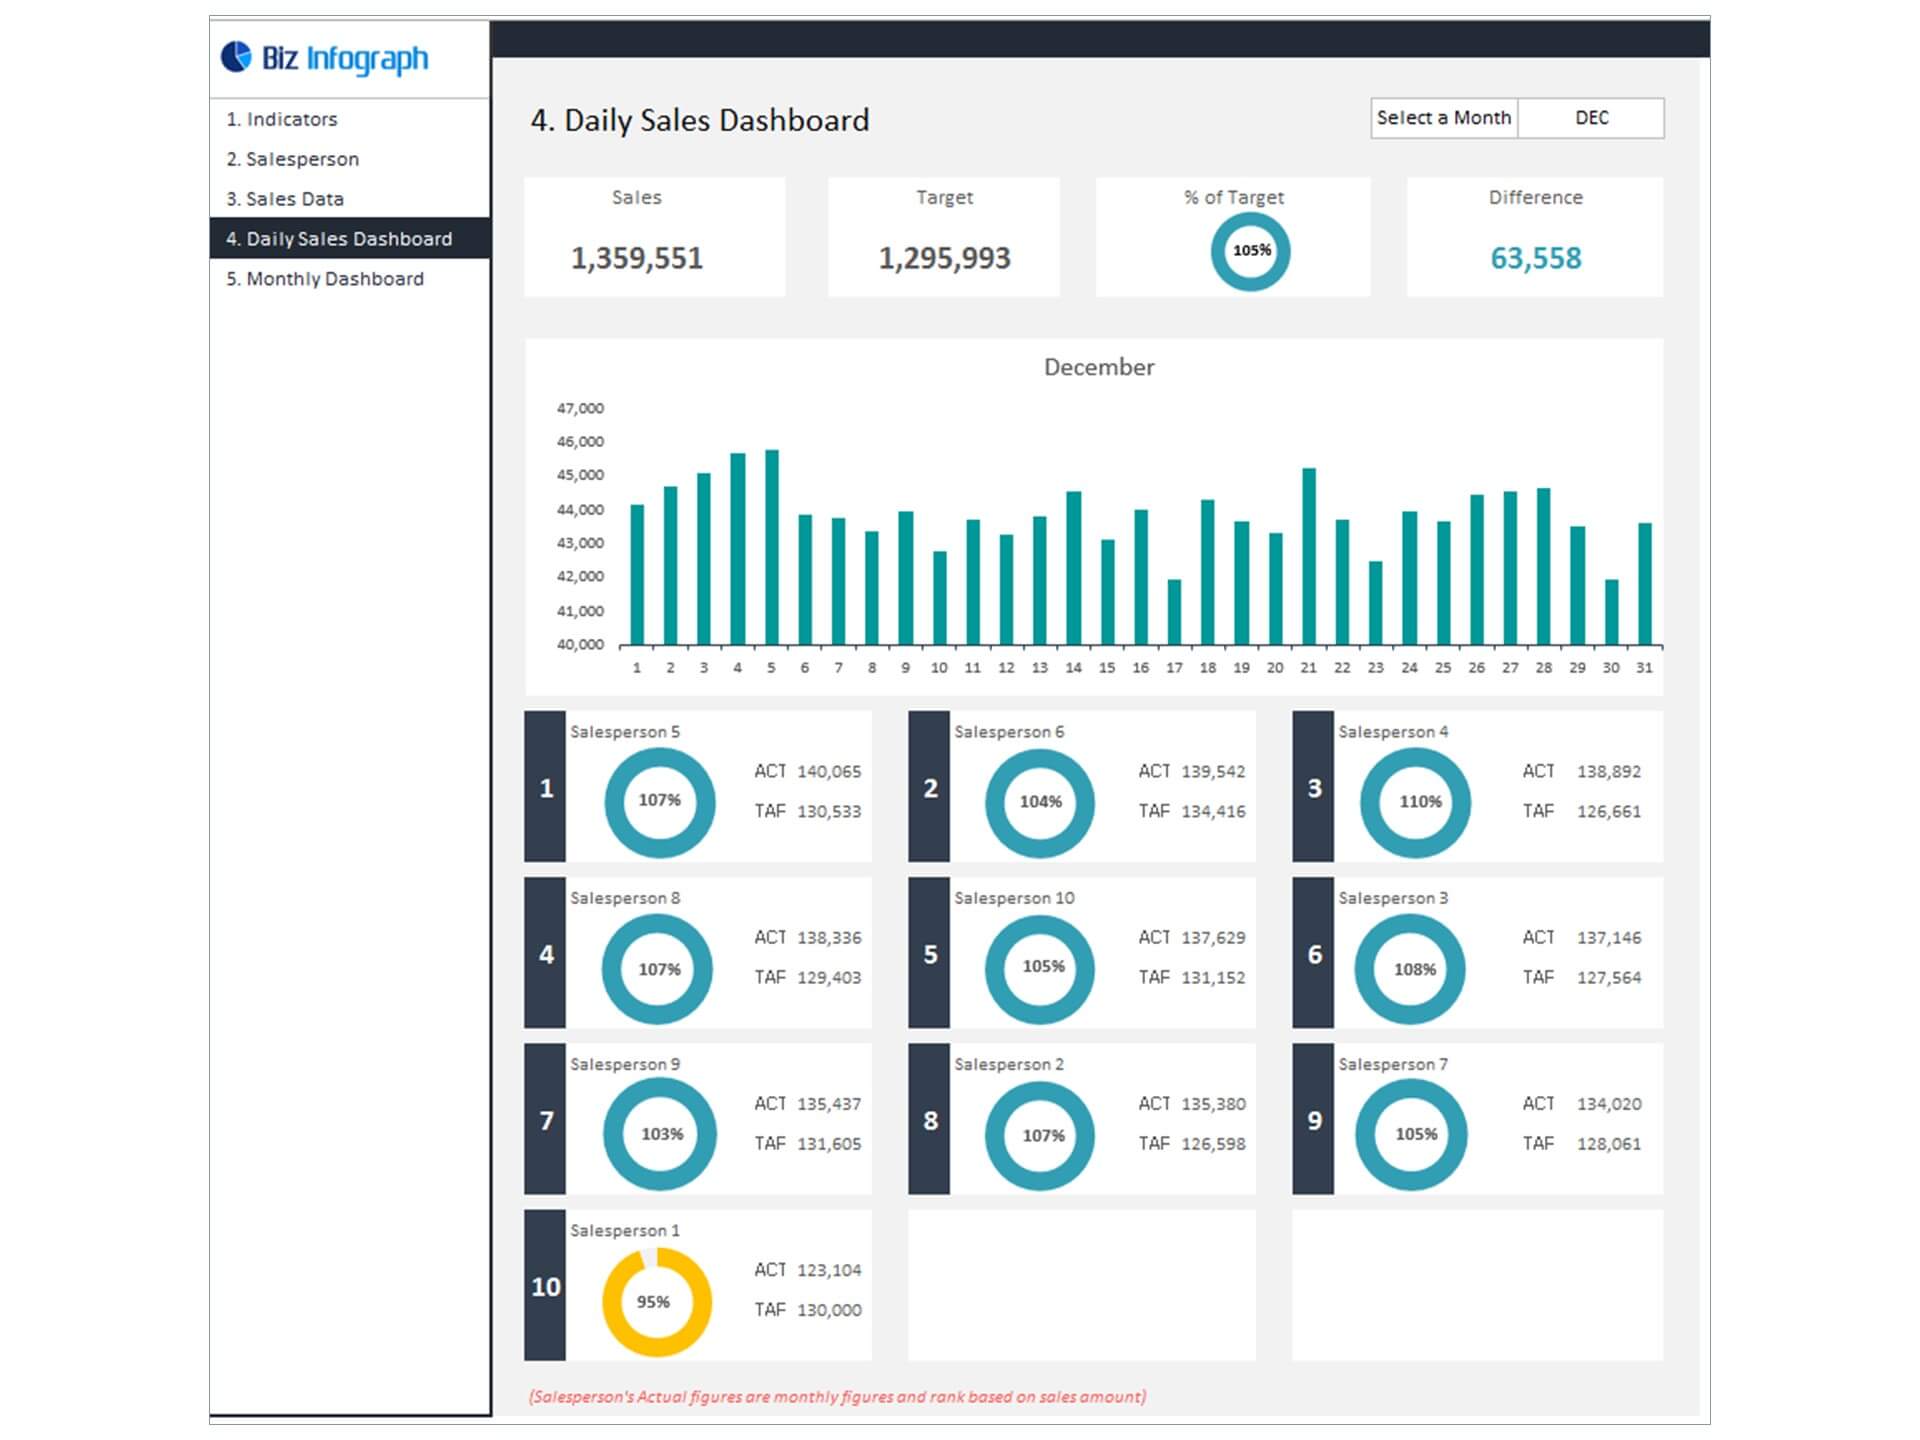
- Overall Sales by Month: Our template provides a comprehensive view of your sales by month, allowing you to identify seasonal trends and plan marketing campaigns accordingly.
- Monthly Sales Growth: Tracking your month-over-month sales growth helps you set realistic goals and measure your progress. Identify months with exceptional growth and those that may require strategy adjustments.
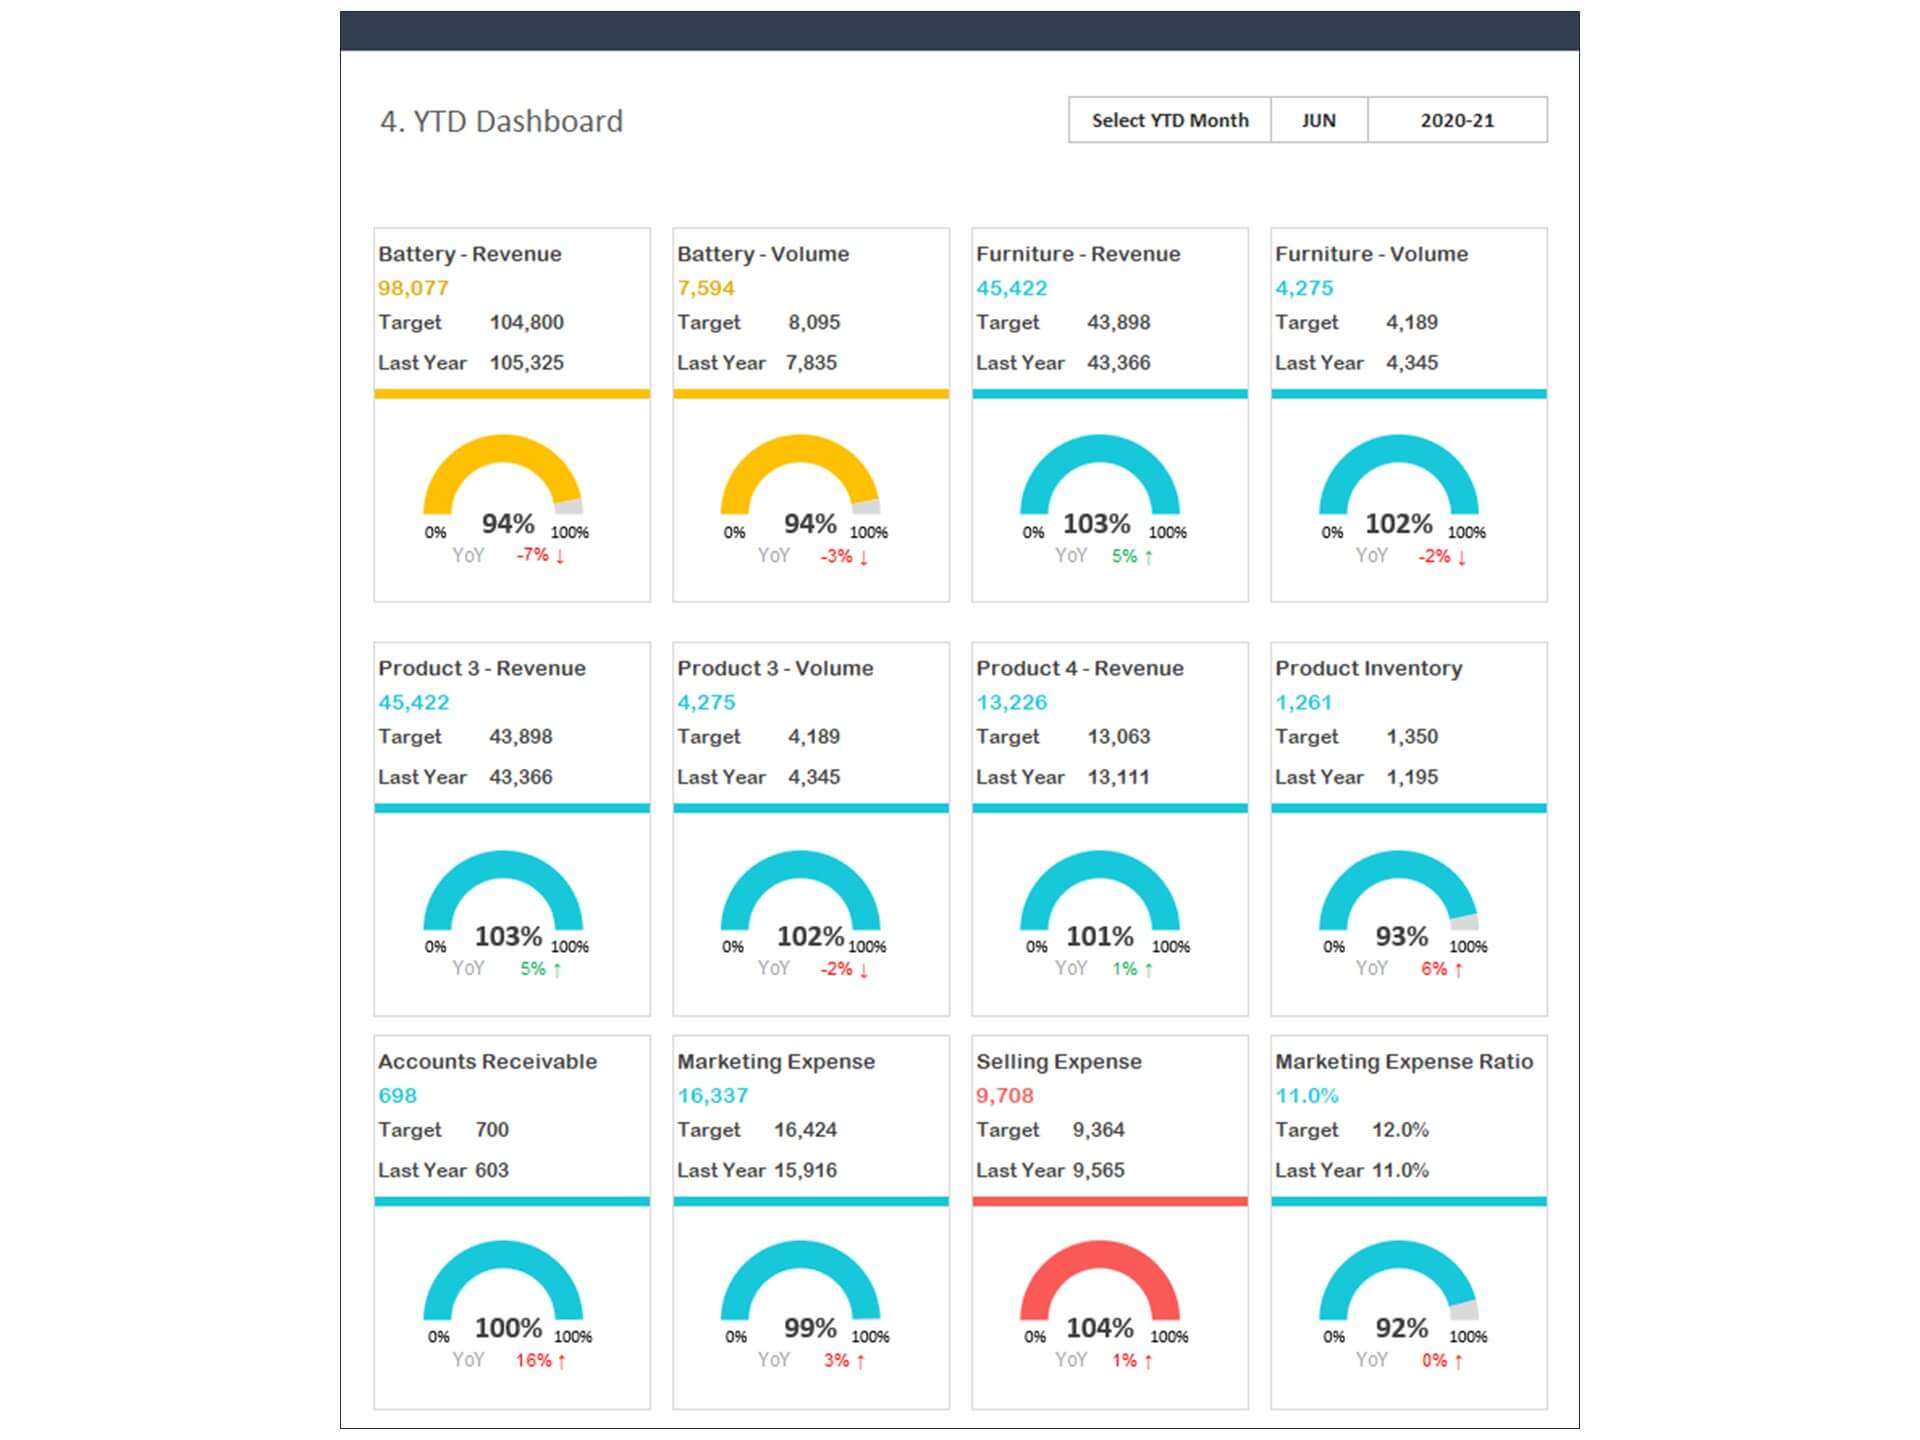
- Sales KPI Achievement: Define and track KPIs that align with your business goals. Our template allows you to measure the achievement of these key performance indicators, ensuring you stay on track.
- Customer Insights: By analyzing sales data, you can gain valuable insights into your customer base. Identify your most loyal customers, their buying habits, and opportunities to increase customer retention.
Getting Started with Our Sales Tracking Dashboard
Using our Sales Tracking Dashboard Excel template is simple, even if you're not an Excel expert. Here are the steps to get started:
- Download the Template: Visit our website and download the Sales Tracking Dashboard Excel template.
- Input Your Data: Enter your sales data into the template. You can customize the data fields to match your business needs.
- Update Regularly: To get the most out of the dashboard, update your sales data regularly to keep it current.
- Analyze and Act: Use the visual reports and insights generated by the template to make informed decisions and optimize your sales strategies.
Key Features of Dashboard Template:
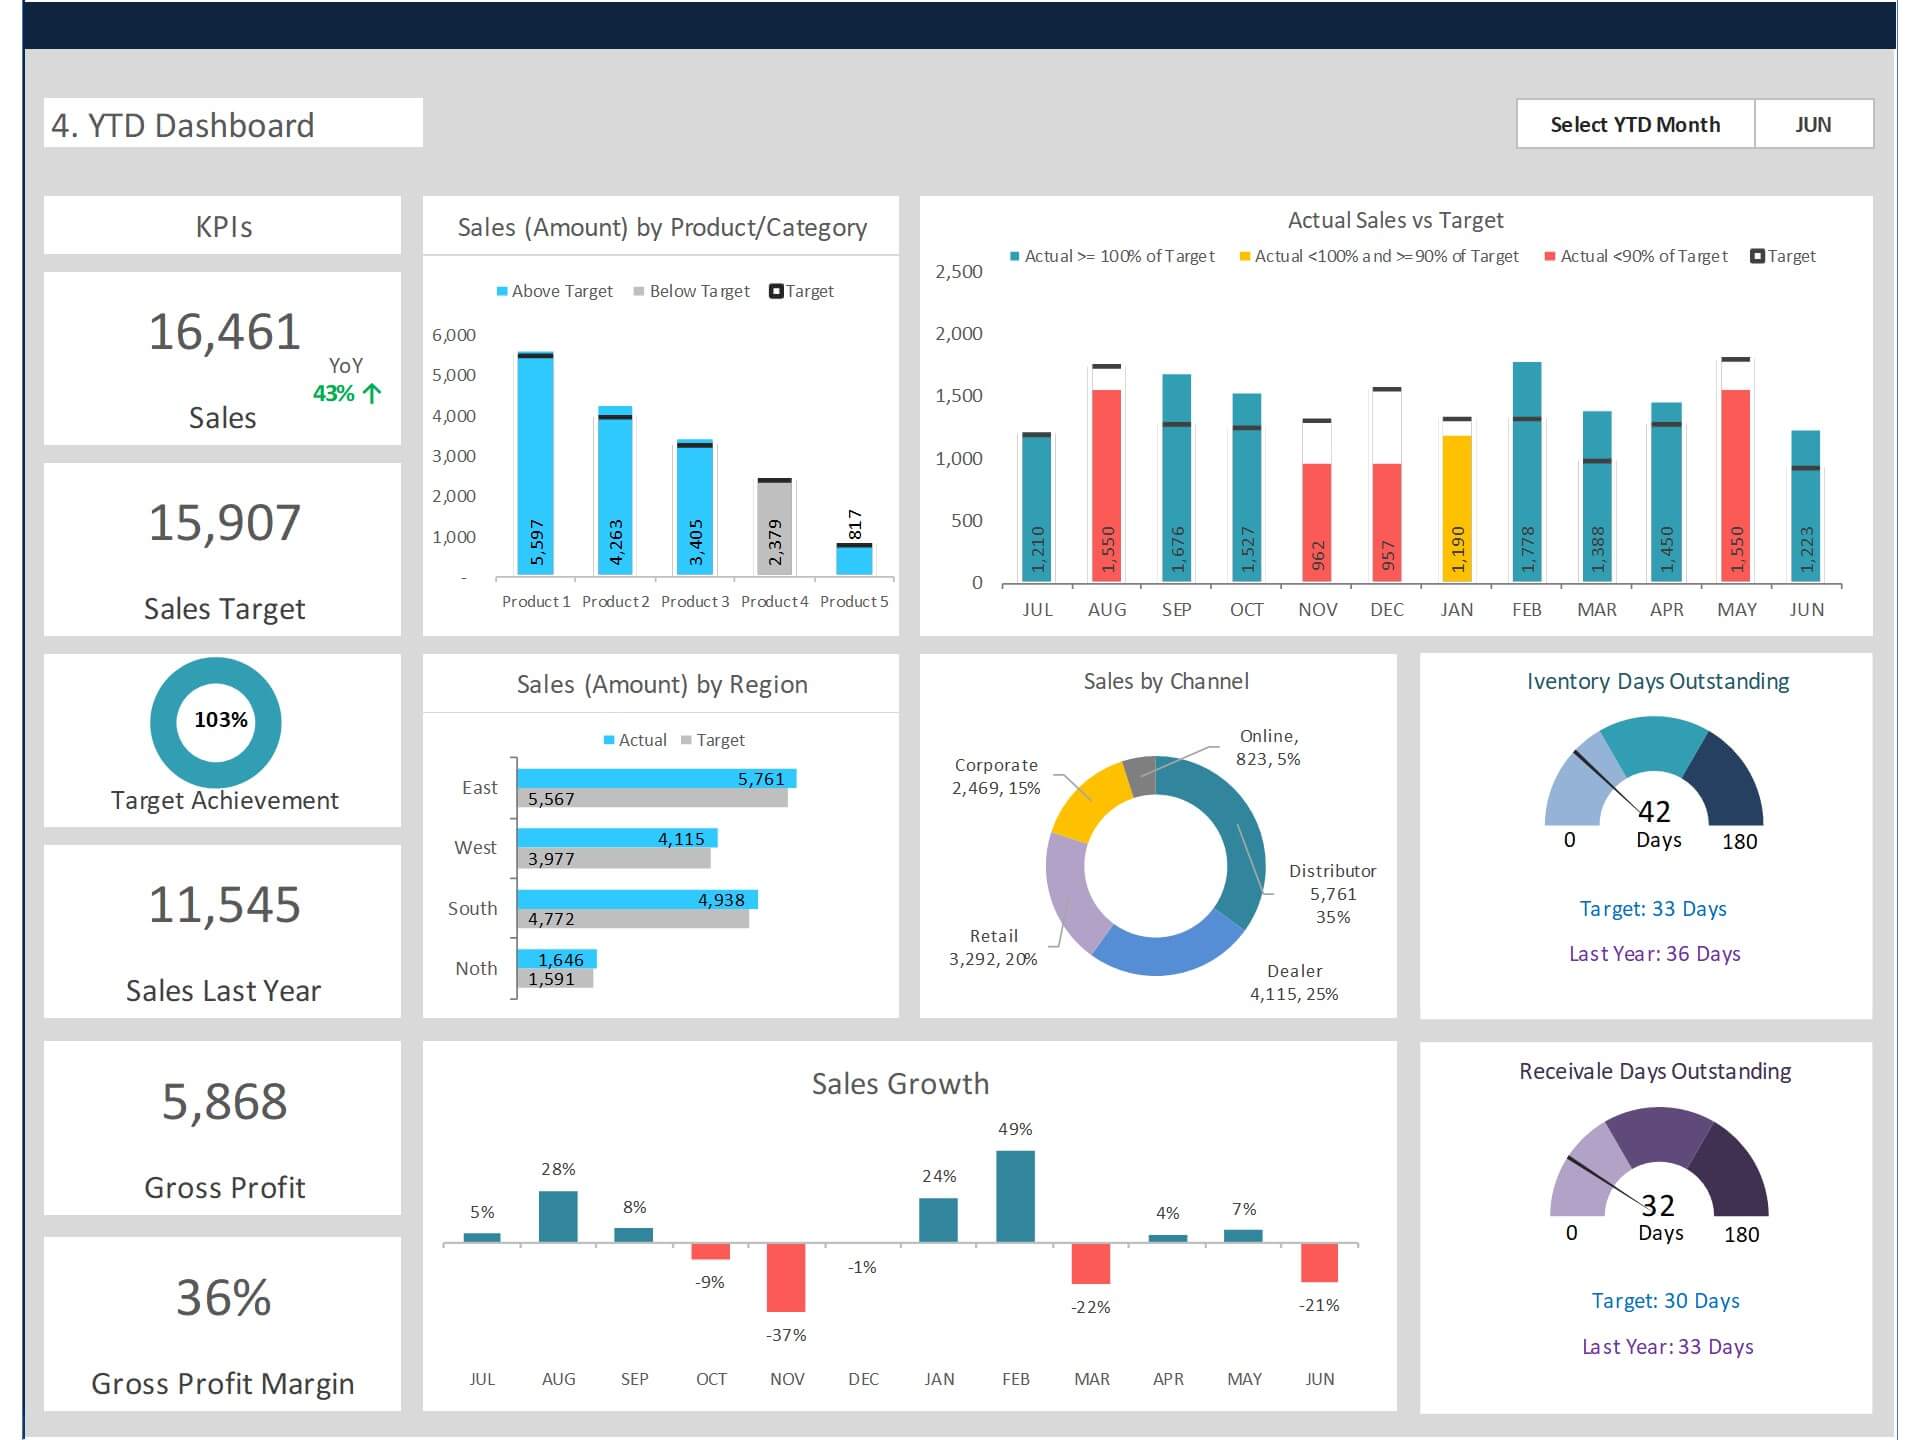
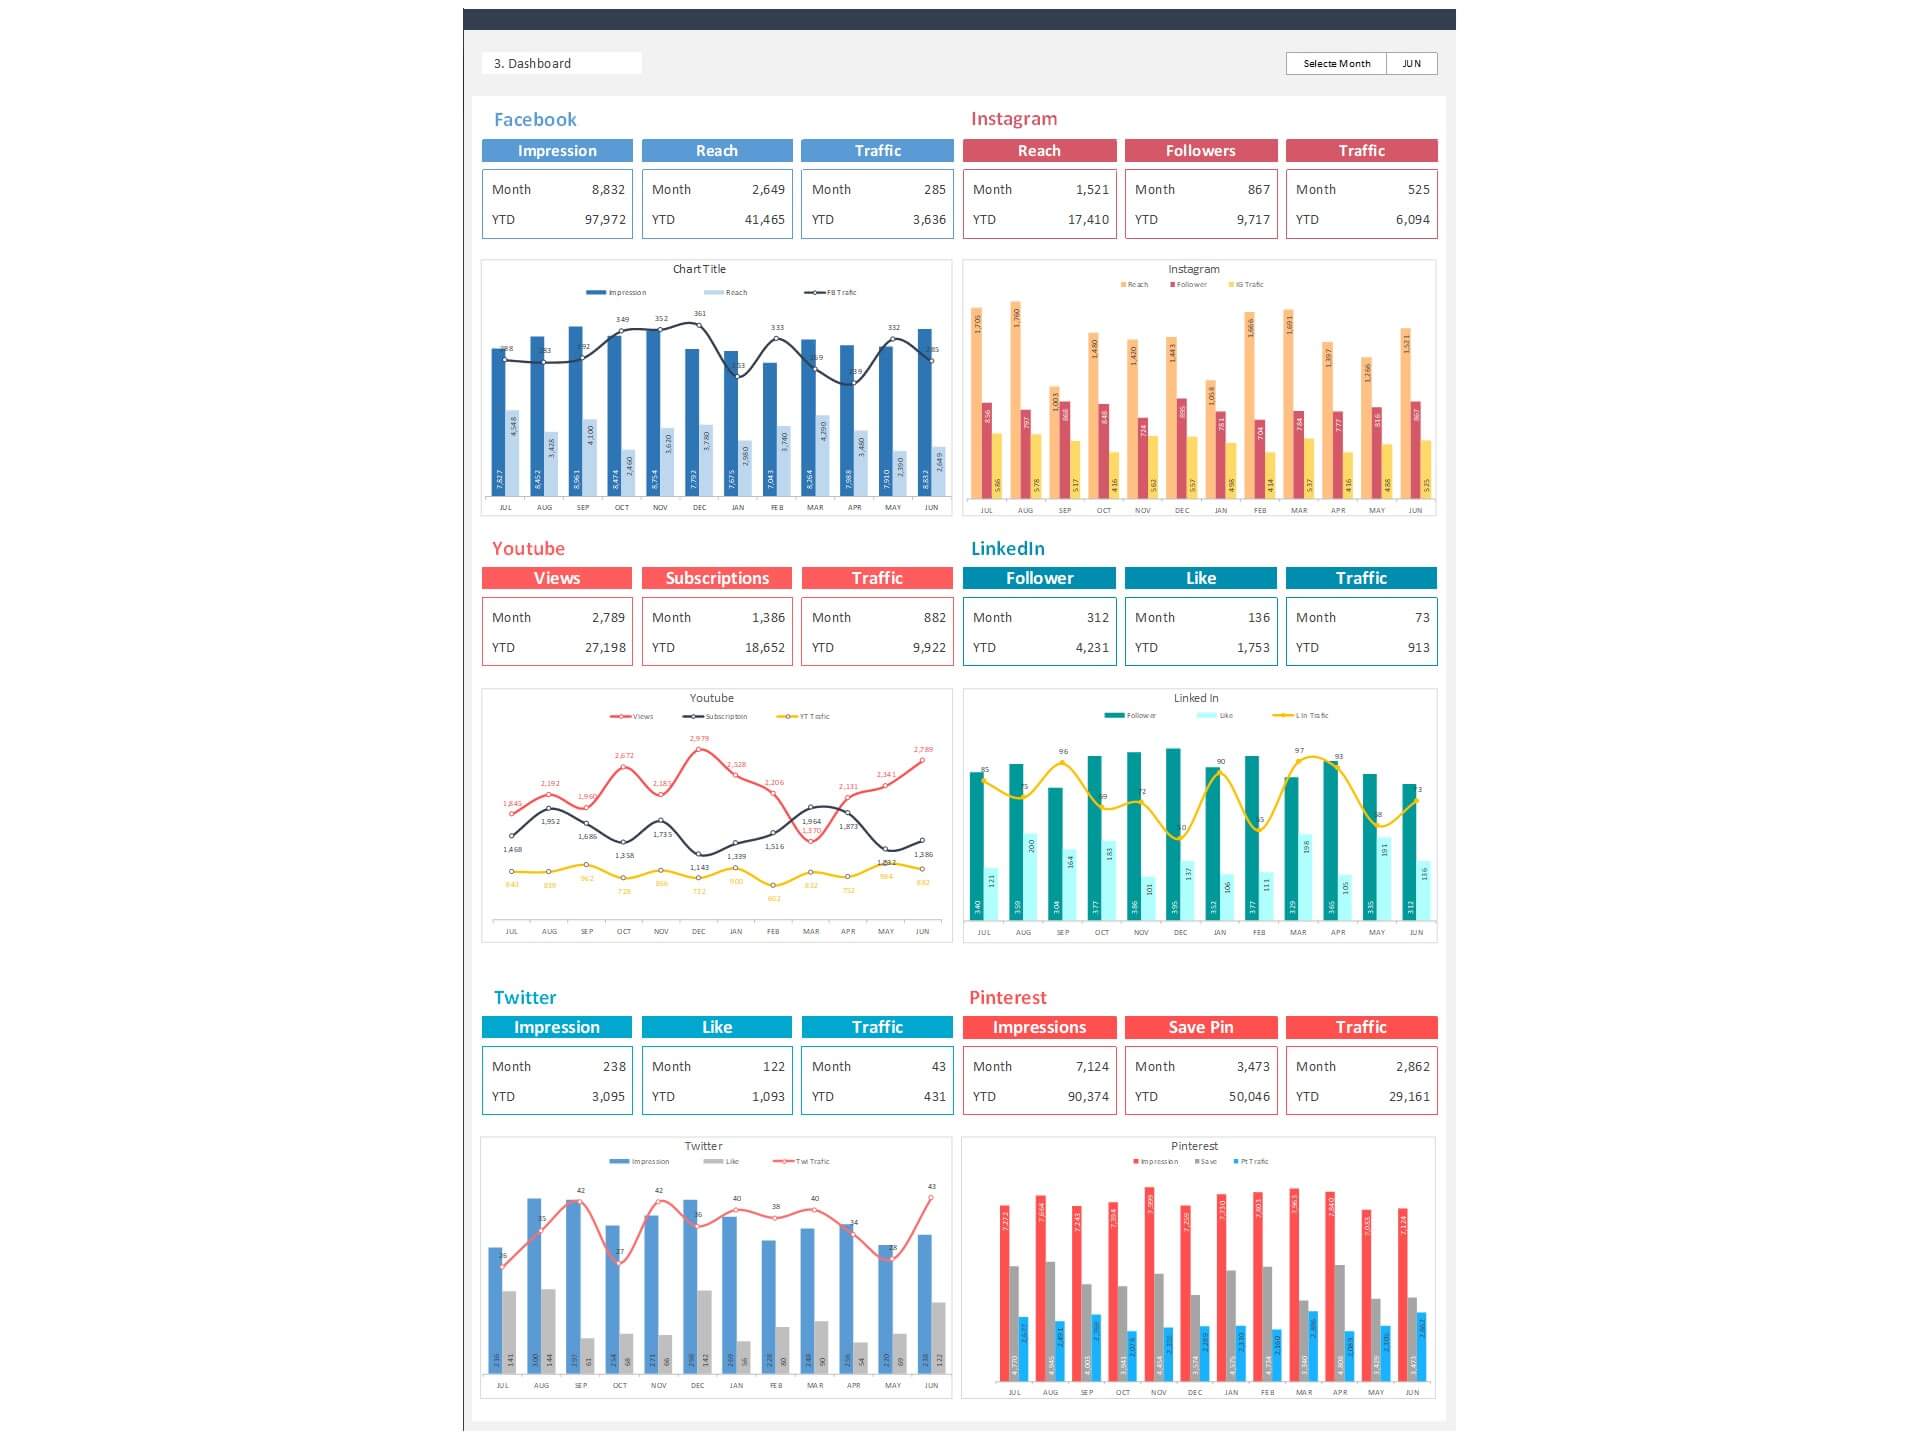
- Provides key sales insights for the CEO and sales team with details of total sales, sales by product/category, sales by channel, profitability, and receivables
- Quickly and easily communicate to salespersons
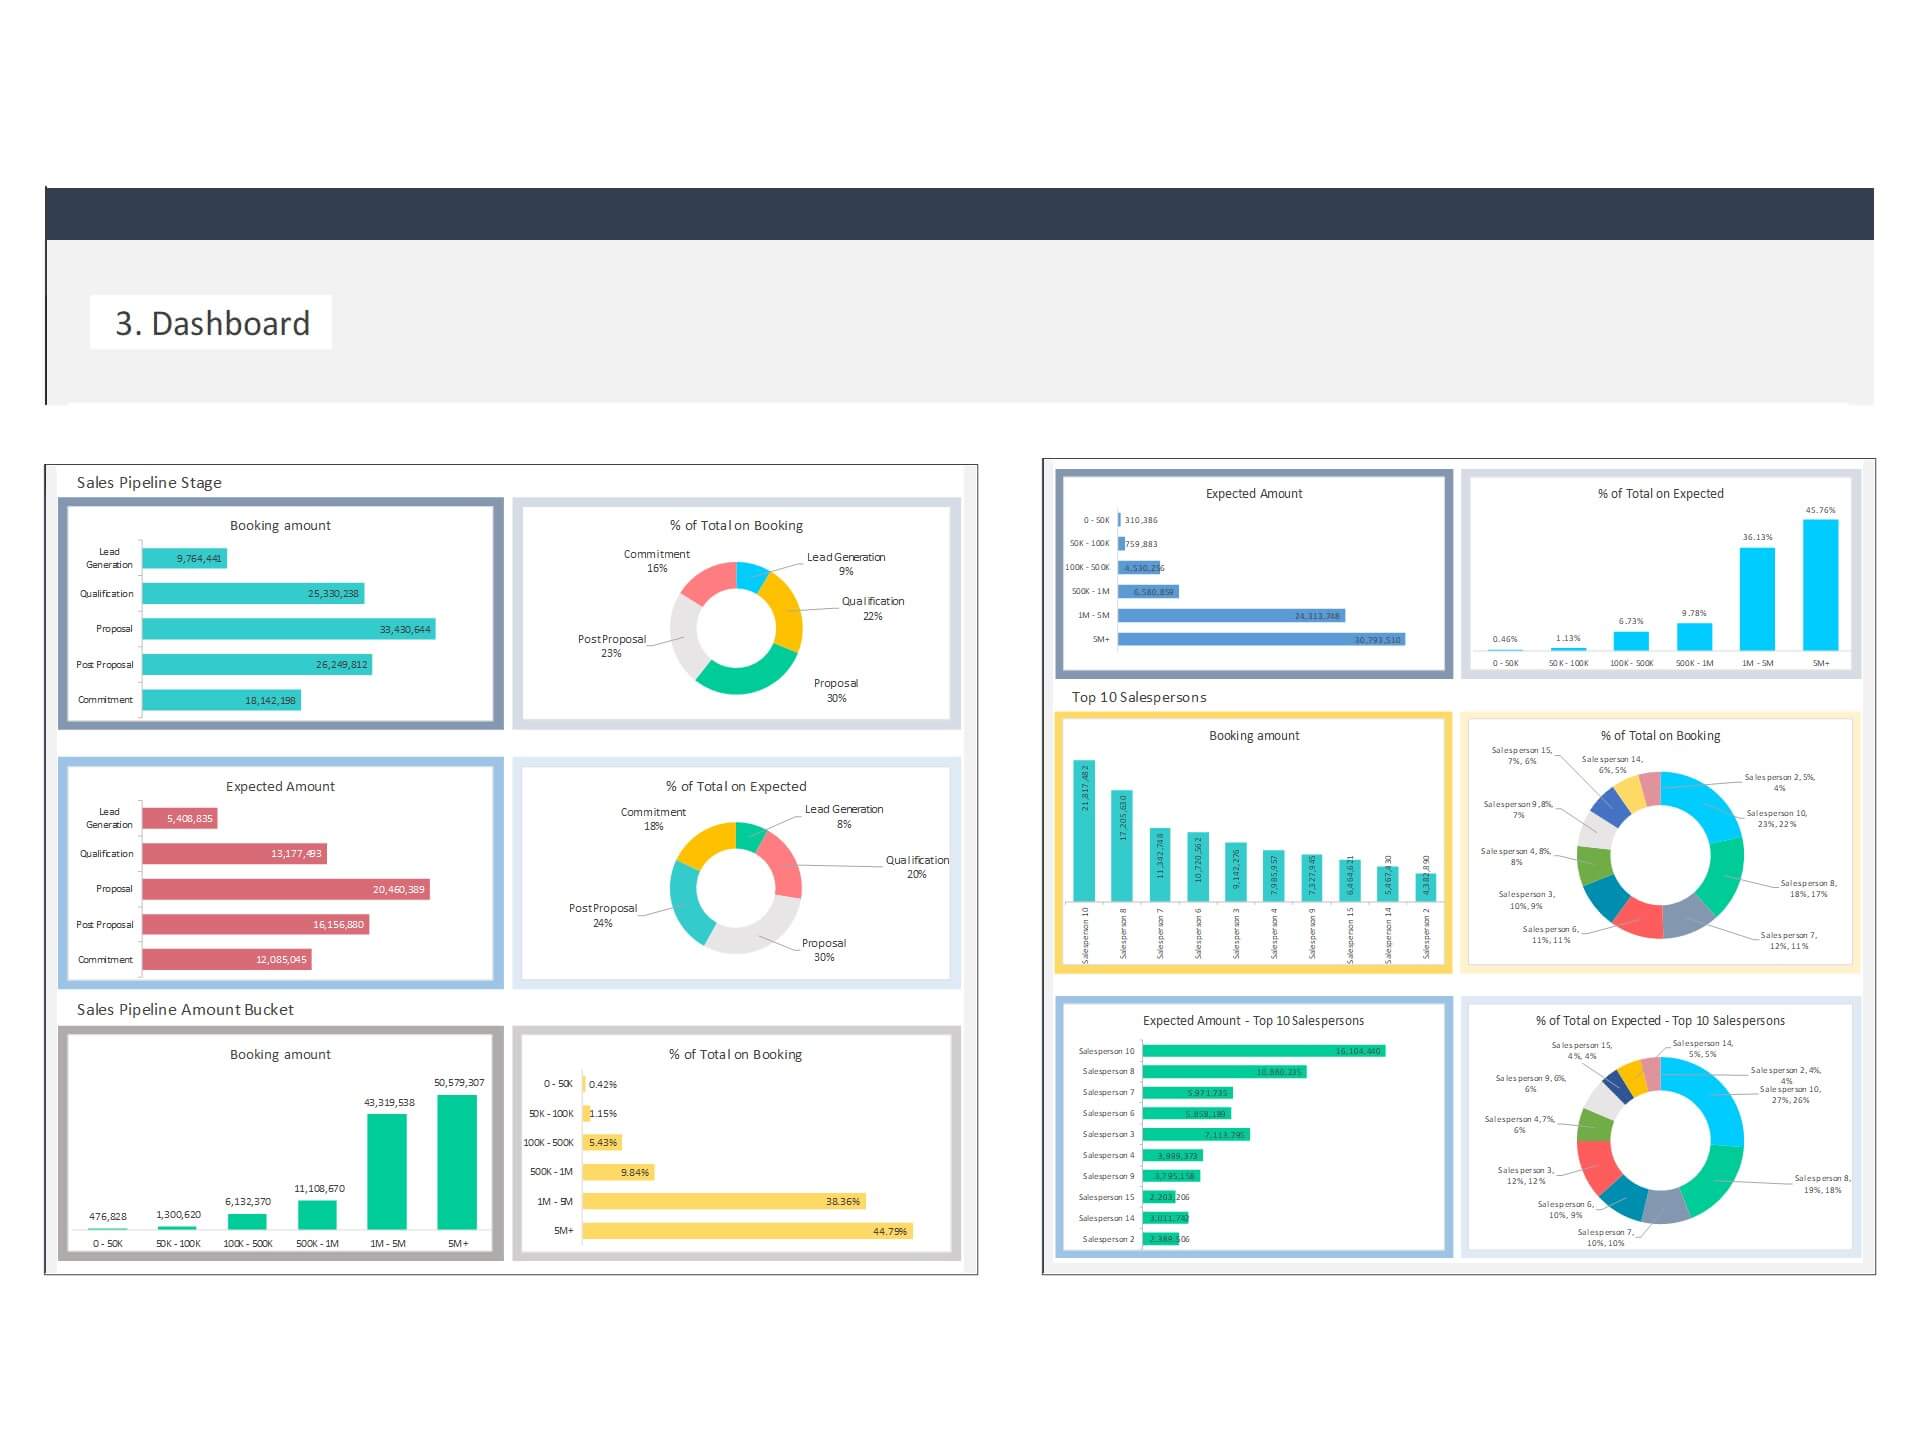
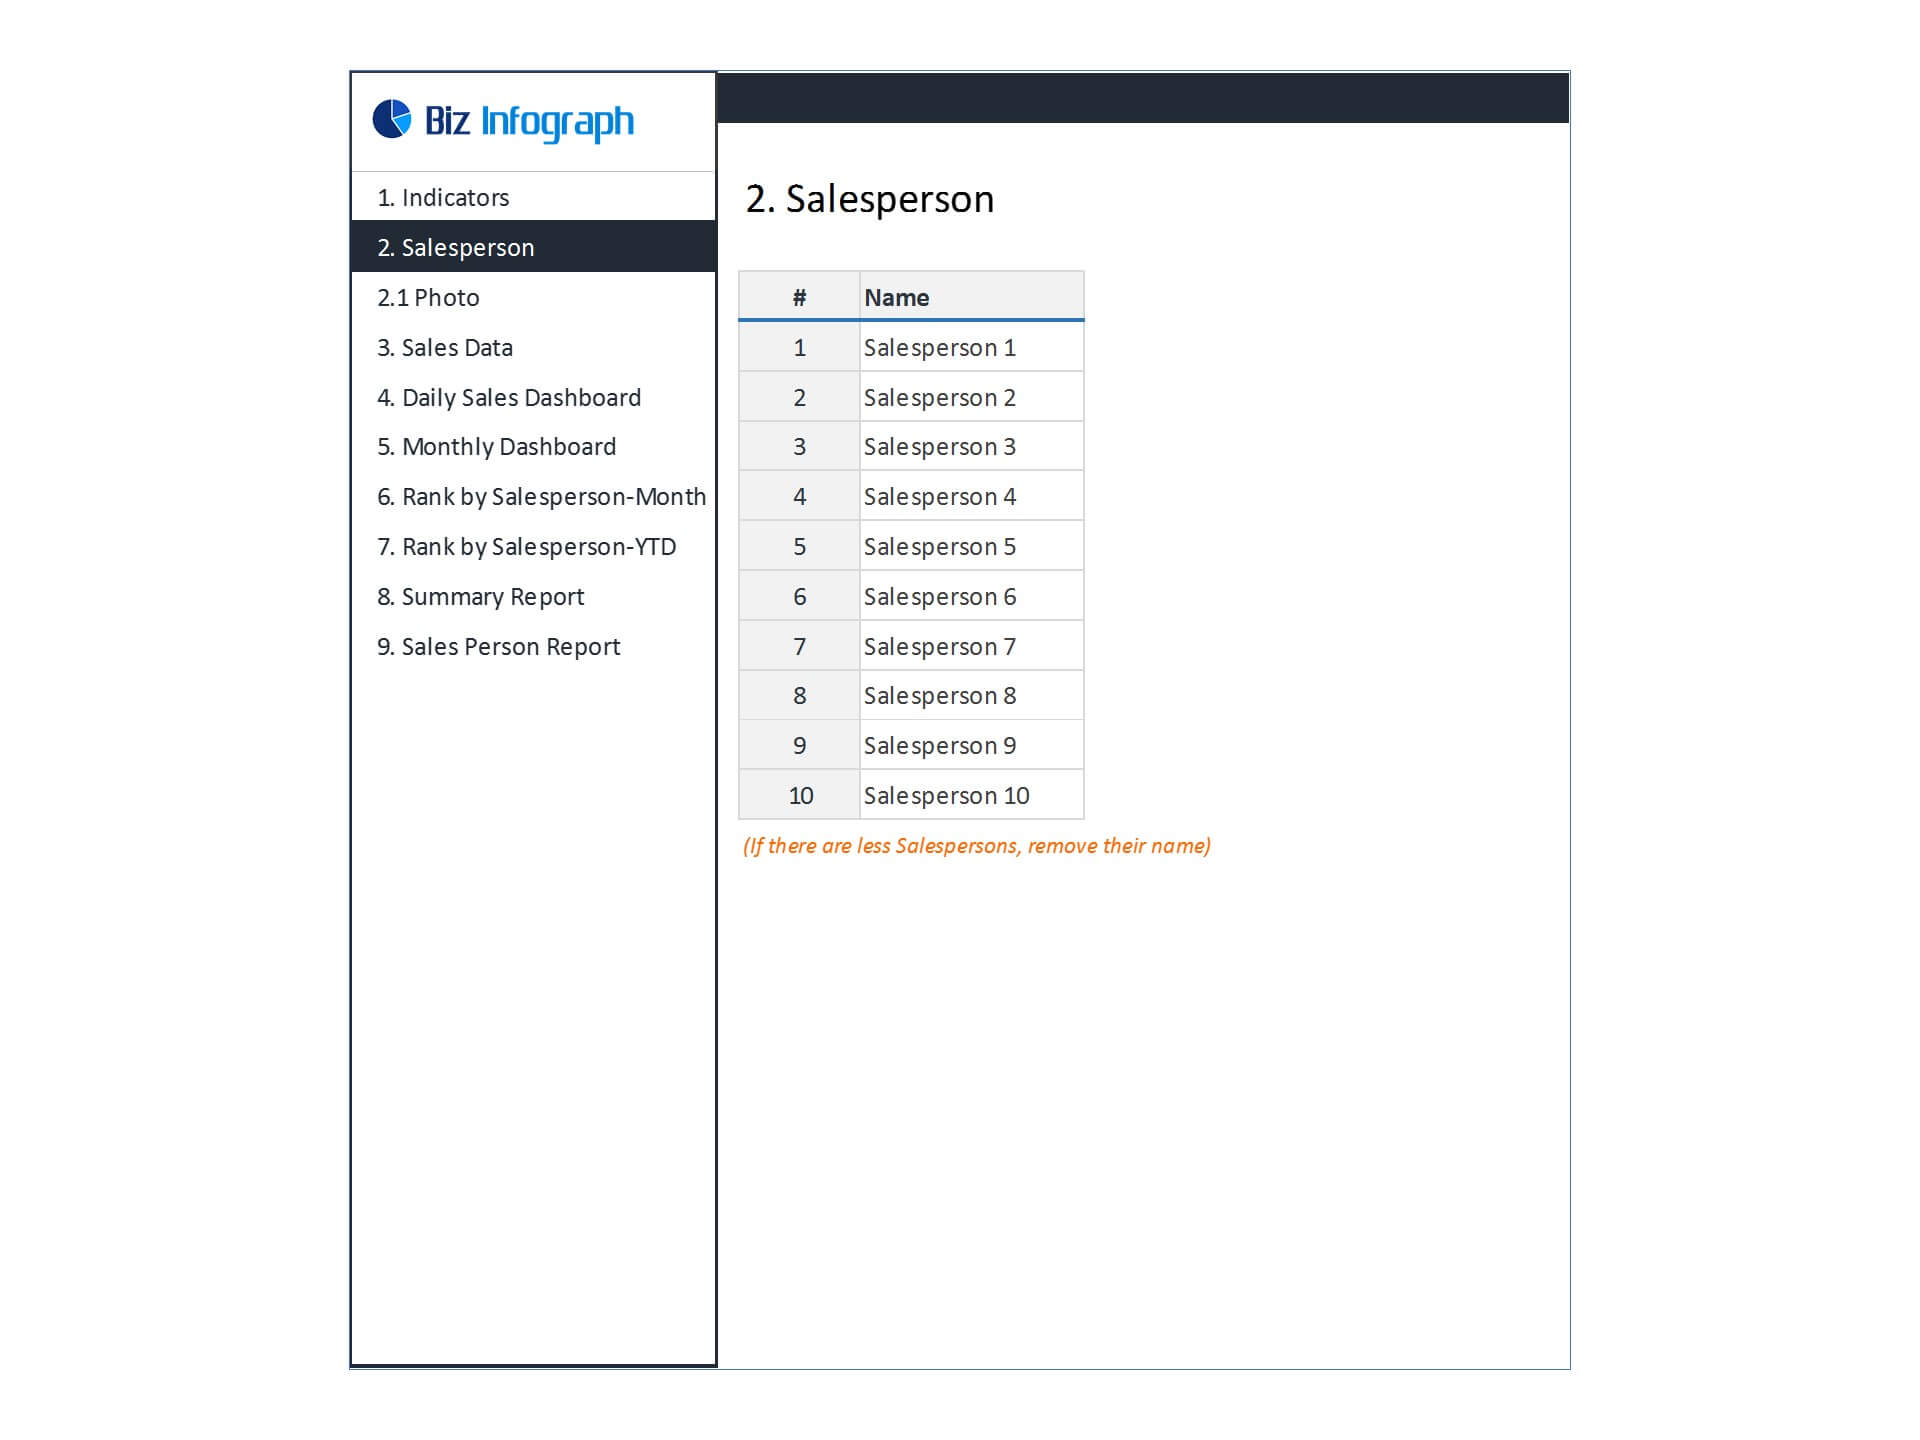
- Flexibility to add up to 20 salespersons data in the template
- Visualize overall sales performance
- Fully editable, easy to use, template with sample data
- Eye-catching design and customizable
- Change the sample data with your data
- Spreadsheets ready for printing without Biz Infograph logo
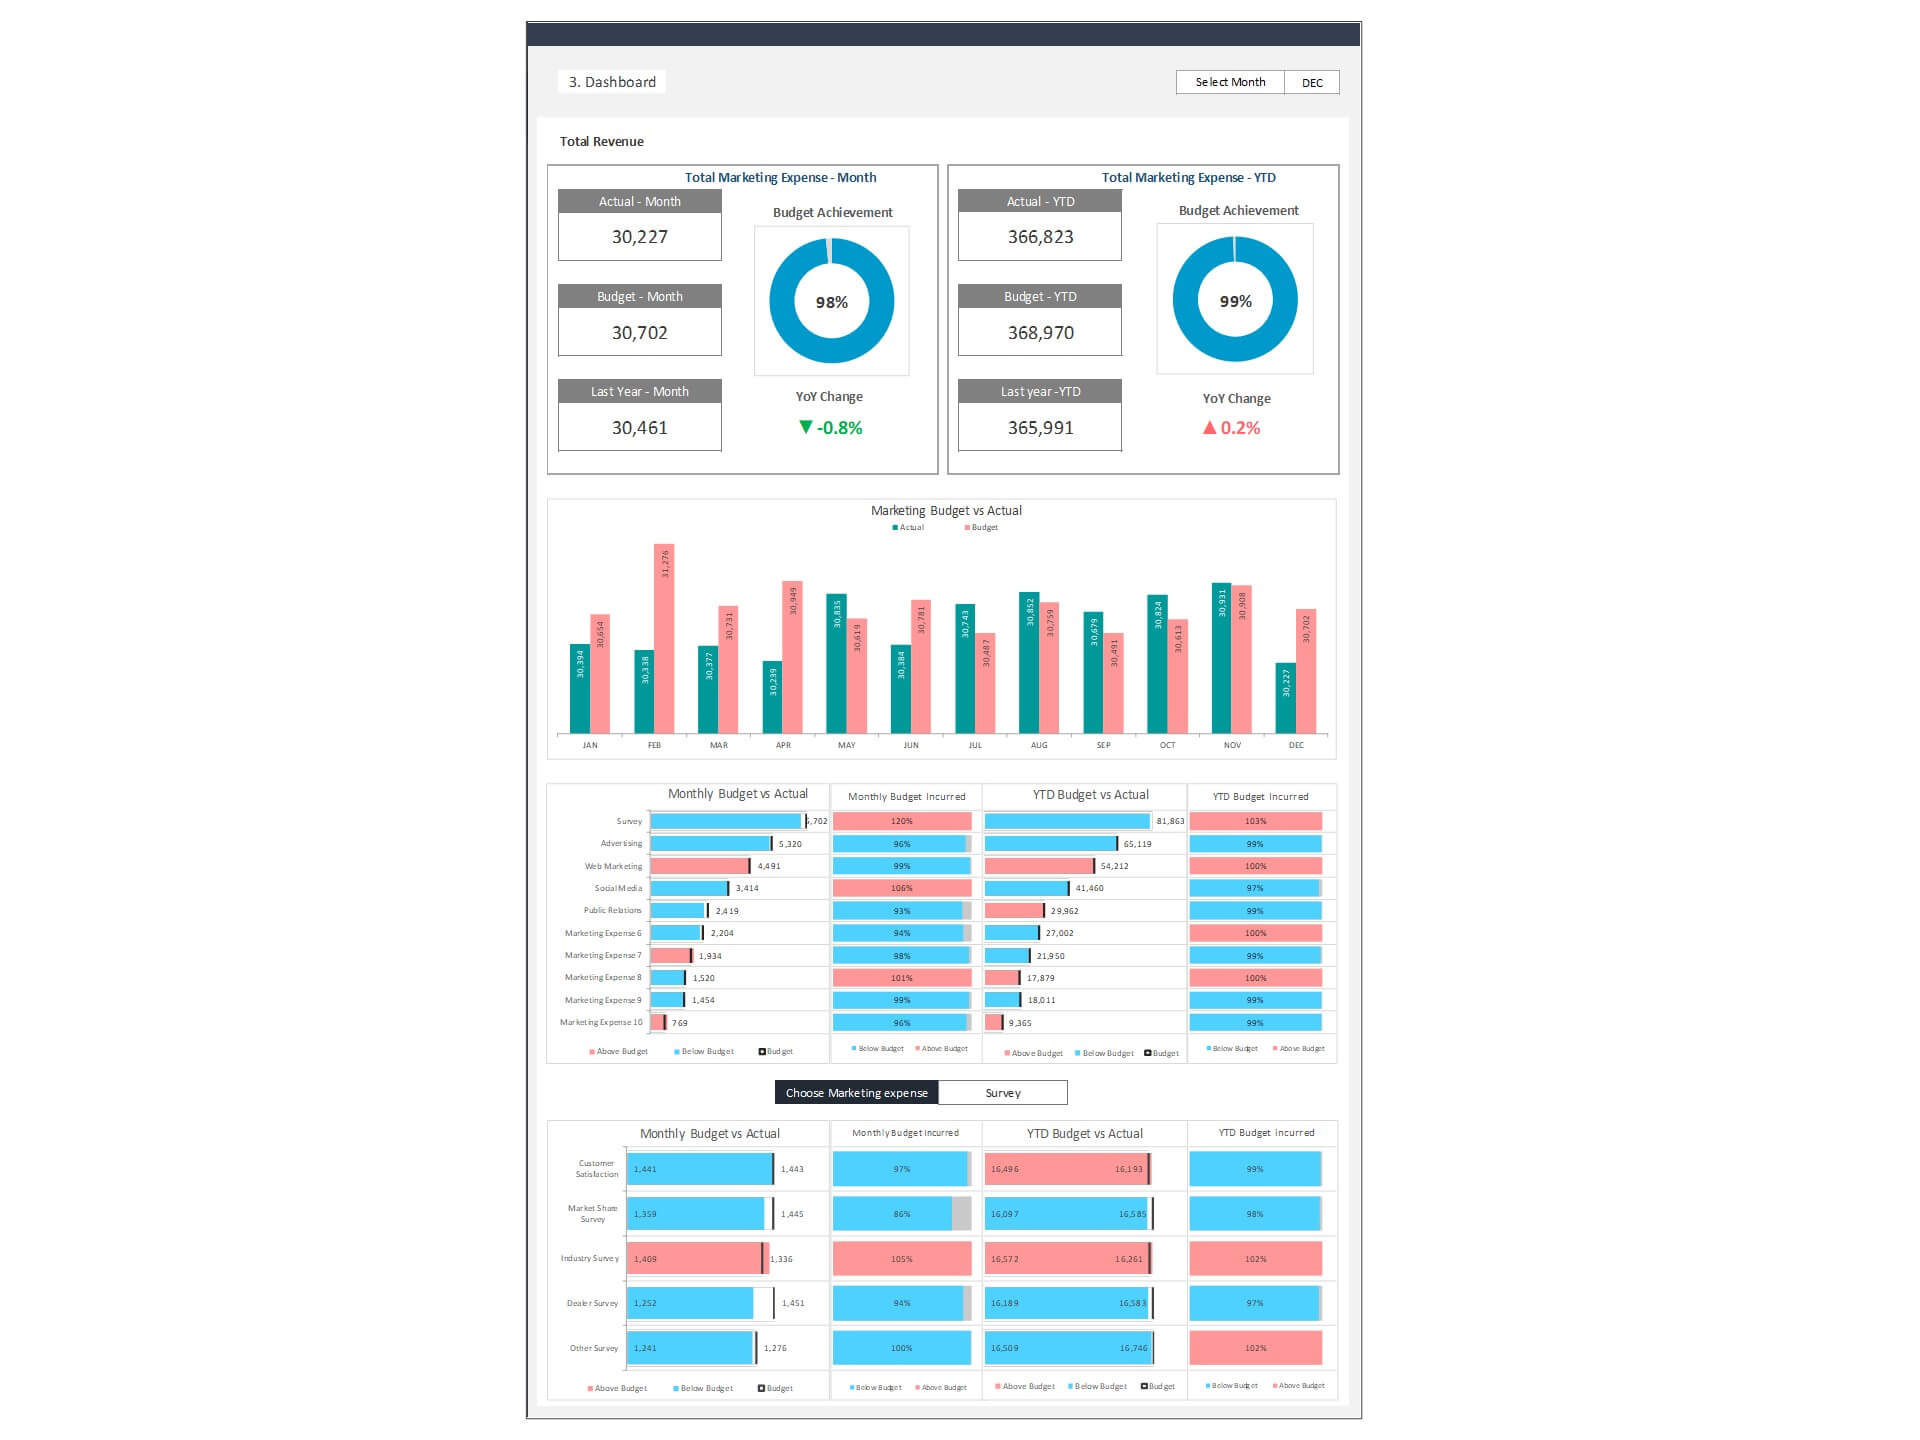
- Consolidate key financial performance indicators in one dashboard
- No monthly fees
- Immediate download
- No VBA, no Macro
- No installation necessary
- Professionally designed
What is included in this dashboard template?
- Just plug your data, the dashboard will be ready instantly and start using.
- A text file which contains a password to view and edit the formula
- A guide to unlocking all the elements in the dashboard
Professional Support:
- Video tutorial guide on how to navigate and use the Sales Tracking Dashboard Template
- Professional service to customize dashboard template in excel as per business need
- Help and support in post-purchase
- Payment secured by Stripe and PayPal (no PayPal account needed)
A brief guide to using the dashboard template:
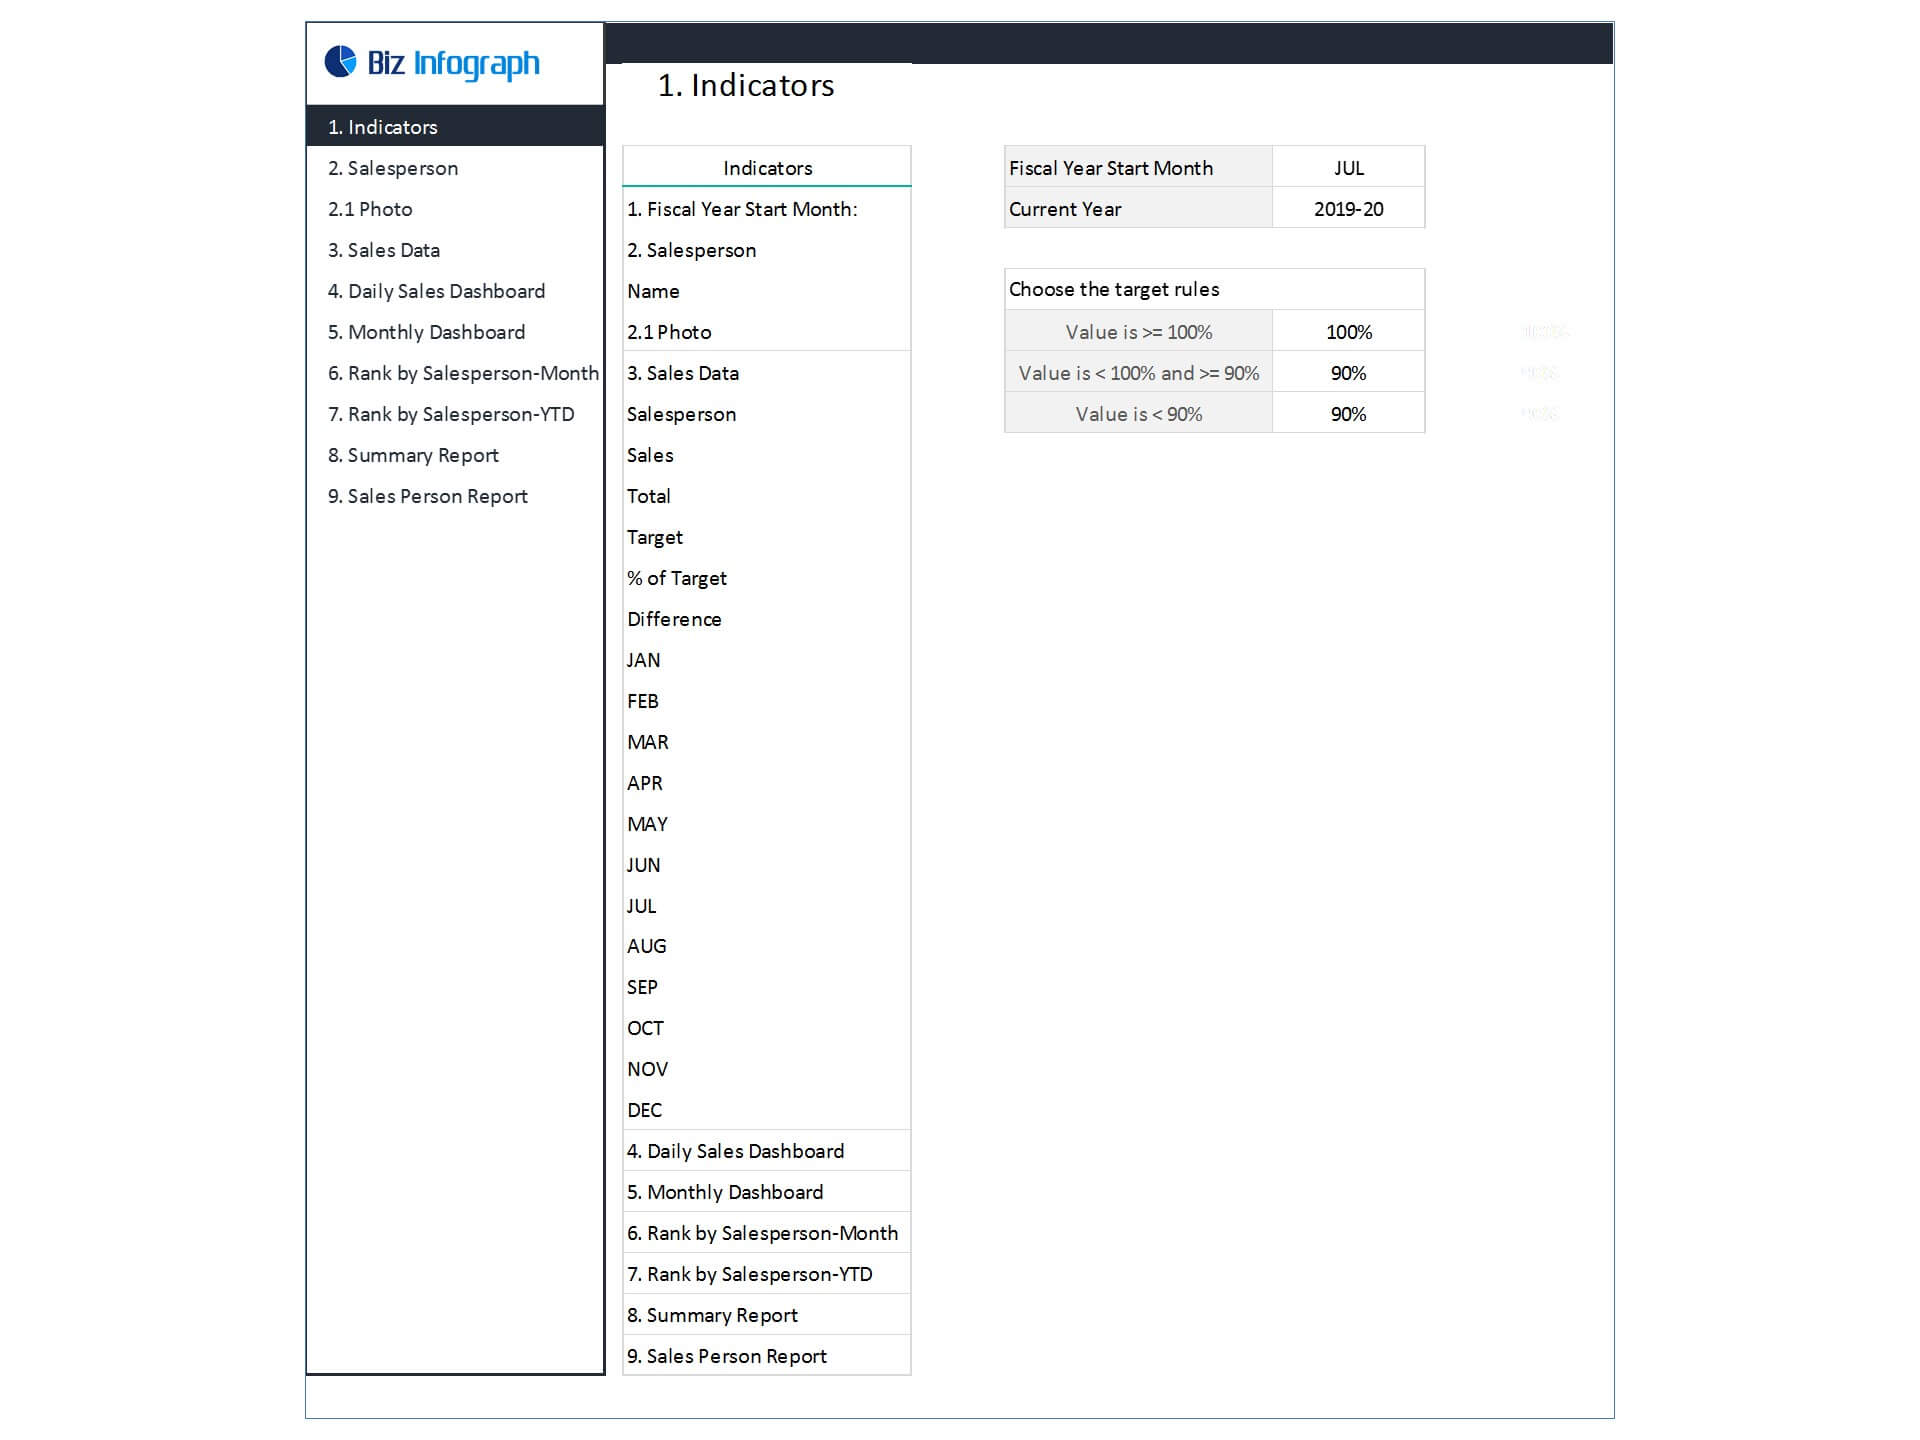
- Open the dashboard template
- Go to ‘Indicators’ menu – choose the start month of the fiscal year (i.e. Jan, Feb, Jul, etc.)
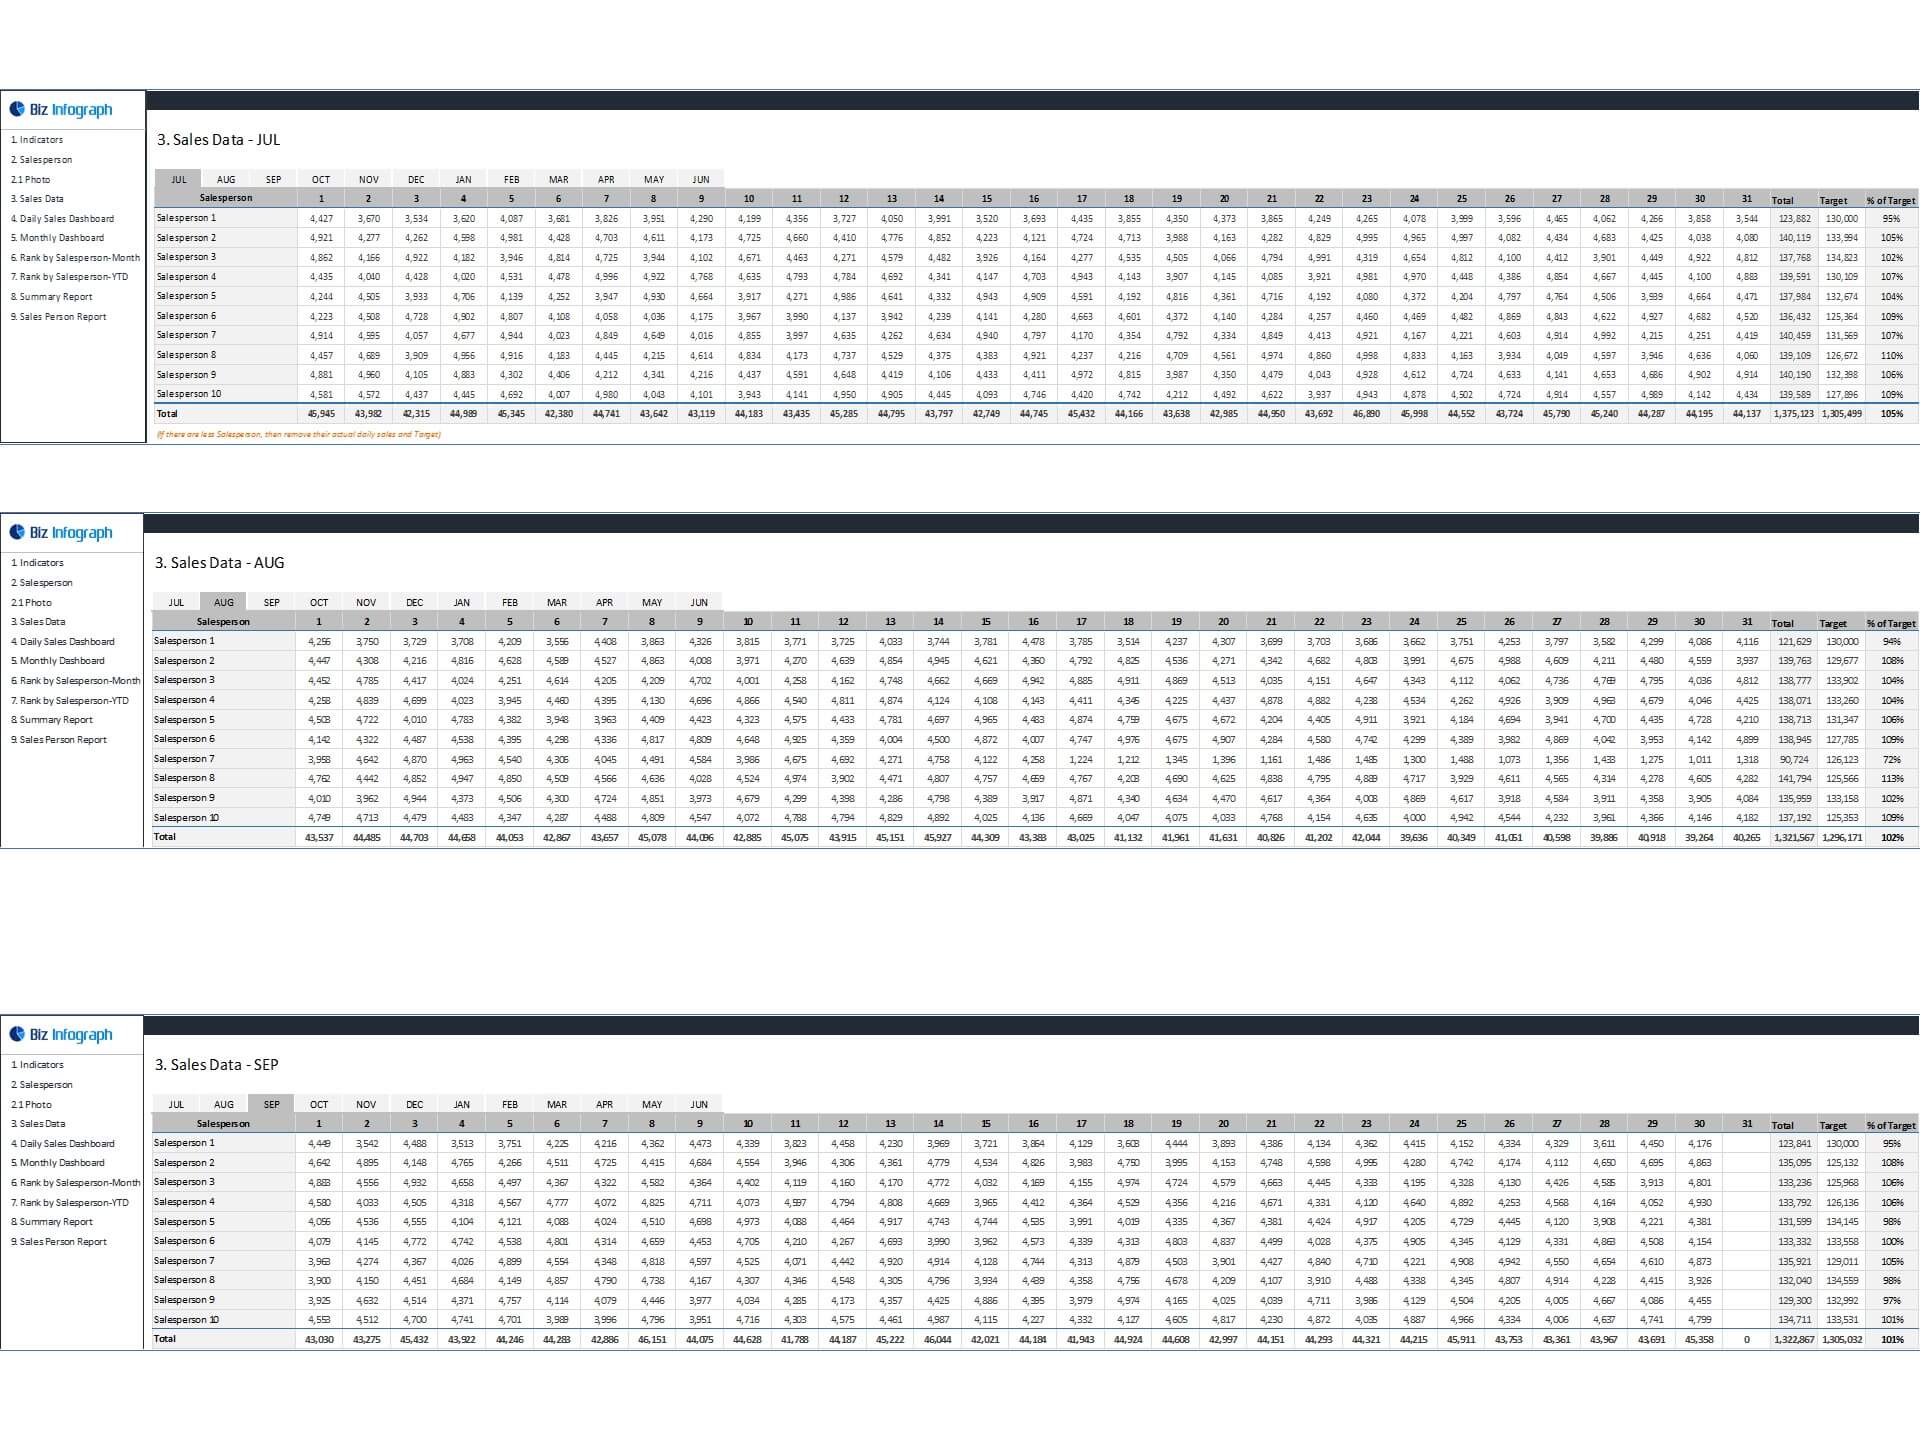
- Go to the ‘Enter Data’ menu – remove the sample data and give your actual data in the respective cells. Formula cells are locked, and you cannot edit it without a password.
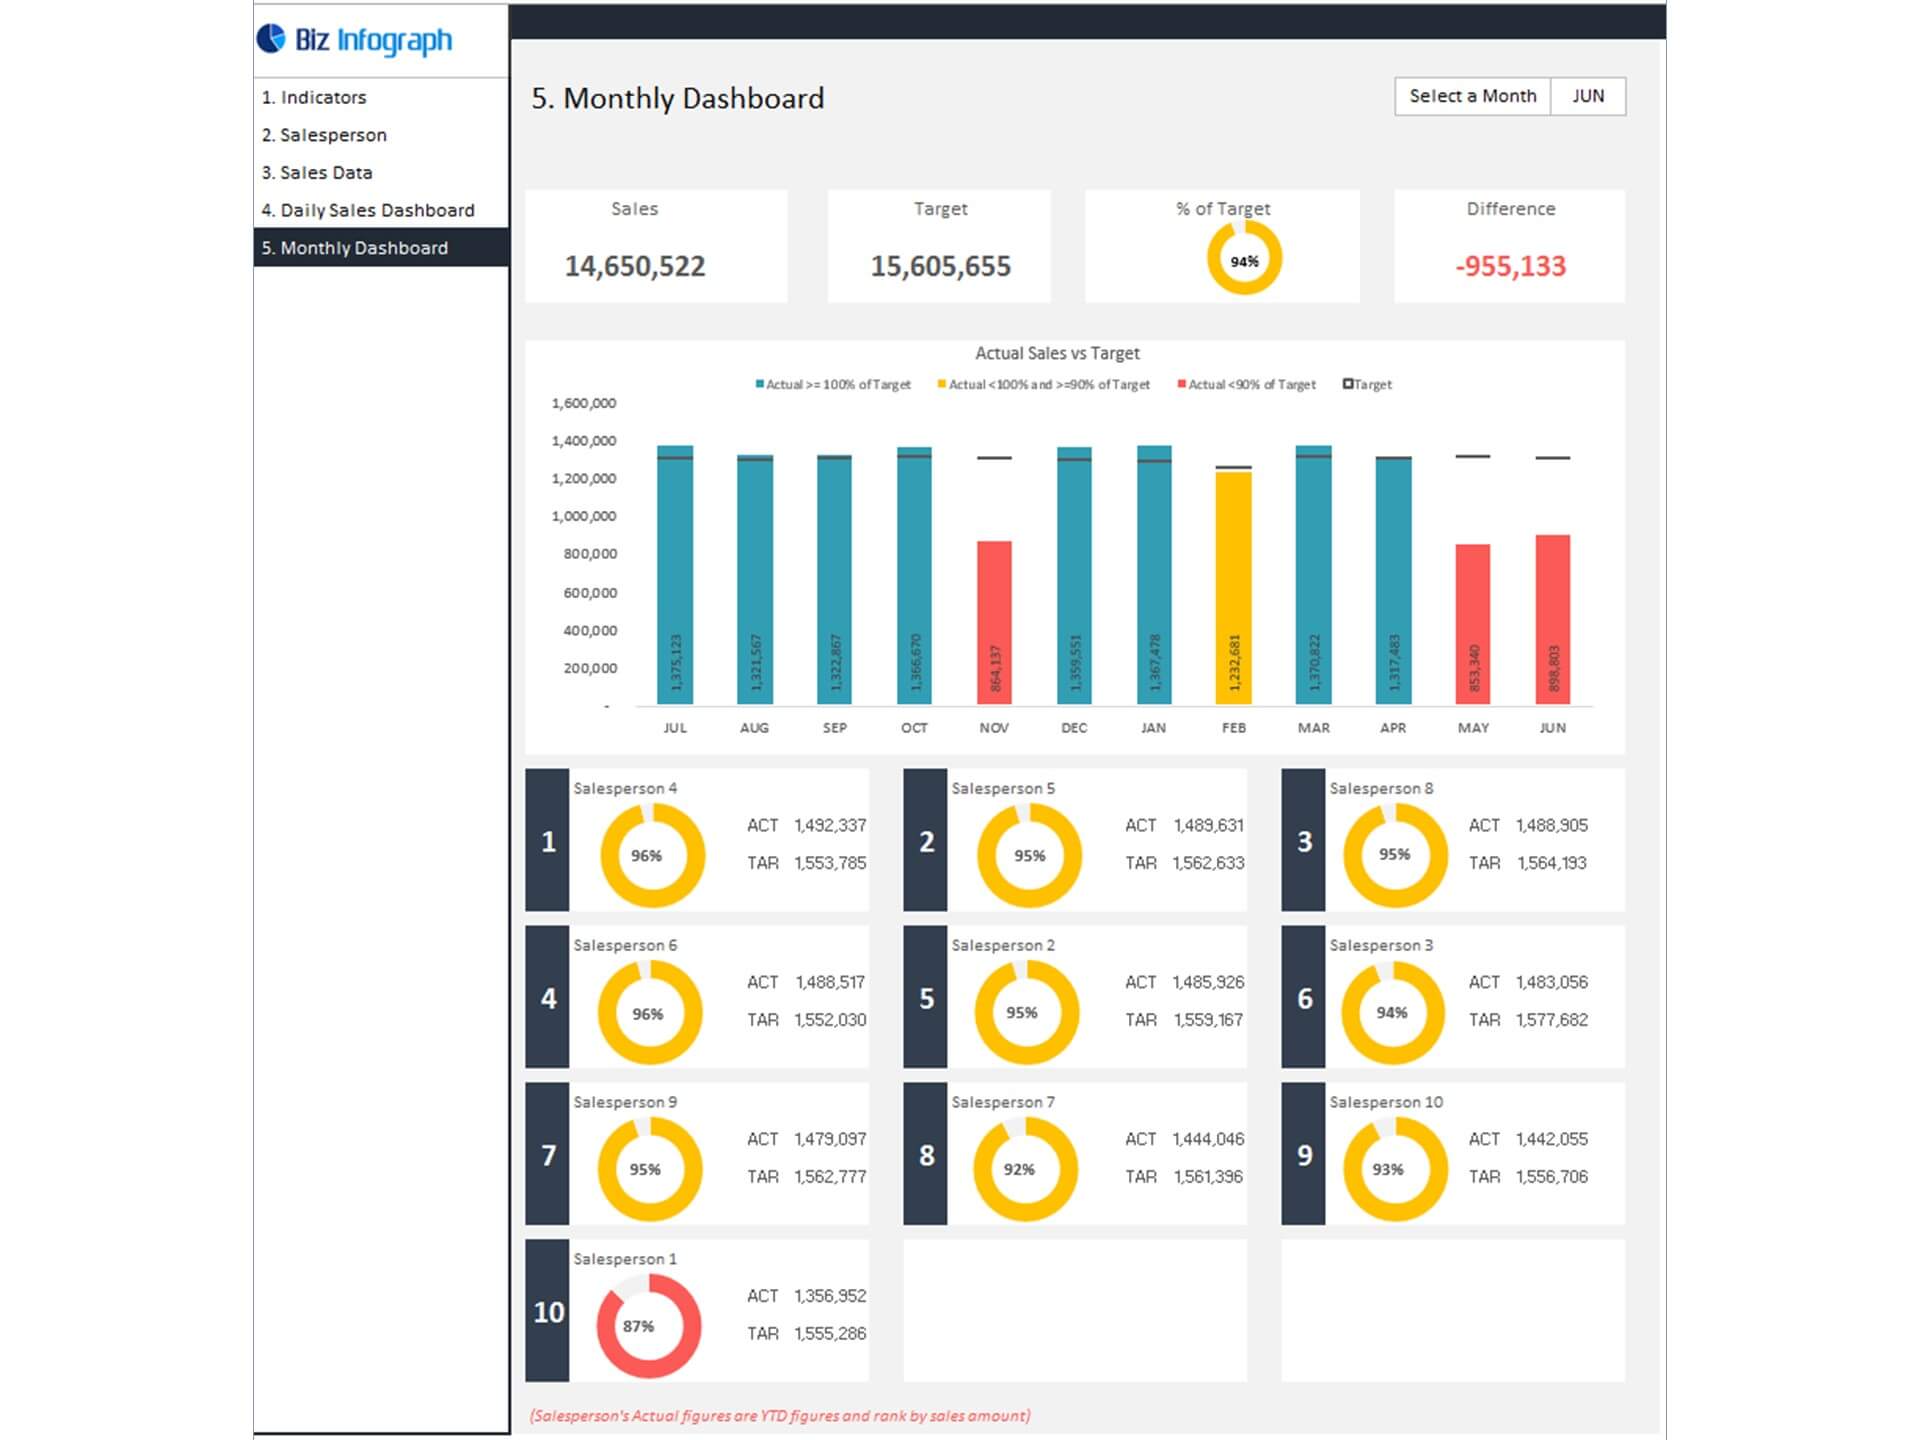
- Go to the ‘Monthly Dashboard’ menu – select the month name from the drop-down to see the monthly picture of performance indicators
- Go to ‘YTD Dashboard’ menu - select month name from the drop-down to see the year-to-date picture of performance indicators
- Each page is ready for printing – just press CTRL+P
This Excel dashboard template is password-protected to avoid mistakes, such as accidentally deleting formulas. When you completed the purchase, the password will be available.
For ready-to-use Dashboard Templates: