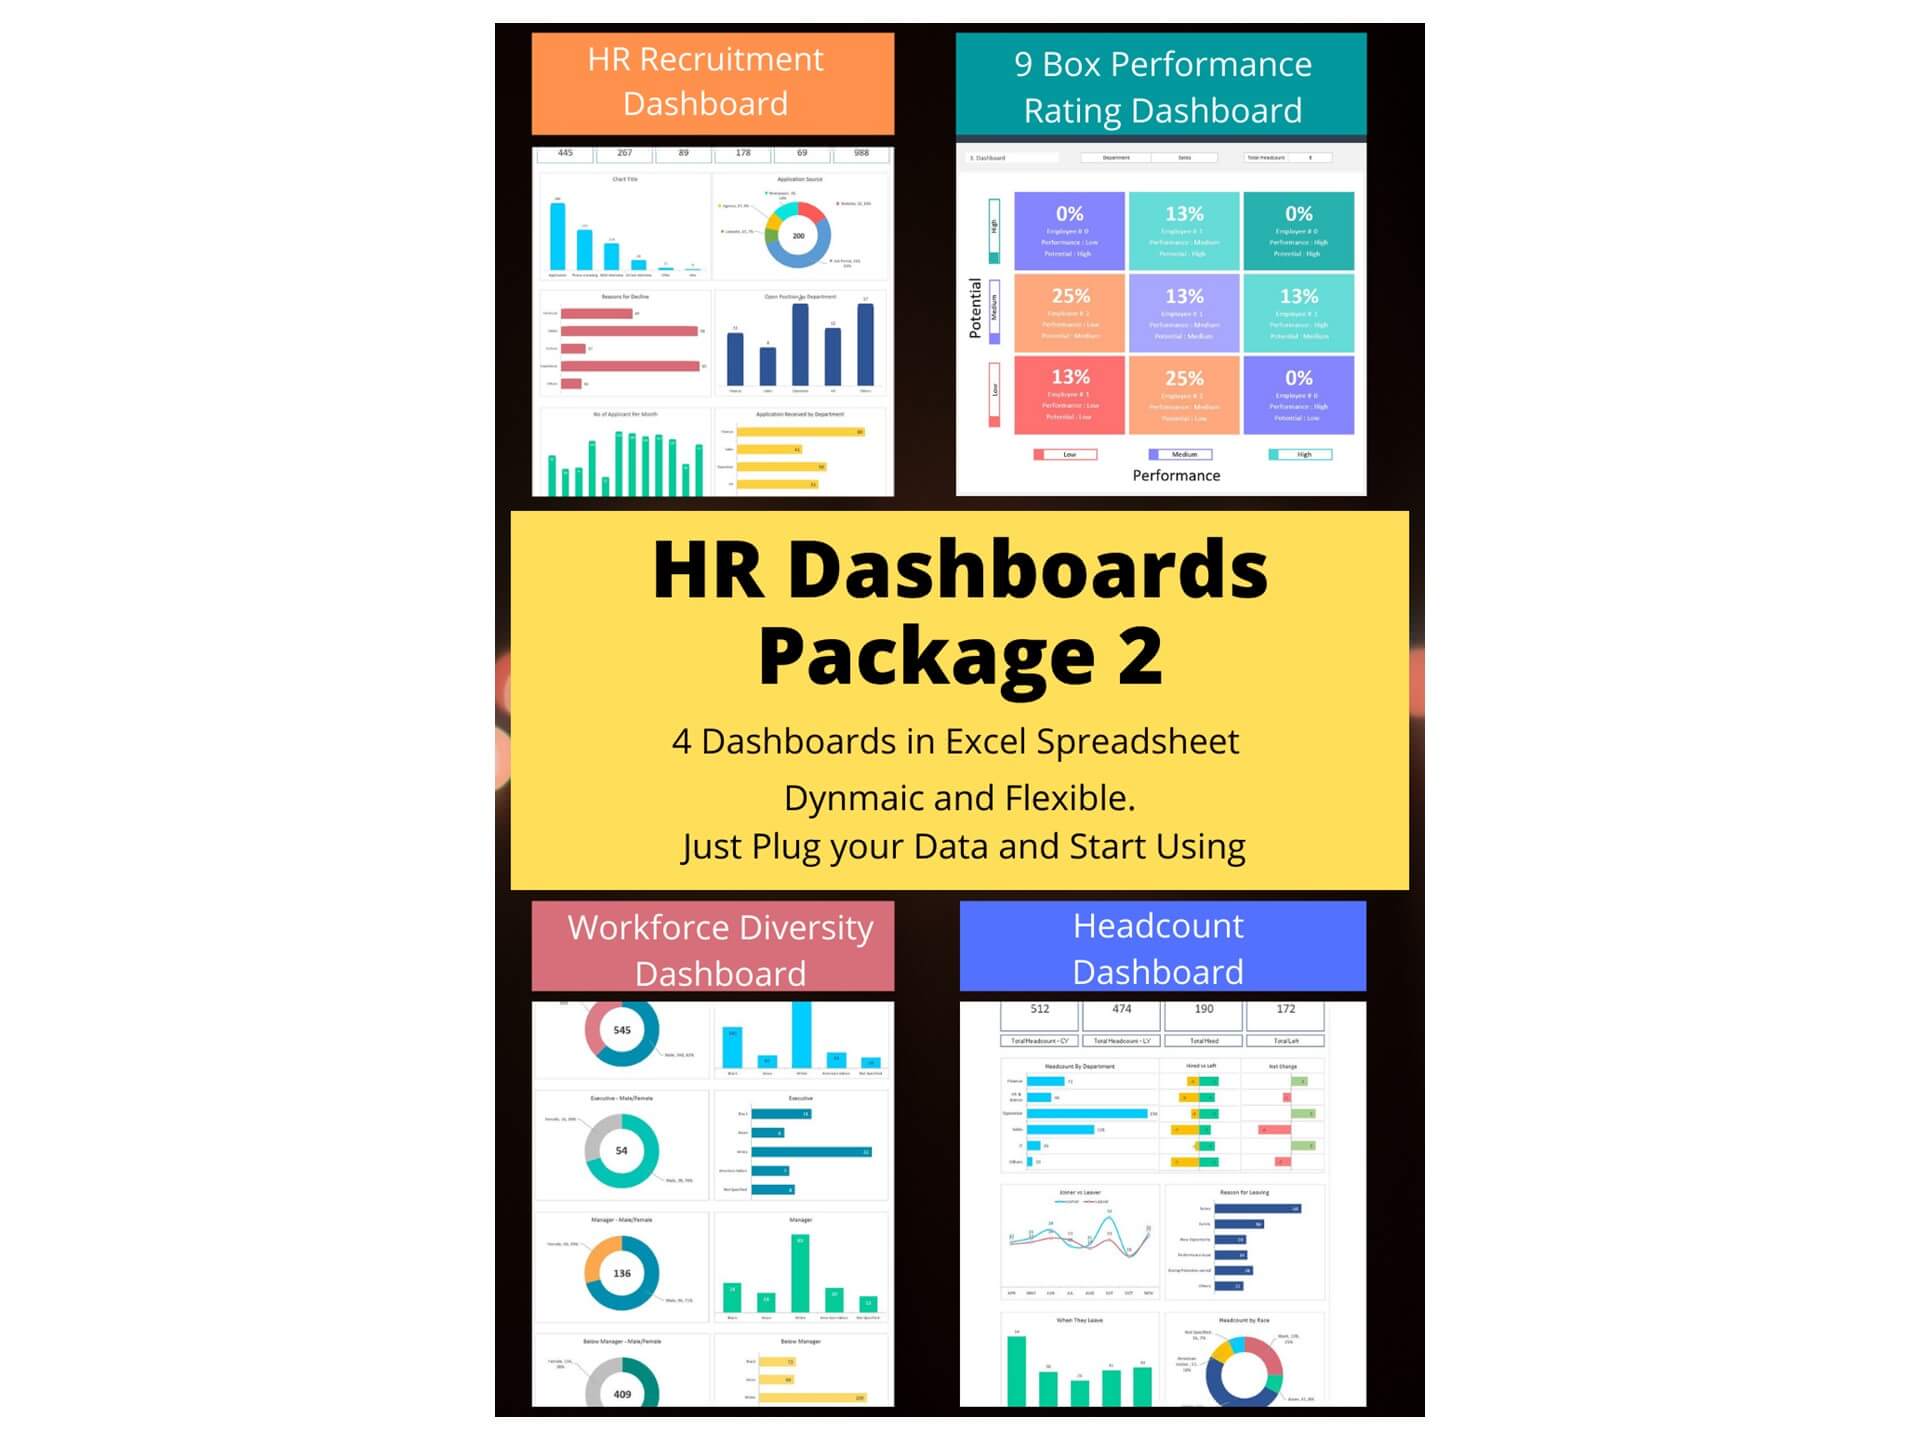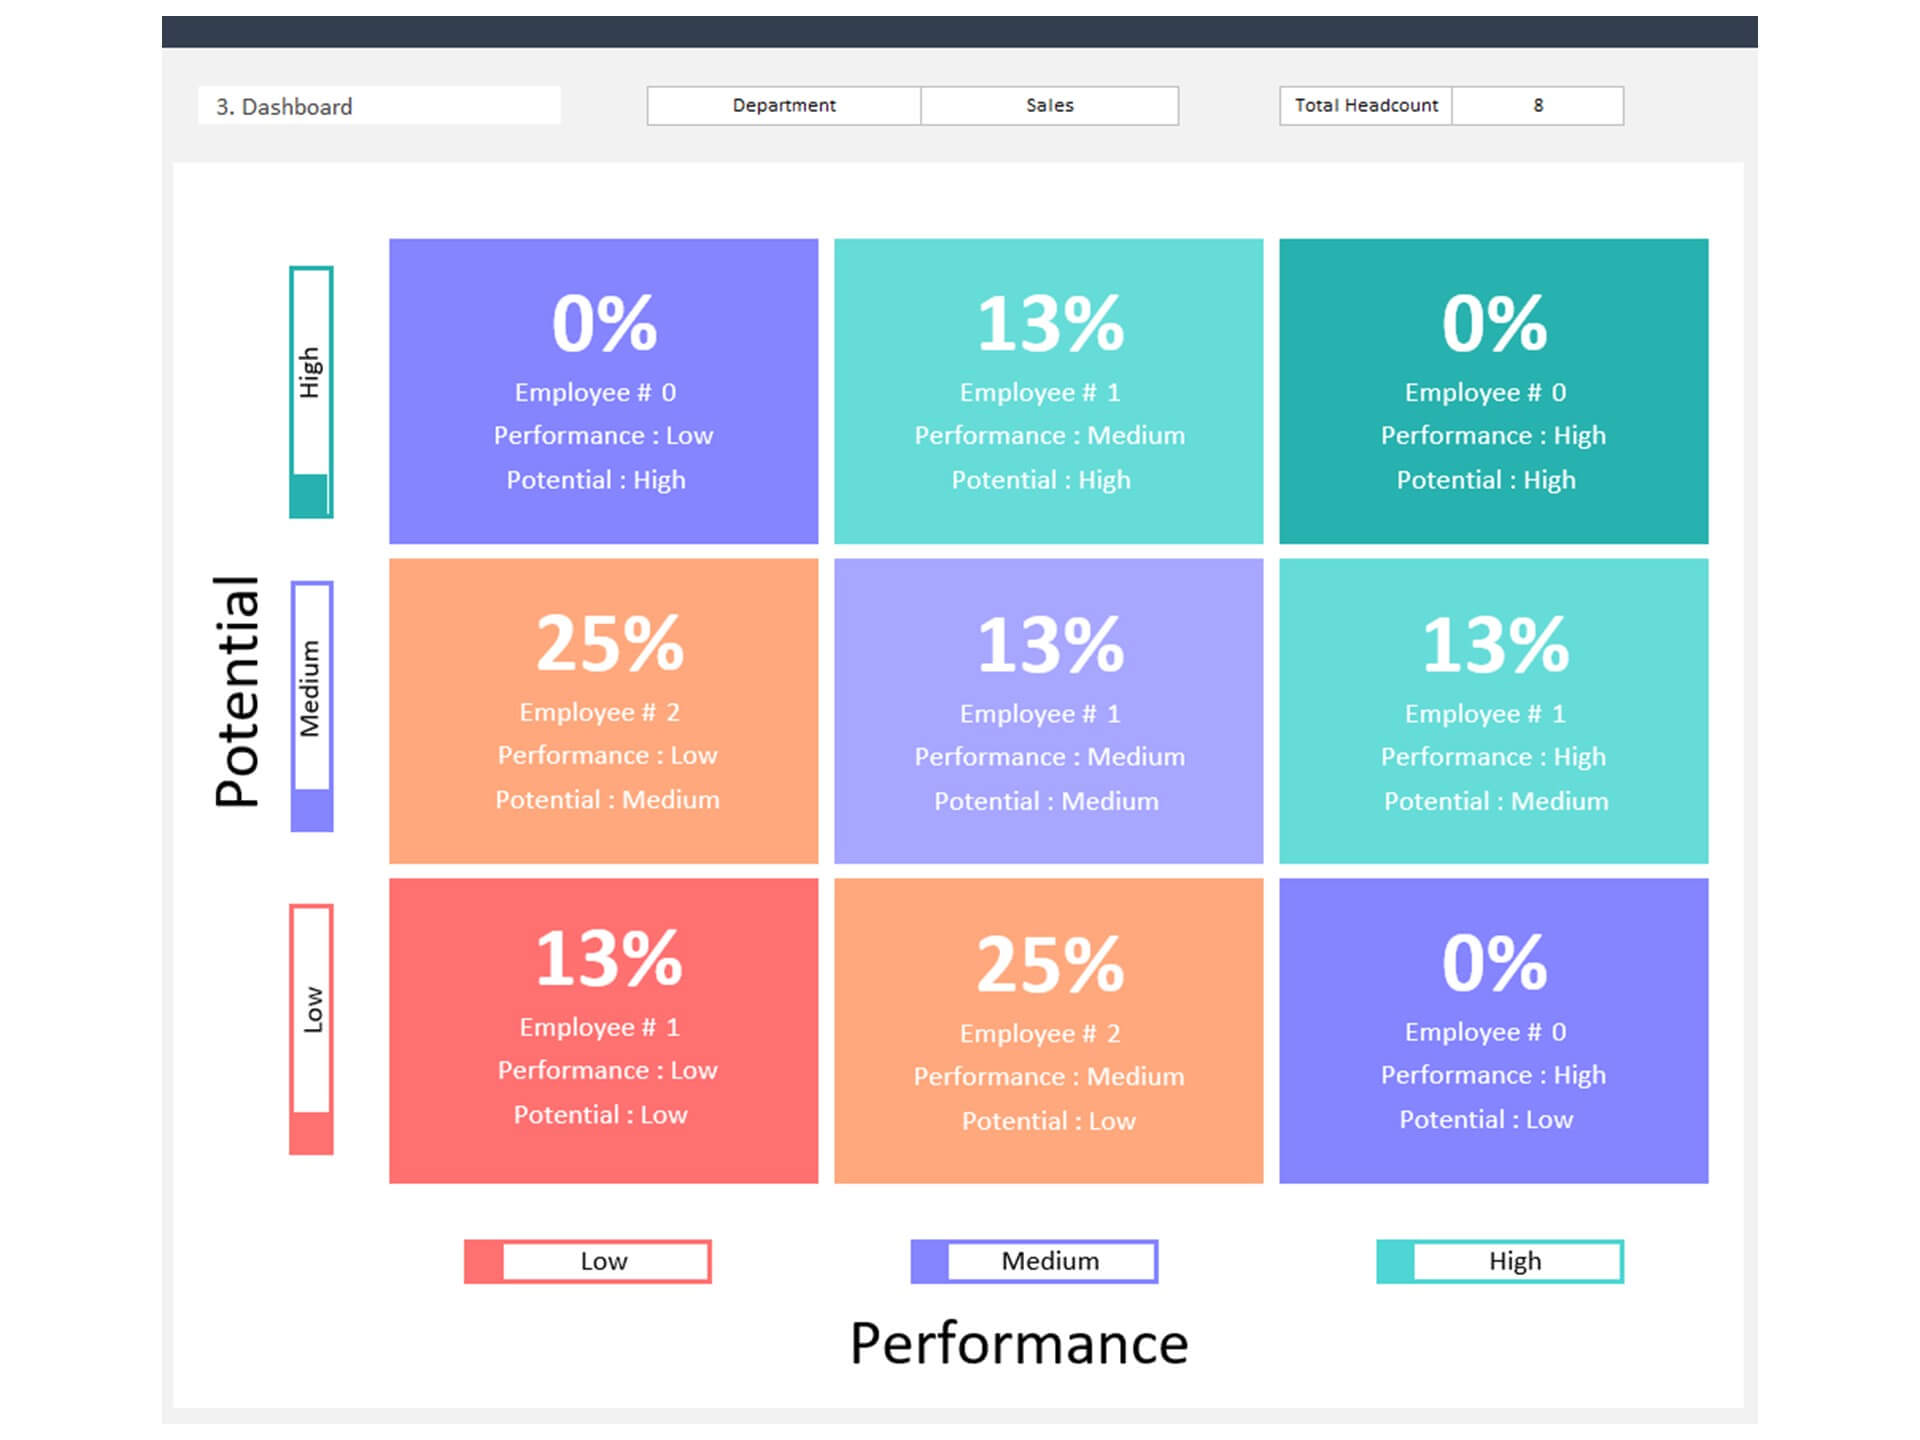
HR 9 Box Performance Rating Dashboard Excel Template and Google Sheets Template
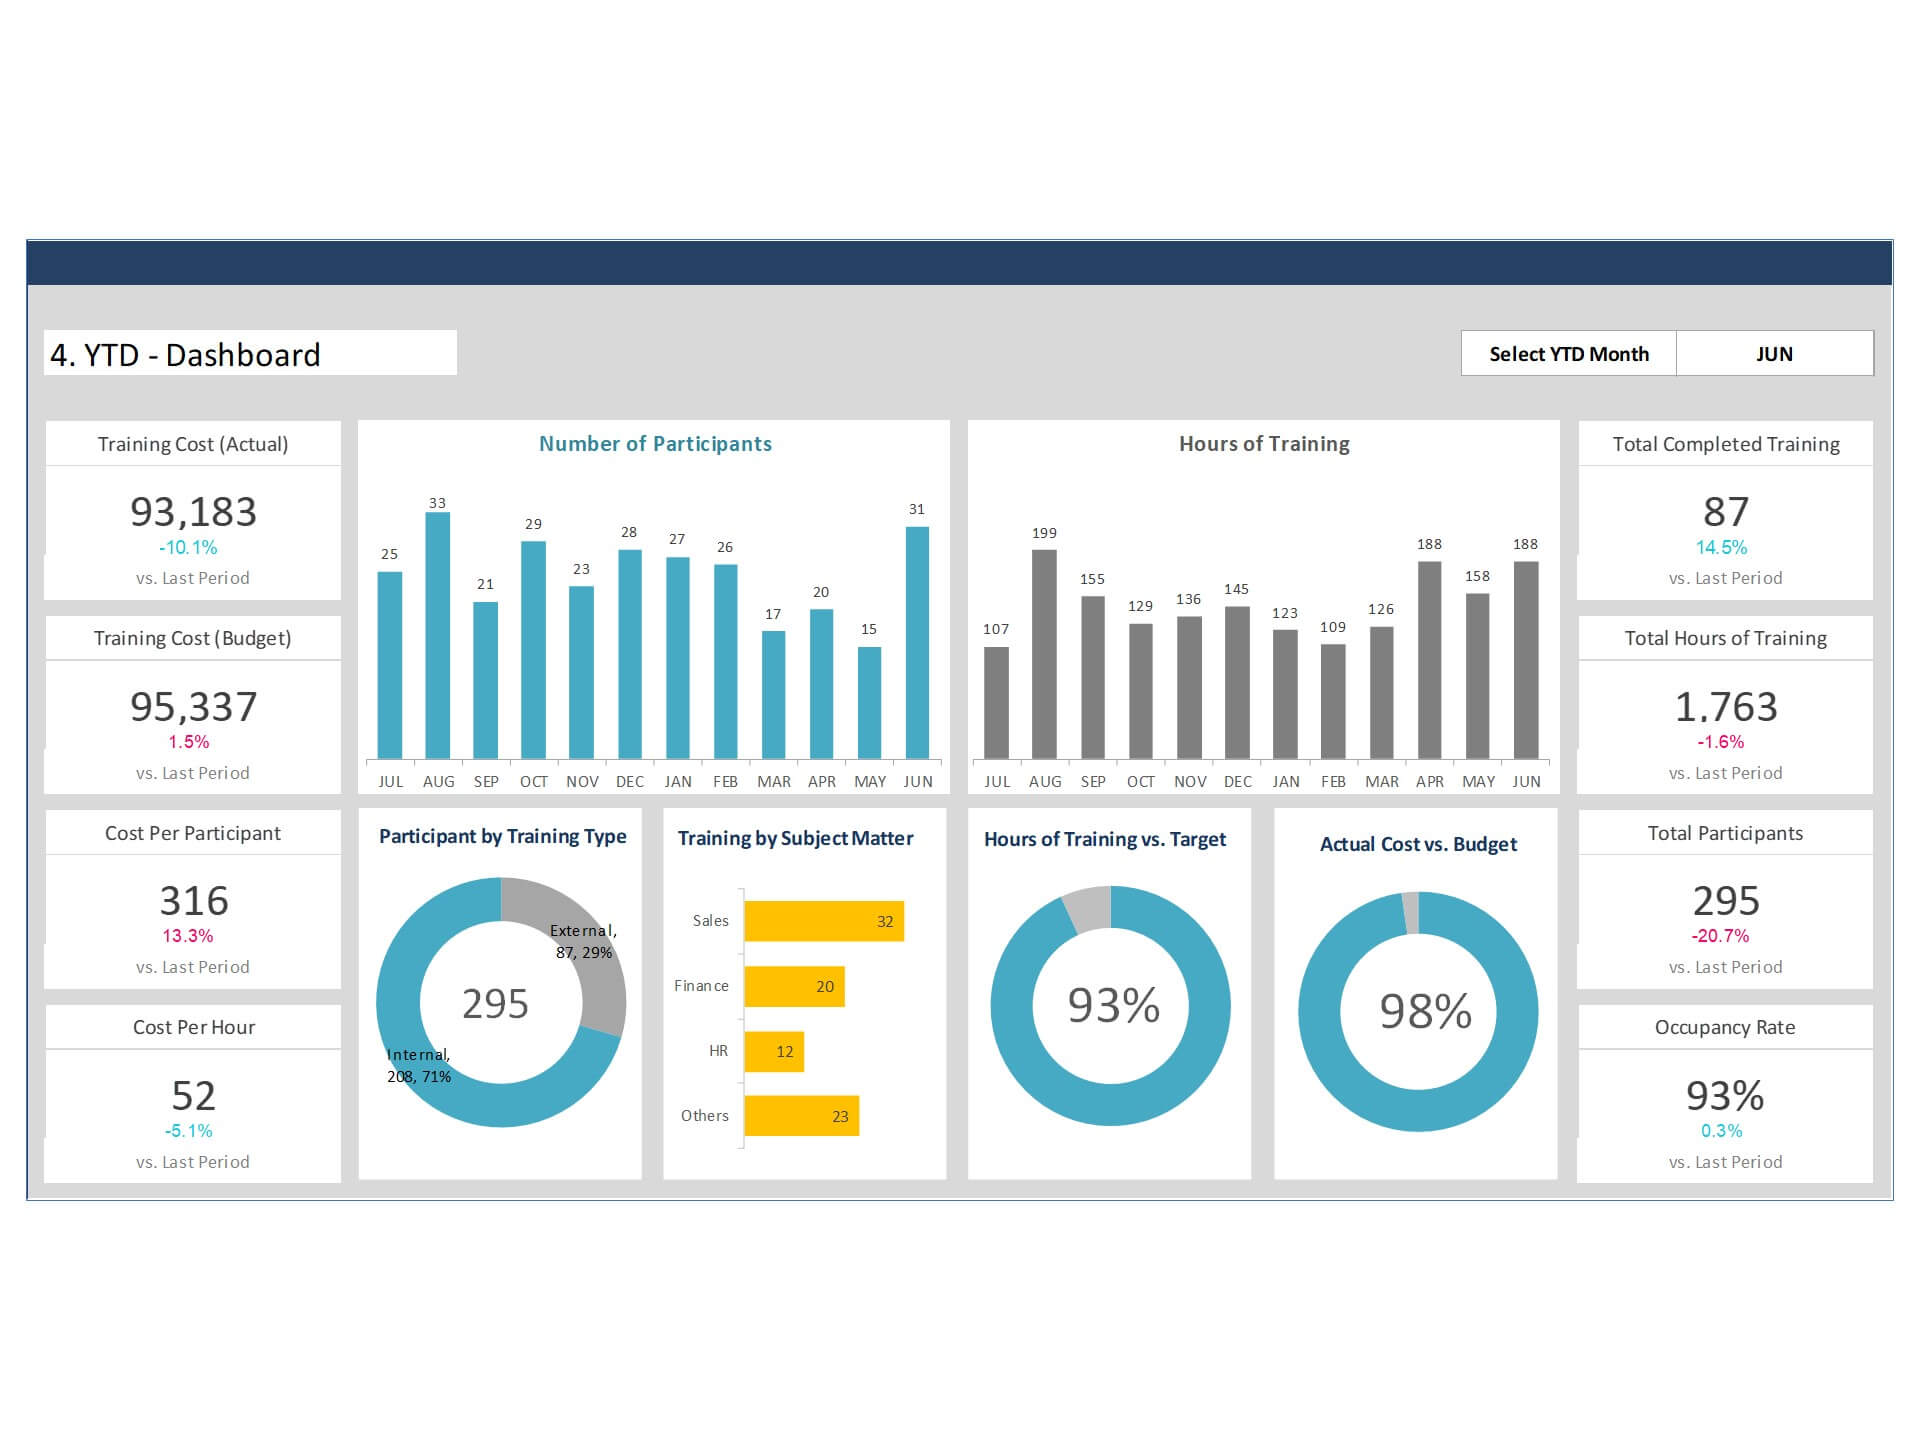
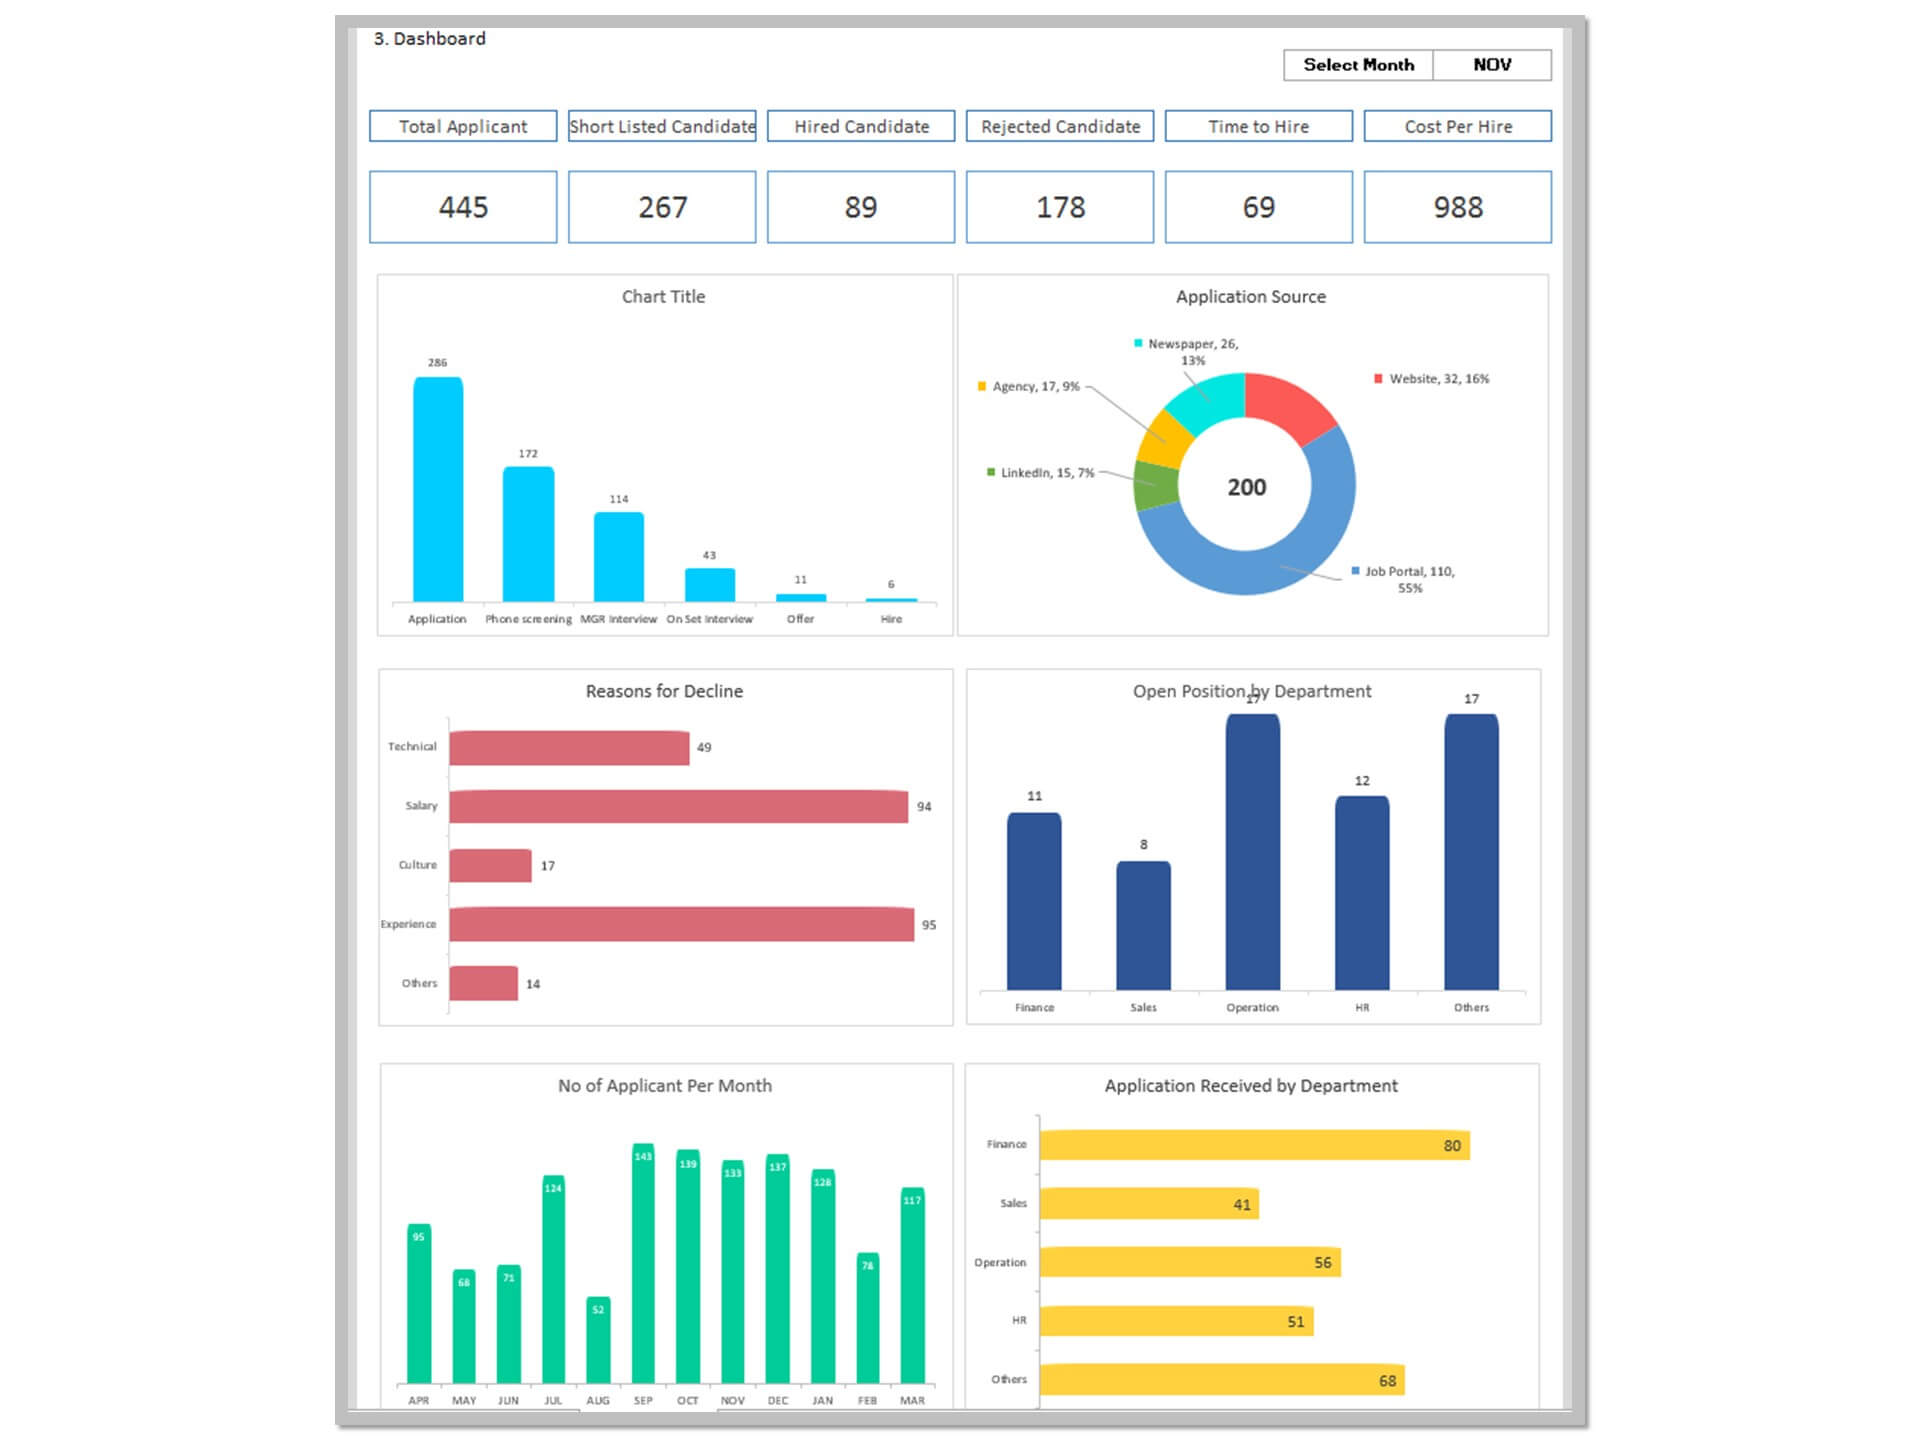
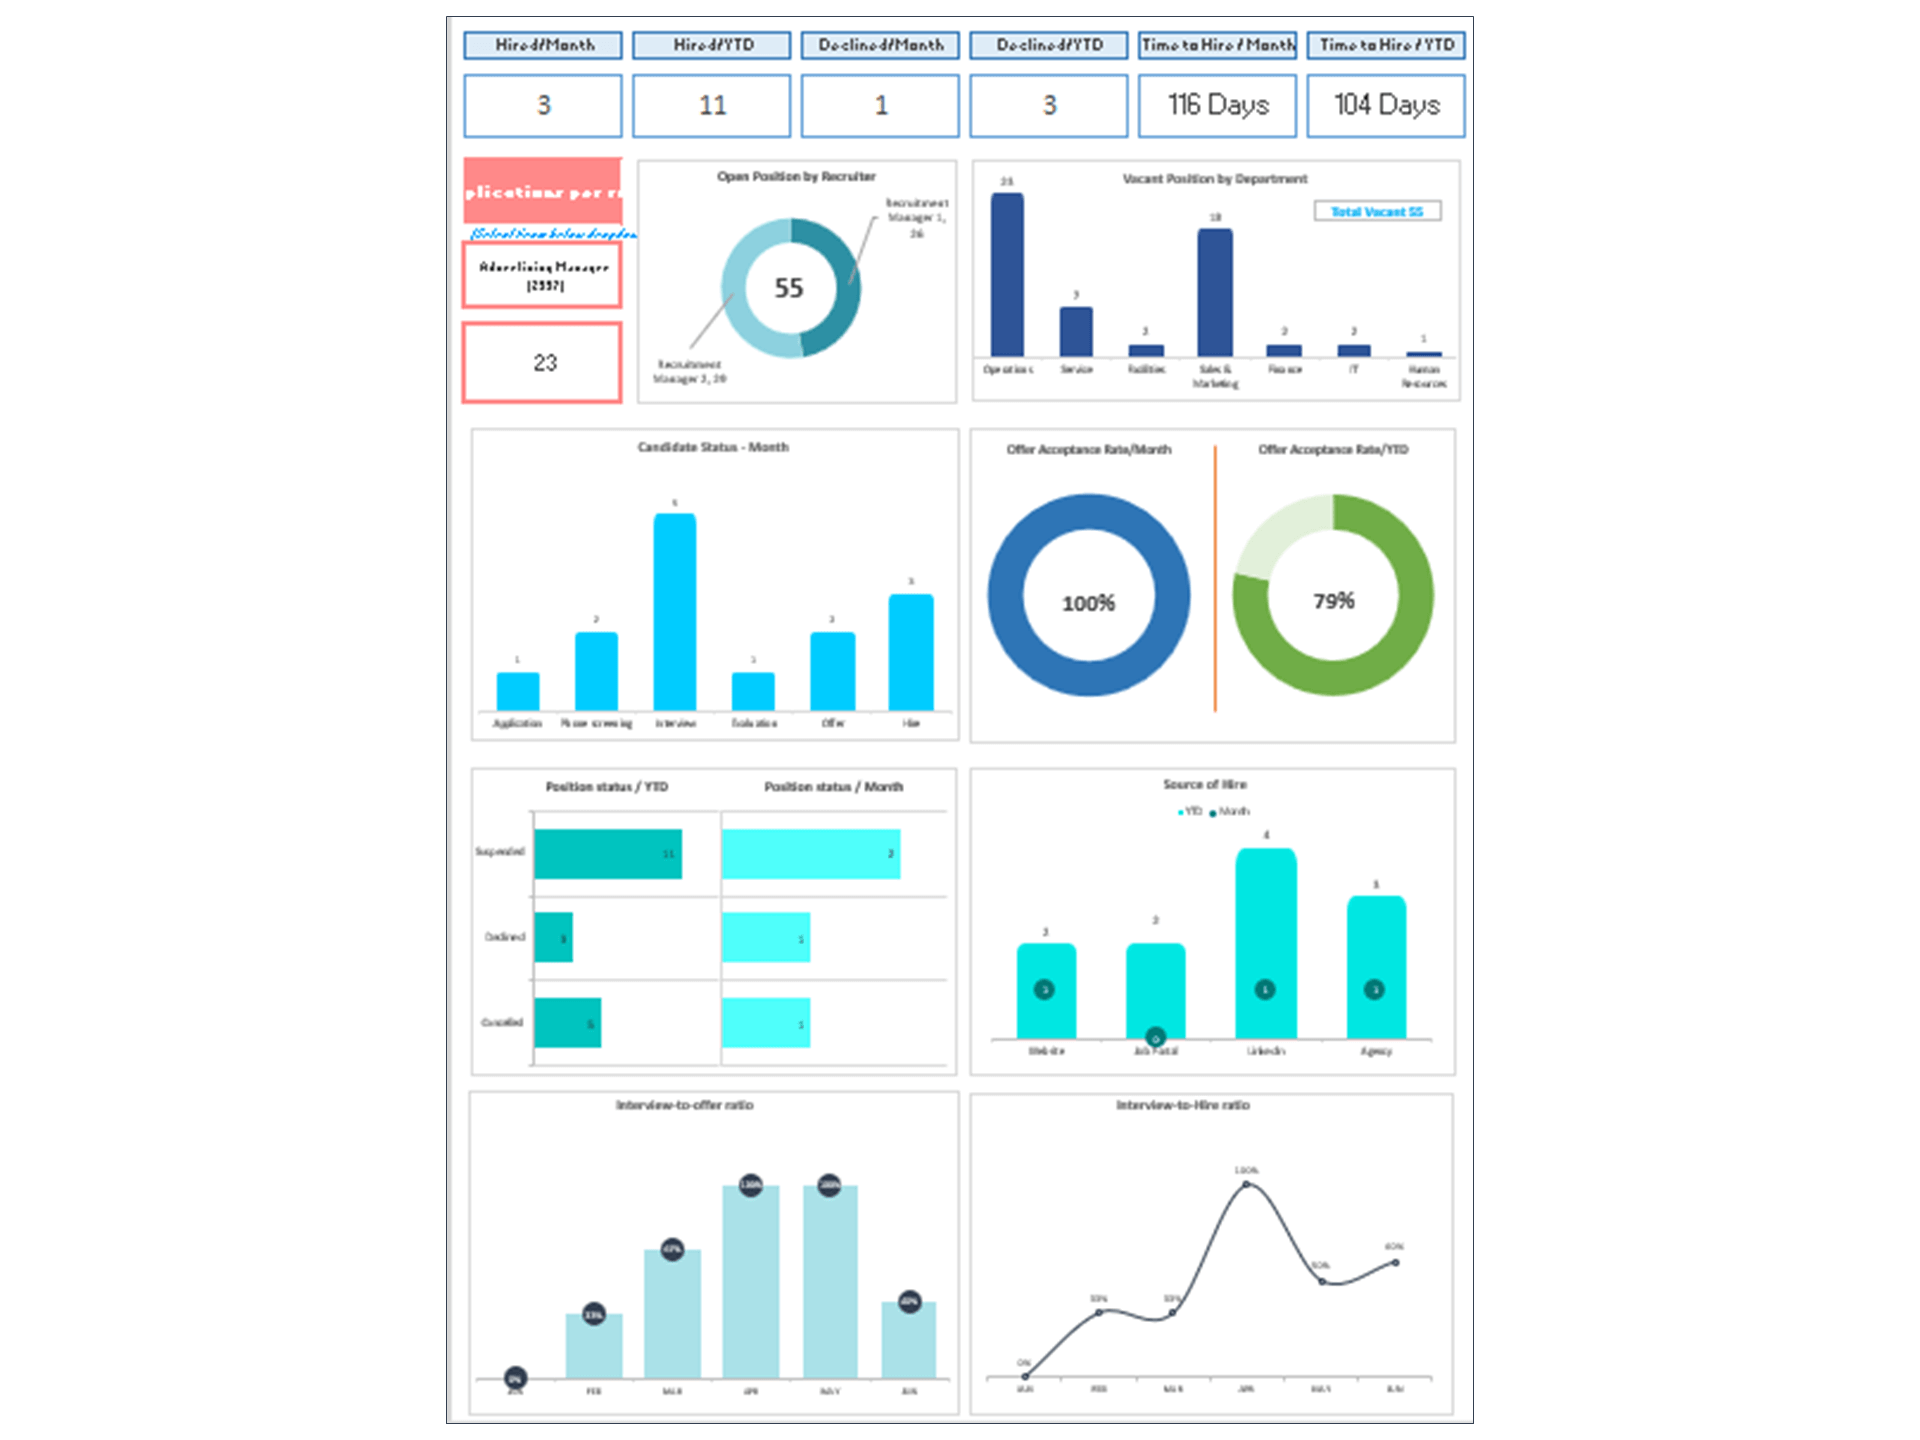
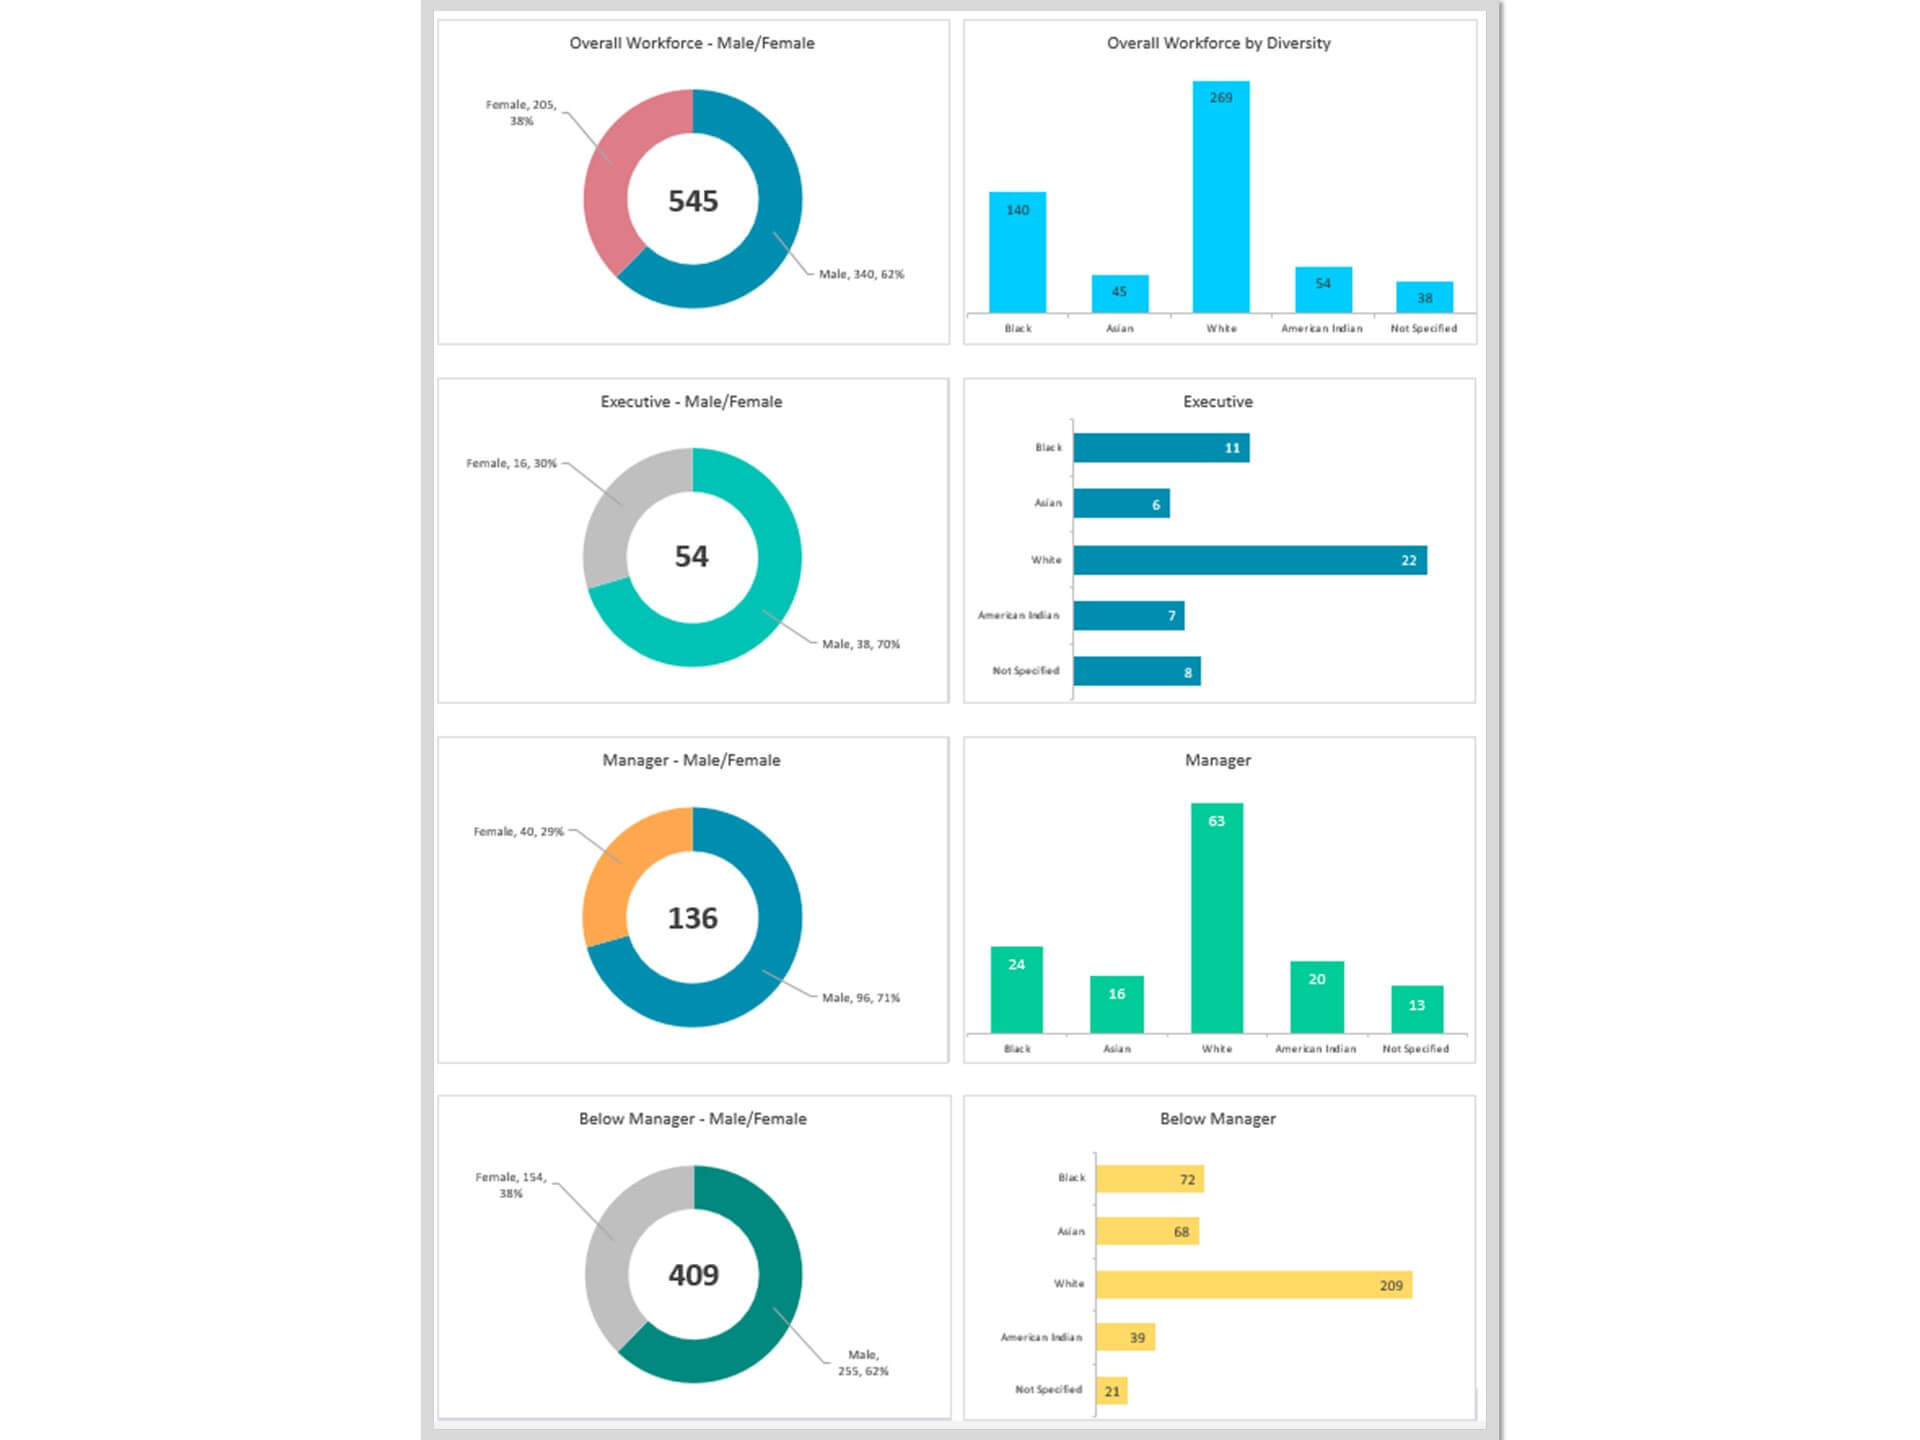
The HR 9 Box Performance Rating Dashboard Excel Template is a powerful HR Template designed to help Human Resources teams evaluate employee performance and potential in a structured way. This Dashboard in Excel uses the well-known 9 Box Rating model to categorize employees based on performance and future potential, supporting better talent management decisions.
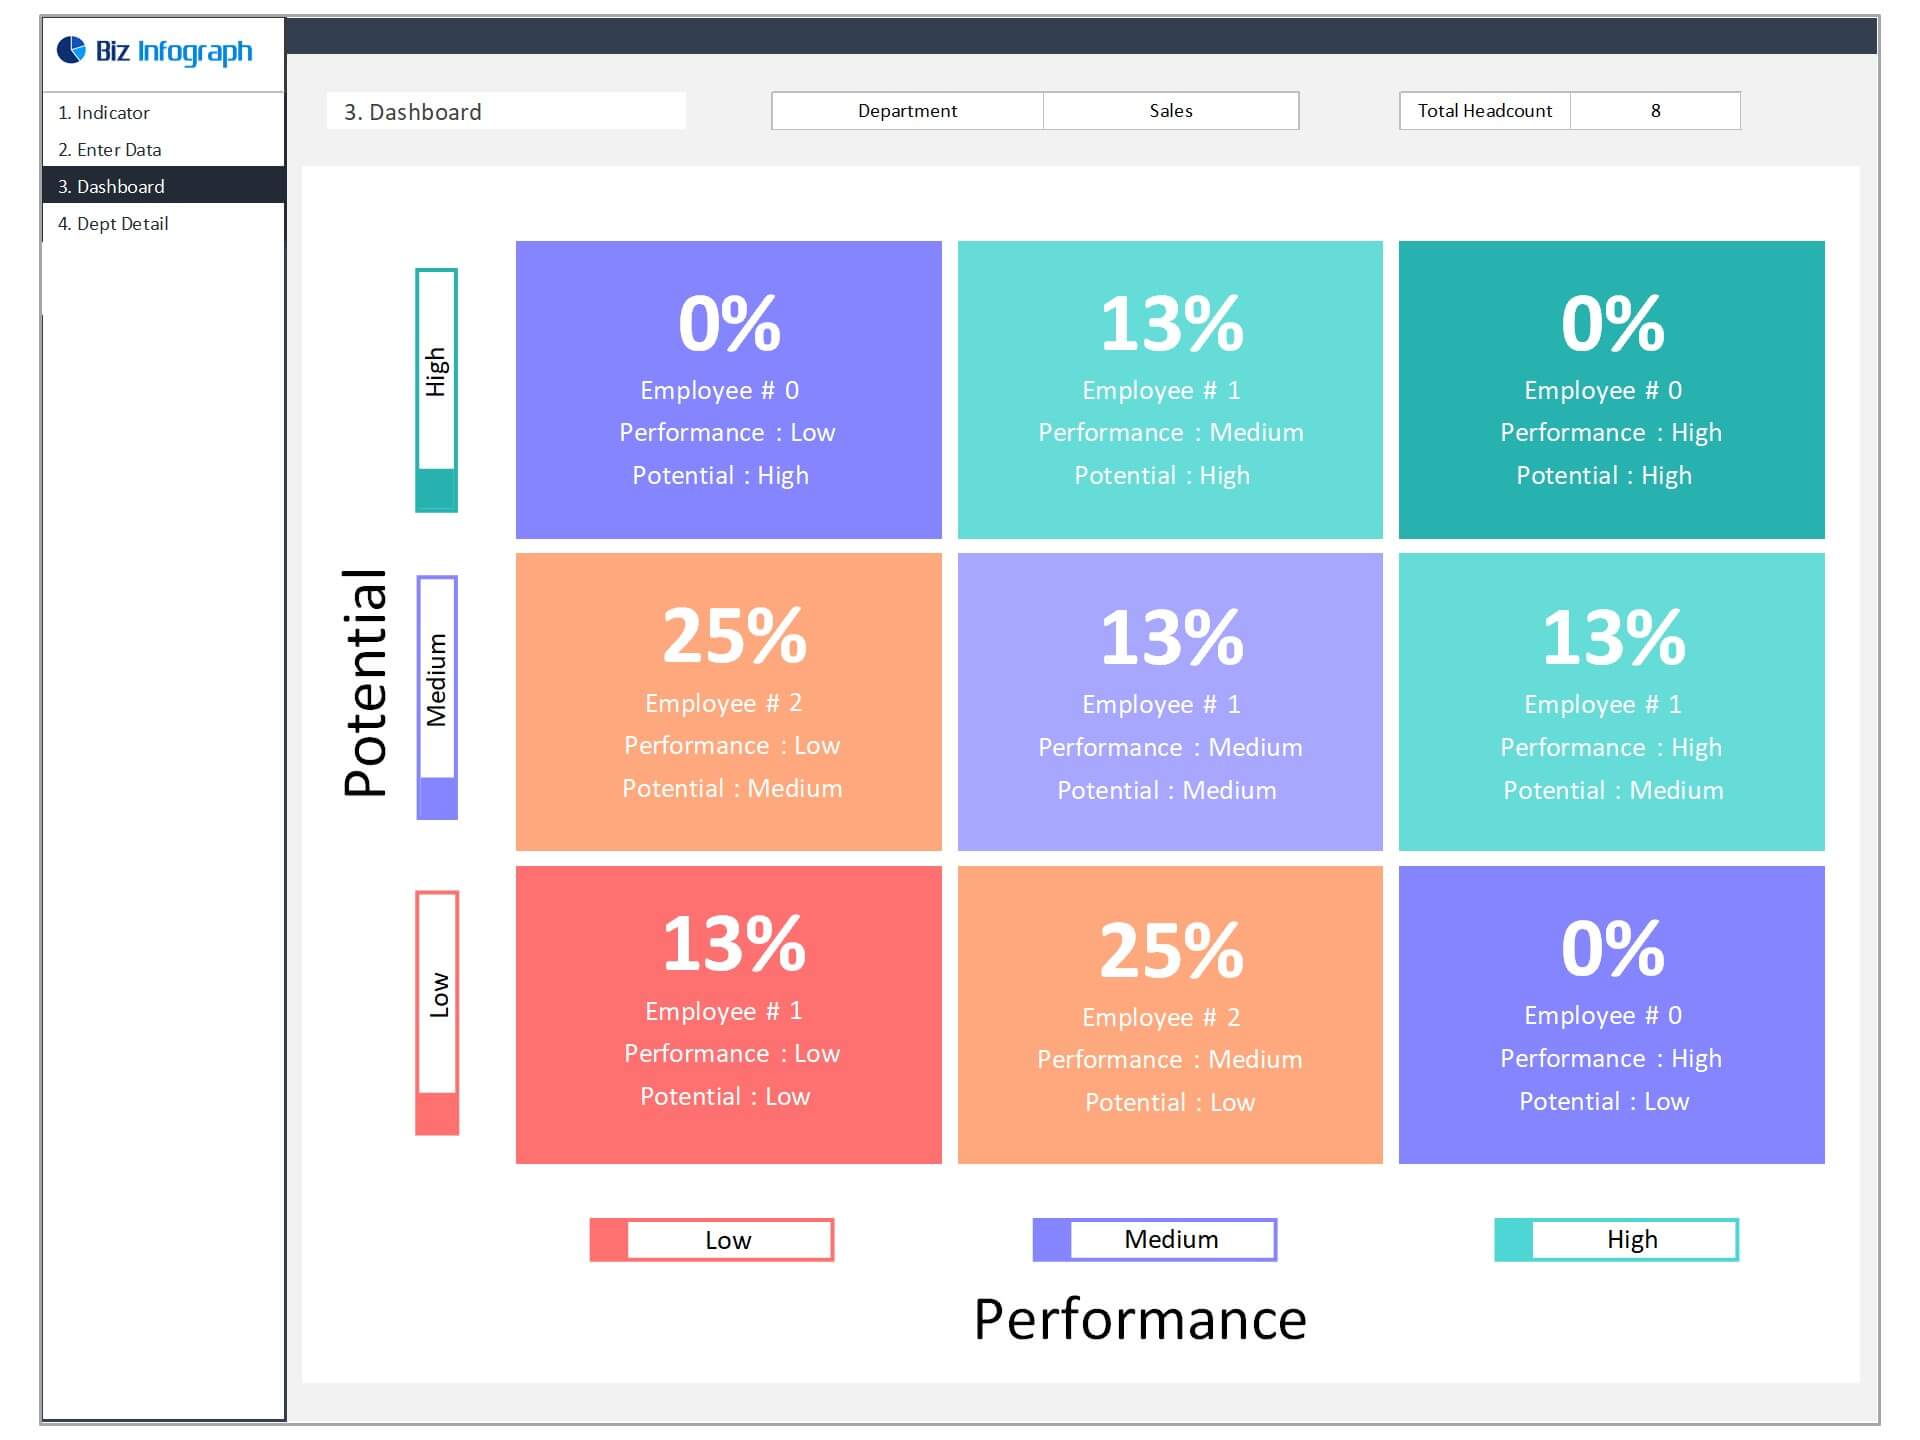
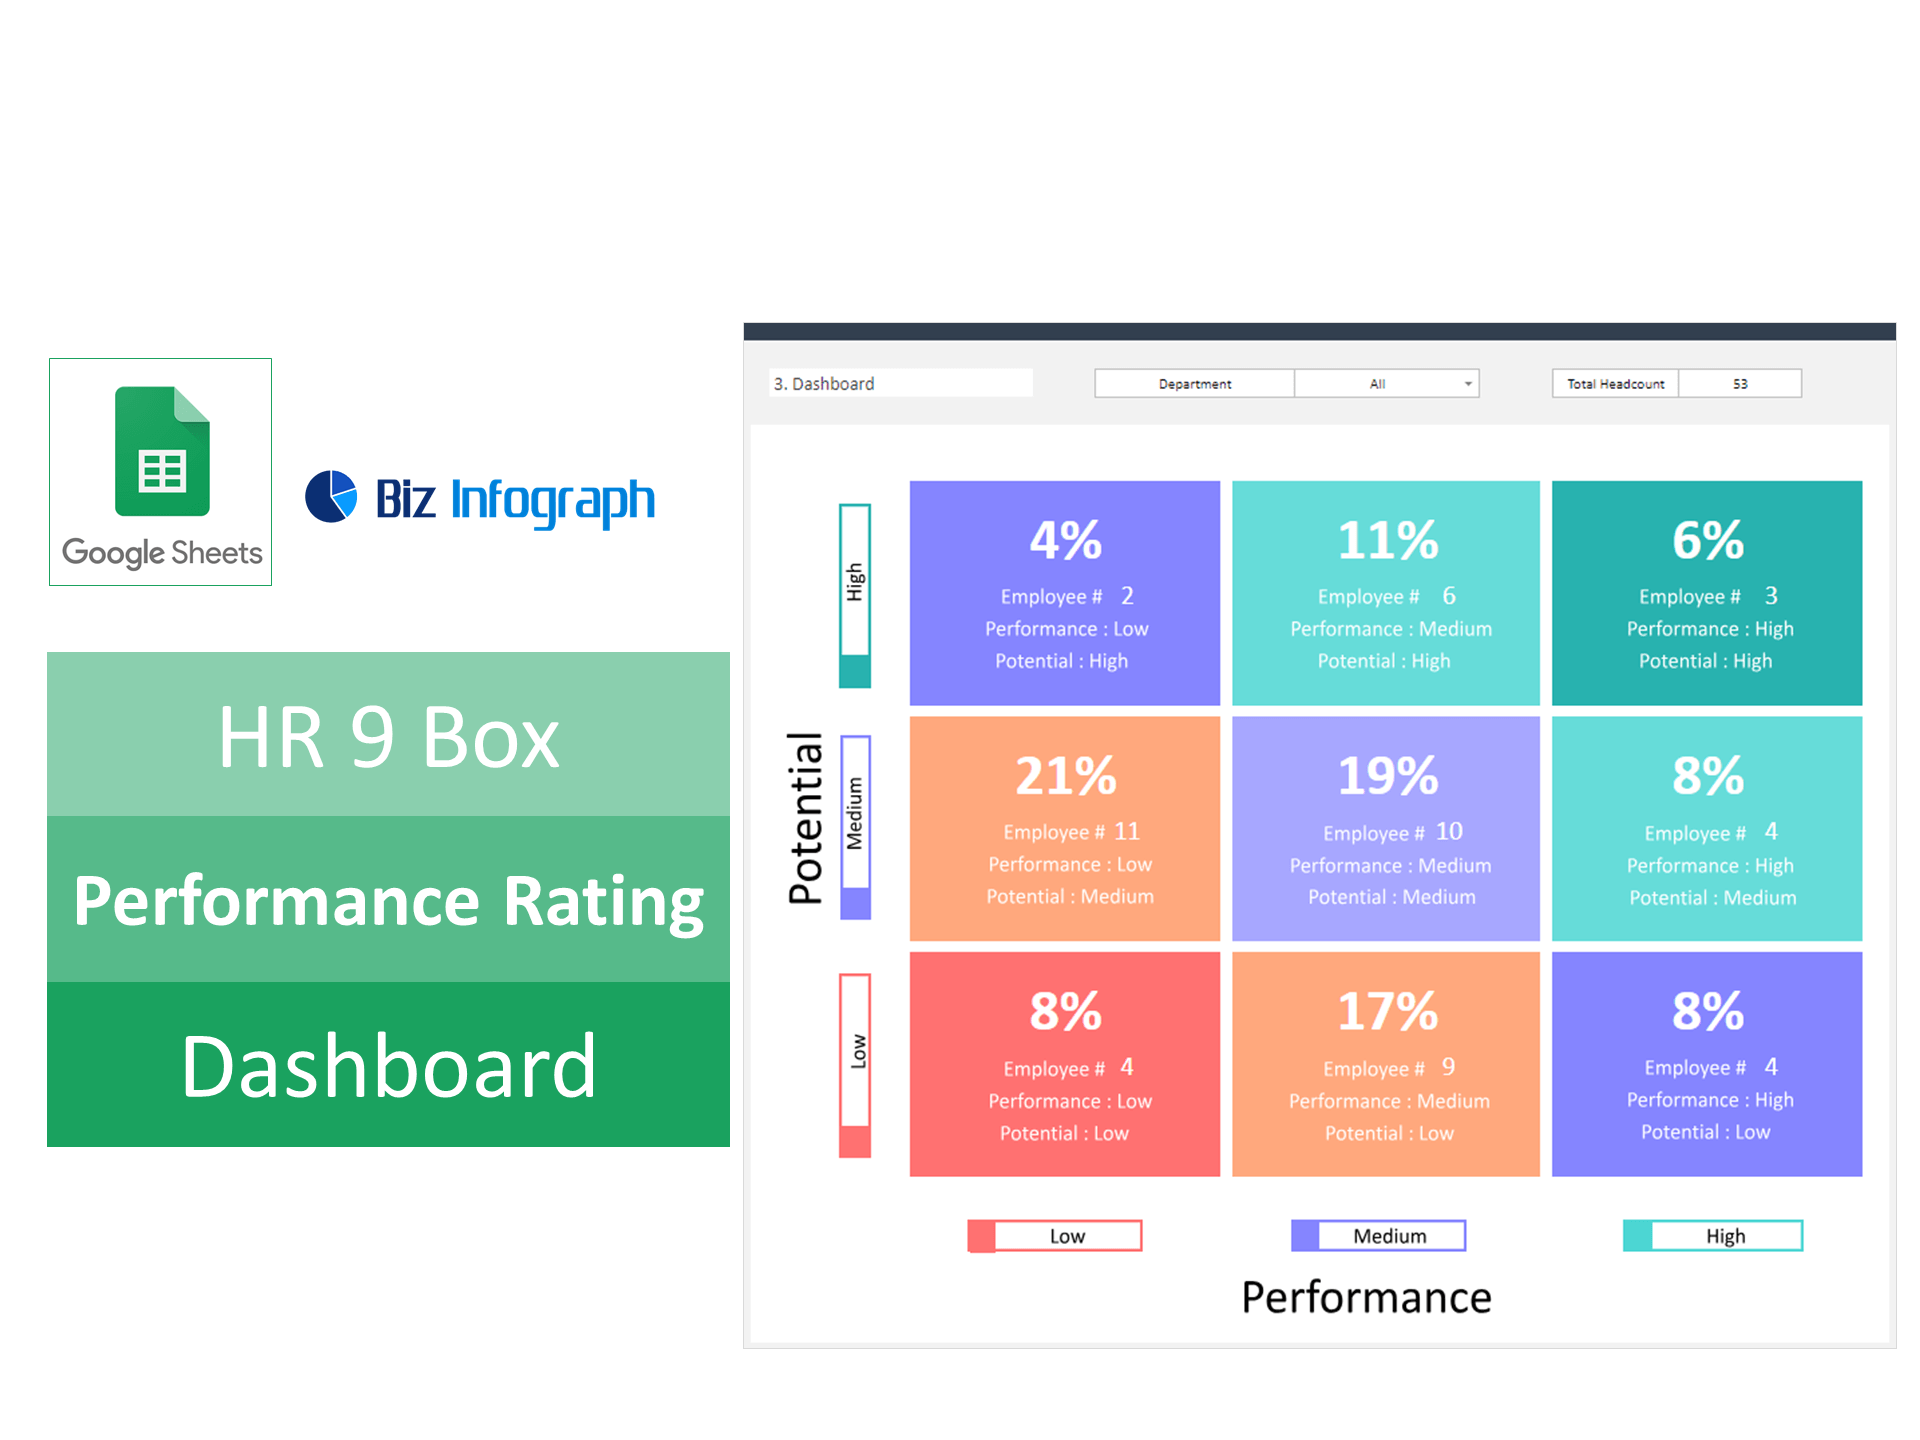
The 9 Box Dashboard visually places employees within the nine-box grid, making it easier for HR managers and leadership teams to identify high performers, future leaders, and employees who may need additional development. As a comprehensive HR Dashboard, it helps organizations analyze workforce performance in a clear and organized format.
This Rating Dashboard also functions as a Dynamic Dashboard, automatically updating charts and insights as employee evaluation data changes. It enables better workforce planning, leadership development, and succession planning.
Overall, this Business Dashboard and 9 Box Template provides a simple yet effective way to manage employee performance and support strategic talent development.
Pros: The tool has several benefits, including helping to identify areas of improvement and facilitating better communication
A performance management tool is a system that organizations use to track employee performance. The tool has several benefits, including helping to identify areas of improvement and facilitating communication between employees and managers. Additionally, the tool can help managers assess employee potential and identify training needs.
Cons: There are some drawbacks to using the 9 box grid, such as its complexity and potential for bias
The 9 box grid is a talent assessment tool that has been gaining in popularity in recent years. It is thought to be a more accurate way to measure talent than traditional methods such as IQ tests. However, there are some drawbacks to using the 9 box grid, such as its complexity and potential for bias. One major concern is that the grid can be confusing for people who are not familiar with it.
Overall, the 9 box grid is a useful tool for assessing employee performance
In any company, it is important to assess employee performance in order to ensure that everyone is fulfilling their duties and meeting the standards of the organization. One common tool used for this purpose is the 9 box grid. This grid divides employee performance into nine categories, from "excellent" to "needs improvement." It can be used to help identify strengths and weaknesses among employees and to make decisions about promotions, salary increases, or terminations.
The 9 box grid is not without its flaws, however. Some people find it difficult to accurately judge their own performance or that of others. Additionally, using the grid can be time-consuming, and it may be difficult to apply it in certain industries or organizations with a large number of employees. Nevertheless, overall the 9 box grid is a useful tool for assessing employee performance.
Key Features:
- Fully editable, easy to use, template with sample data
- Eye-catching design and customizable
- Change the sample data with your data
- Spreadsheets ready for printing without Biz Infograph logo
- No monthly fees
- Immediate download
- No VBA, no Macro
- No installation necessary
- Professionally designed
What is included in this dashboard template?
- Ready dashboard just plug your data and start using. The dashboard will be ready instantly.
- A guide to unlocking all the elements in the dashboard
Professional Support:
- Video tutorial guide on how to navigate and use each Dashboard Template
- Professional service to customize dashboard template in excel as per business need
- Help and support in post-purchase
- Payment secured by Stripe and PayPal (no PayPal account needed)
A brief guide to using the dashboard template:
- Open the dashboard template
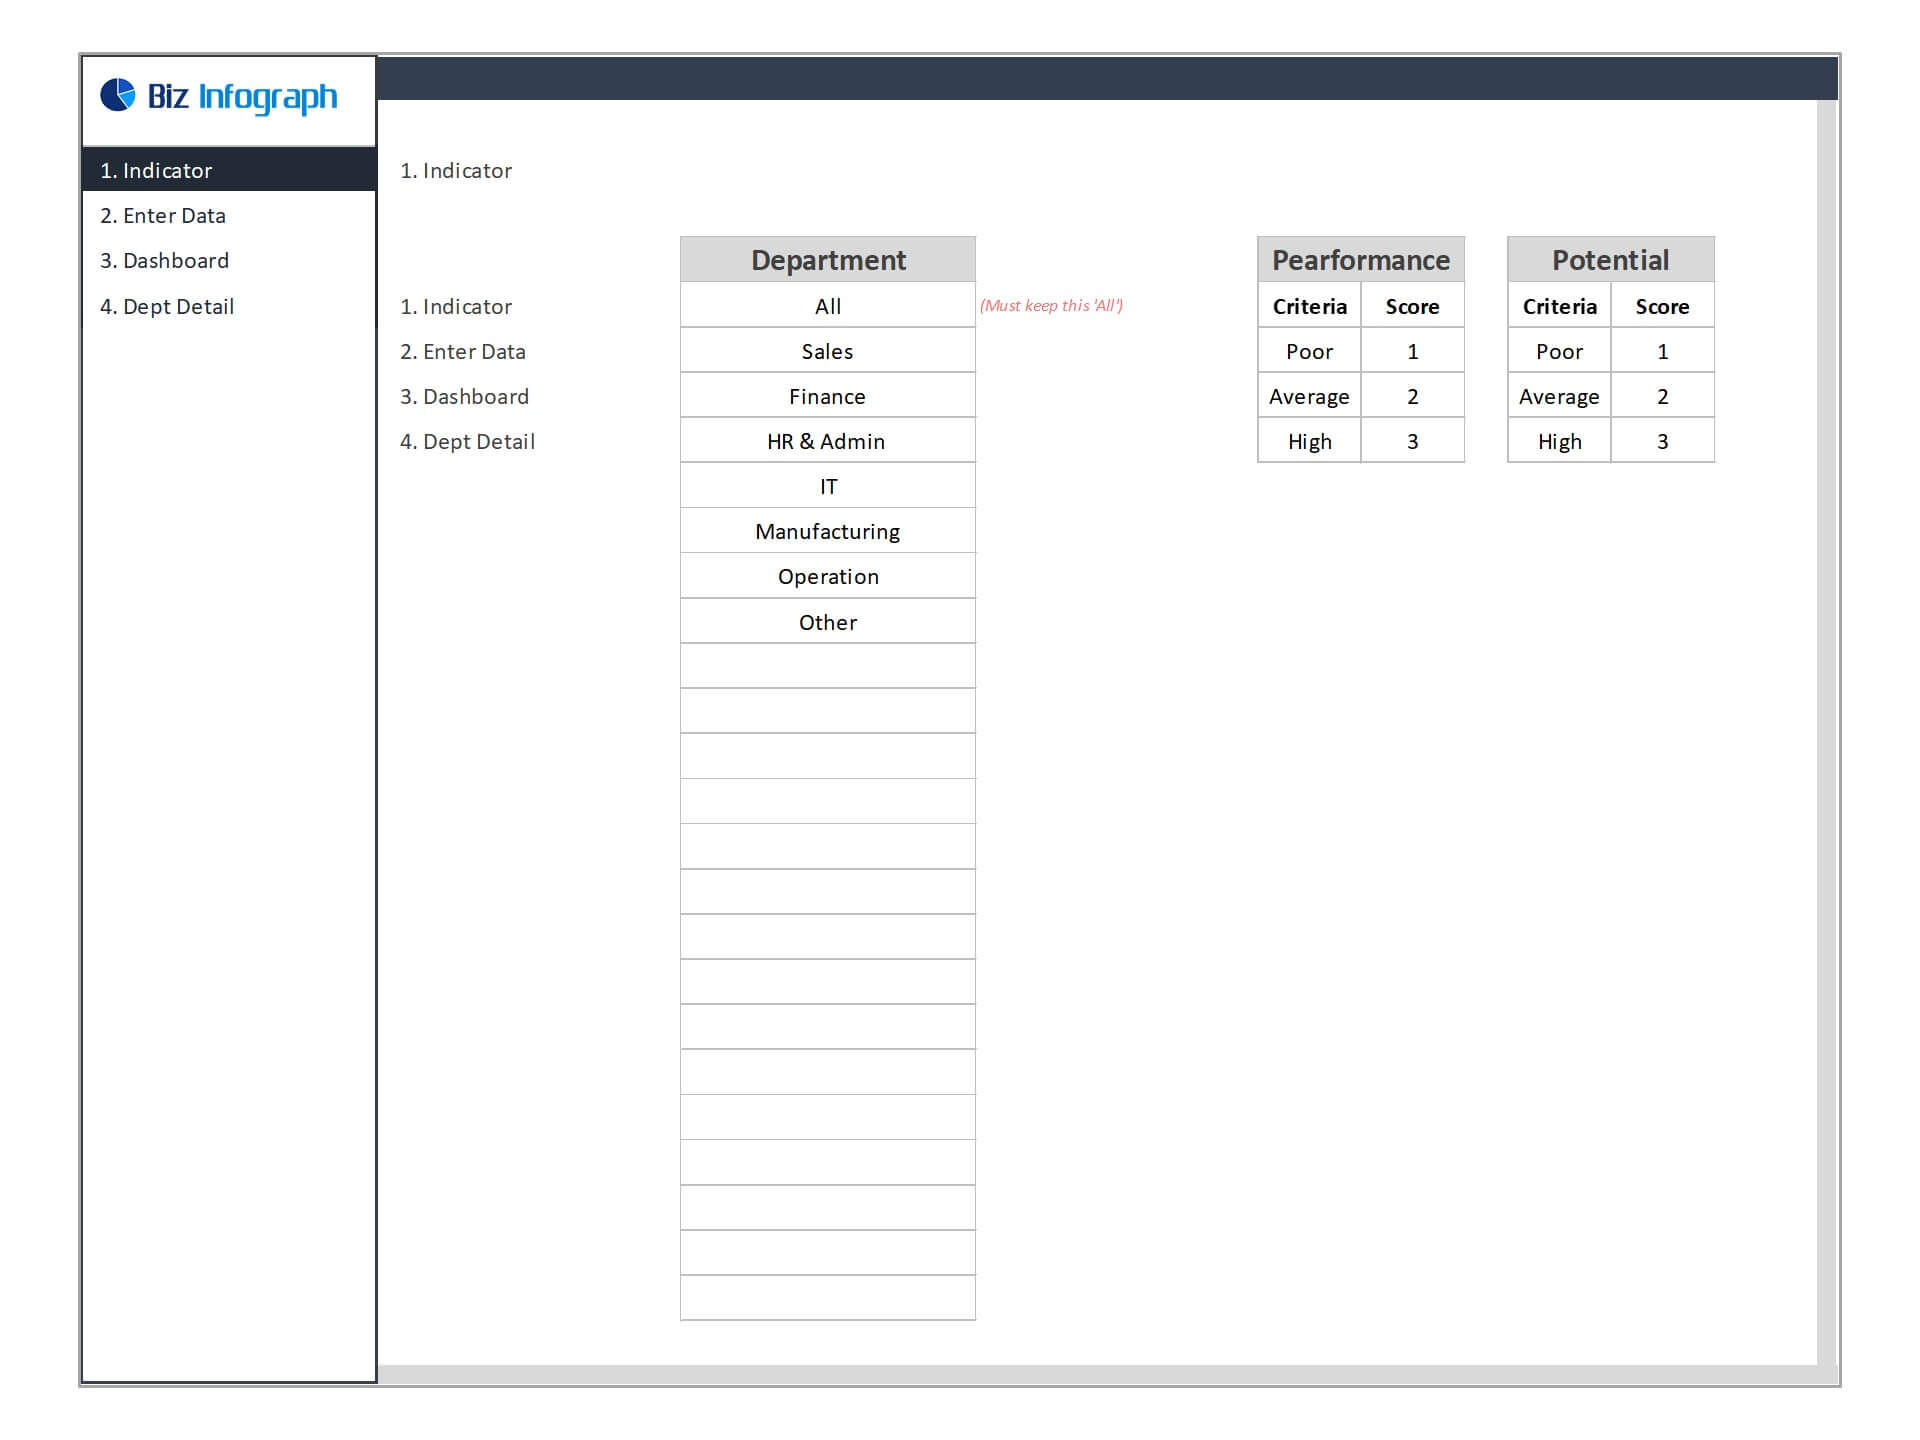
- Go to ‘Indicators’ menu – give your department name
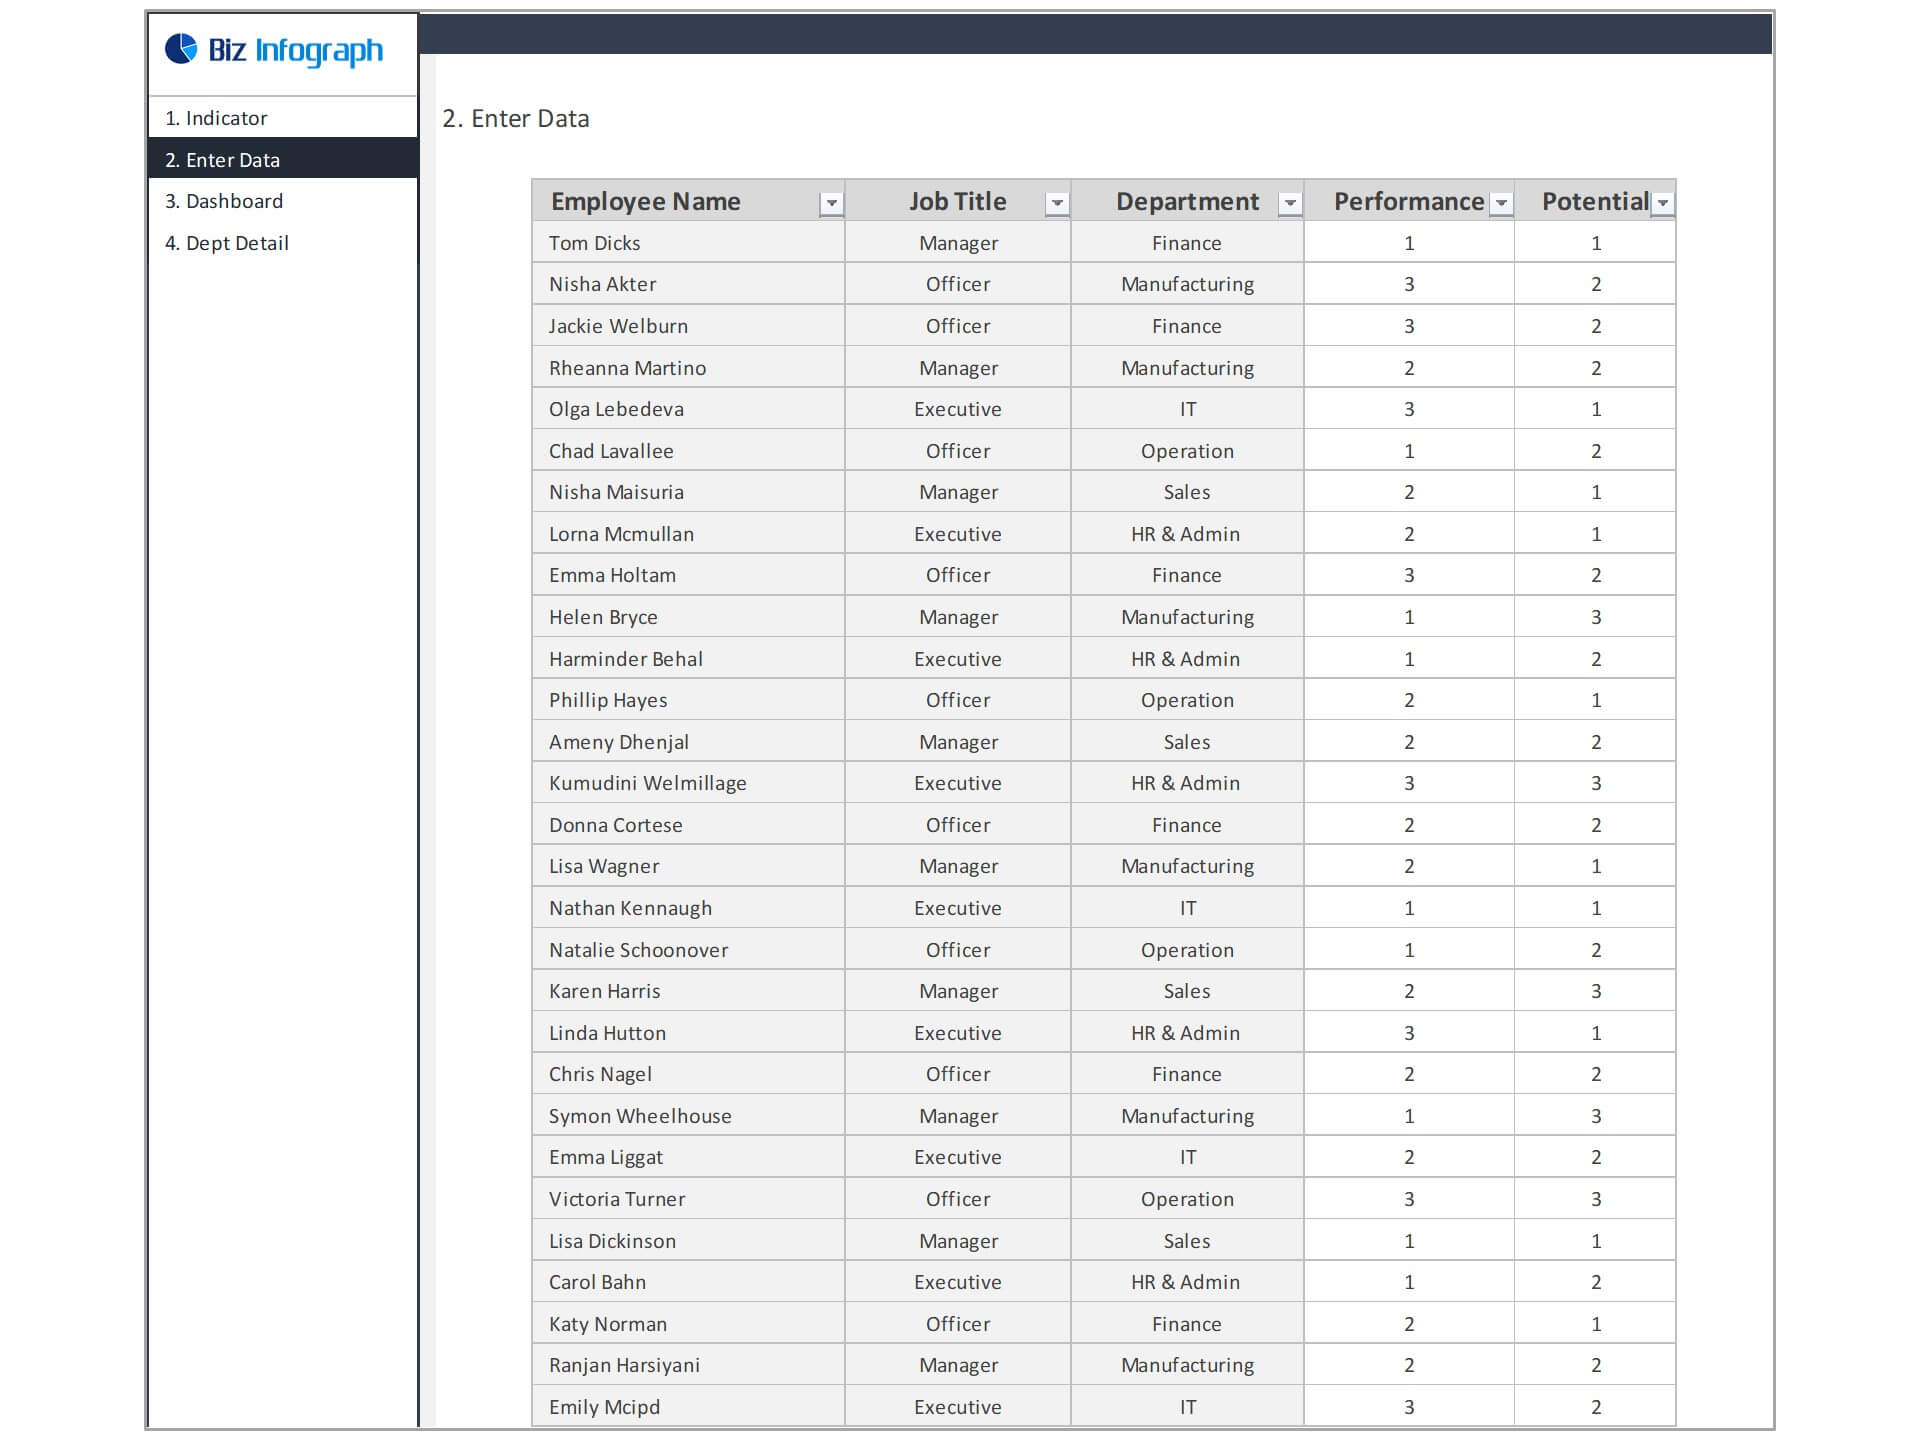
- Go to the ‘Enter Data’ menu – remove the sample data and give your actual data in the respective cells.
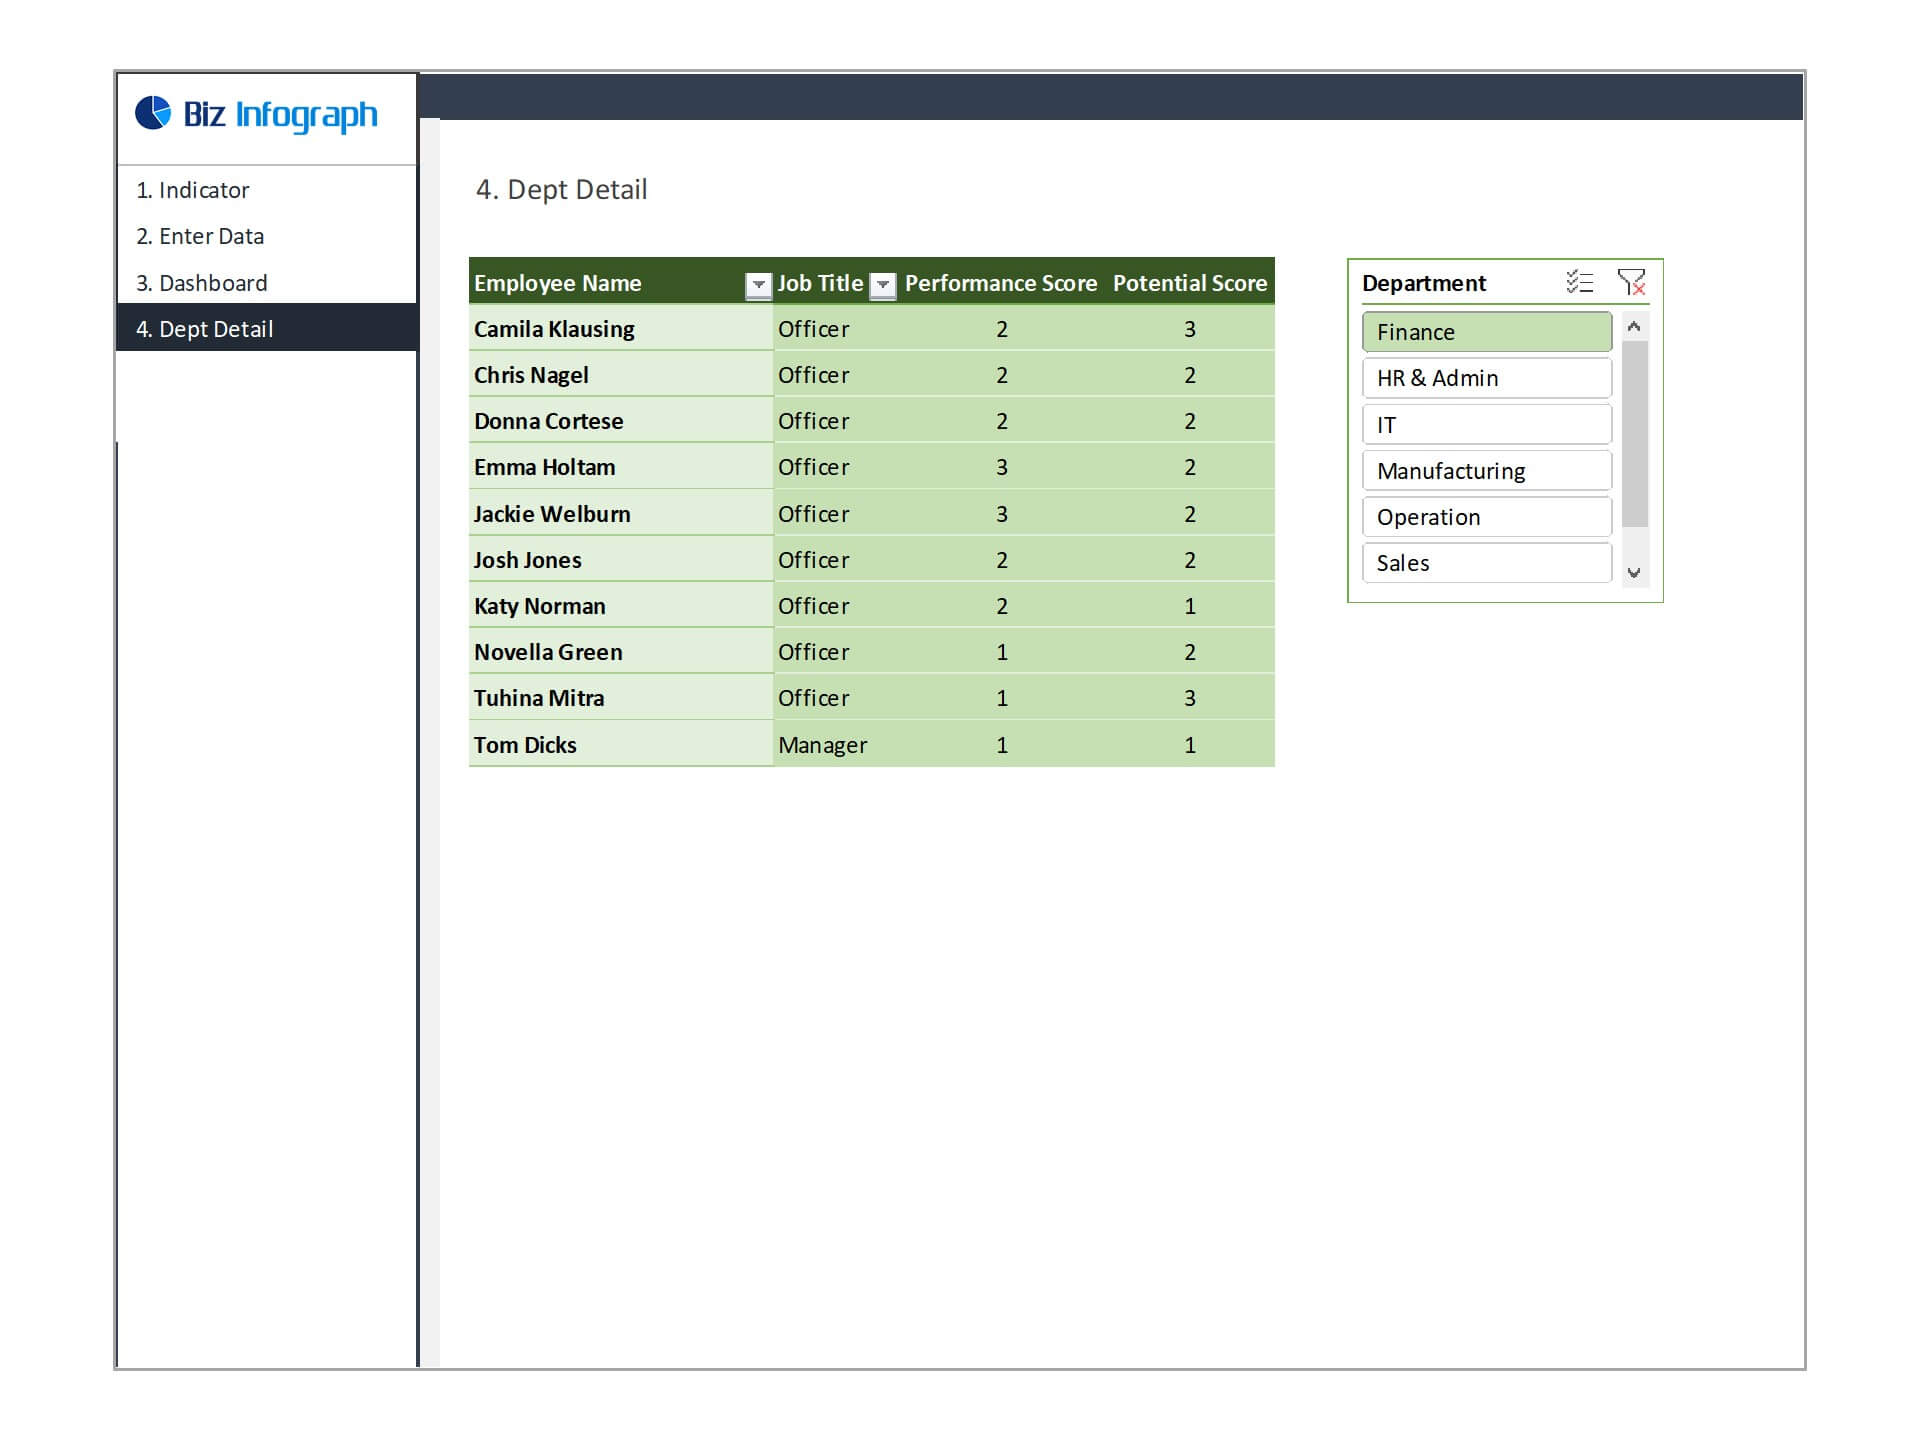
- Go to ‘Dashboard’ menu – dashboard is ready based on data given
- Each page is ready for printing – just press CTRL+P
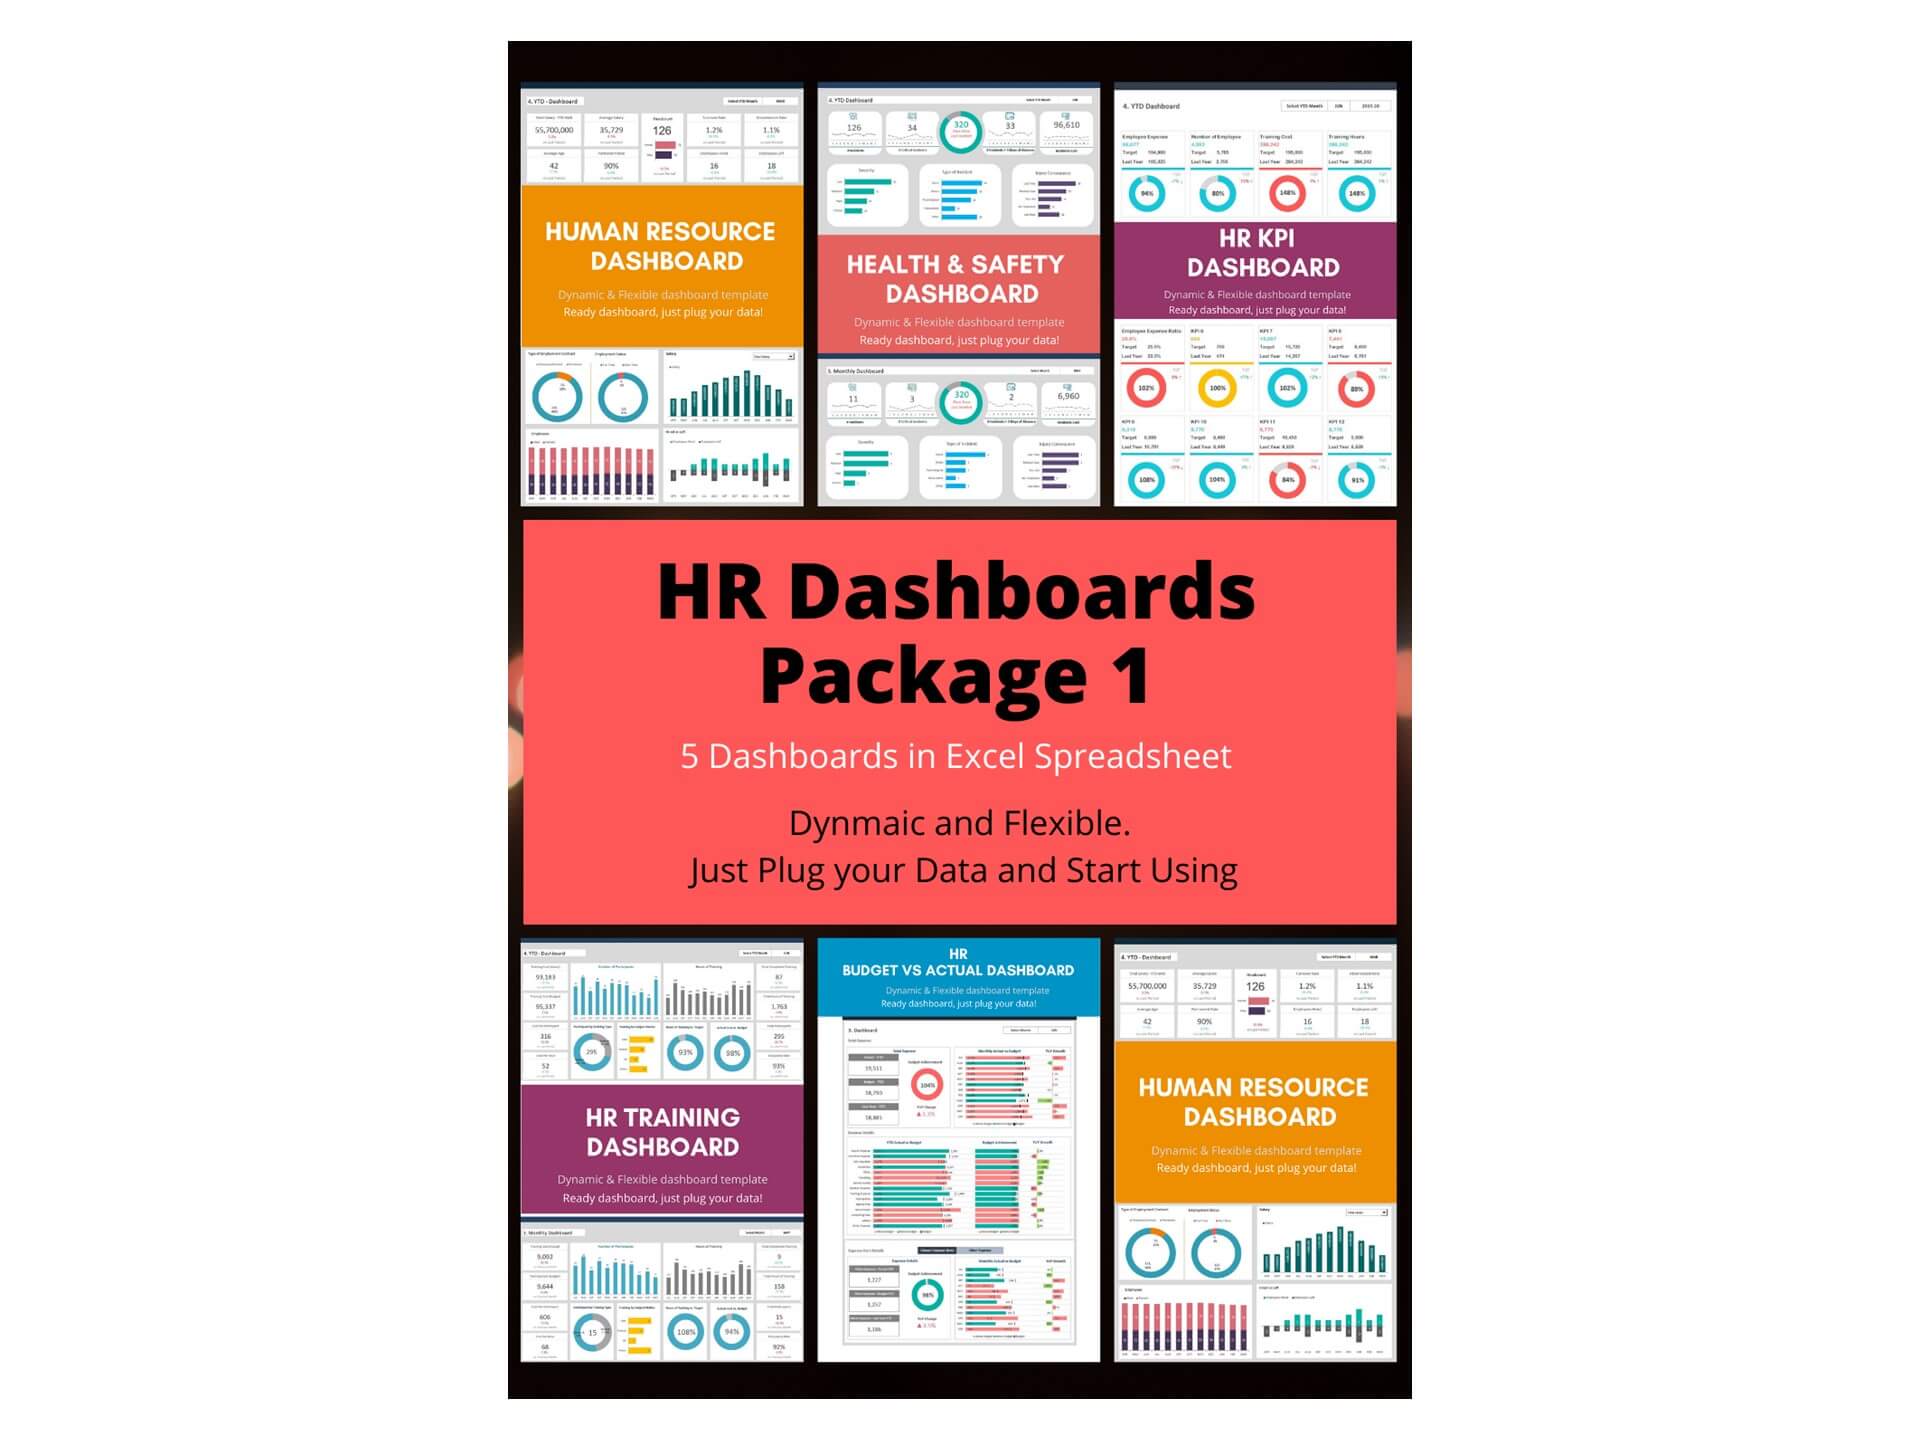
For ready-to-use Dashboard Templates: