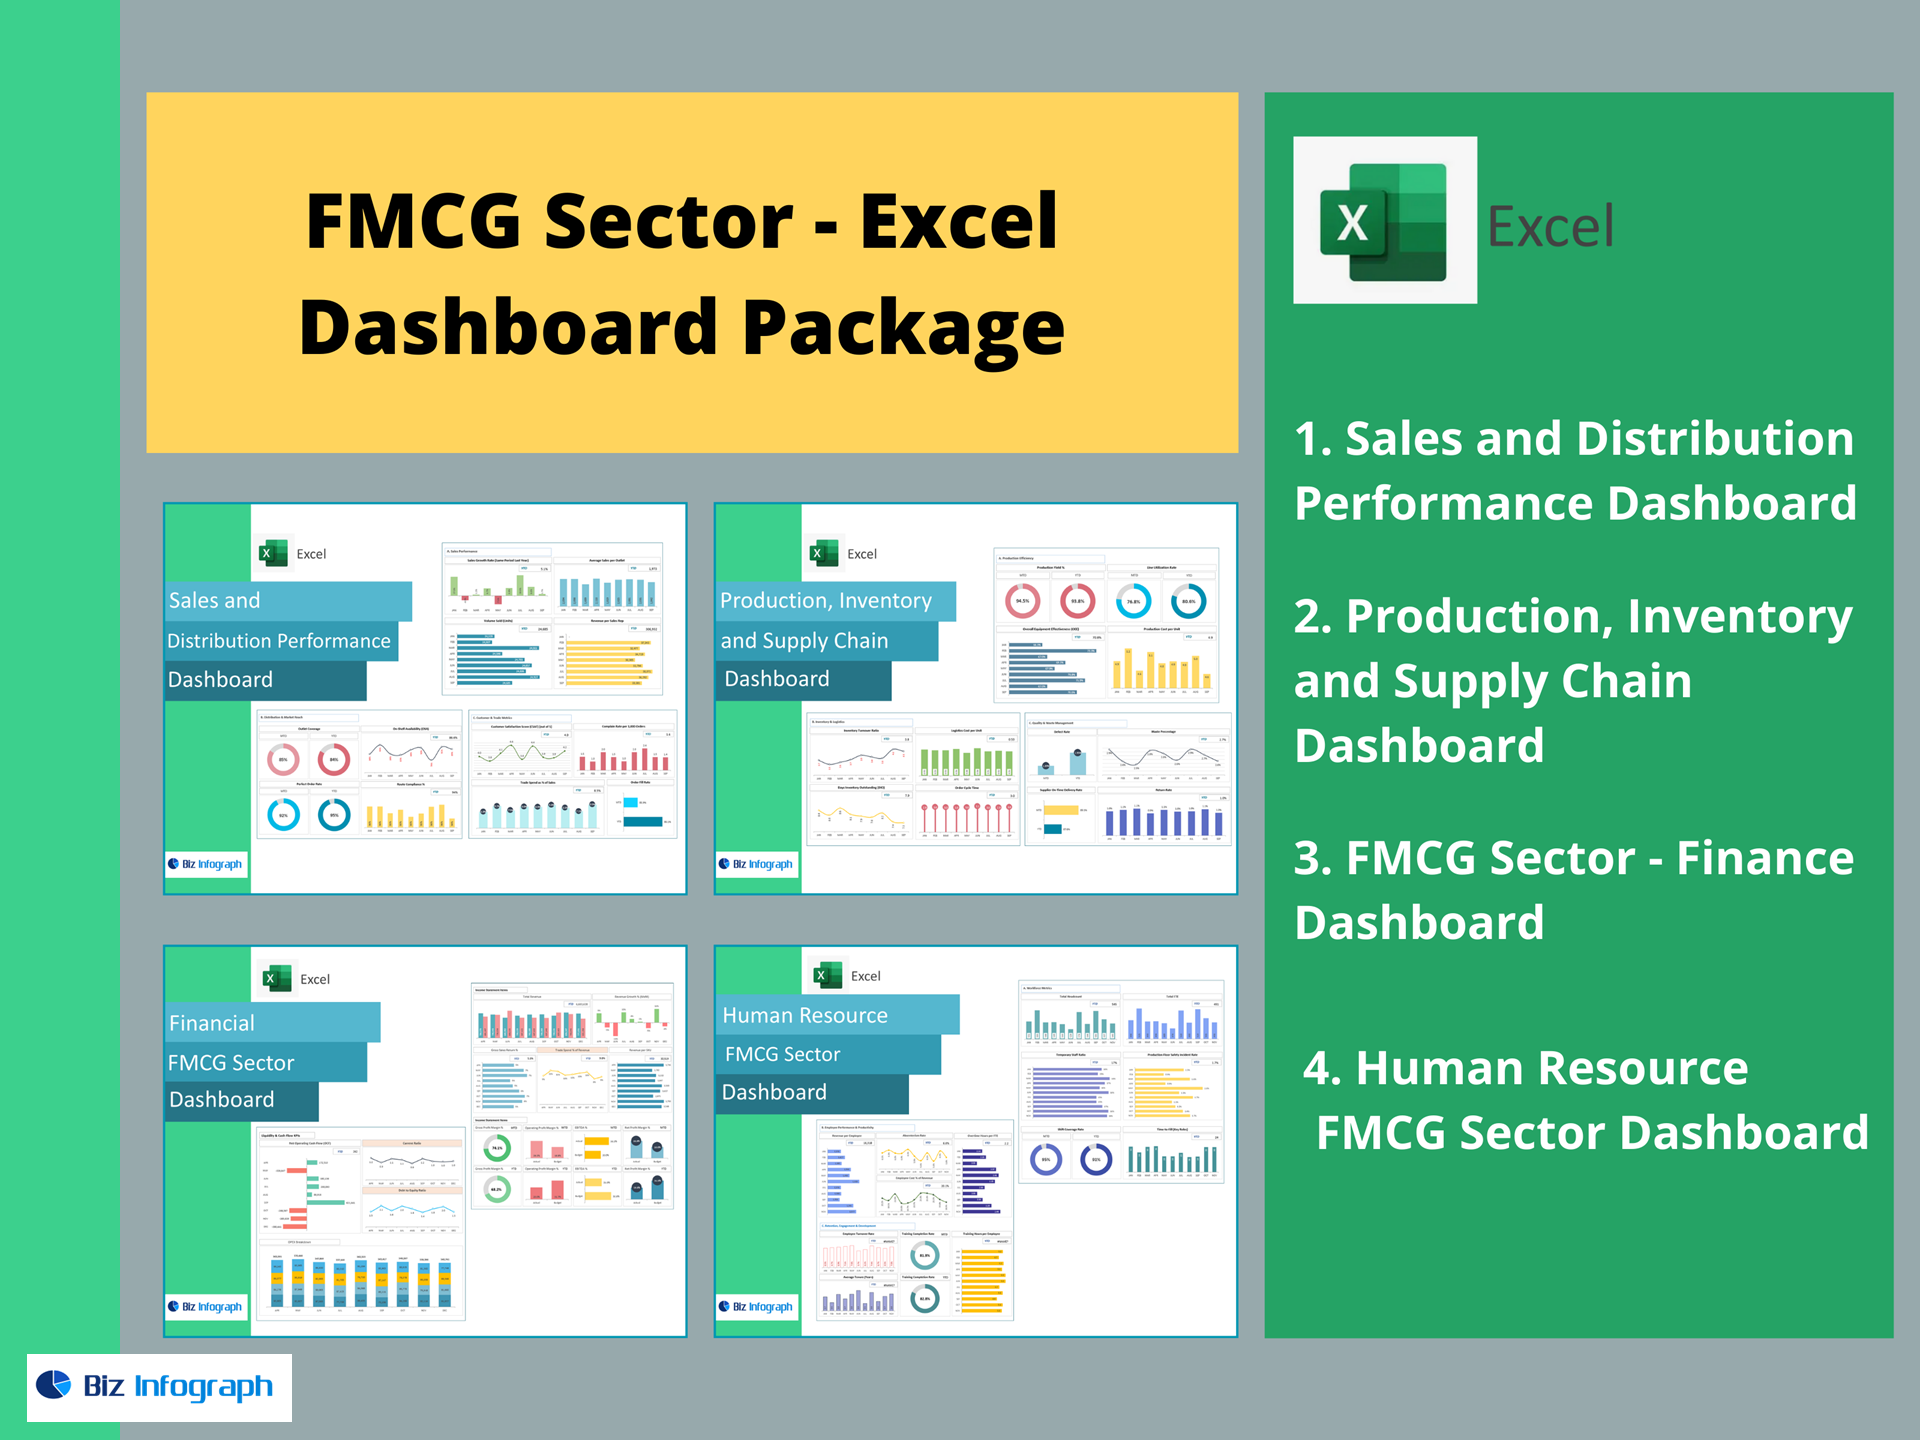
Sales & Distribution Performance Dashboard — Excel Template
Track sell-in, sell-out, and route-to-market execution in one actionable Excel dashboard. This ready-to-use template turns sales growth, outlet coverage, OSA, route compliance, perfect order rate, CSAT, order fill rate, trade spend, and rep productivity into clear insights—no coding required.
What it measures (prebuilt KPIs)
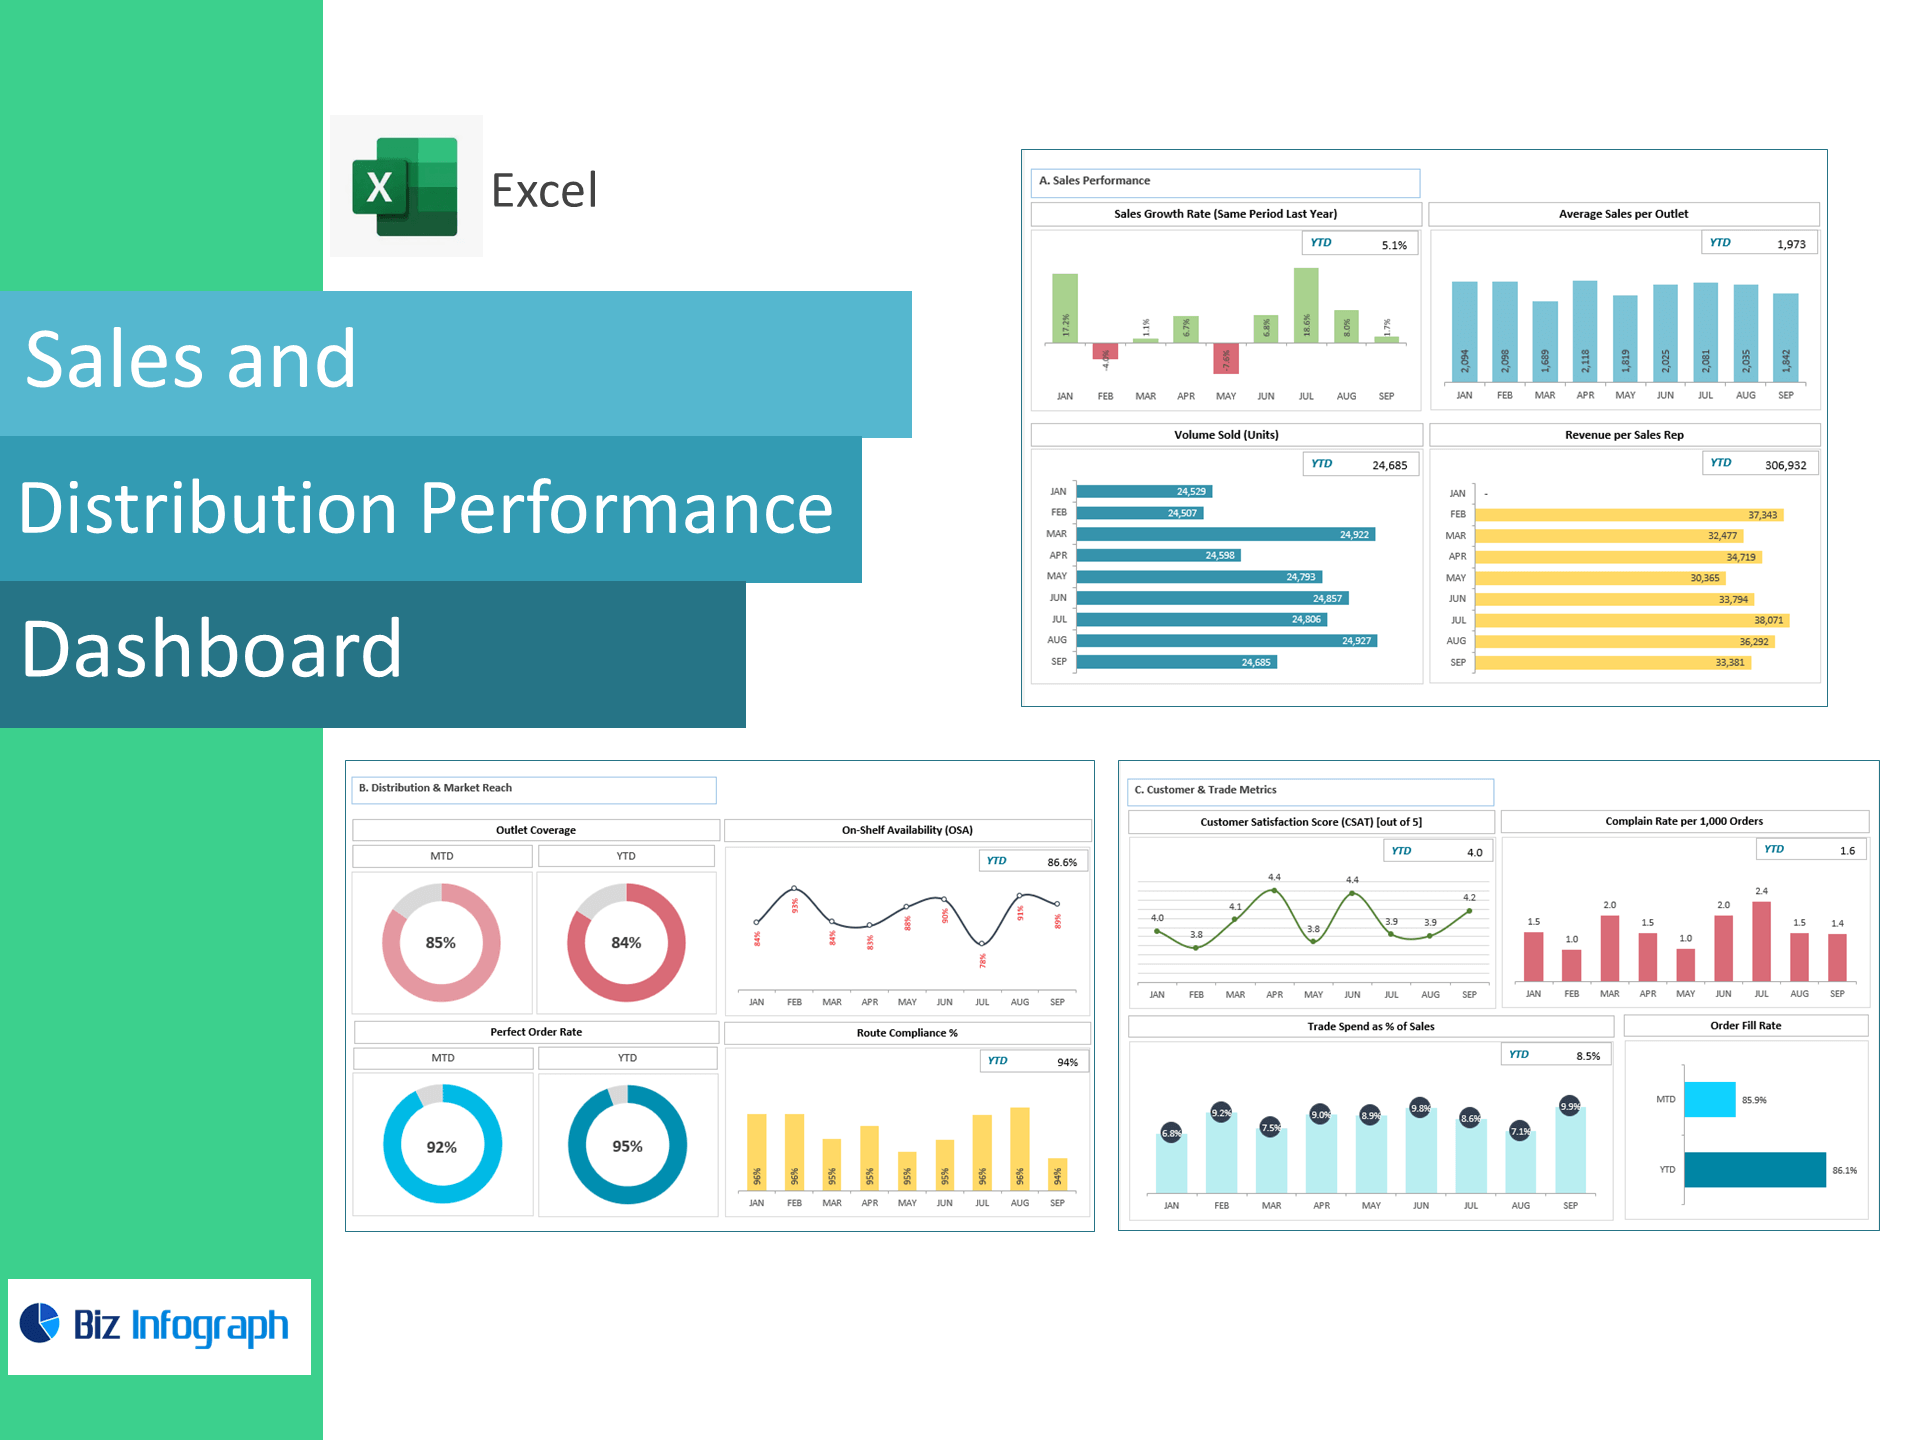
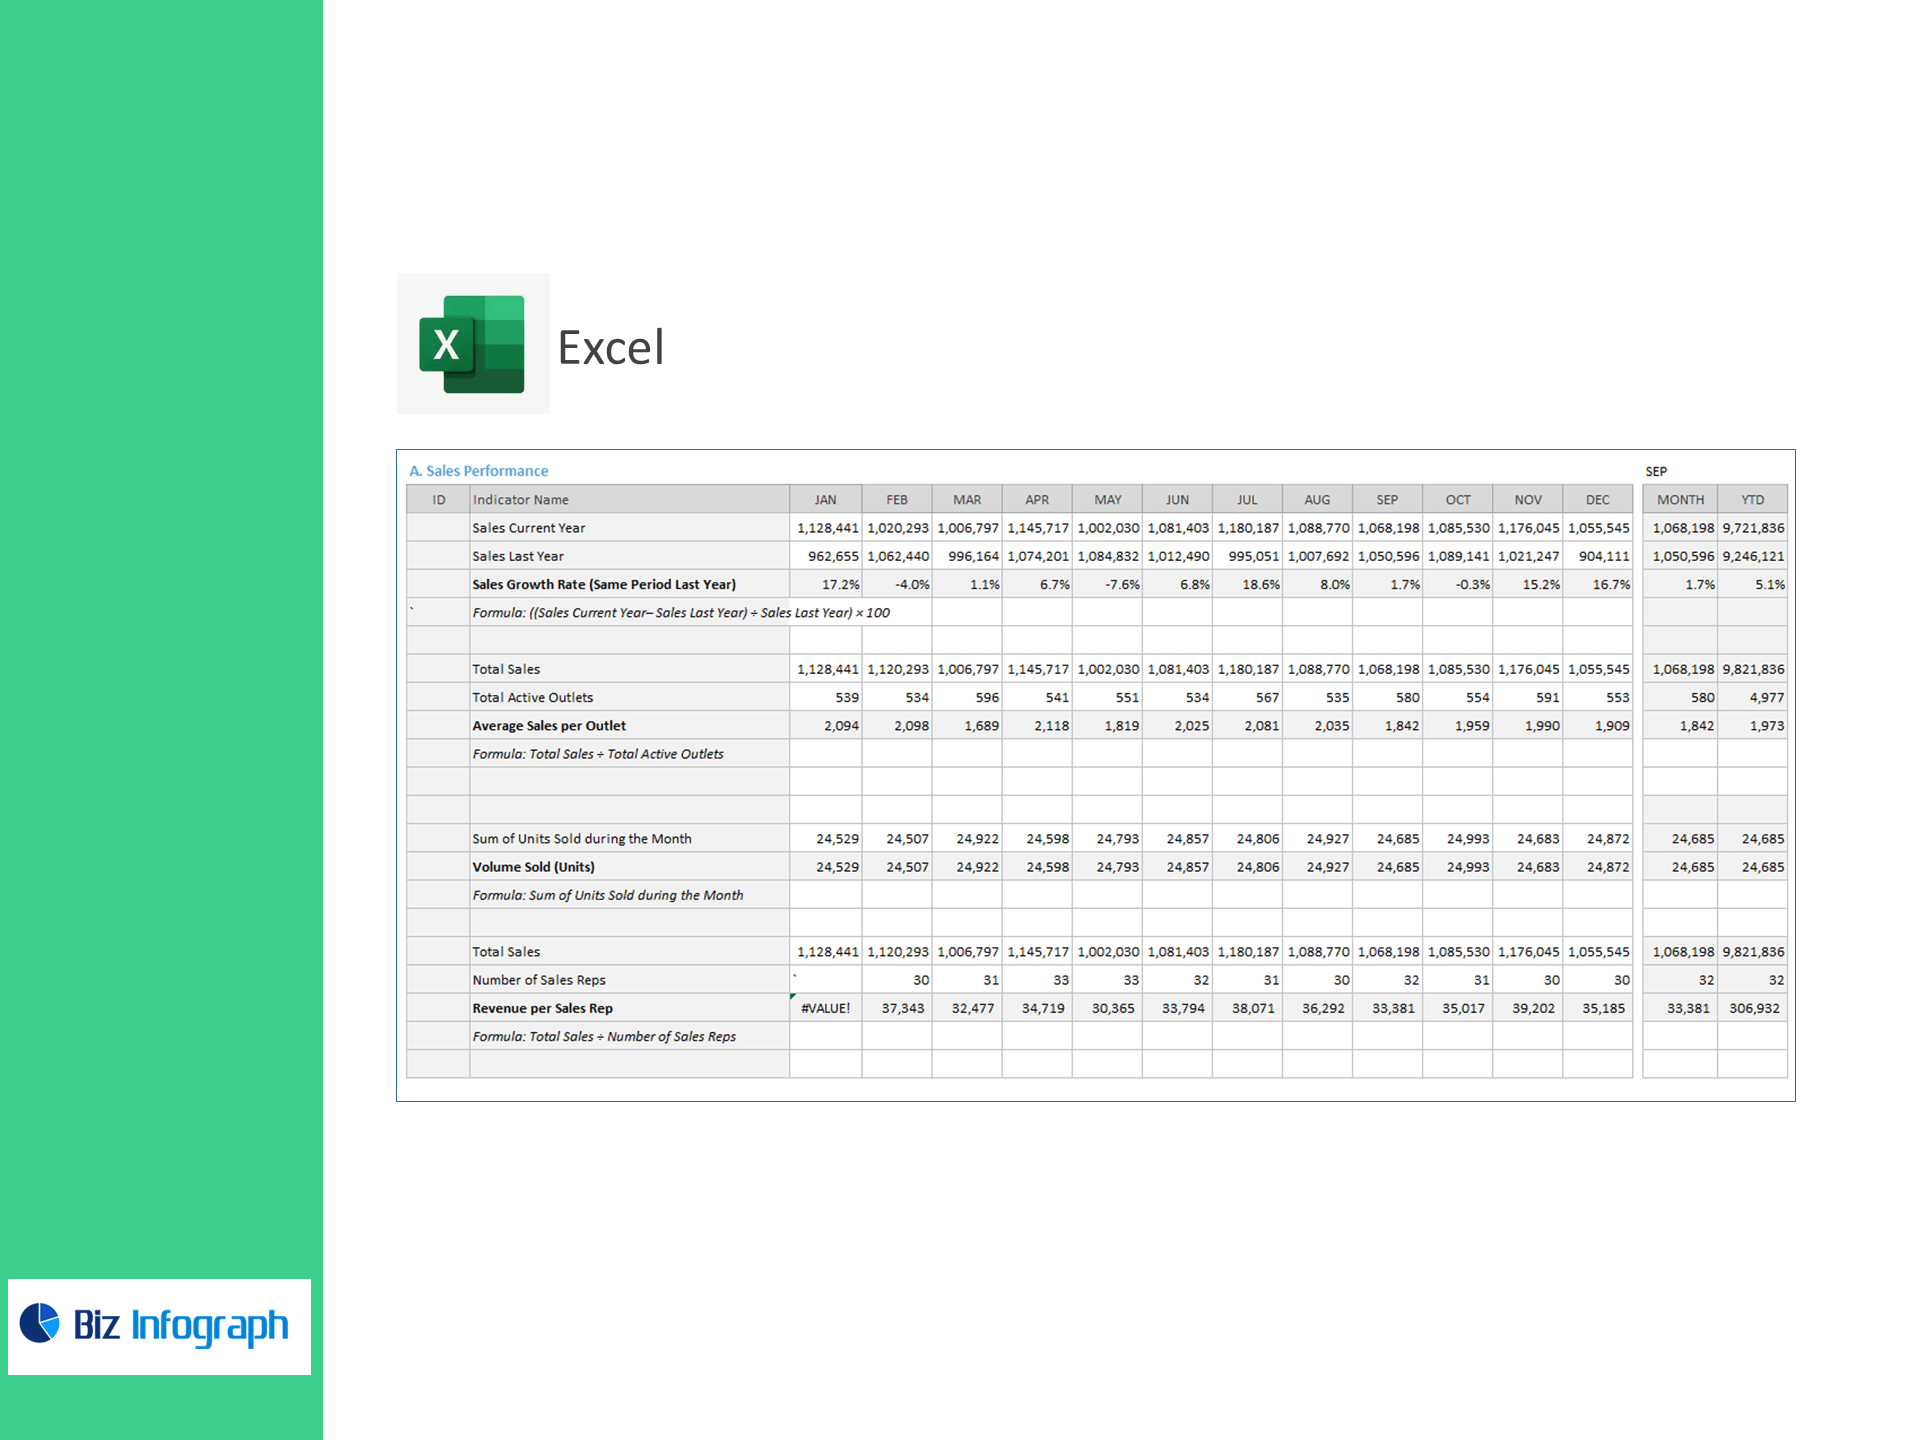
A) Sales Performance
-
Sales Growth Rate (vs. same period LY)
-
Average Sales per Outlet
-
Volume Sold (Units)
-
Revenue per Sales Rep
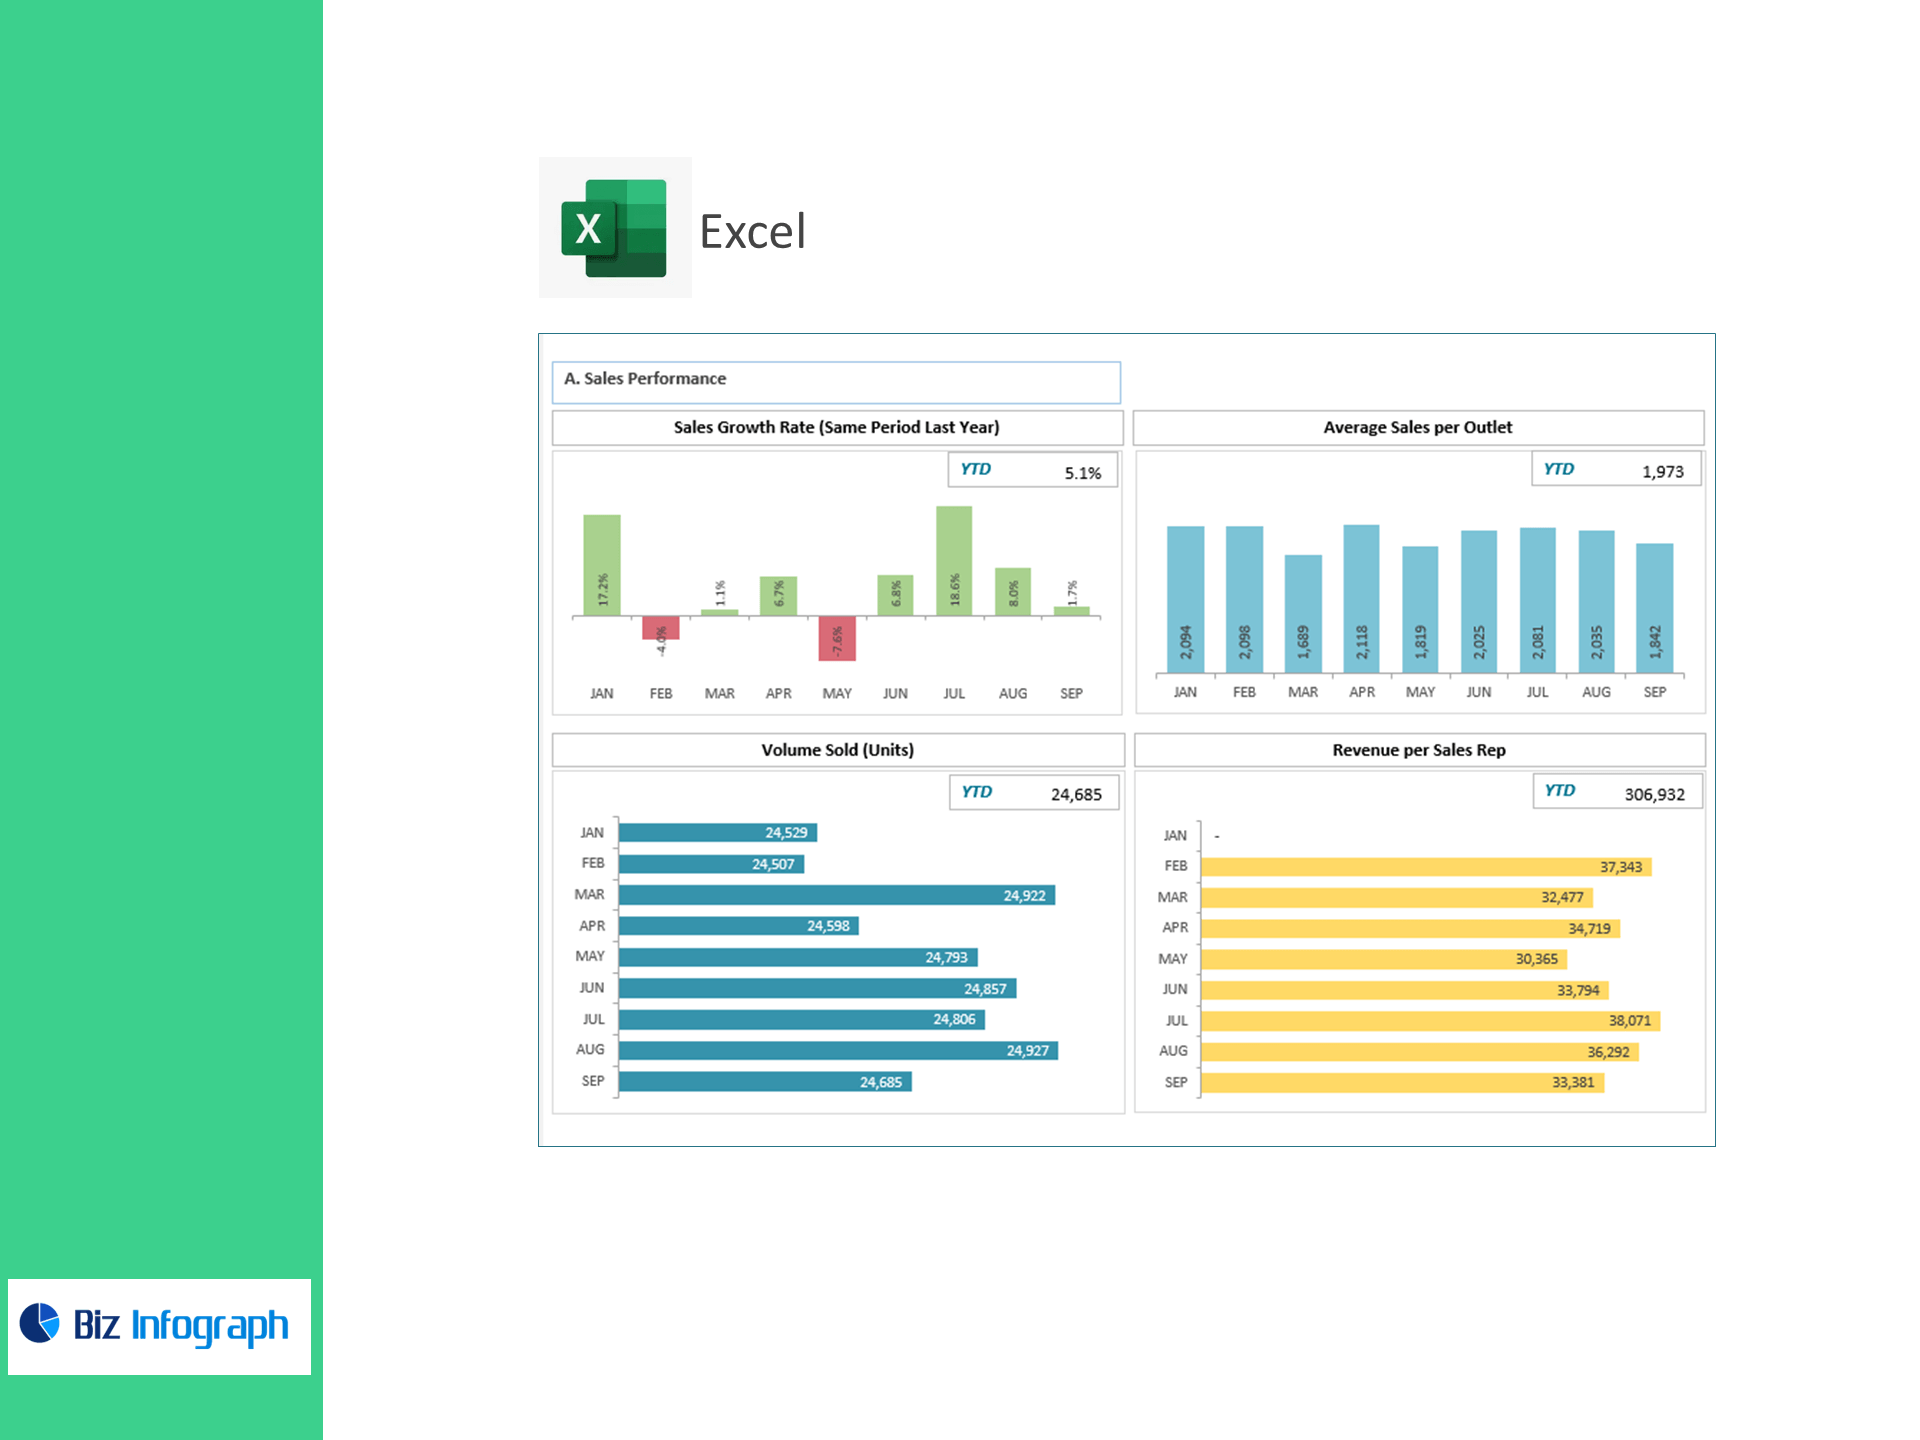
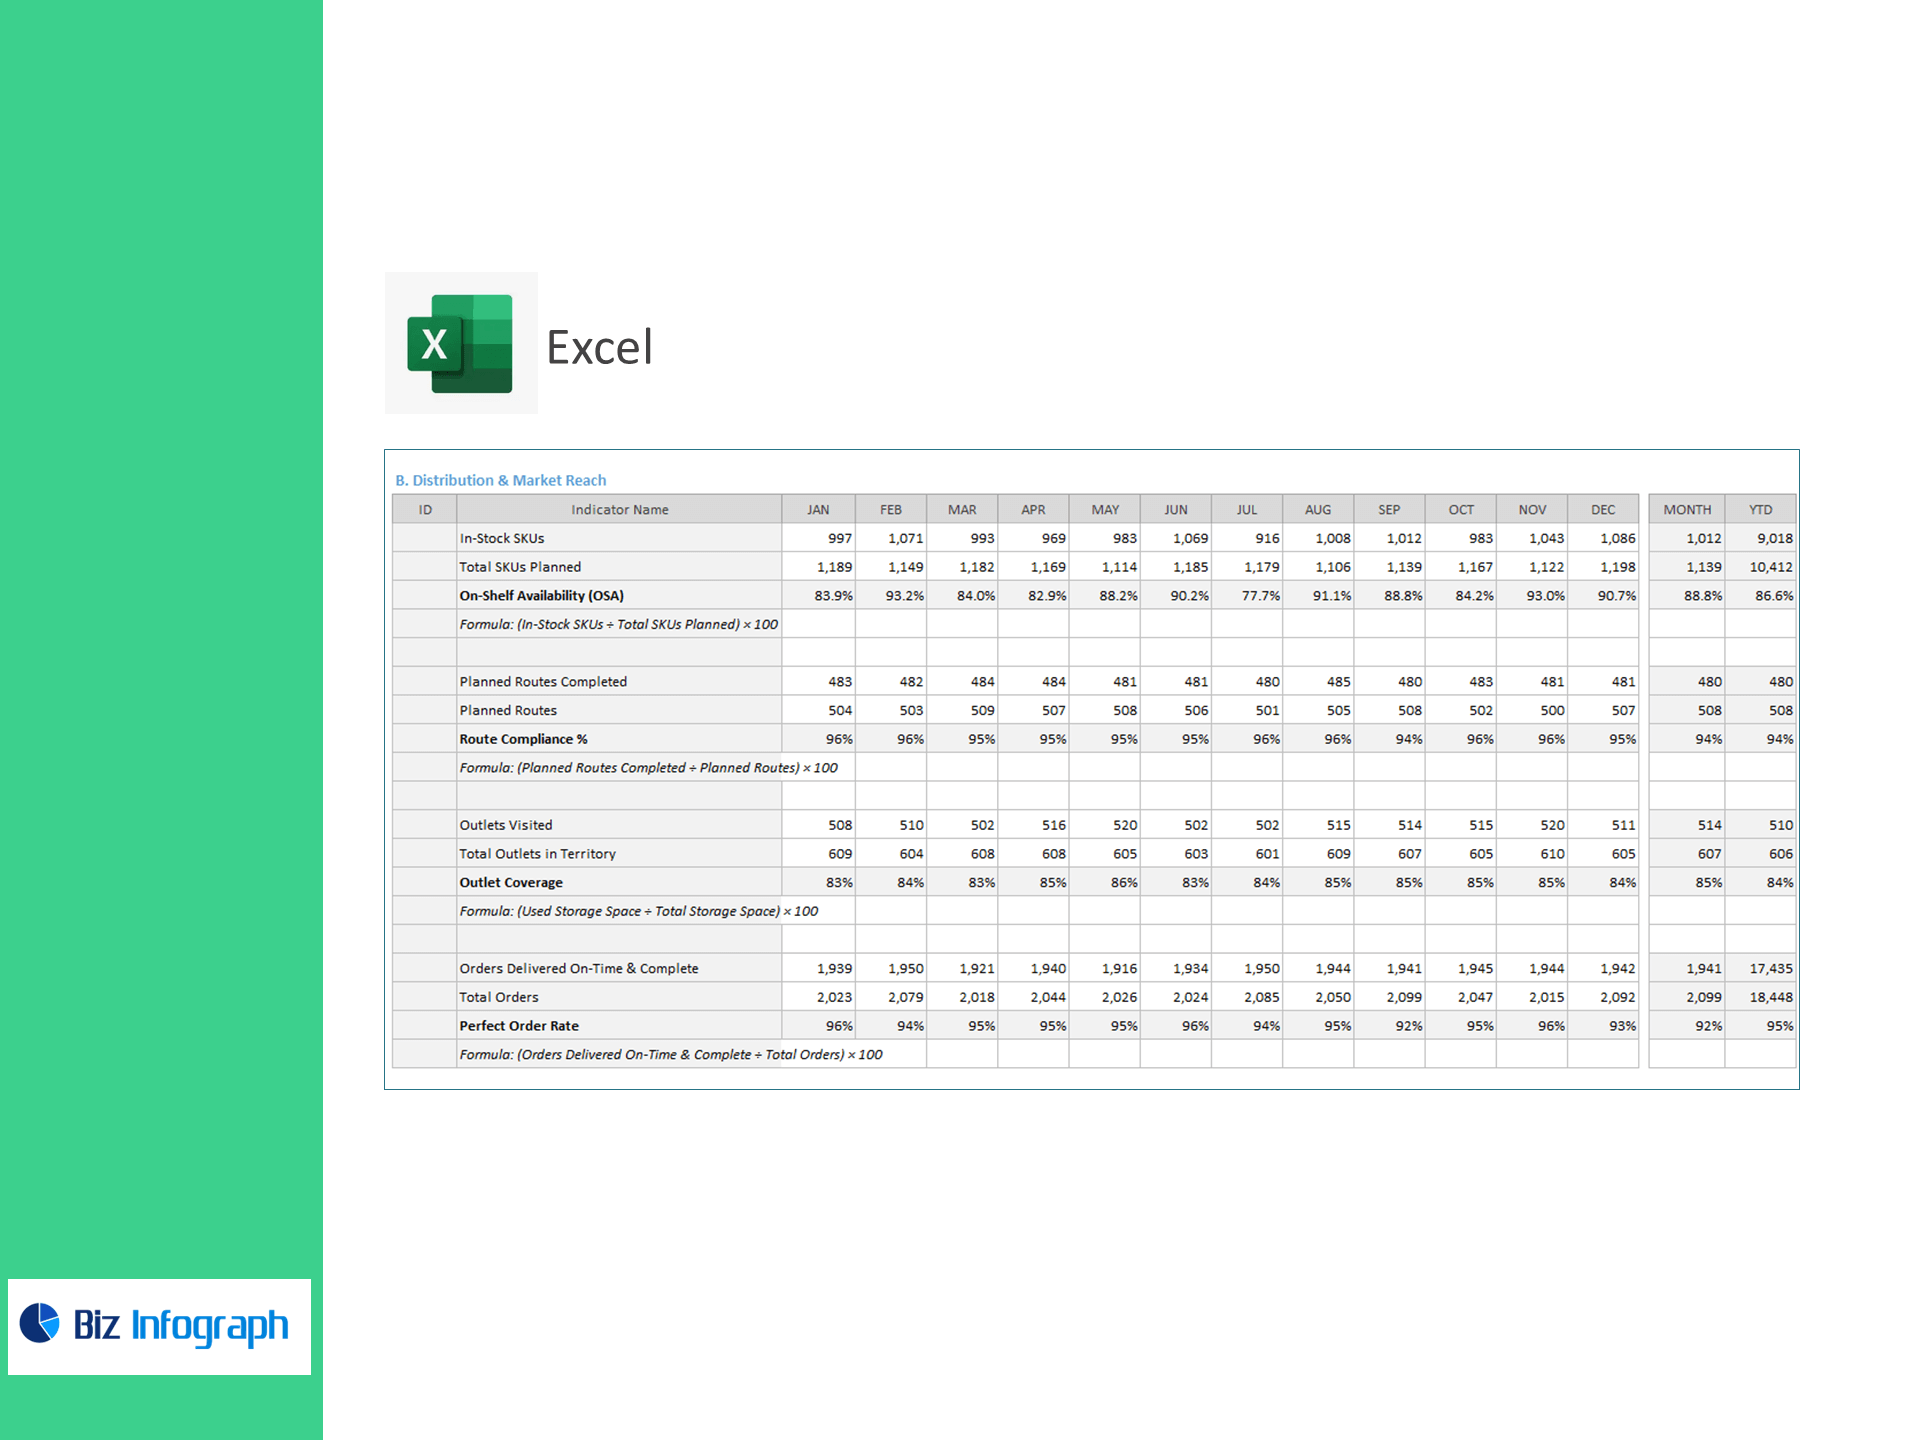
B) Distribution & Market Reach
-
On-Shelf Availability (OSA) = In-Stock SKUs ÷ Planned SKUs
-
Route Compliance % (planned vs. completed routes)
-
Outlet Coverage (visited outlets vs. territory)
-
Perfect Order Rate (on-time & complete)
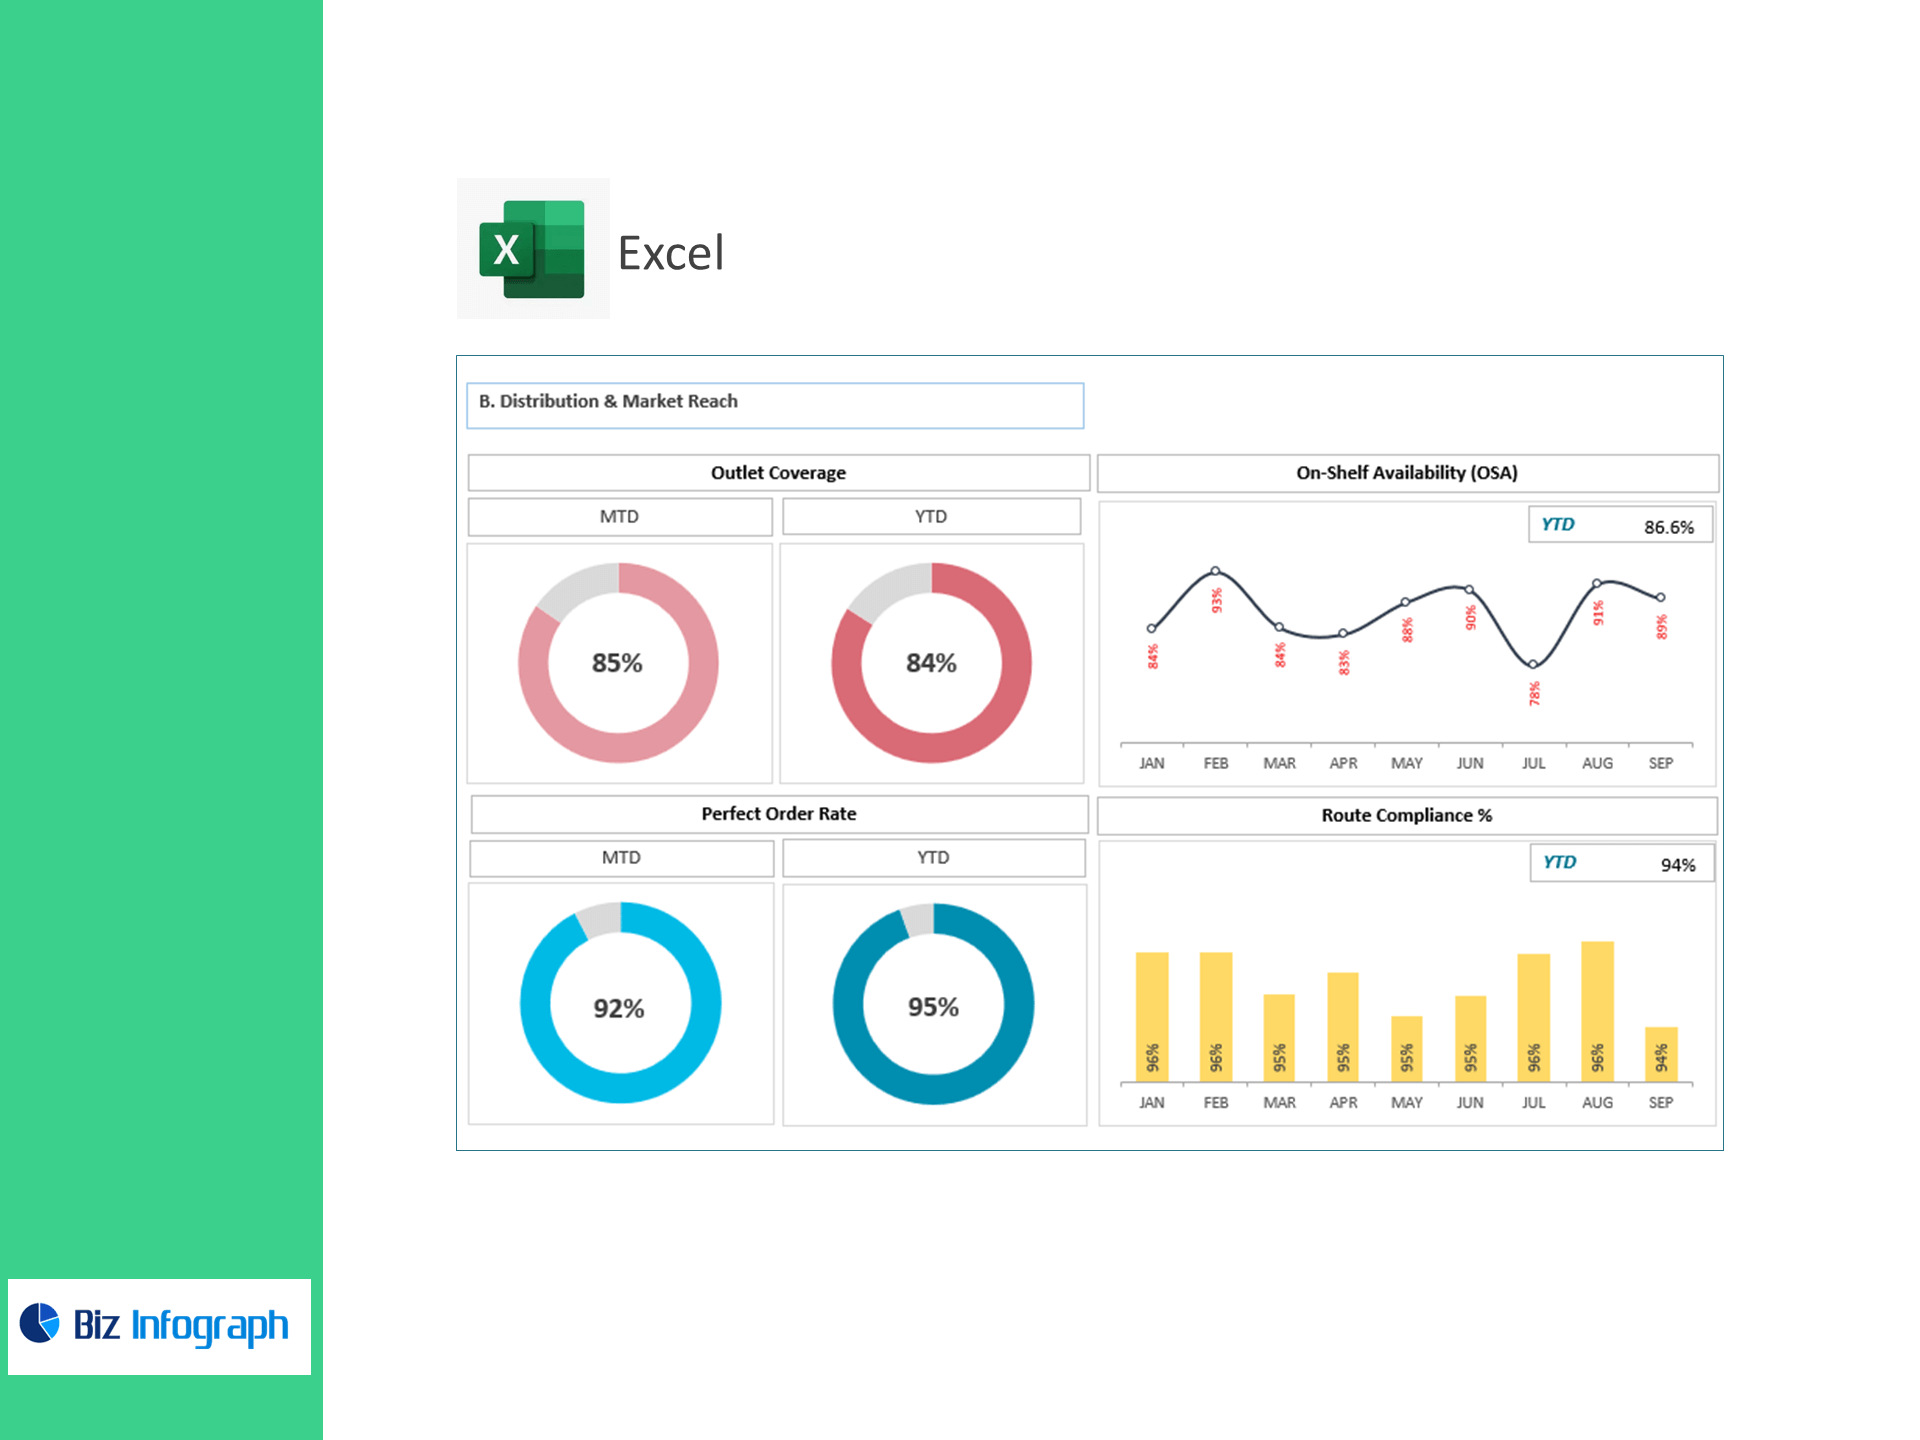
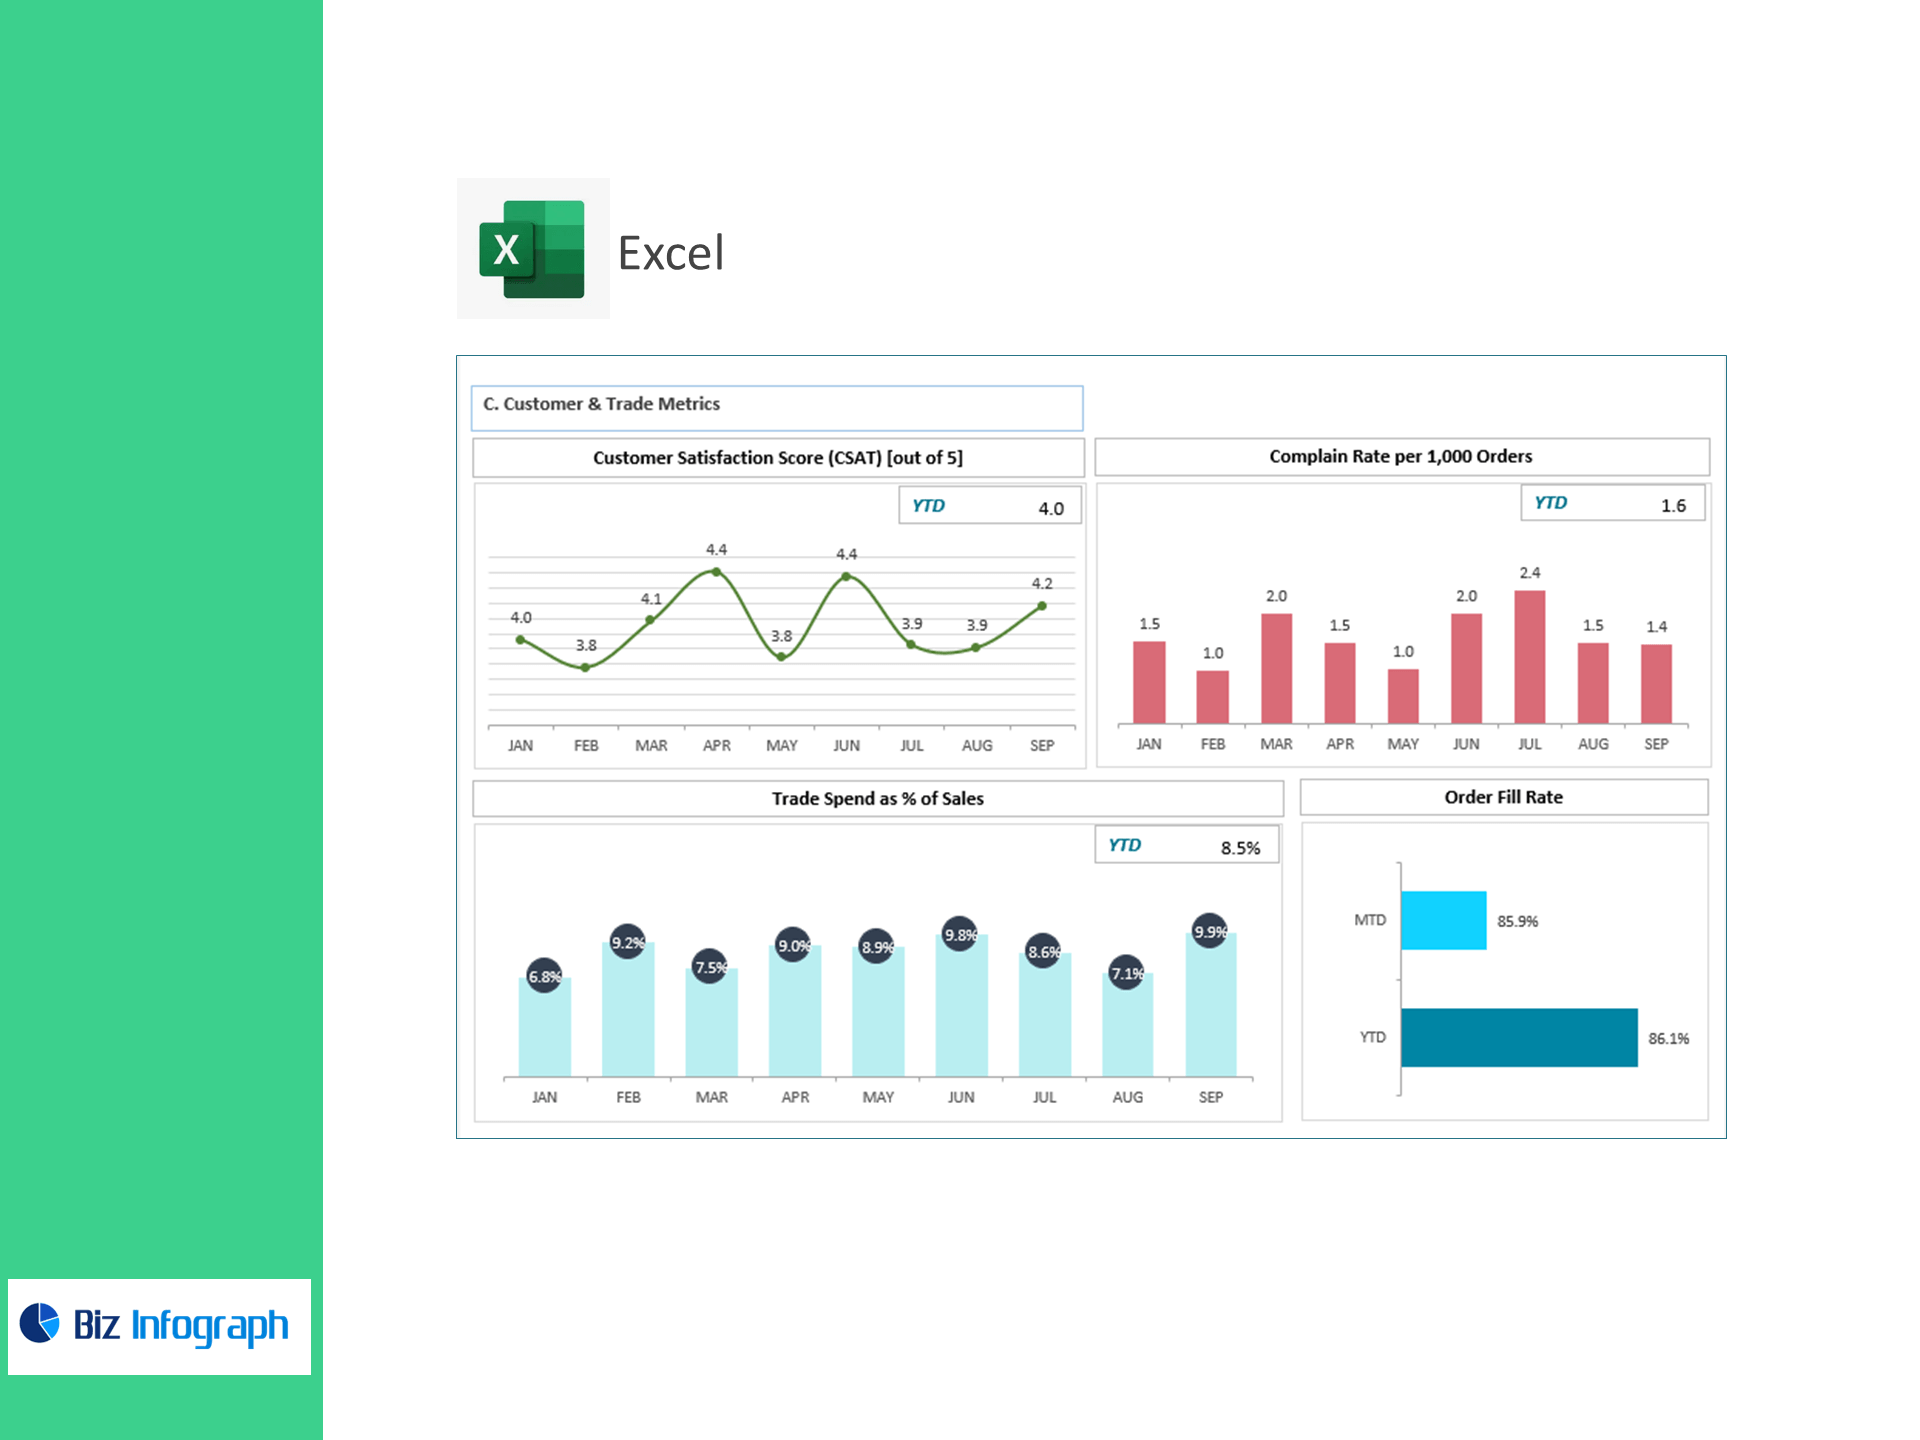
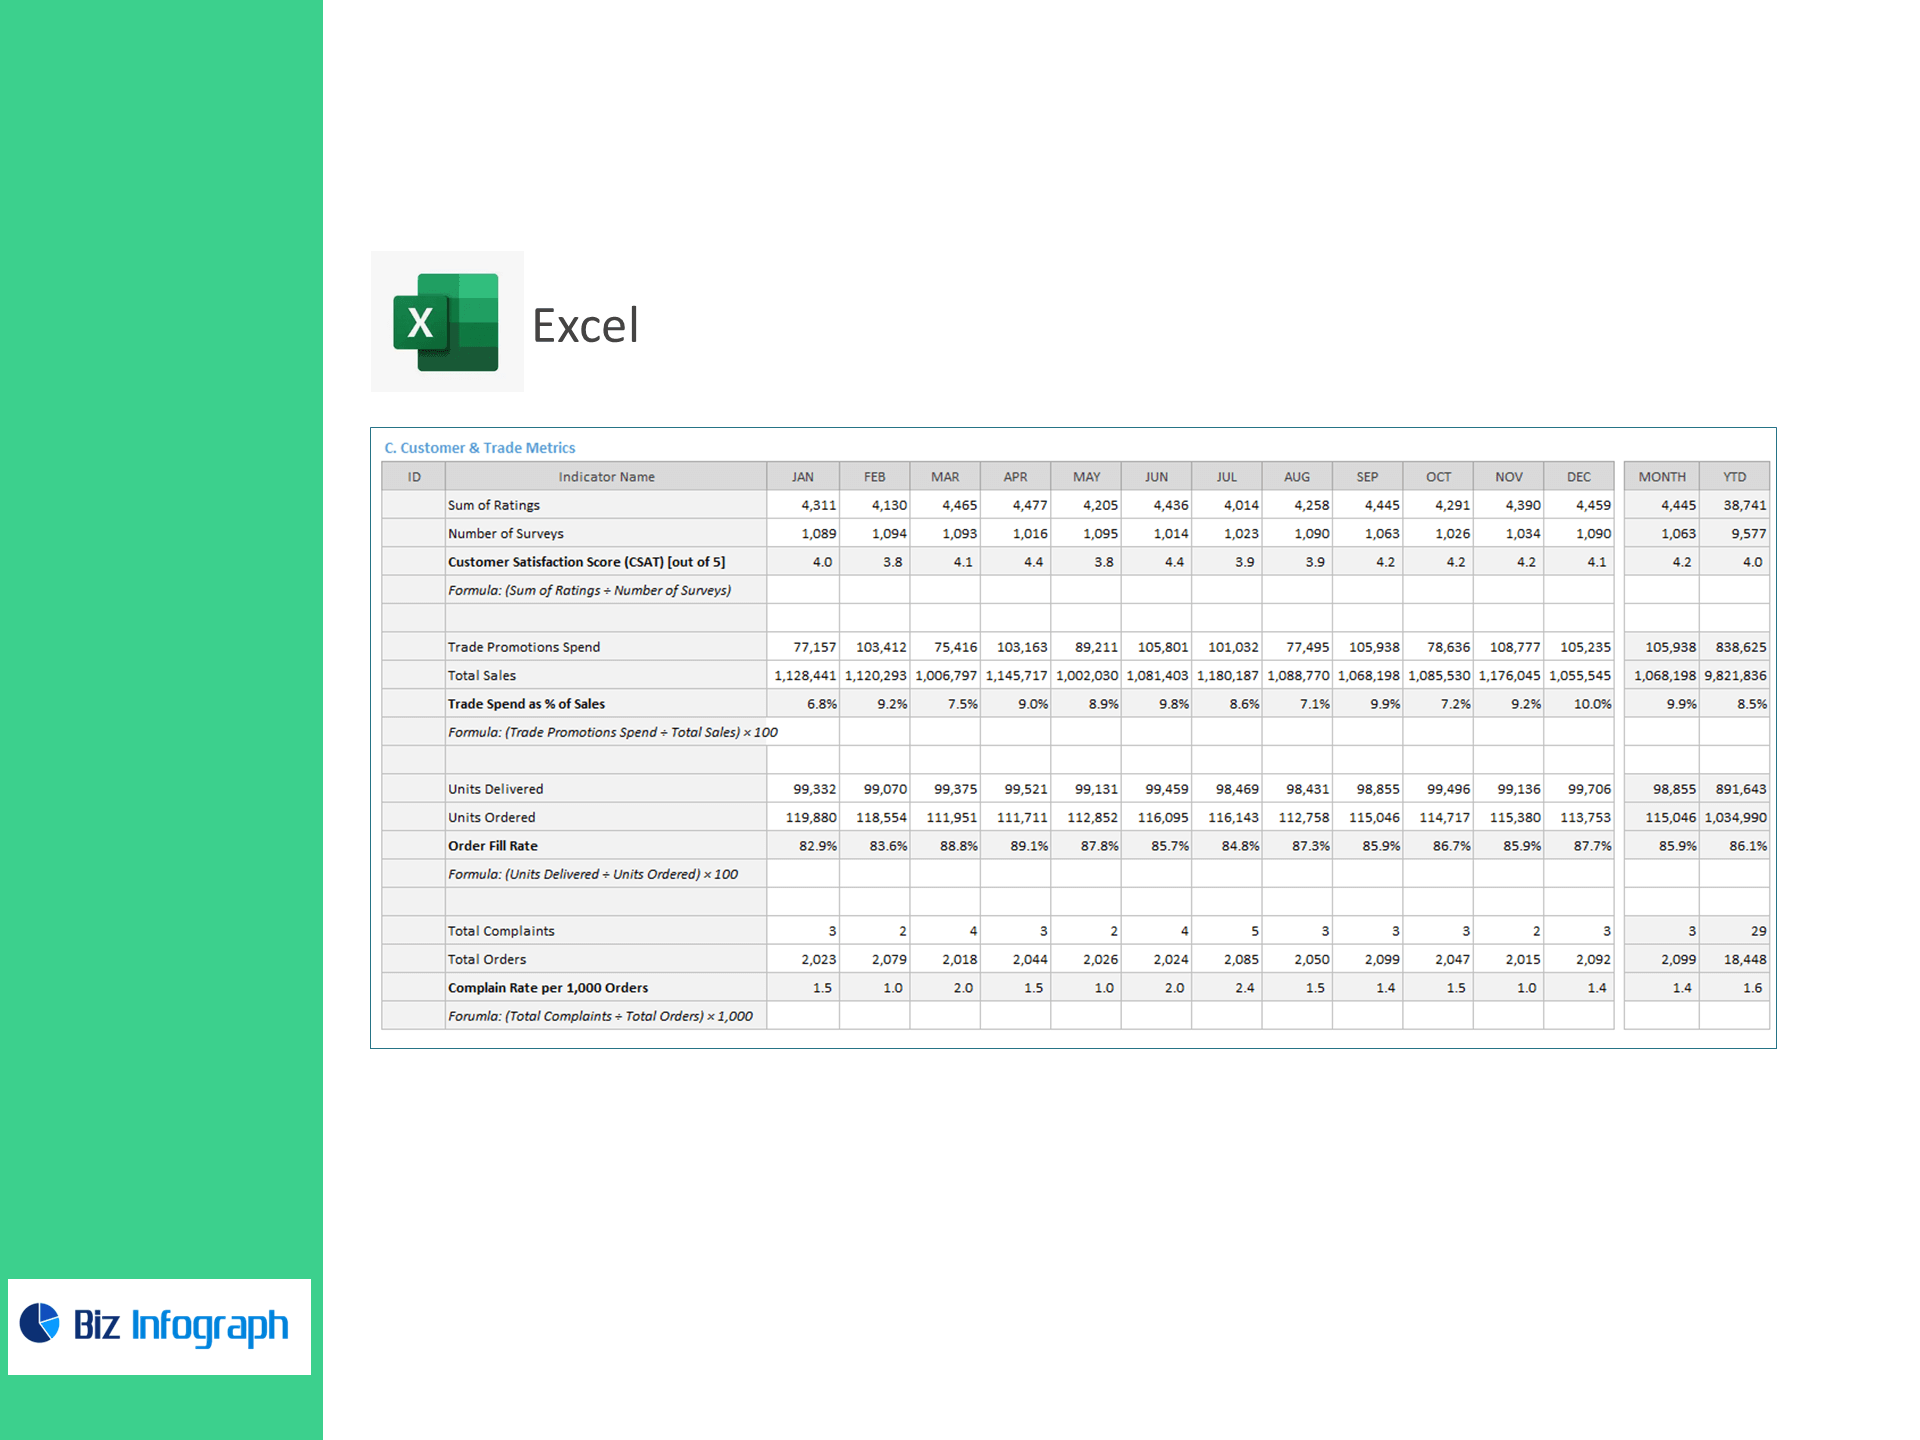
C) Customer & Trade Metrics
-
CSAT [out of 5]
-
Trade Spend % of Sales
-
Order Fill Rate
-
Complaint Rate per 1,000 Orders
Why sales leaders use it
-
Spot growth drivers fast: See which reps, regions, or channels push Sales Growth and AOV.
-
Fix execution gaps: OSA, route compliance, and outlet coverage expose distribution blind spots.
-
Protect service levels: Perfect order, fill rate, and complaint rate keep OTIF high.
-
Spend smarter: Monitor trade promotions as a % of sales and tie to CSAT and units moved.
What’s inside
-
Executive dashboard with KPI cards, trends, and RAG targets
-
Rep, region, channel, and outlet drill-downs
-
OSA & route compliance tracker with heat maps
-
OTIF & fill-rate service scorecard
-
CSAT and complaints analytics with benchmarks
-
Clean data sheet (paste CSV/XLSX exports), one-click refresh
-
Works with Excel 365/2021 (Win/Mac). No macros required.
For ready-to-use Dashboard Templates: