Employee Engagement Dashboard Template: Actionable Analytics for HR Professionals
Employee Engagement Dashboard Template in Excel and Google Sheets
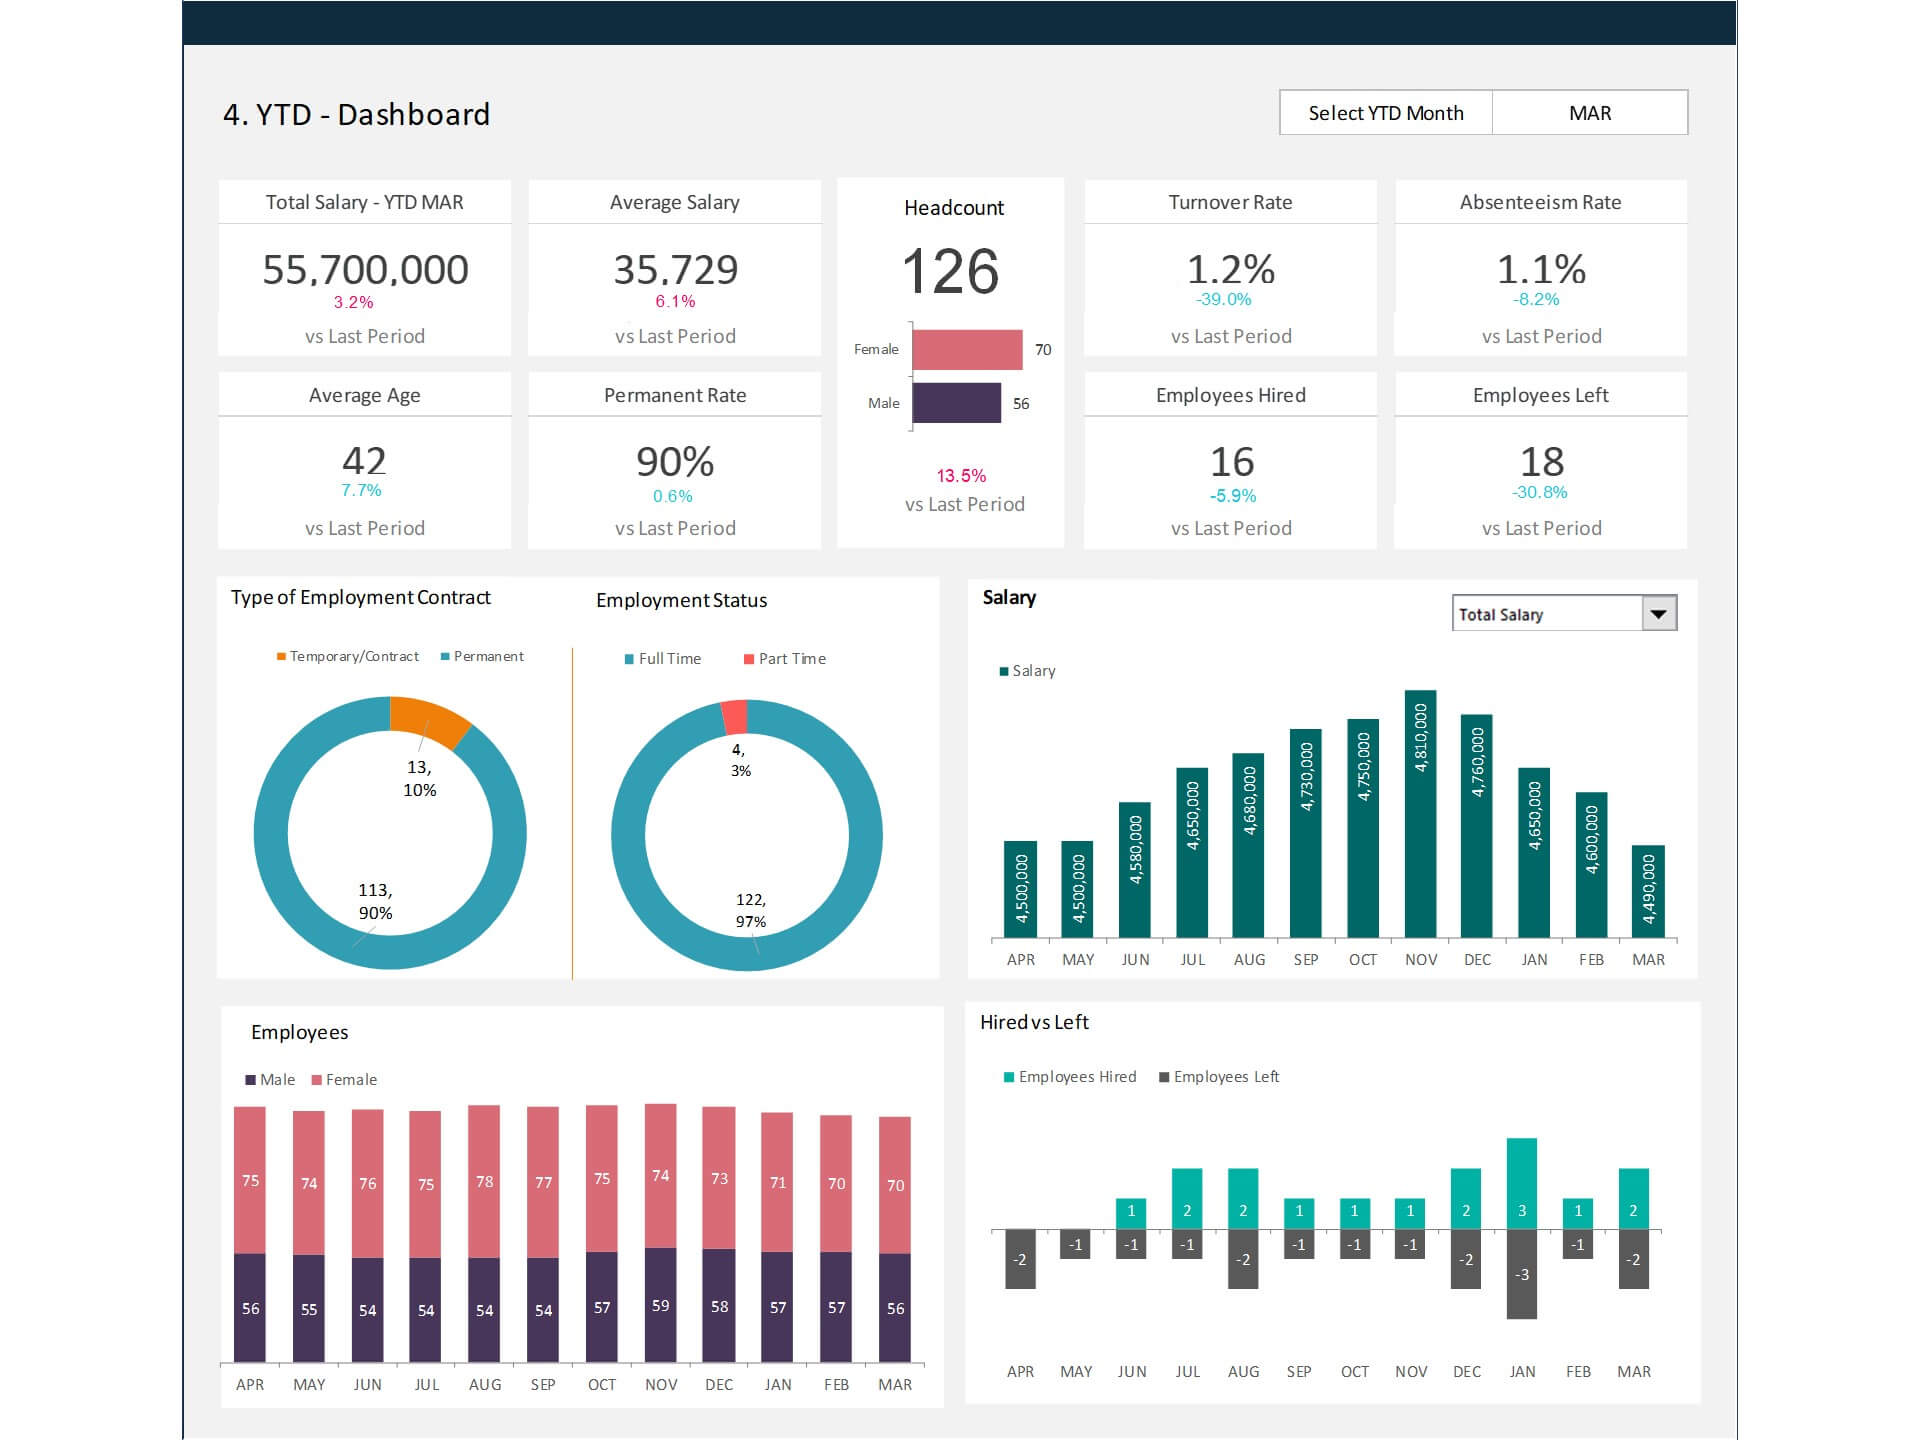
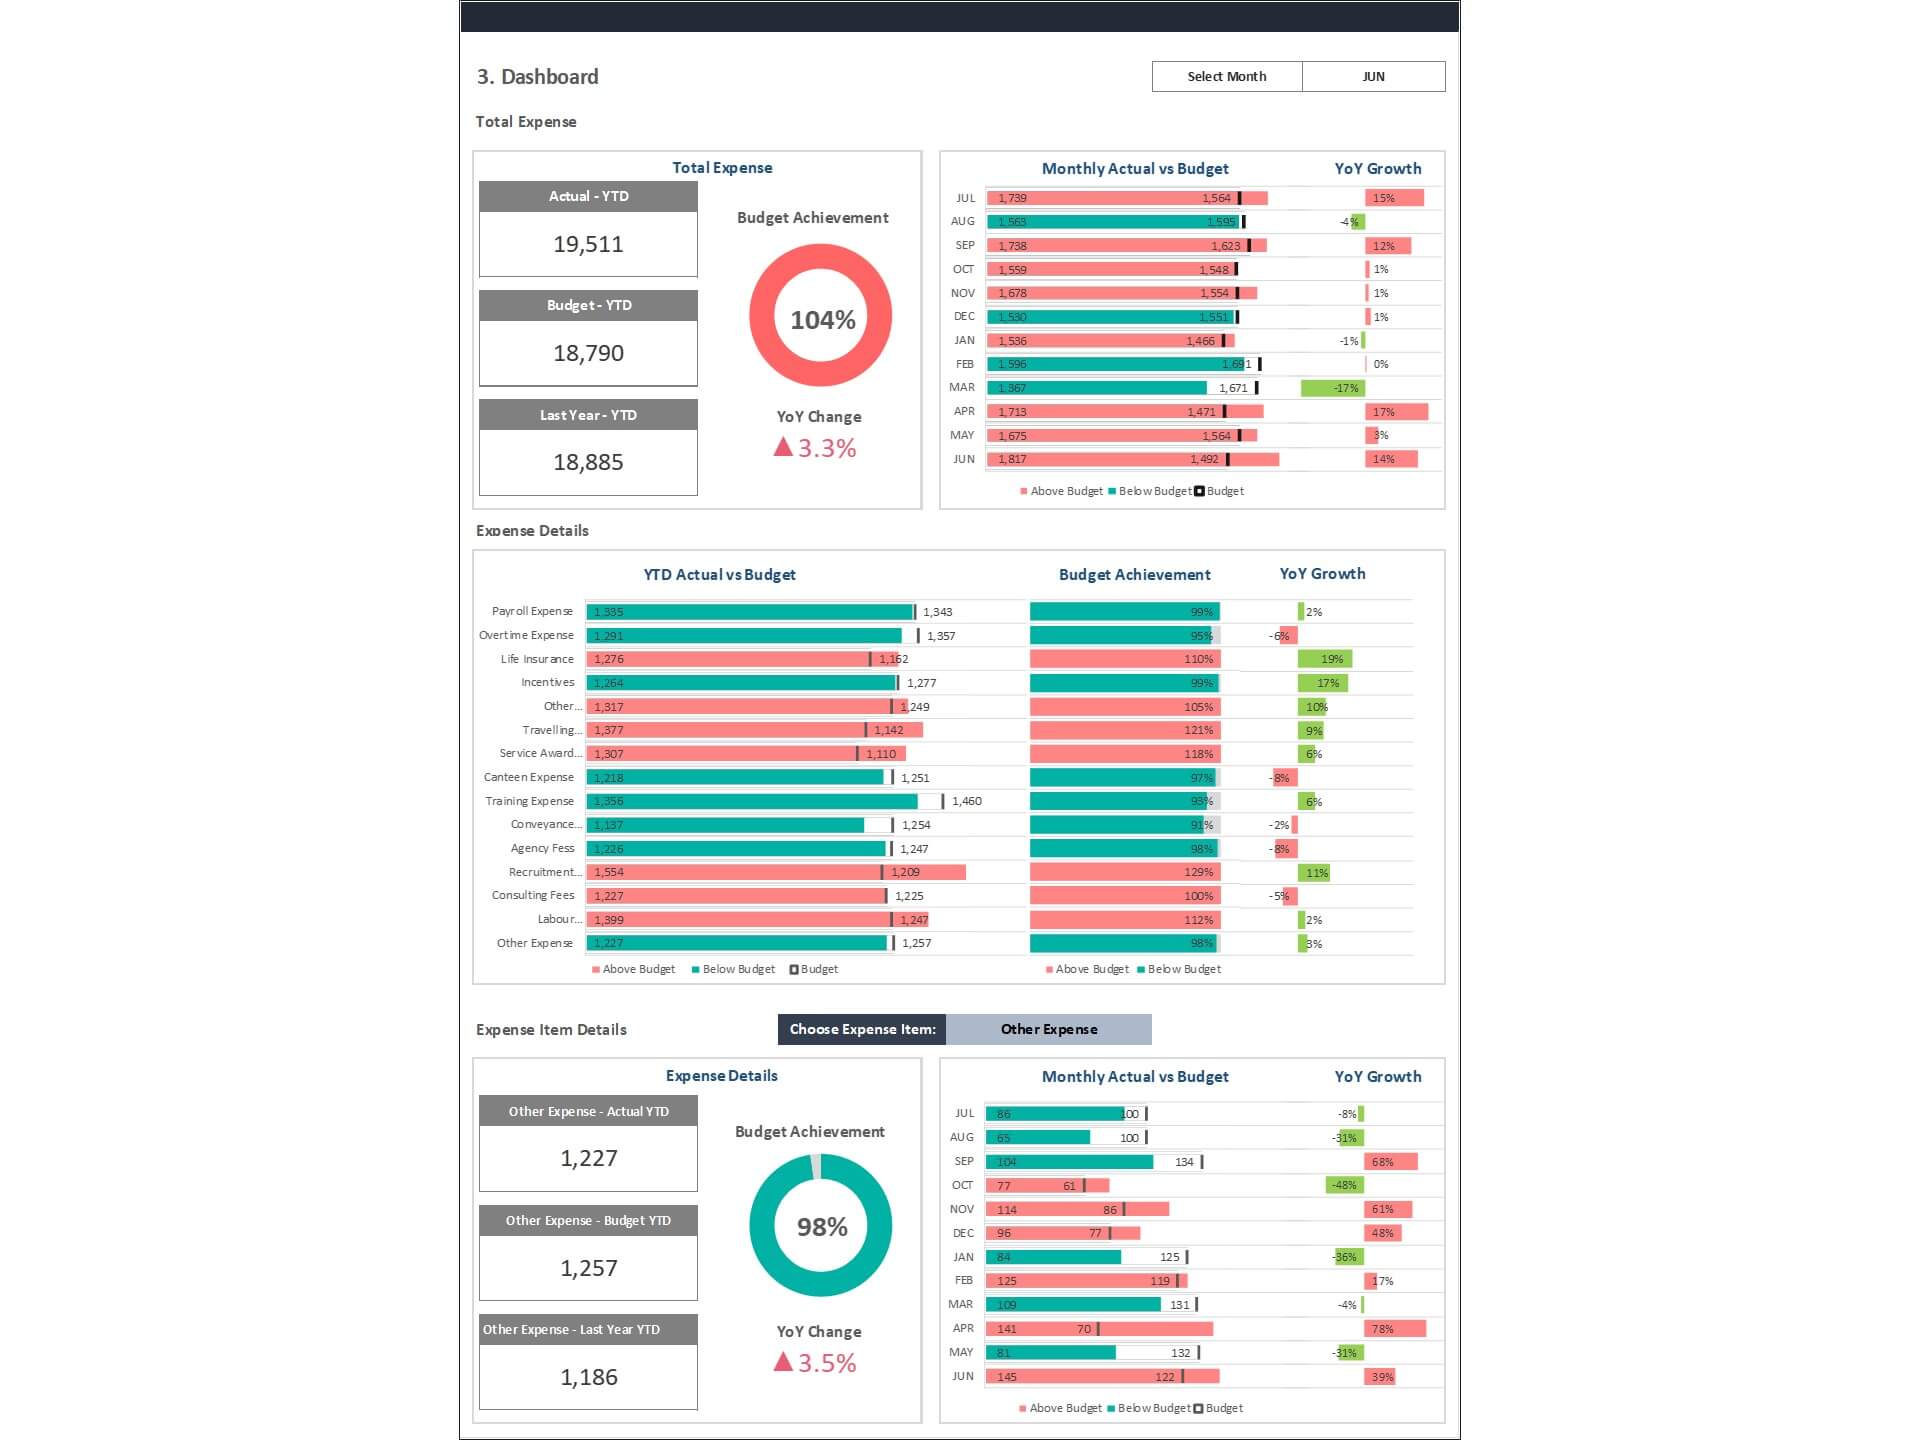
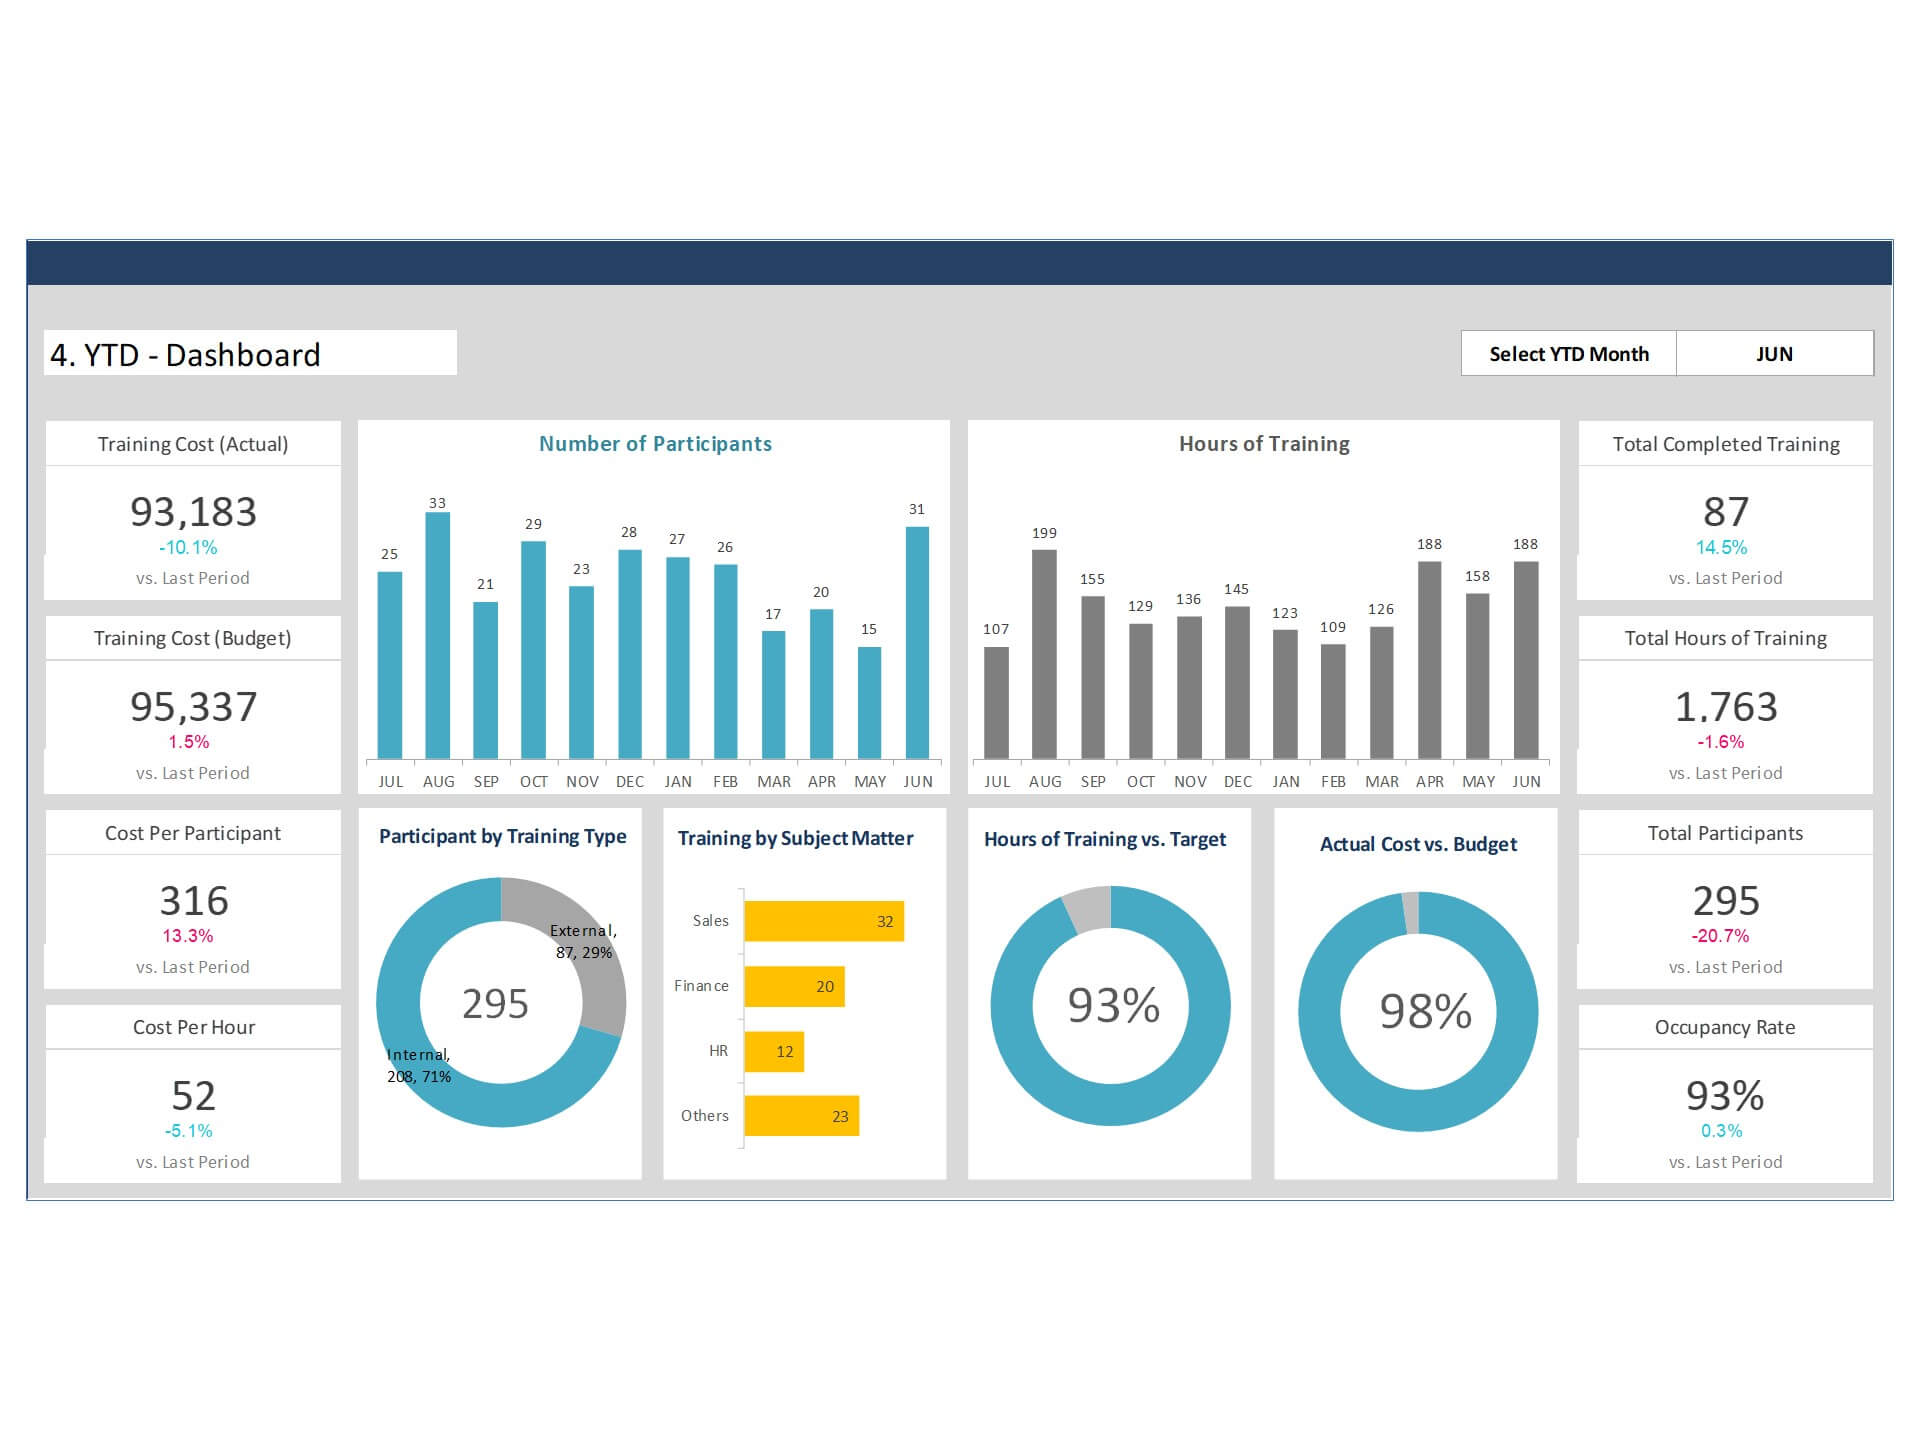
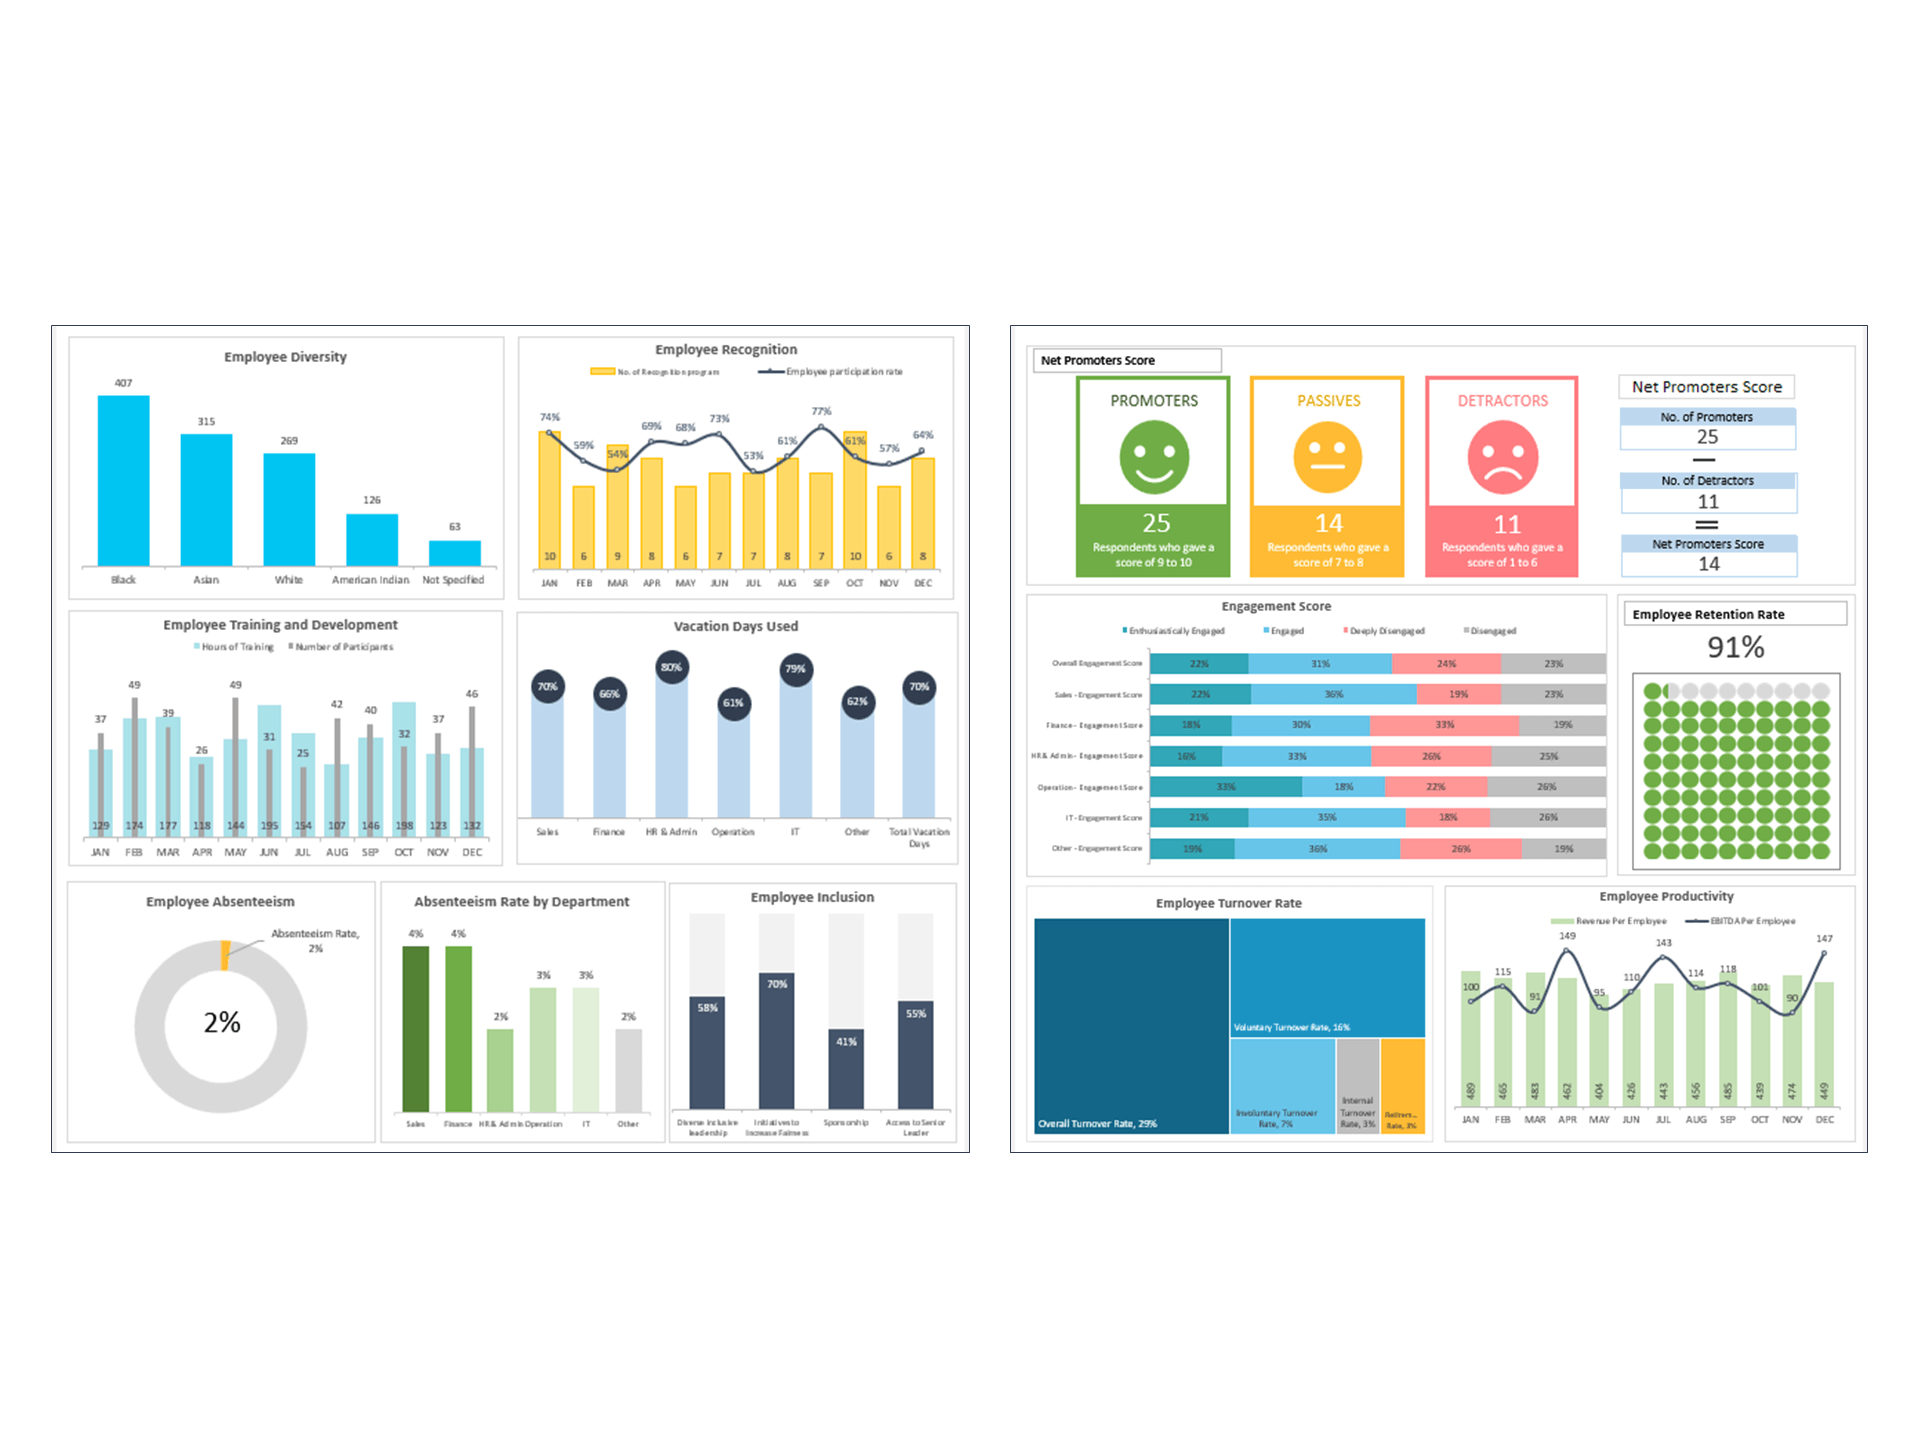
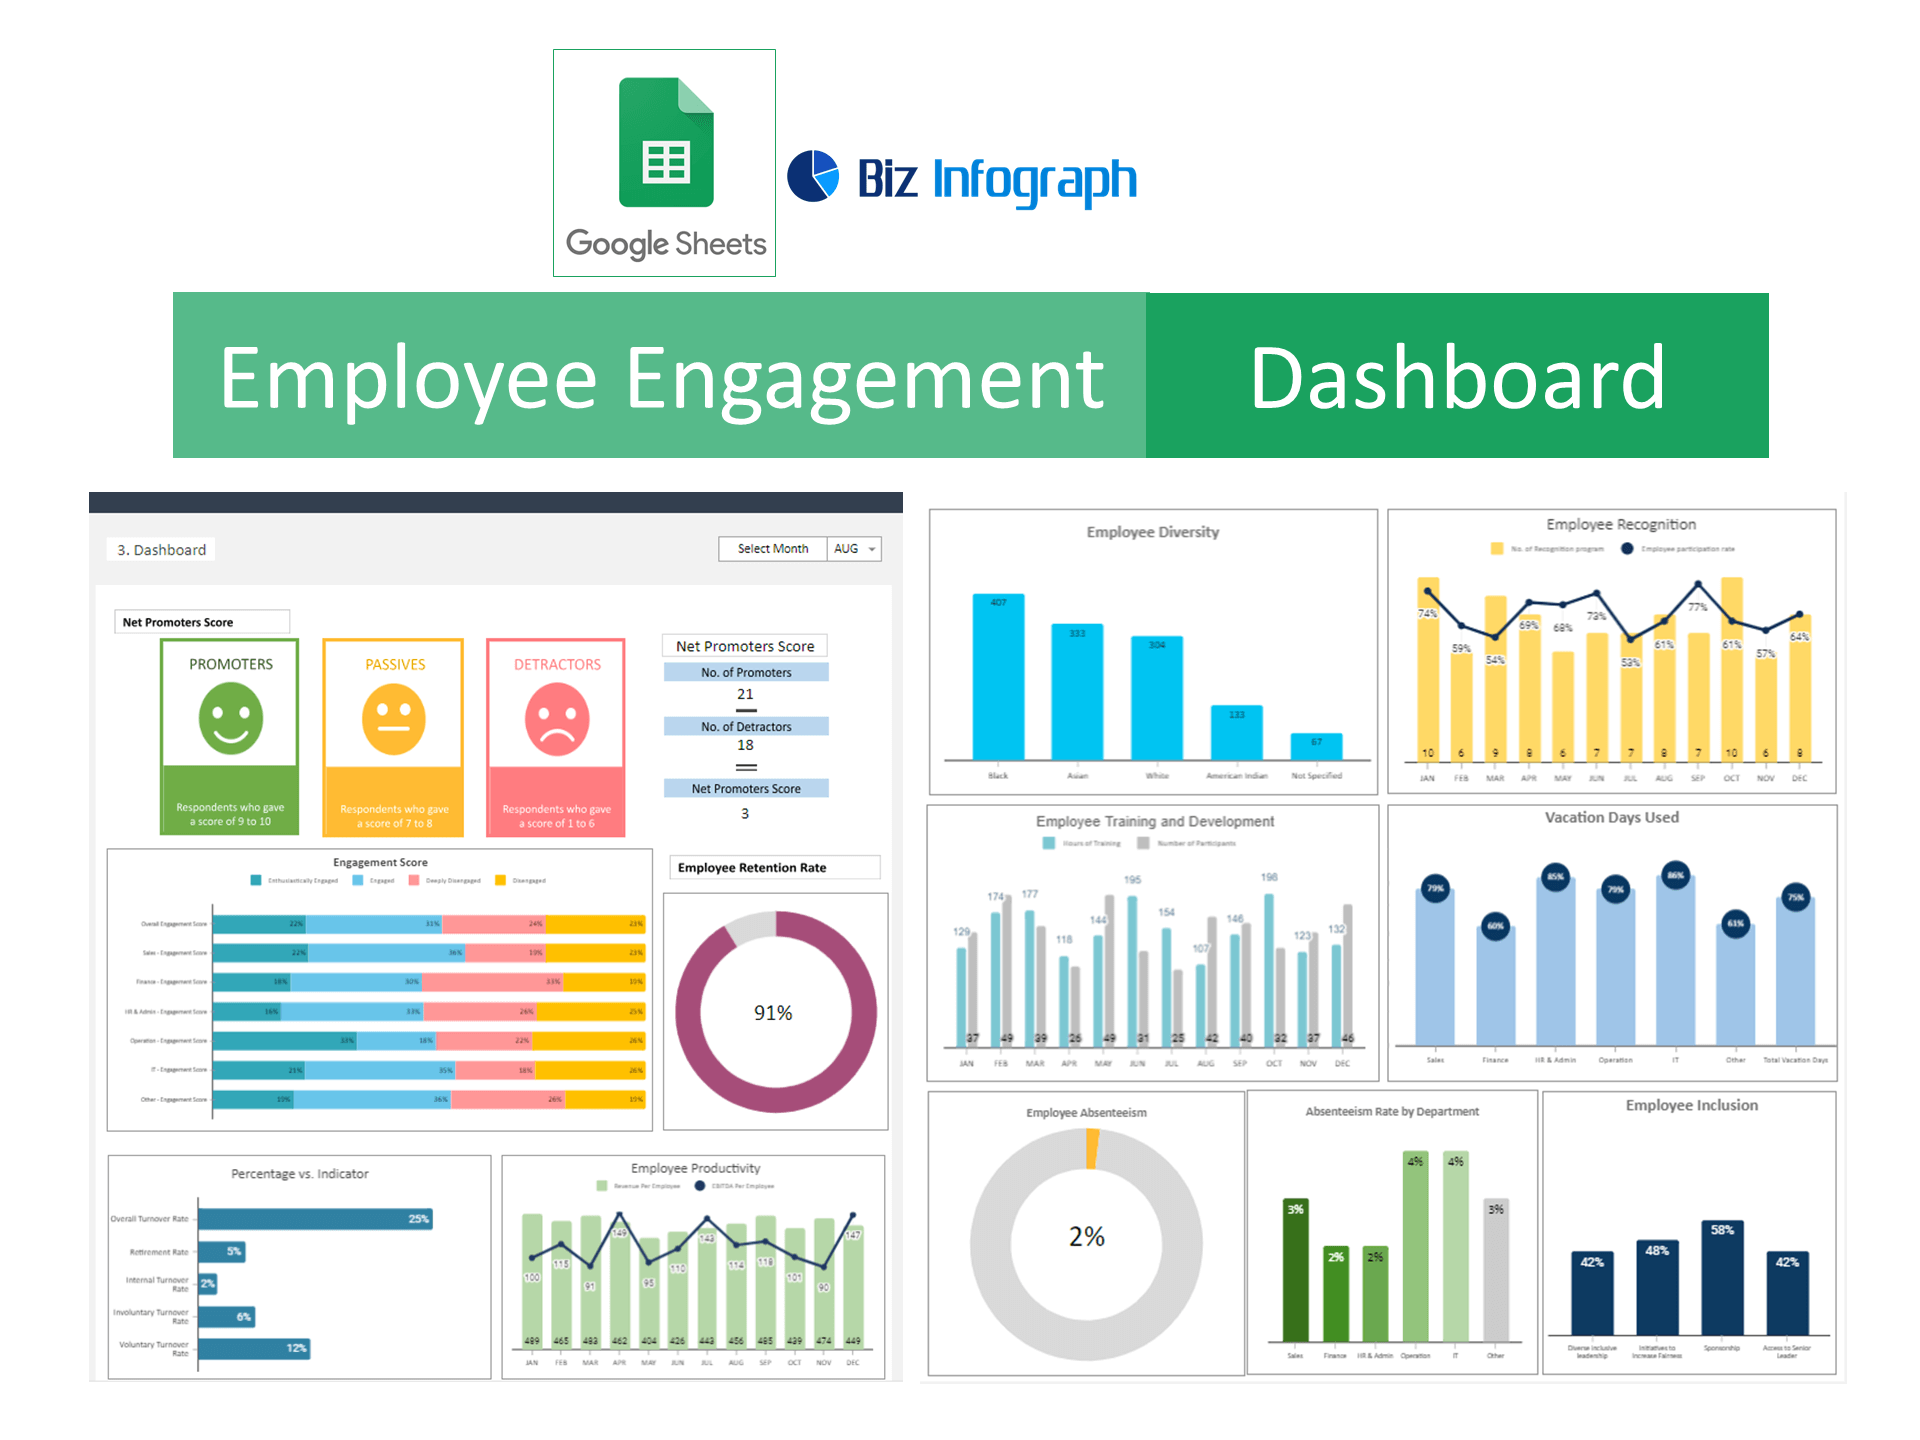
The Employee Engagement Dashboard Excel Template is a powerful Dashboard in Excel designed to help organizations monitor and improve Employee Engagement across the workplace. This Engagement Dashboard allows HR teams and managers to analyze employee satisfaction, feedback results, participation levels, and engagement trends in a clear visual format.
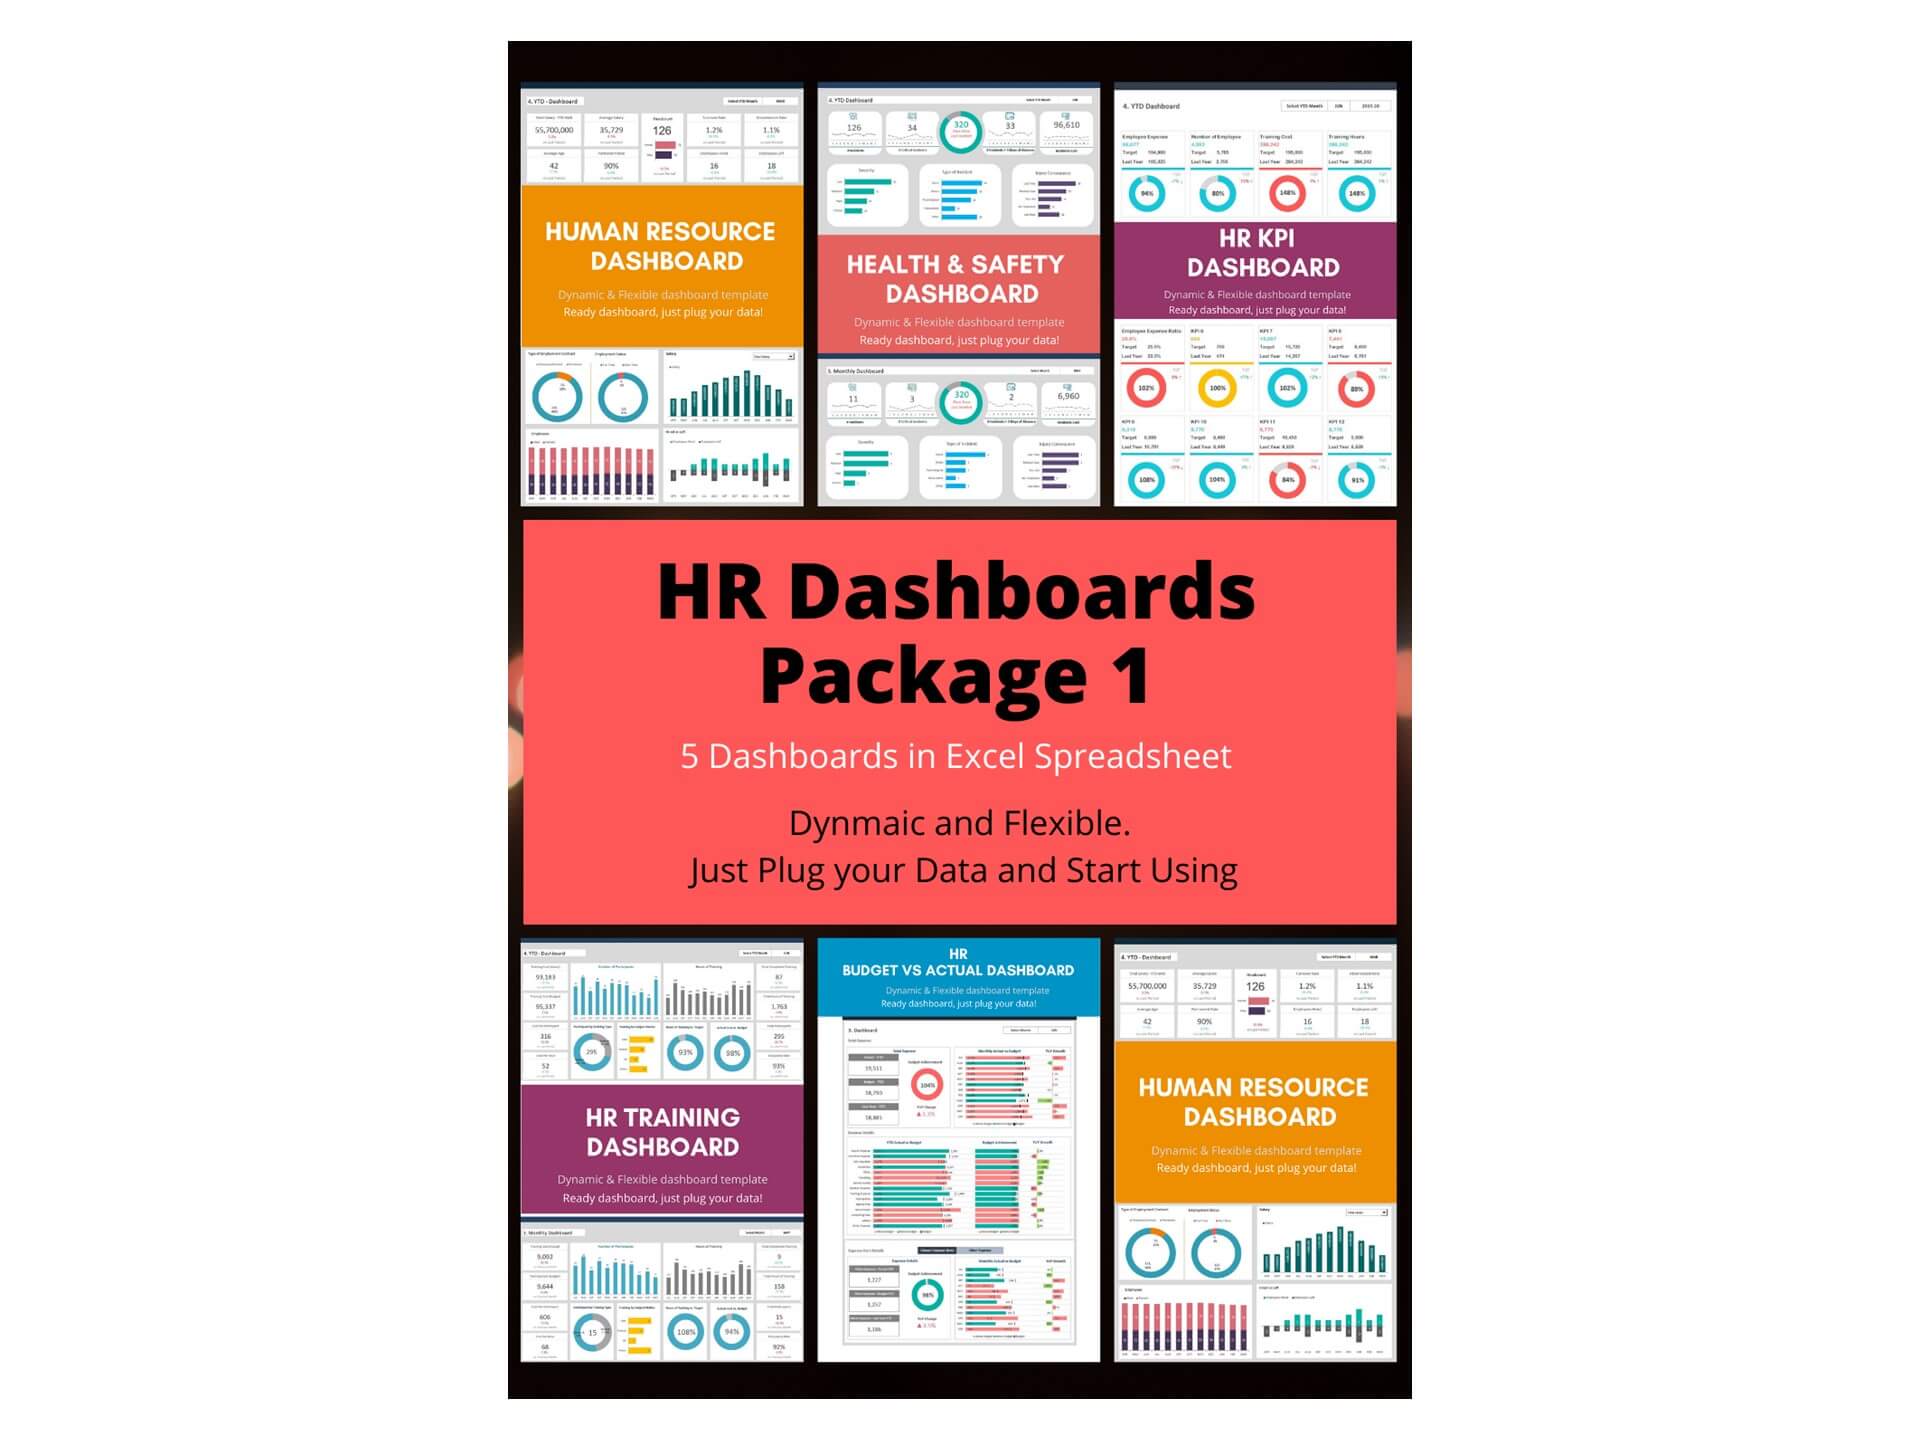
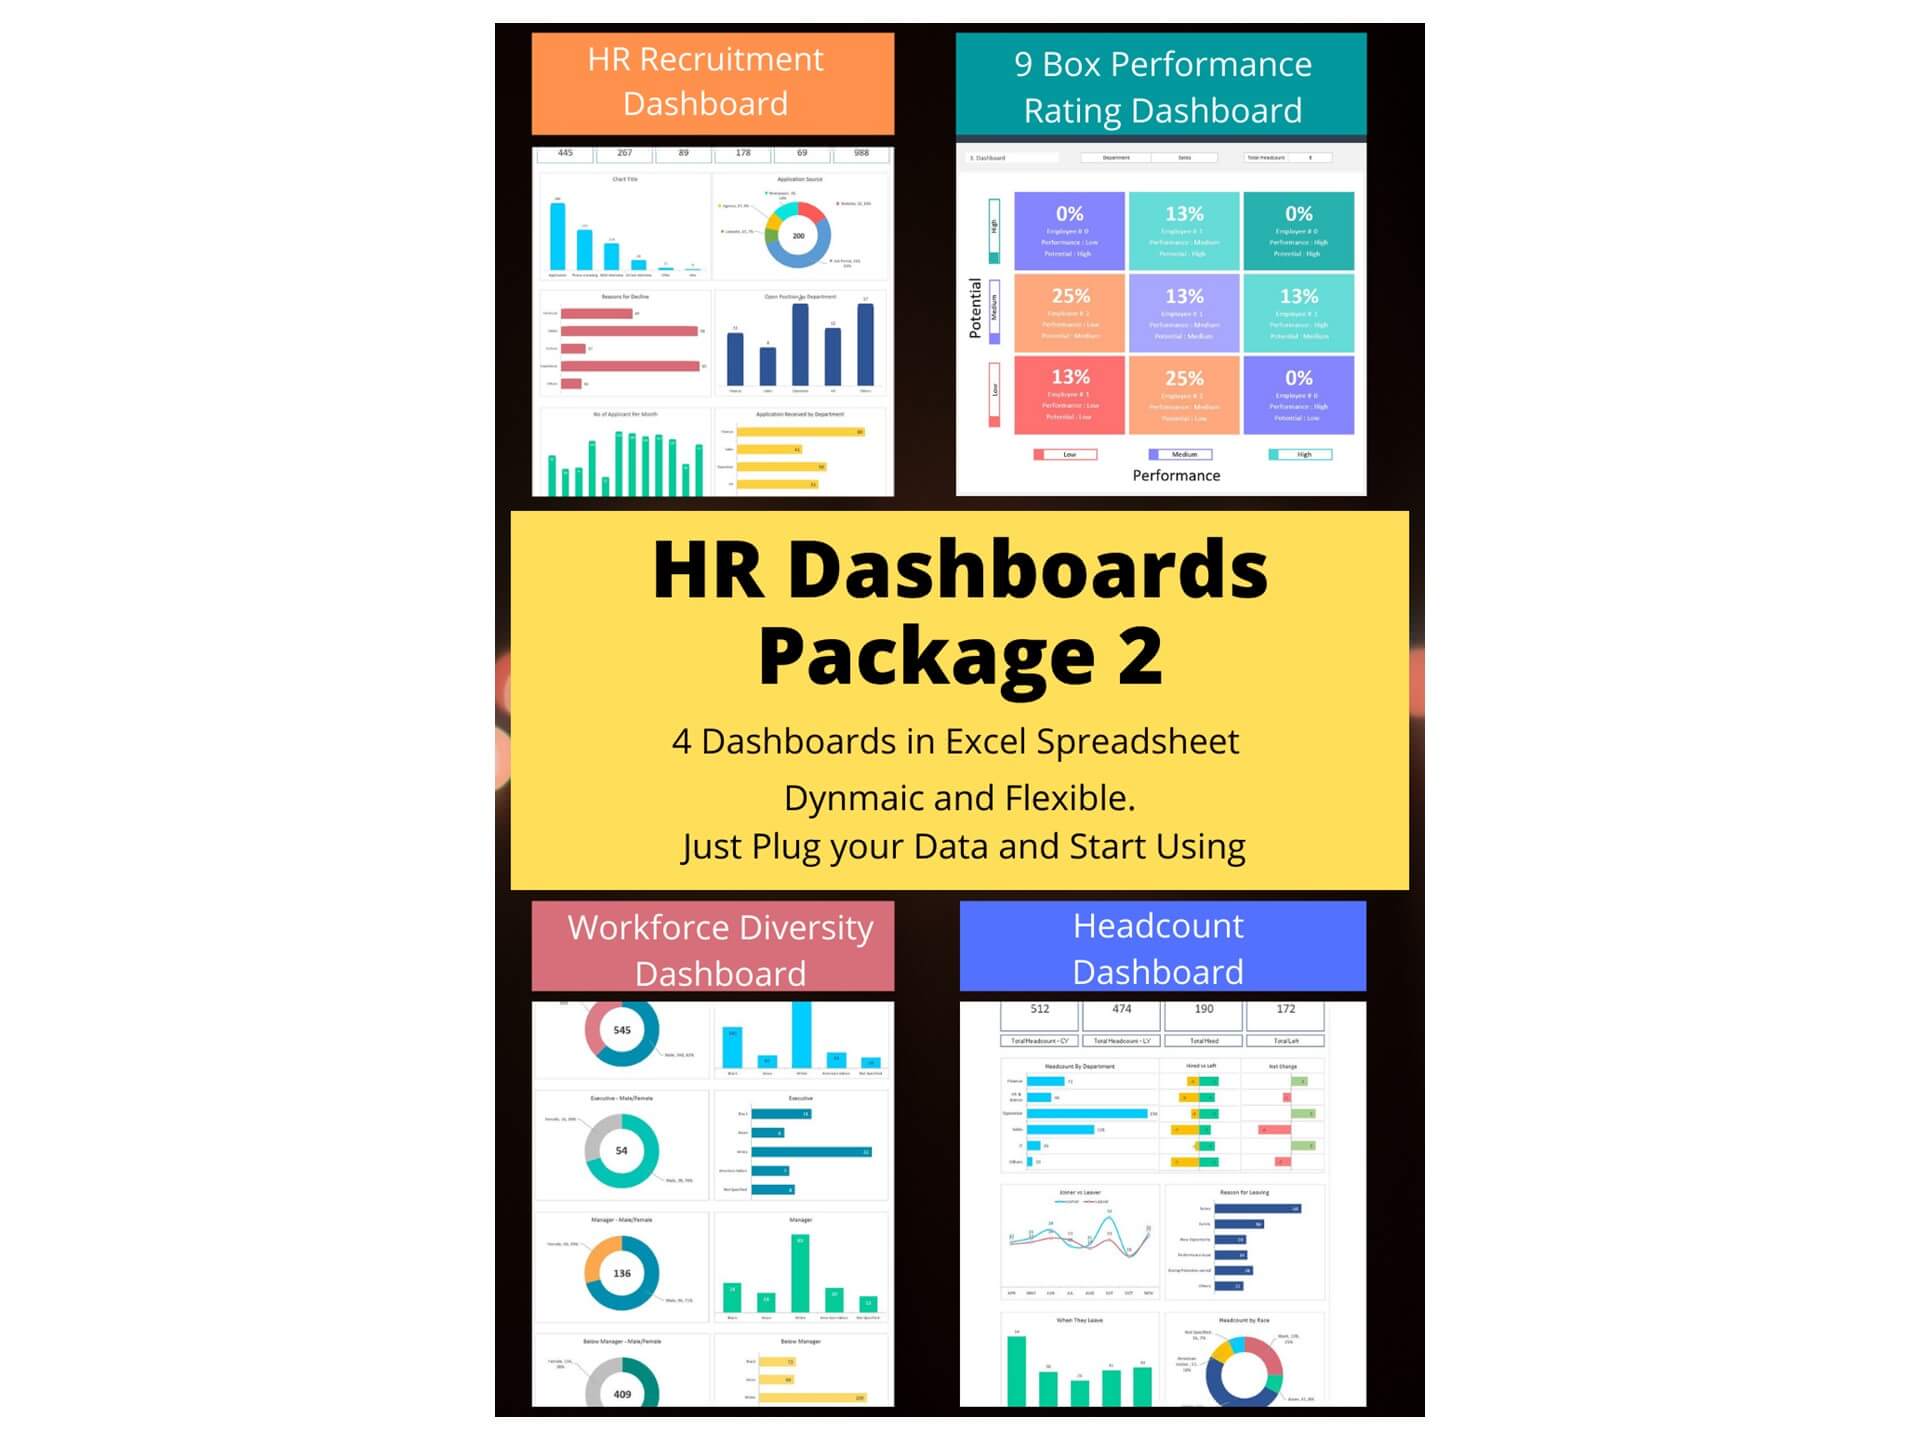
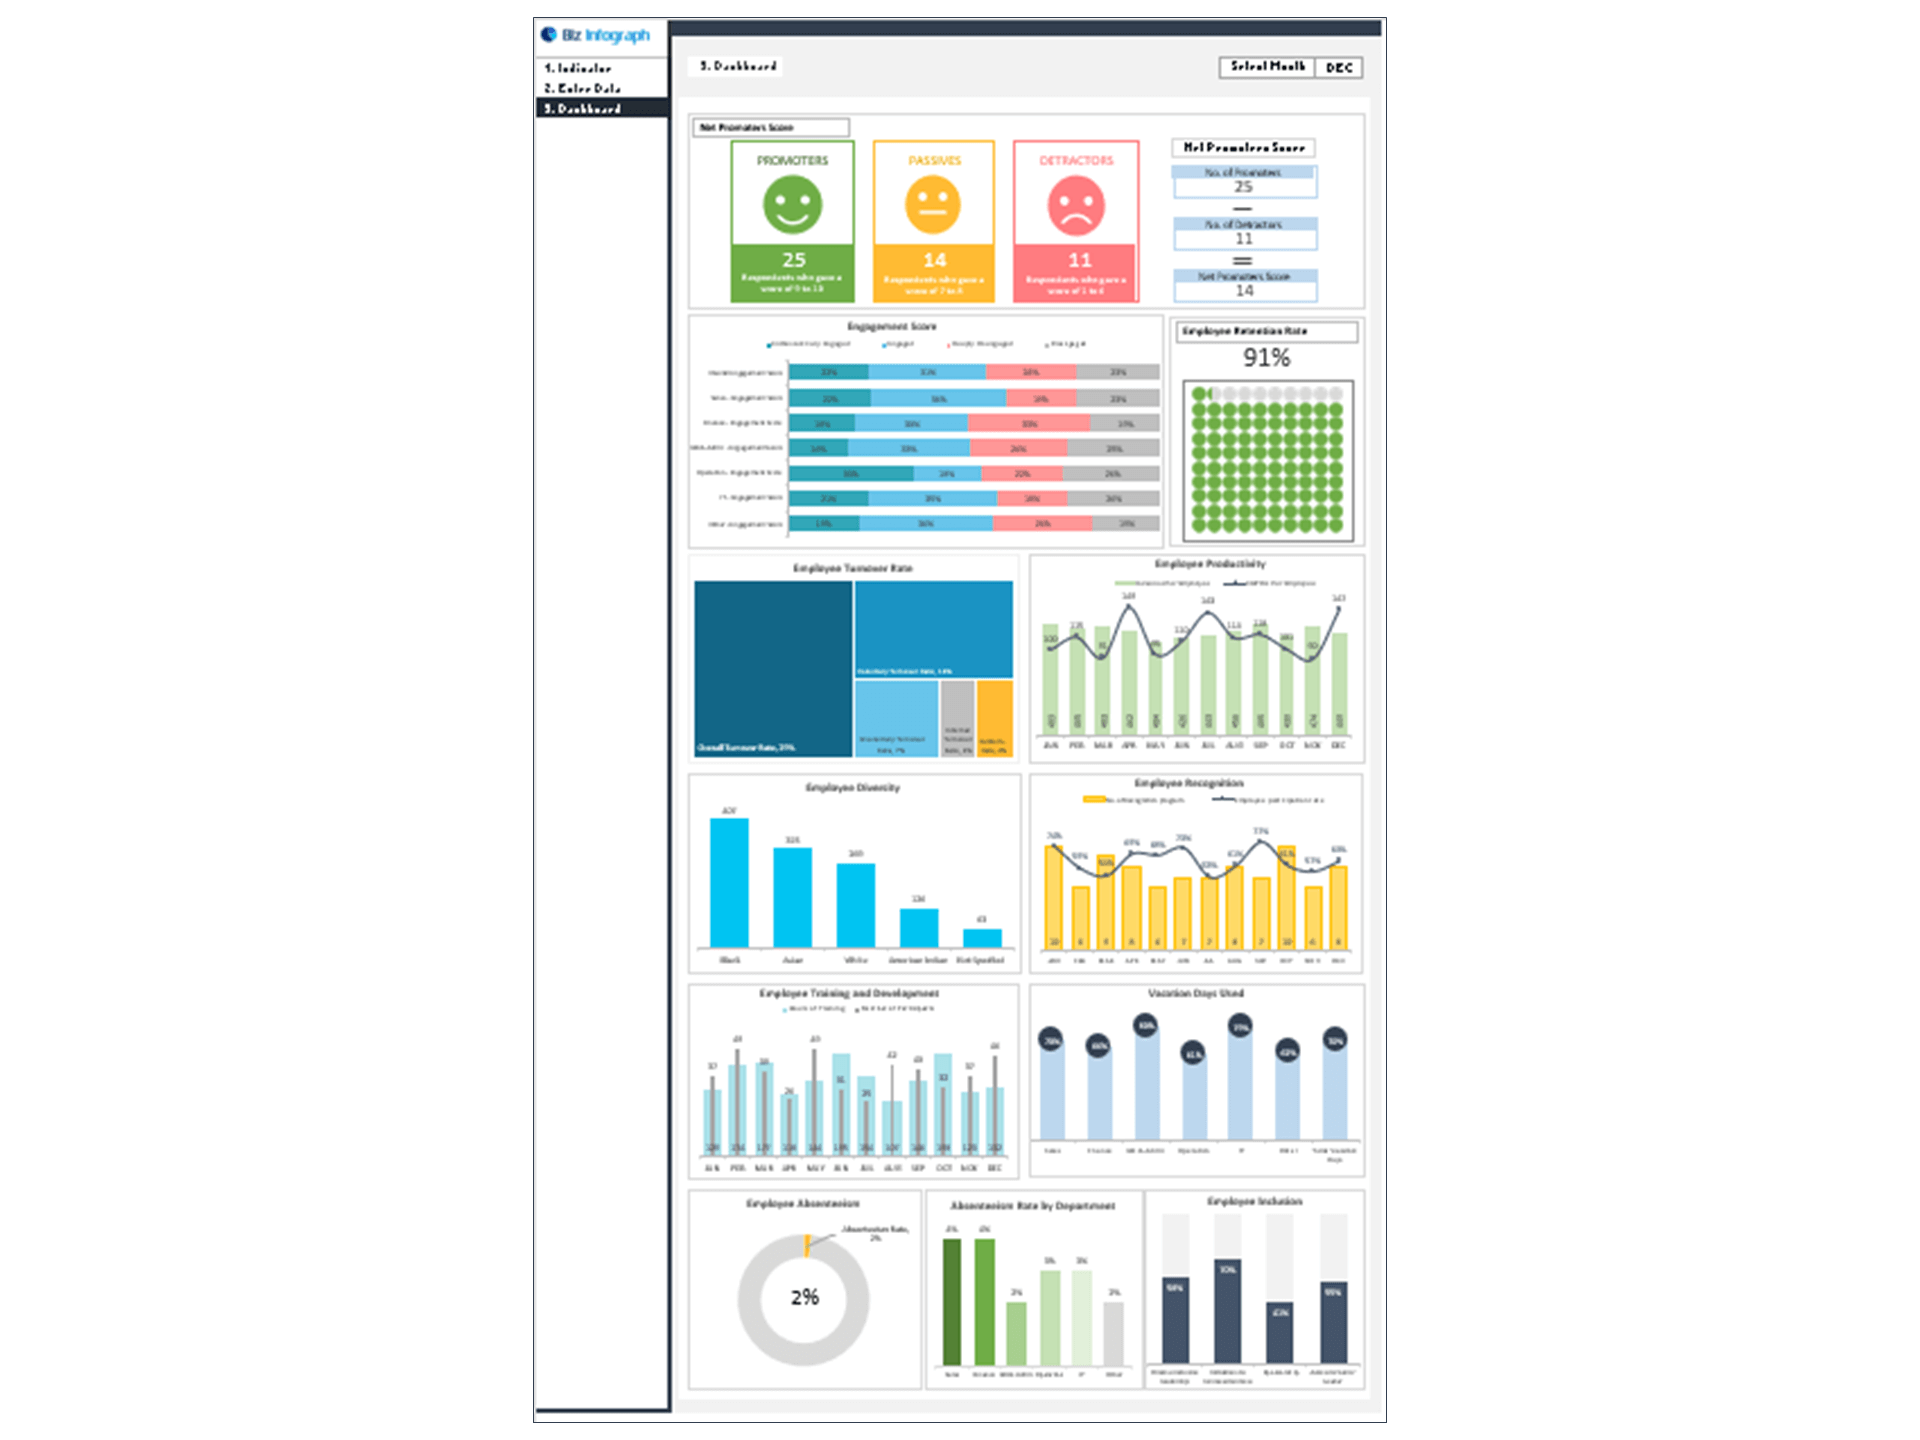
As part of an HR Dashboard Package, this template works as an effective Employee Dashboard that provides insights into workforce morale and productivity. The Dynamic Dashboard automatically updates charts and summaries as new survey data or engagement metrics are added, making reporting simple and efficient.
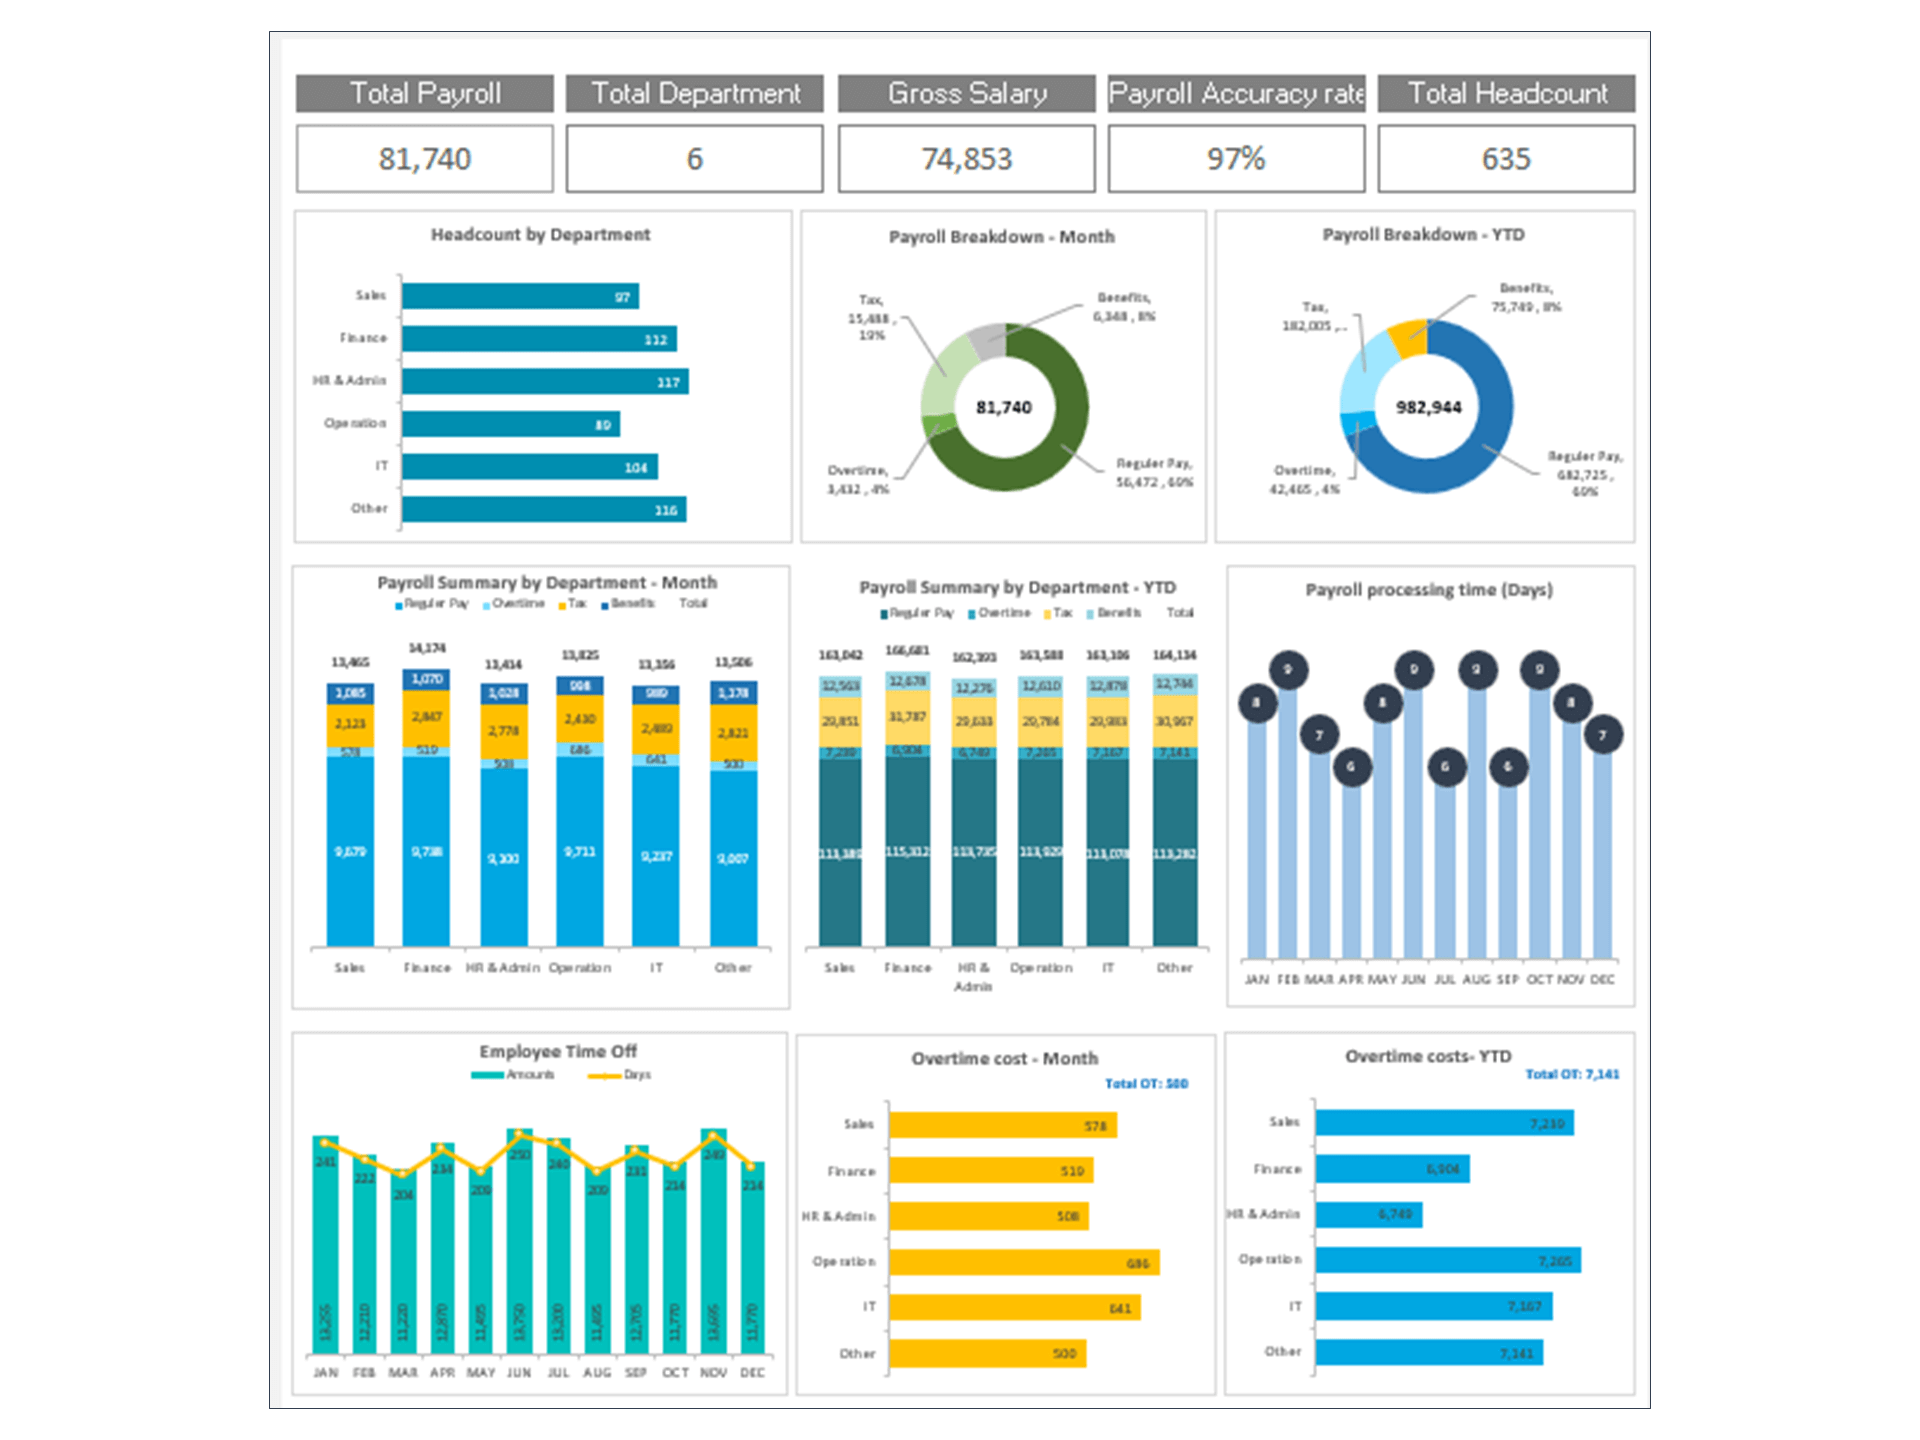
The dashboard also supports broader performance analysis by connecting engagement levels with business outcomes, functioning as both a Business Dashboard and a Financial Dashboard for workforce-related insights. It can also be adapted for Google Sheets, enabling easy collaboration and real-time updates for teams.
Crafting the Ultimate Employee Engagement Dashboard
Key Components of an Employee Engagement and Satisfaction Dashboard
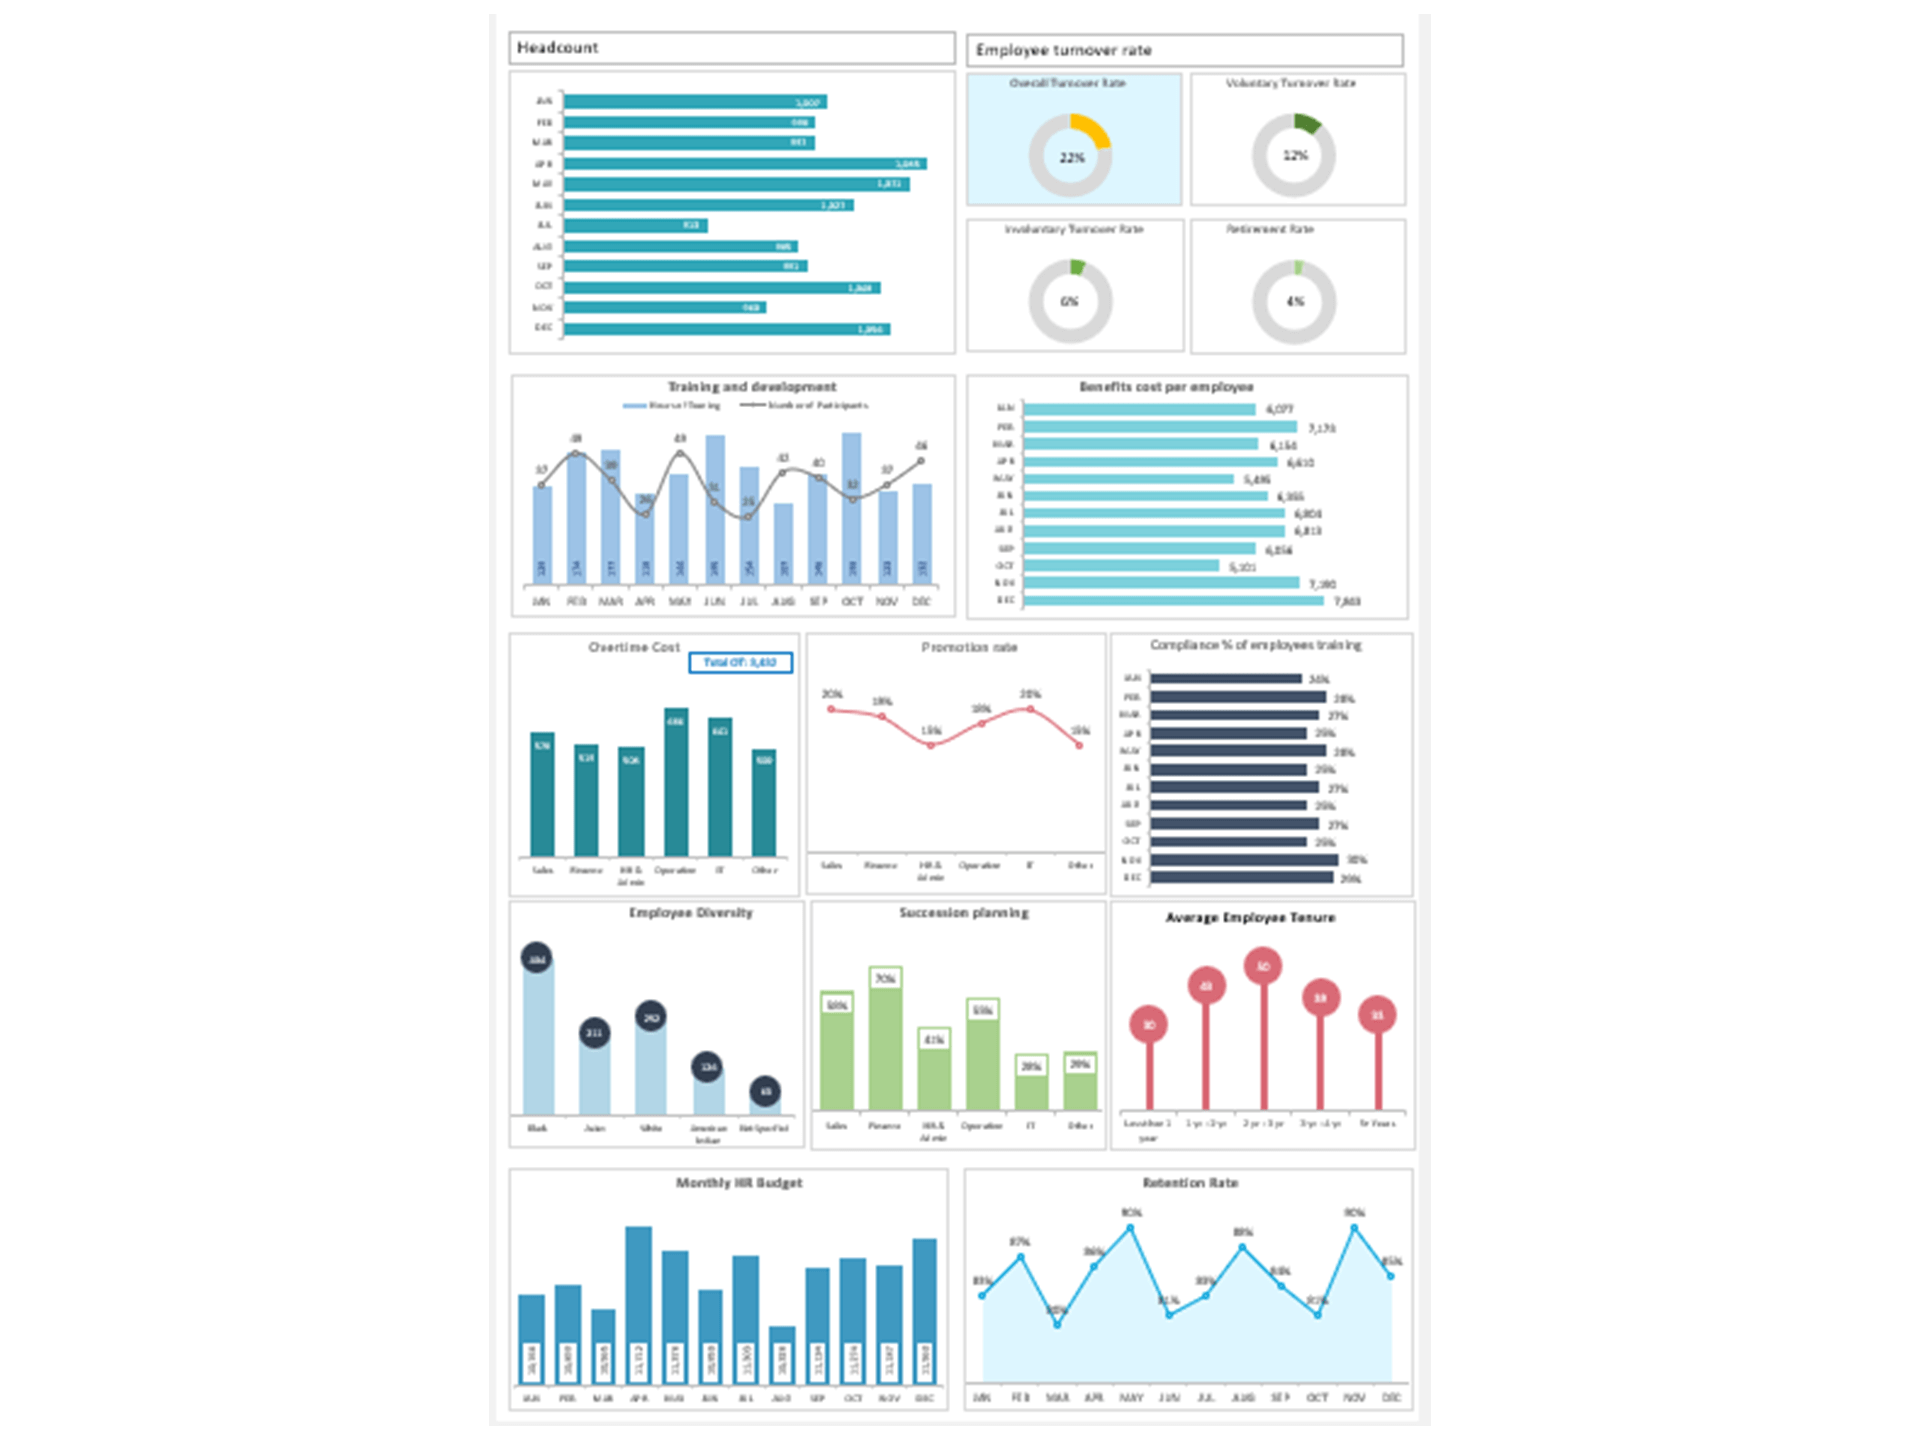
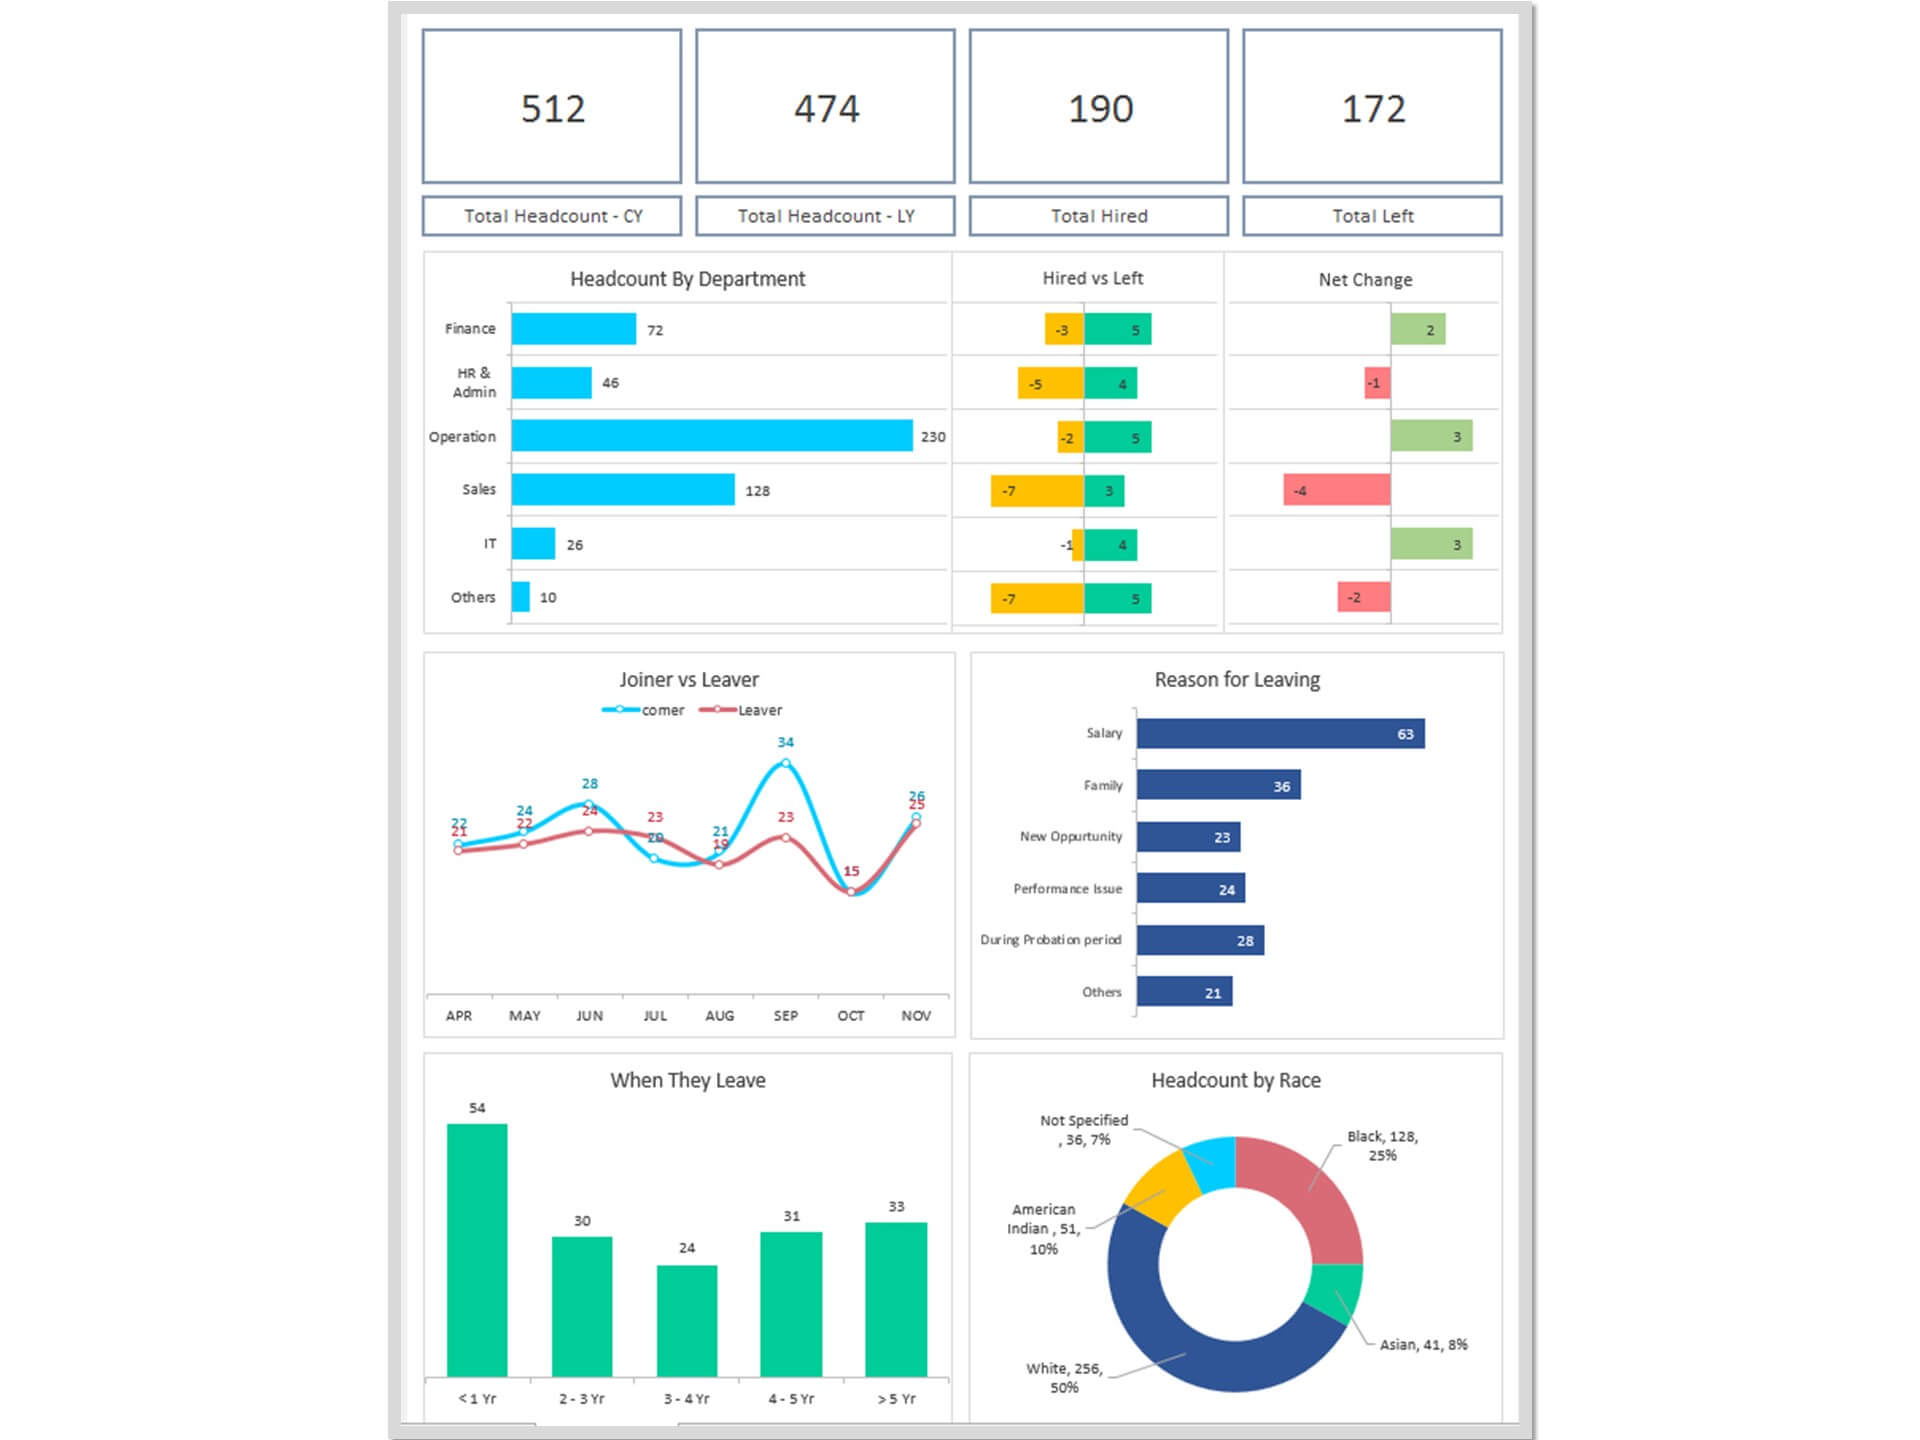
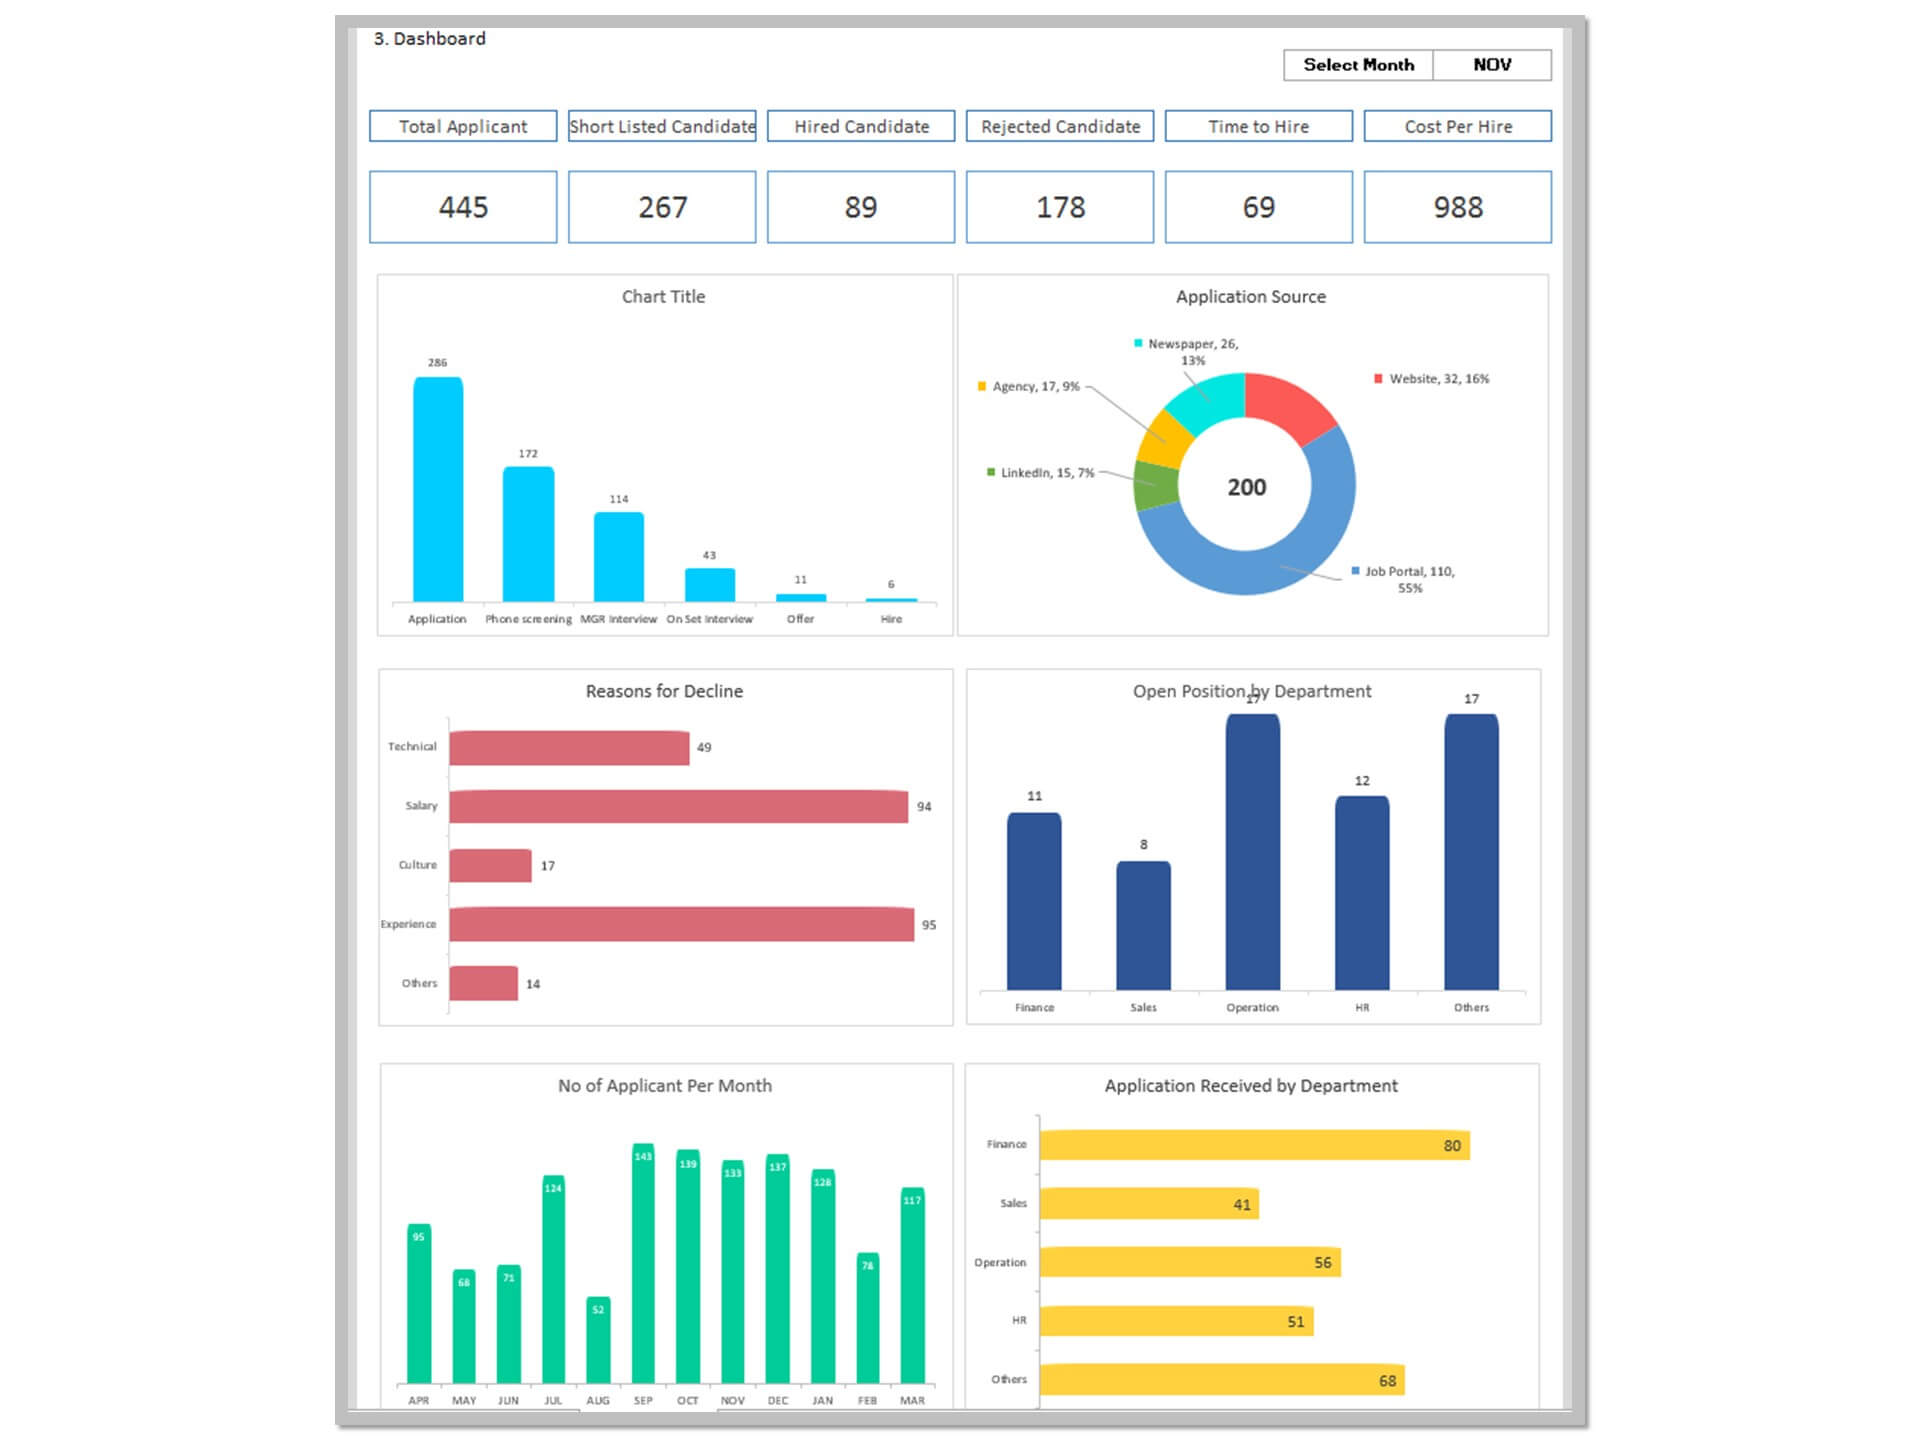
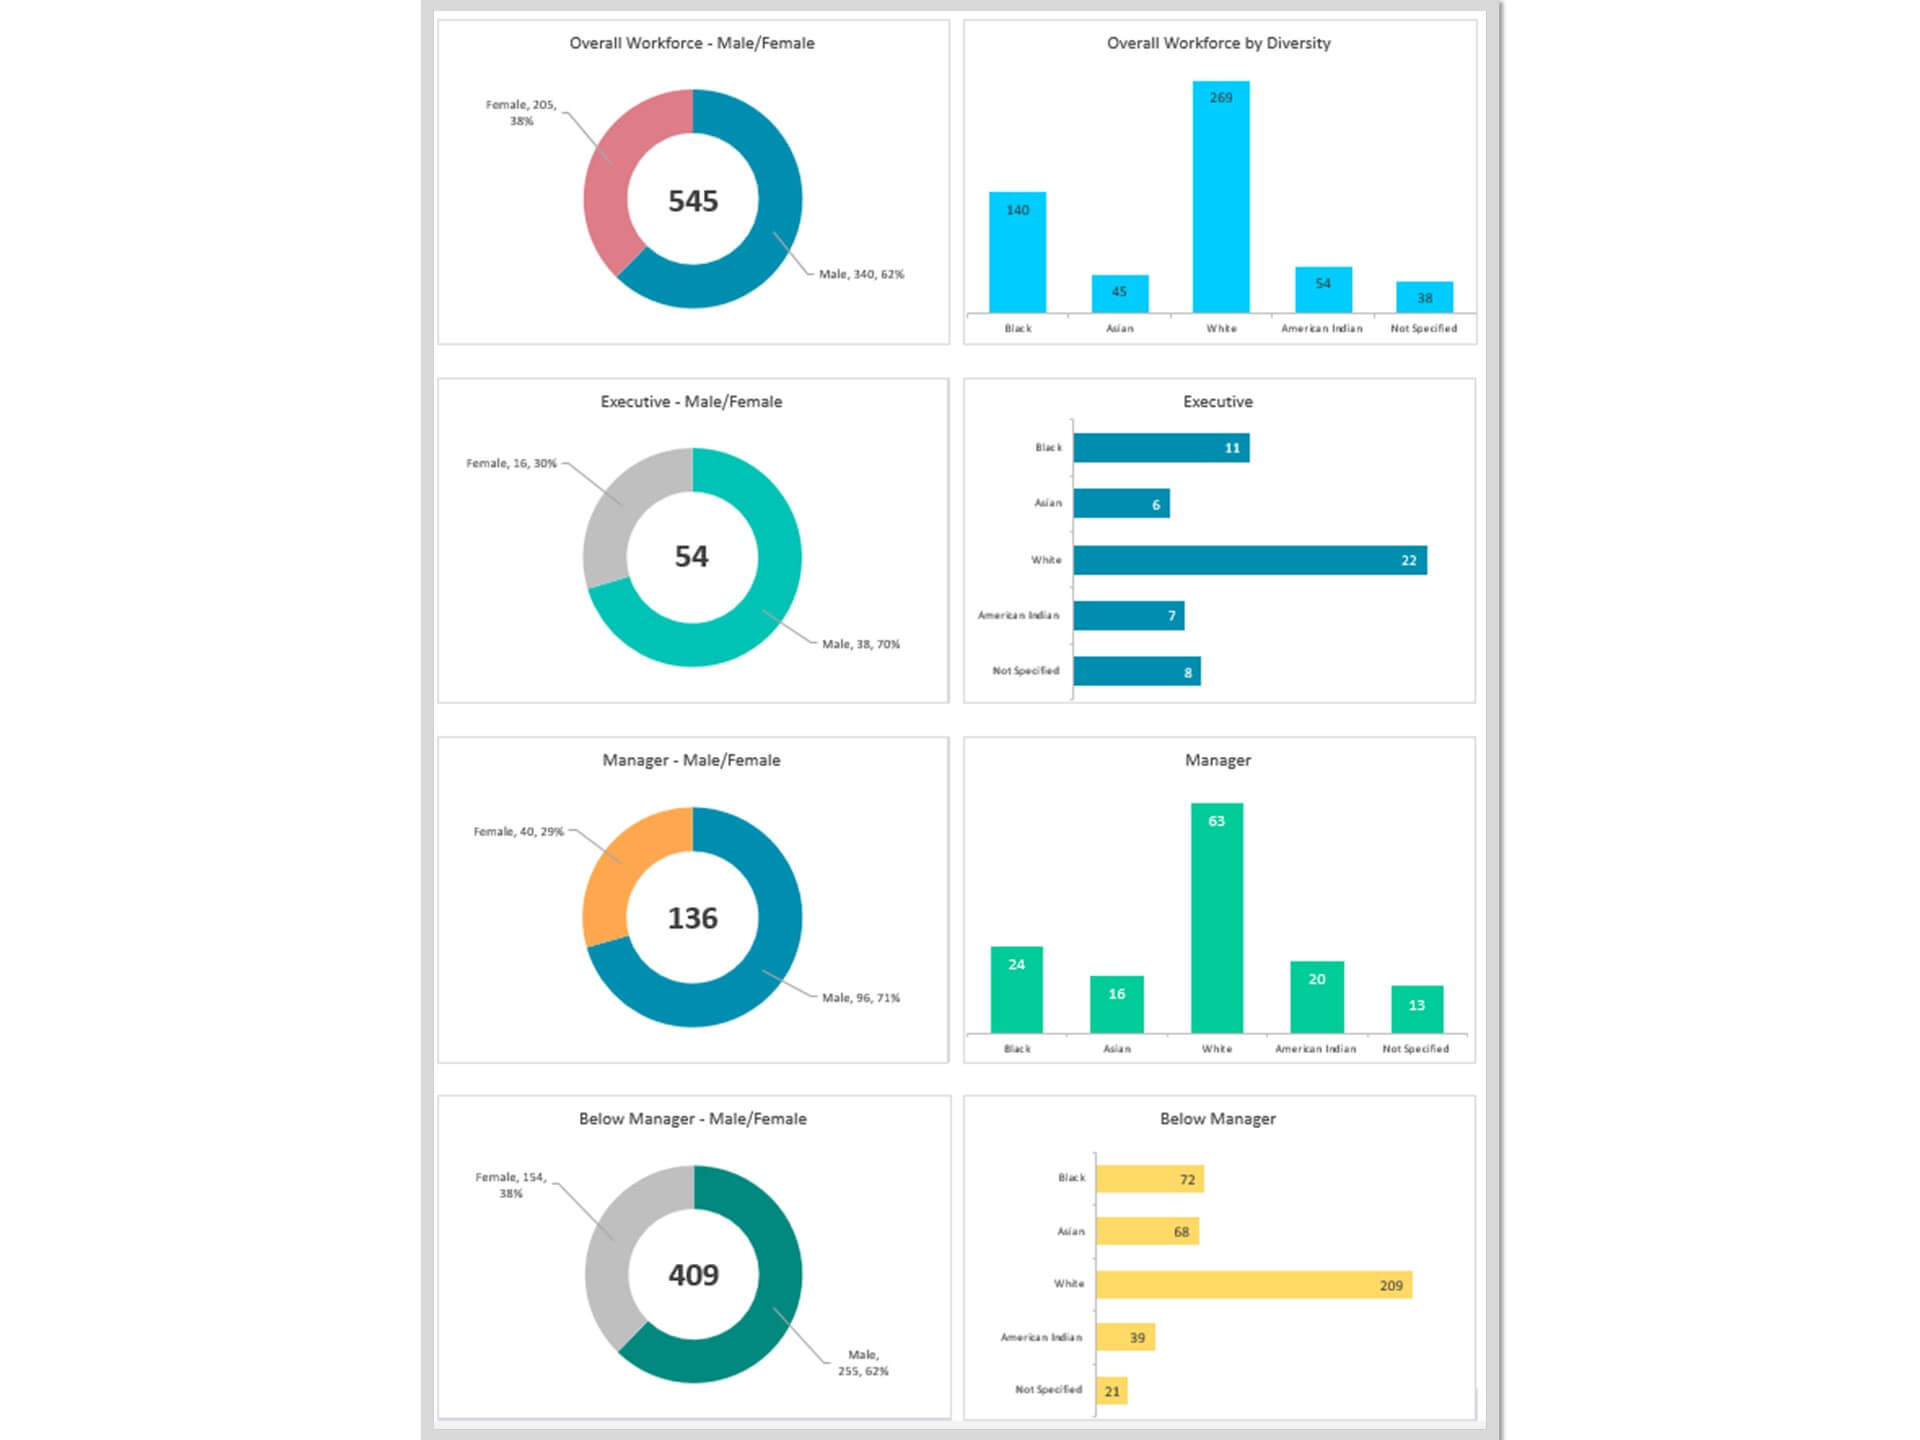
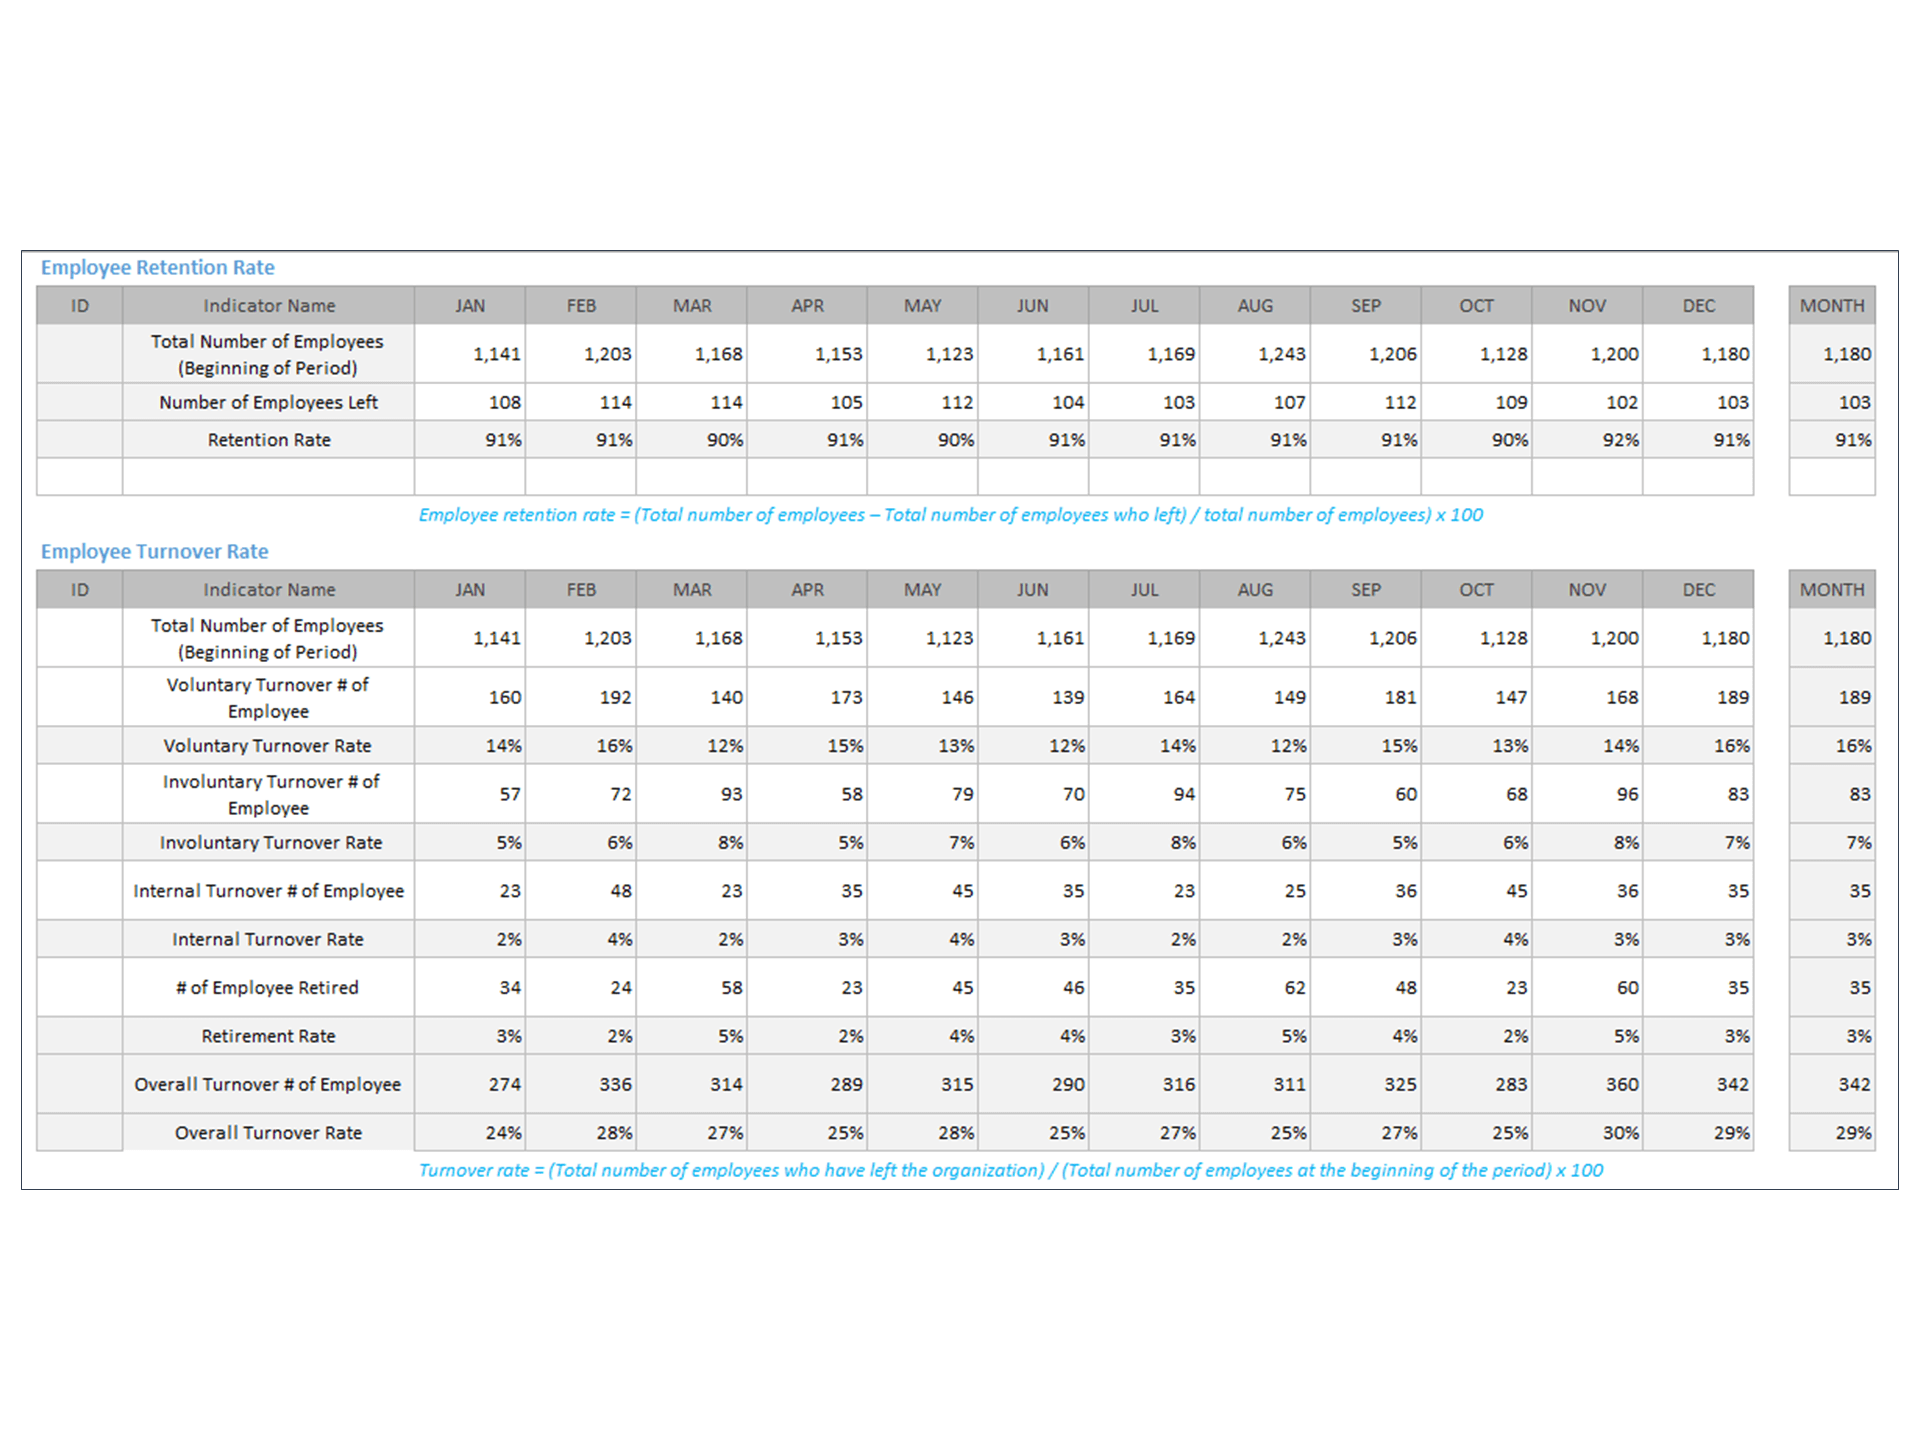
Creating an effective Employee Engagement Dashboard integrates crucial metrics and KPIs like engagement scores, employee satisfaction levels, and trend of turnover rates. These components provide a comprehensive view of employee engagement programs, employee experience, engagement trends, and satisfaction within an organization. Effective visualization of this engagement data in Excel or PowerPoint is essential for highlighting improvement areas in company culture and identifying actionable insights. Using charts, graphs, and heat maps can make complex datasets understandable and actionable, guiding strategic decisions to improve employee engagement.
Selecting the Right Template for Your Dashboard
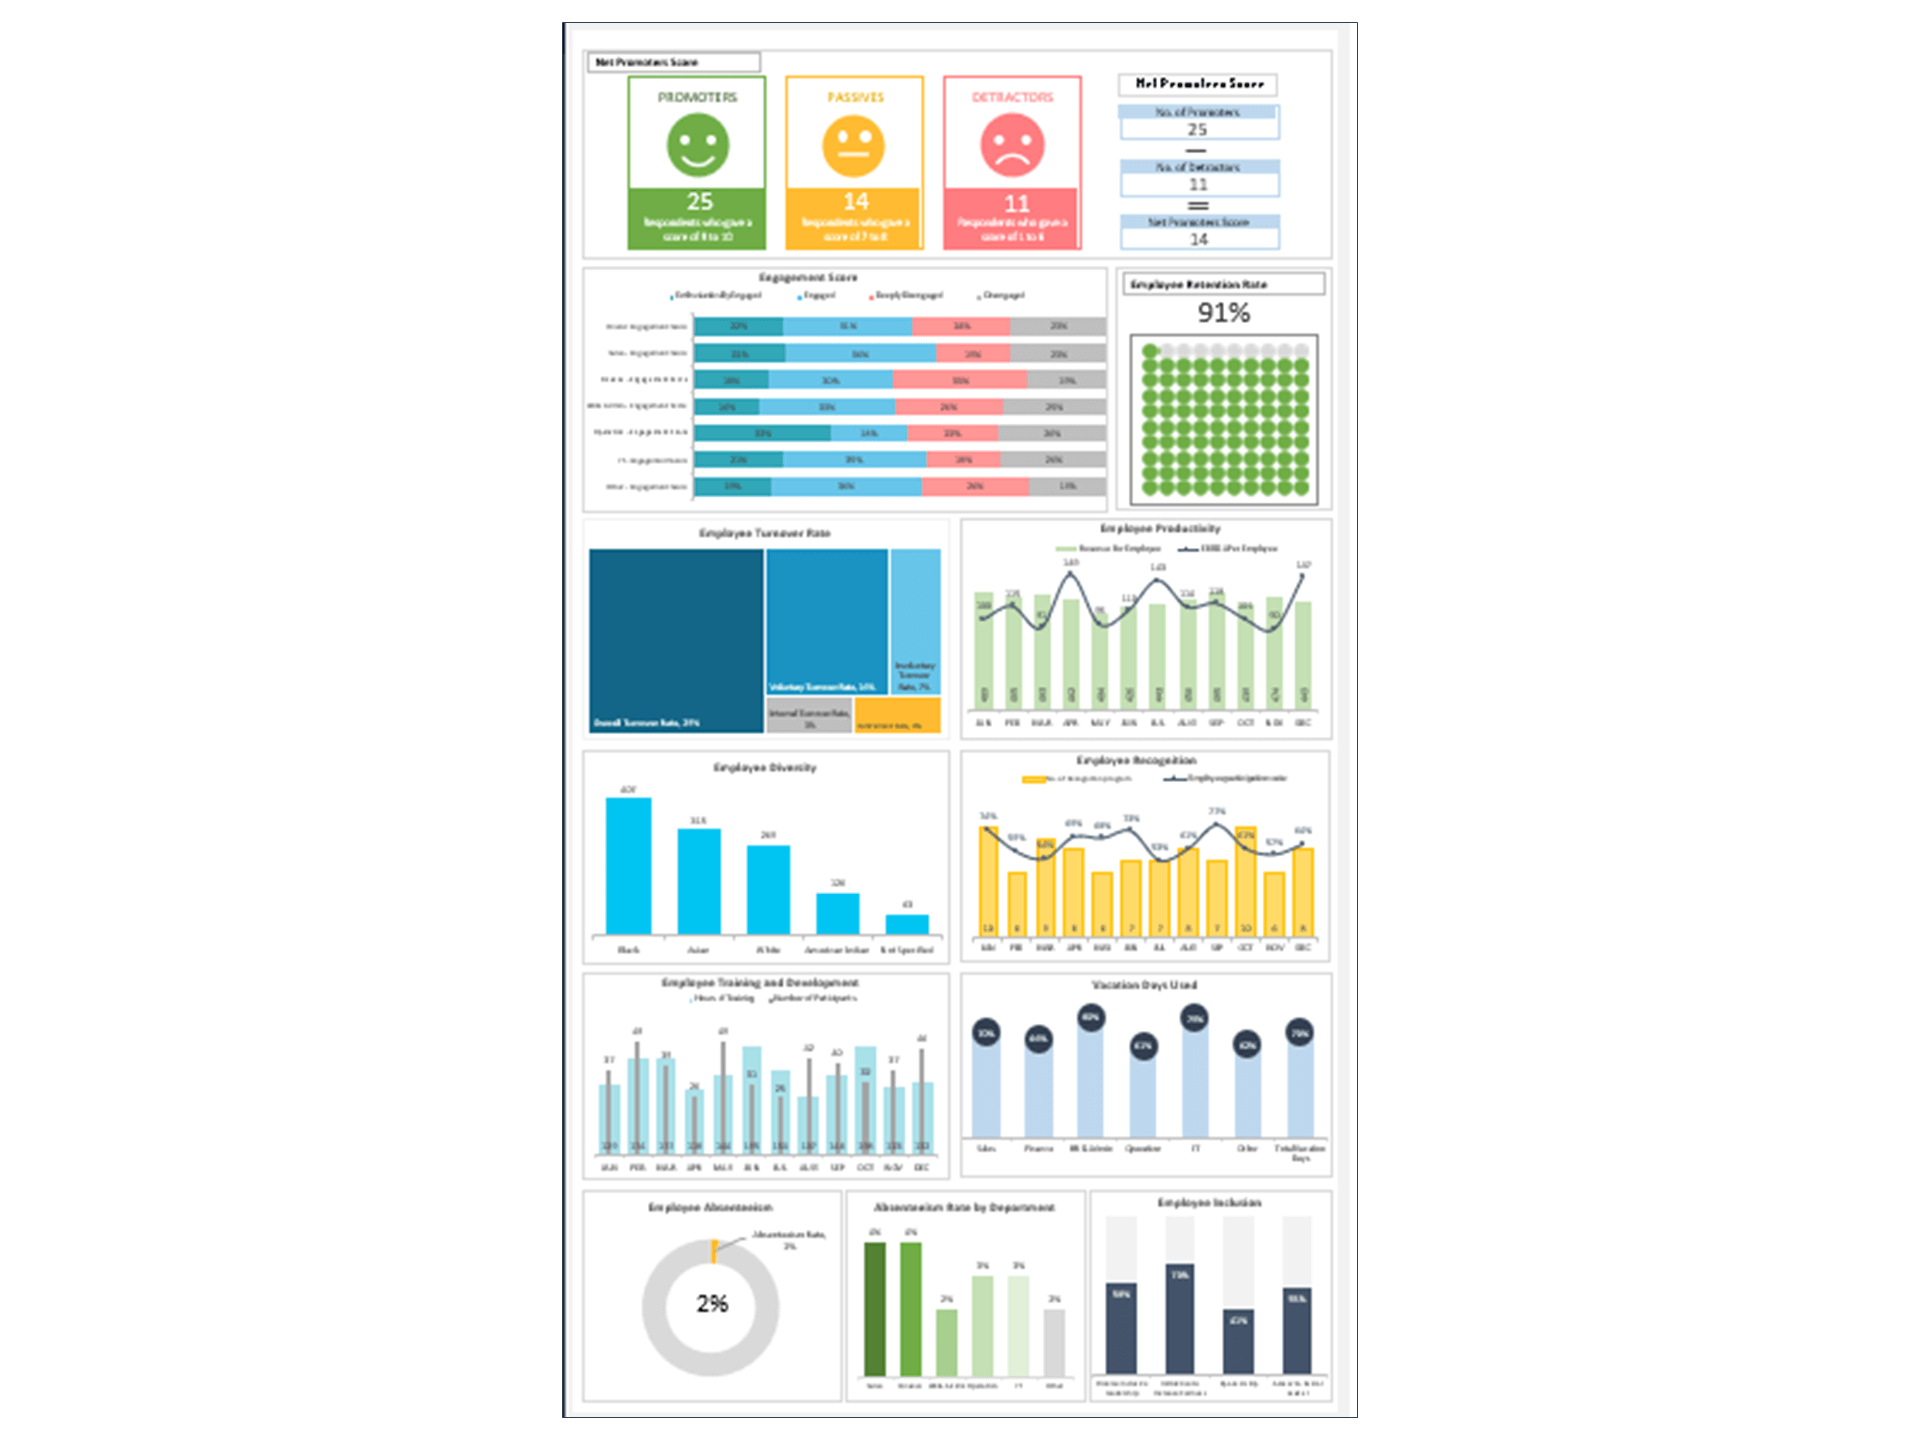
Selecting the right Excel or PowerPoint template is crucial when building your Employee Engagement Dashboard. Choose a template that aligns with your HR analytics needs, ensuring format compatibility for seamless presentations. Customize this template to reflect your engagement and satisfaction metrics, incorporating survey results, retention rates, and Net Promoter scores (NPS). This customization ensures your dashboard accurately represents and tracks your organization's unique employee engagement landscape and indicators.
Leveraging Data for Actionable Insights
Analyzing Employee Engagement and Satisfaction Survey Results
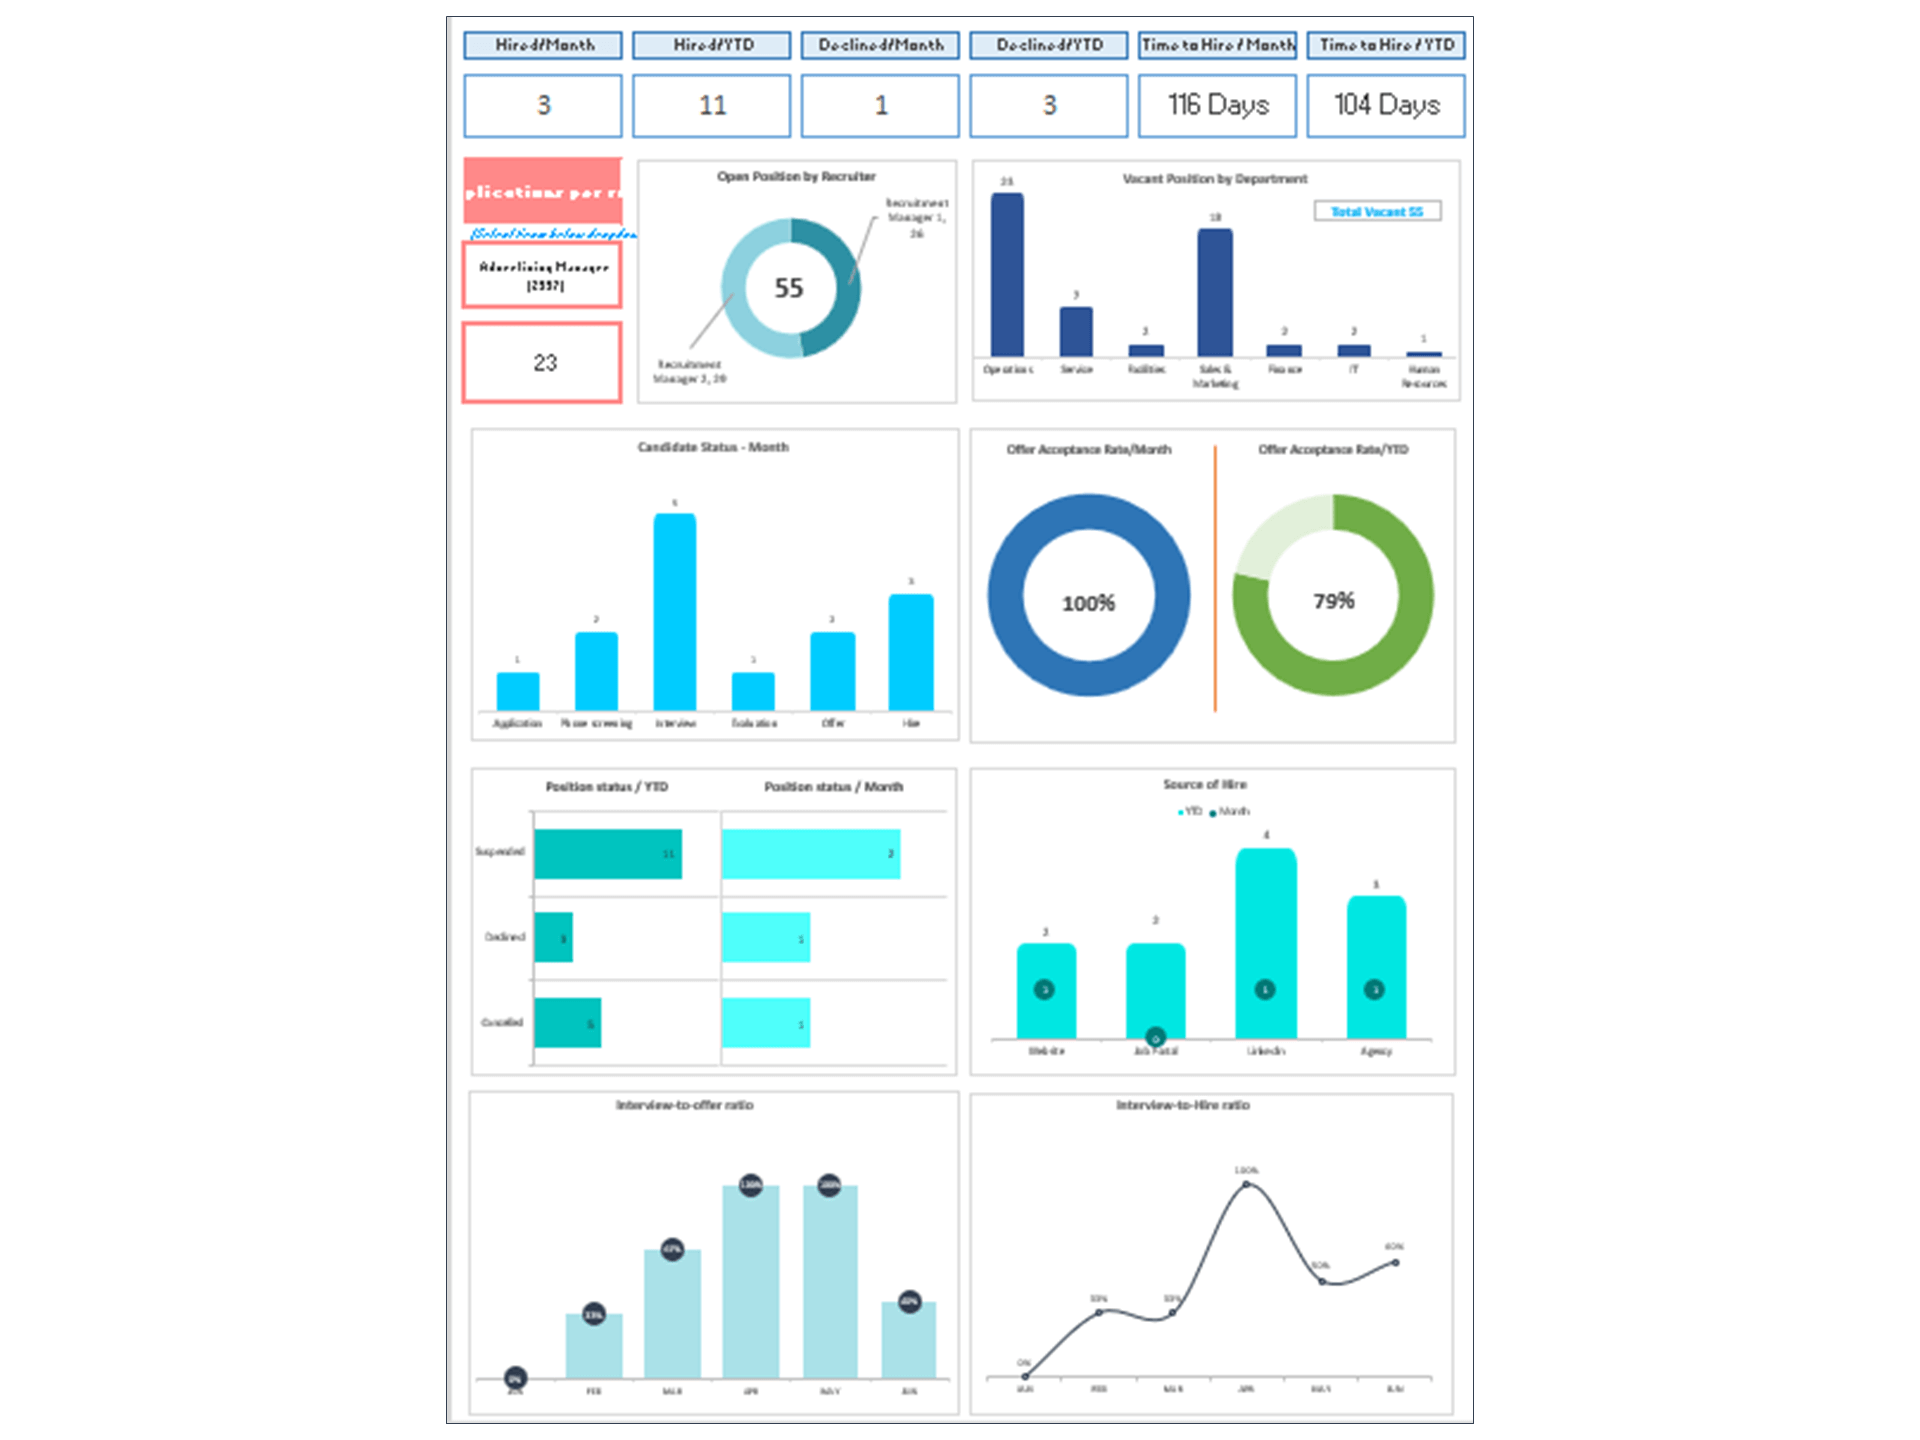
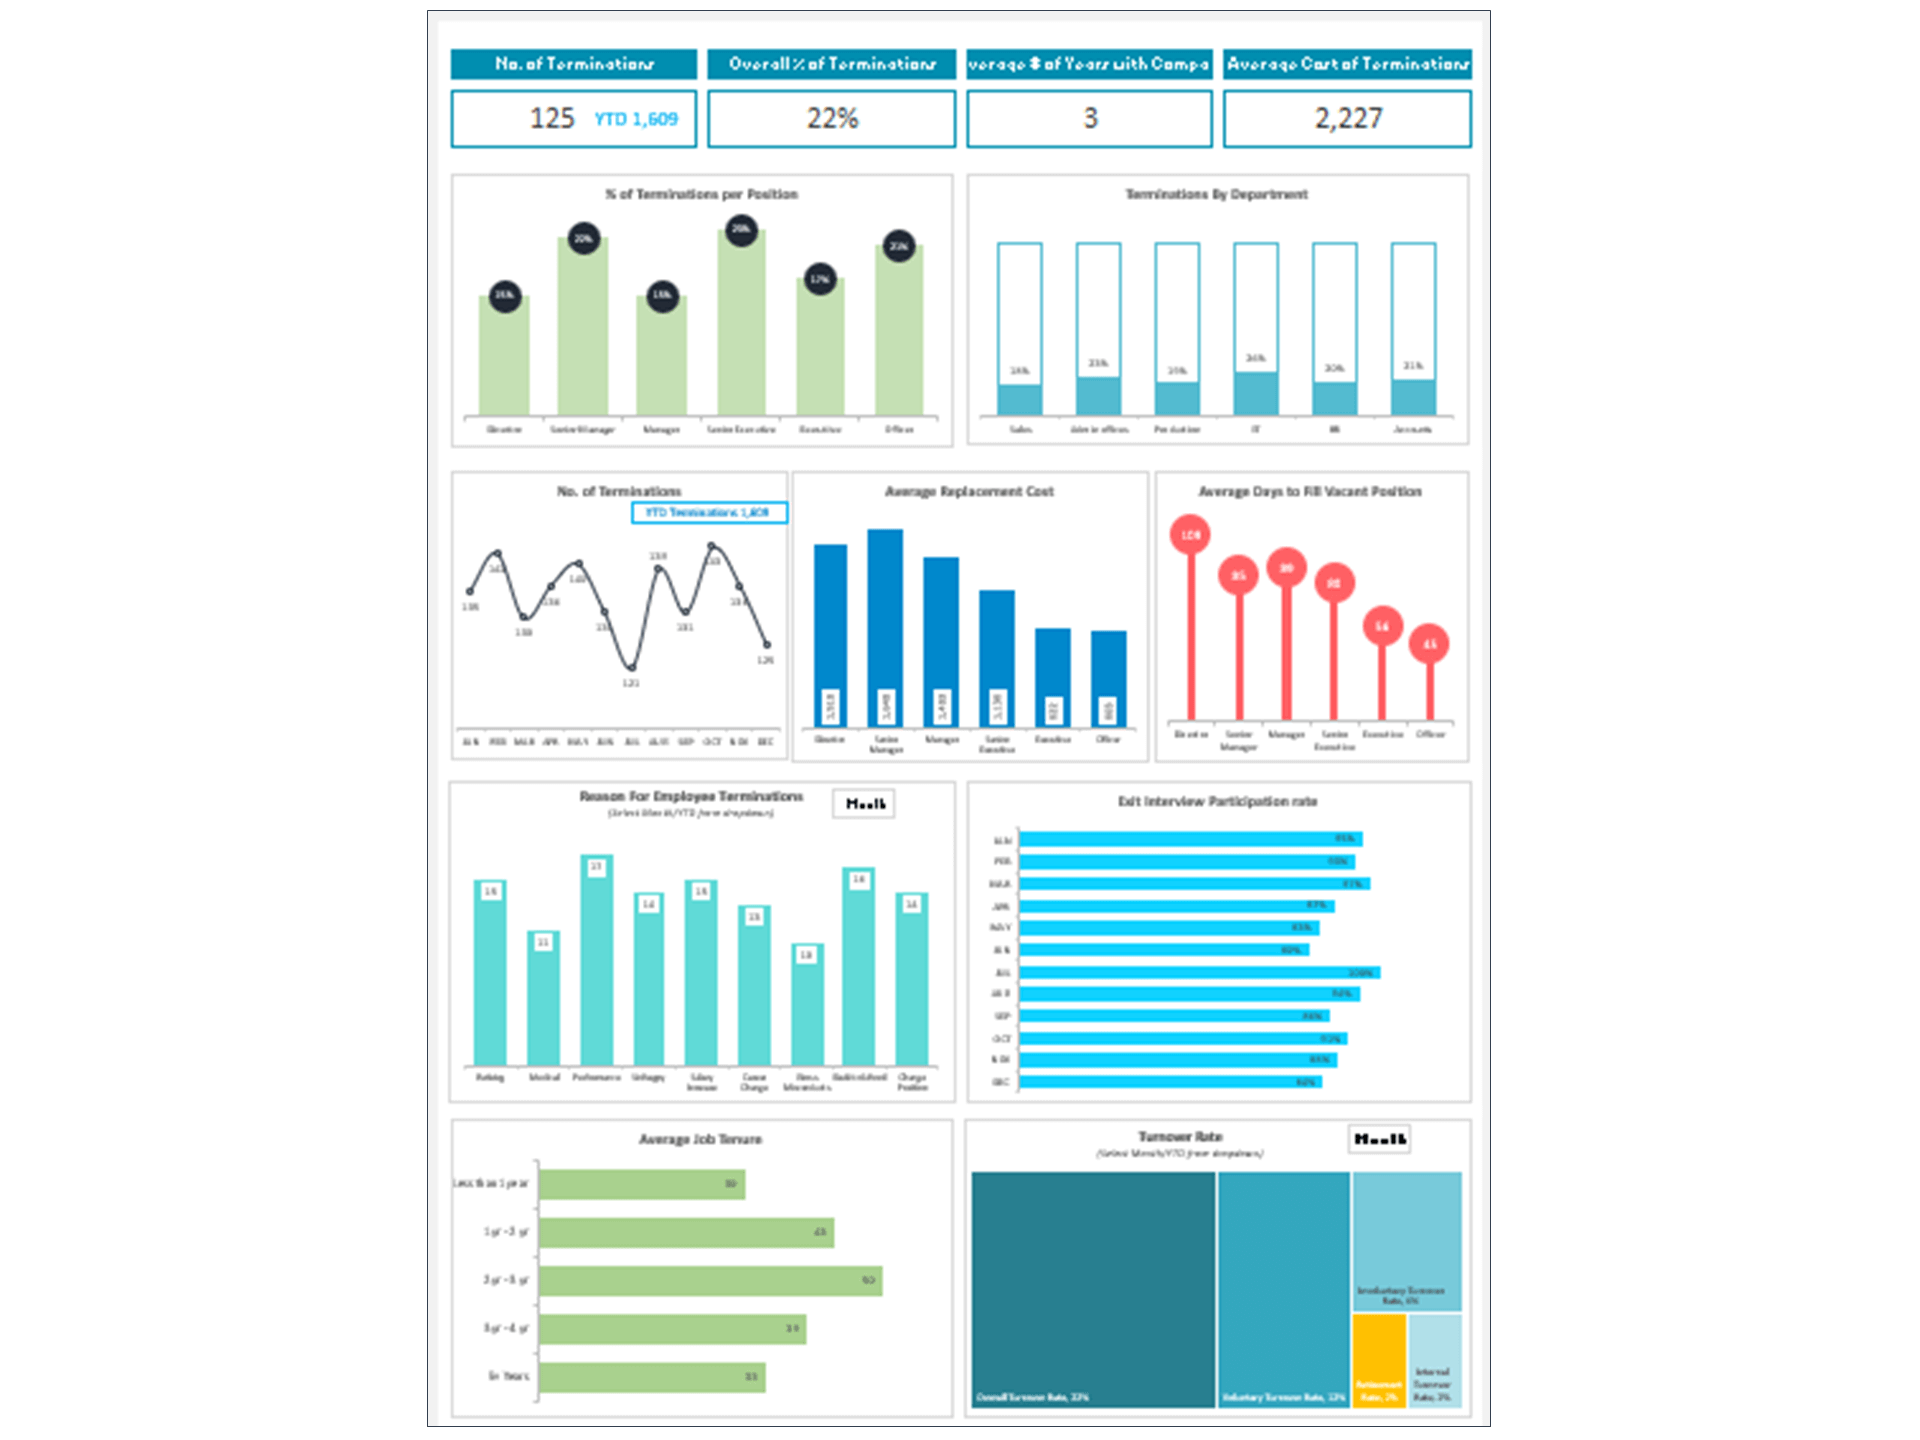
To drive workforce engagement and satisfaction improvements, dissect employee engagement survey data using Excel's analytics tools and BI software. This approach helps uncover deep insights and patterns within the data, enabling HR professionals to formulate targeted strategies for enhancing employee engagement key performance indicators. Employ visual aids and pivot tables to break down complex data sets, making it easier for stakeholders to grasp and act upon these insights.
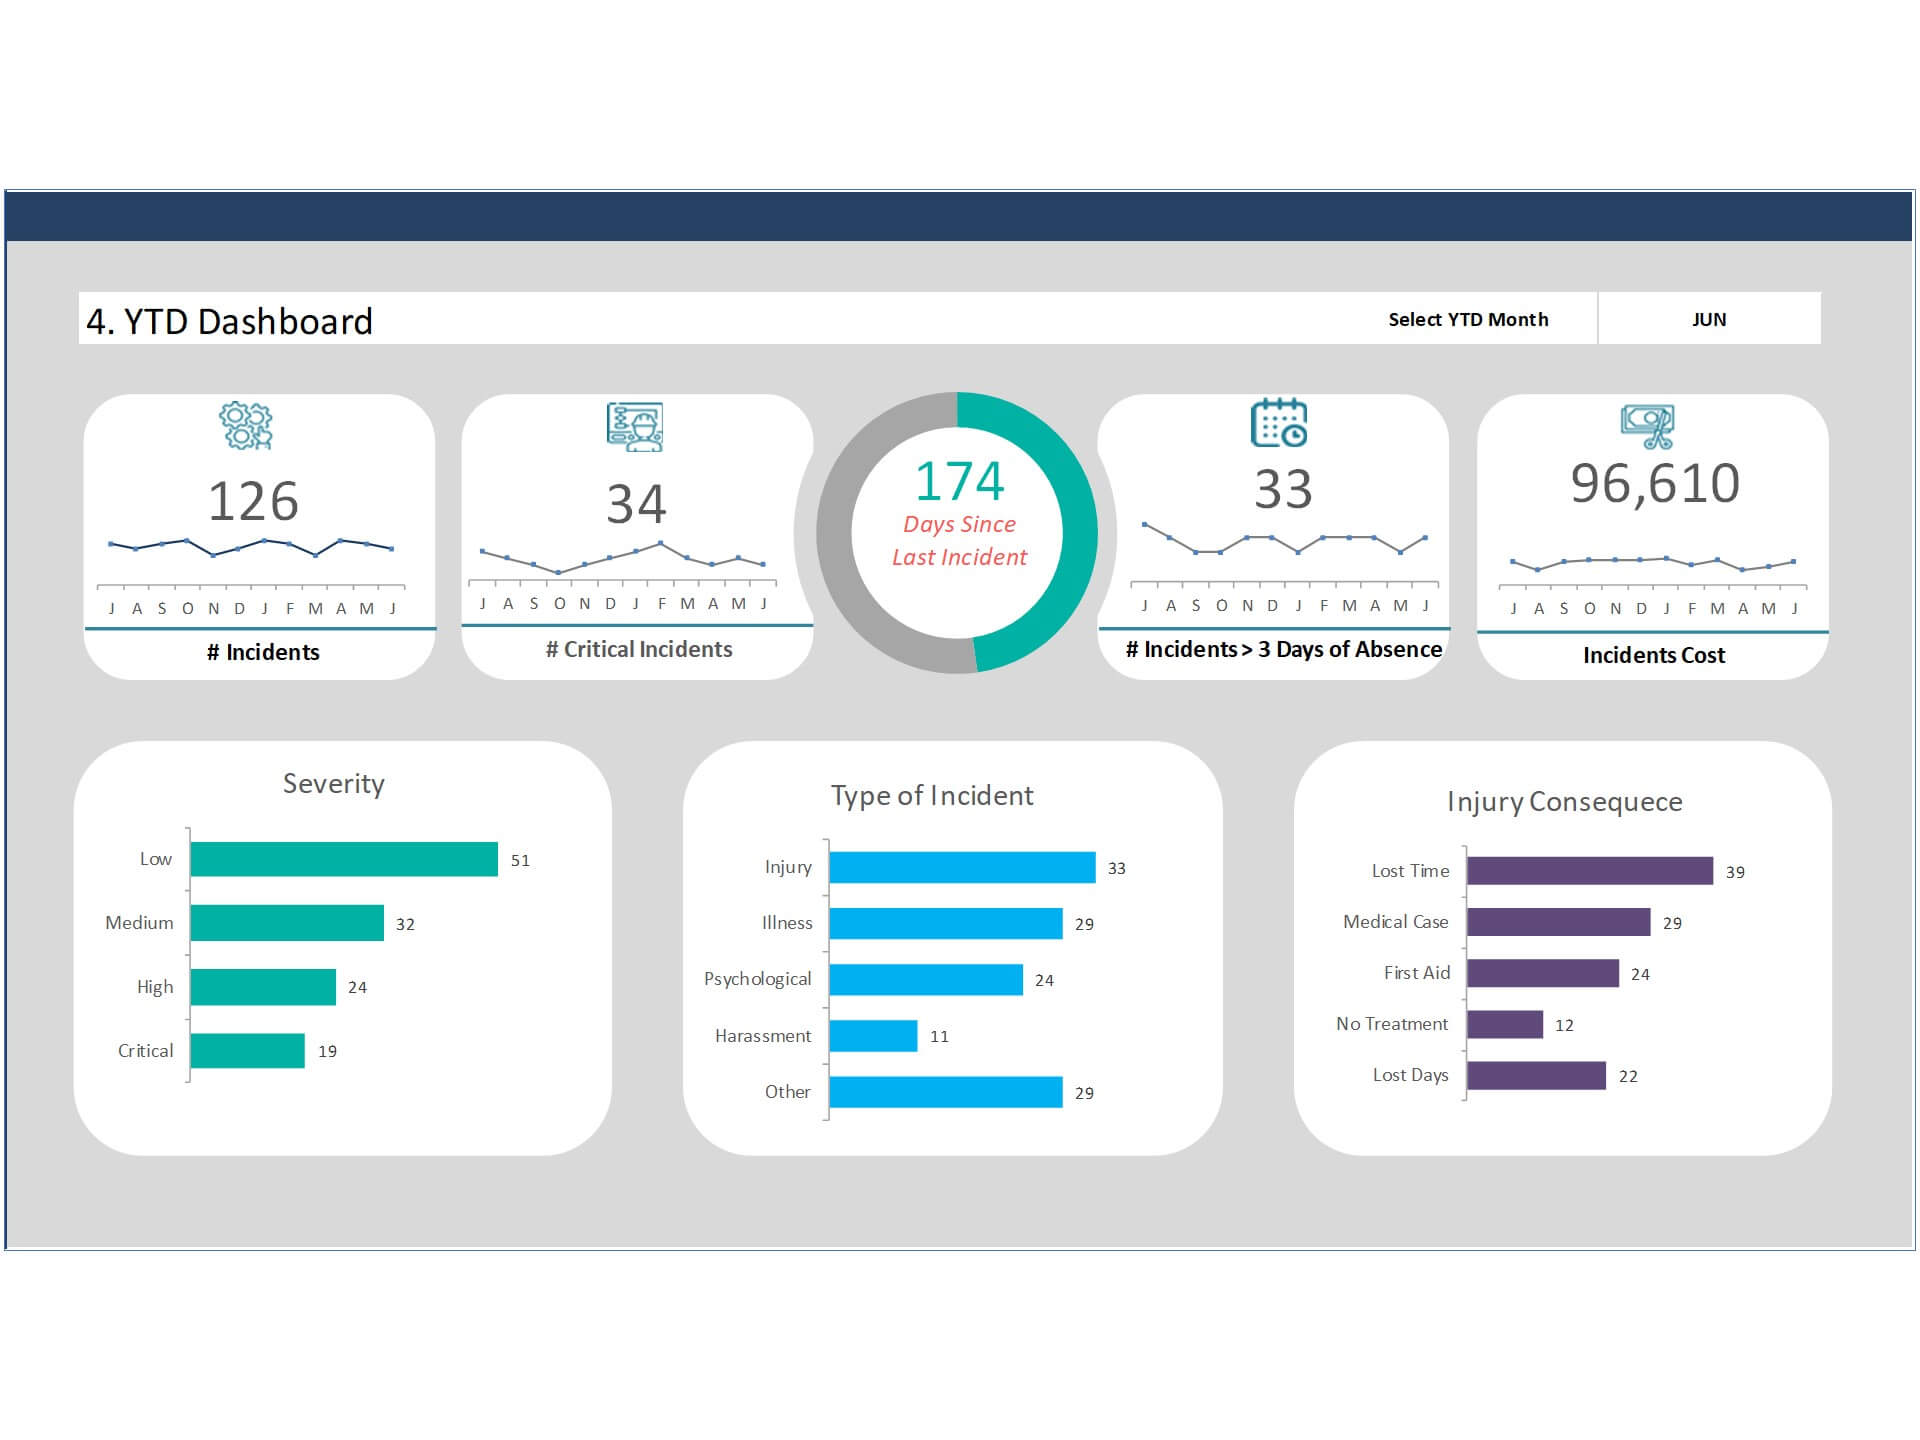
Tracking and Measuring Employee Engagement Data in Real-Time
Implement real-time tracking of engagement metrics dashboard using Excel's dynamic formulas and functions. This allows for ongoing monitoring of HR initiatives' impact on internal employee engagement levels. Utilize software and platforms that offer continuous measurement and provide an agile response mechanism to adapt quickly to changing engagement levels, ensuring strategies remain relevant and effective.
Enhancing Presentations with Engaging Visuals
Designing Impactful PowerPoint Presentations
Convert your Excel data into impactful PowerPoint presentations that communicate the current state of employee engagement within the company. Employ engaging visuals like icons, graphs, and charts to illustrate key points and make the data accessible. This approach helps managers and stakeholders quickly understand engagement levels and supports the decision-making process.
Editing and Customizing Your Engagement Dashboard Format
Maintain the effectiveness of your Employee Engagement Dashboard by regularly updating and customizing it in Excel. Provide step-by-step instructions for HR professionals to update the dashboard with new data and insights, ensuring it remains relevant for each presentation. Emphasize the importance of flexibility and adaptability in your dashboard to accommodate evolving HR analytics needs.
From Metrics to Strategy: Driving Organizational Change
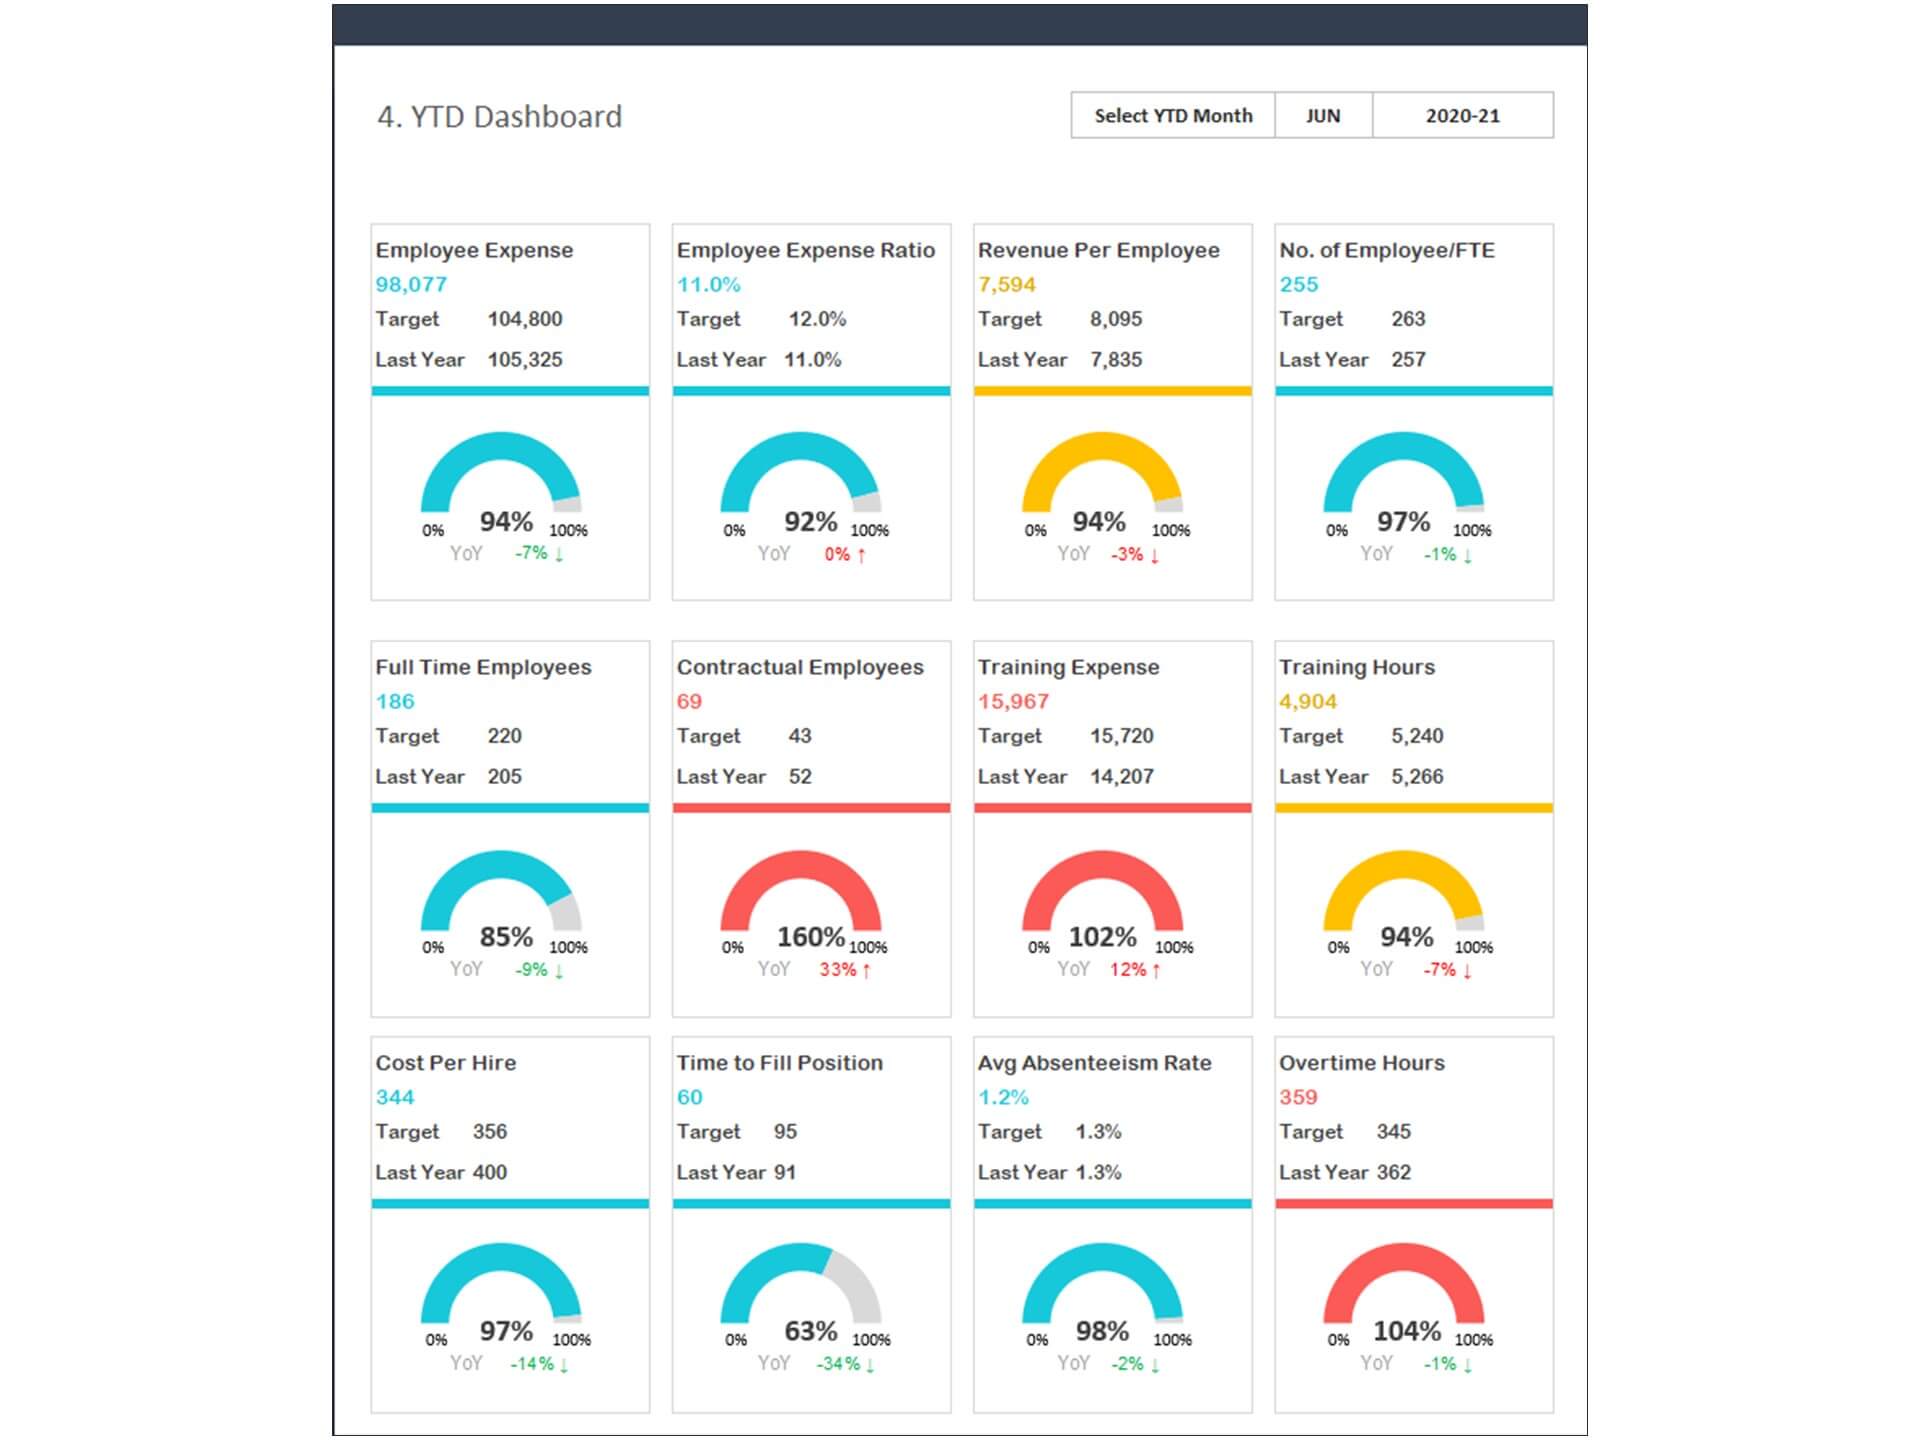
Setting KPI Dashboard and Performance Metrics for Employee Engagement
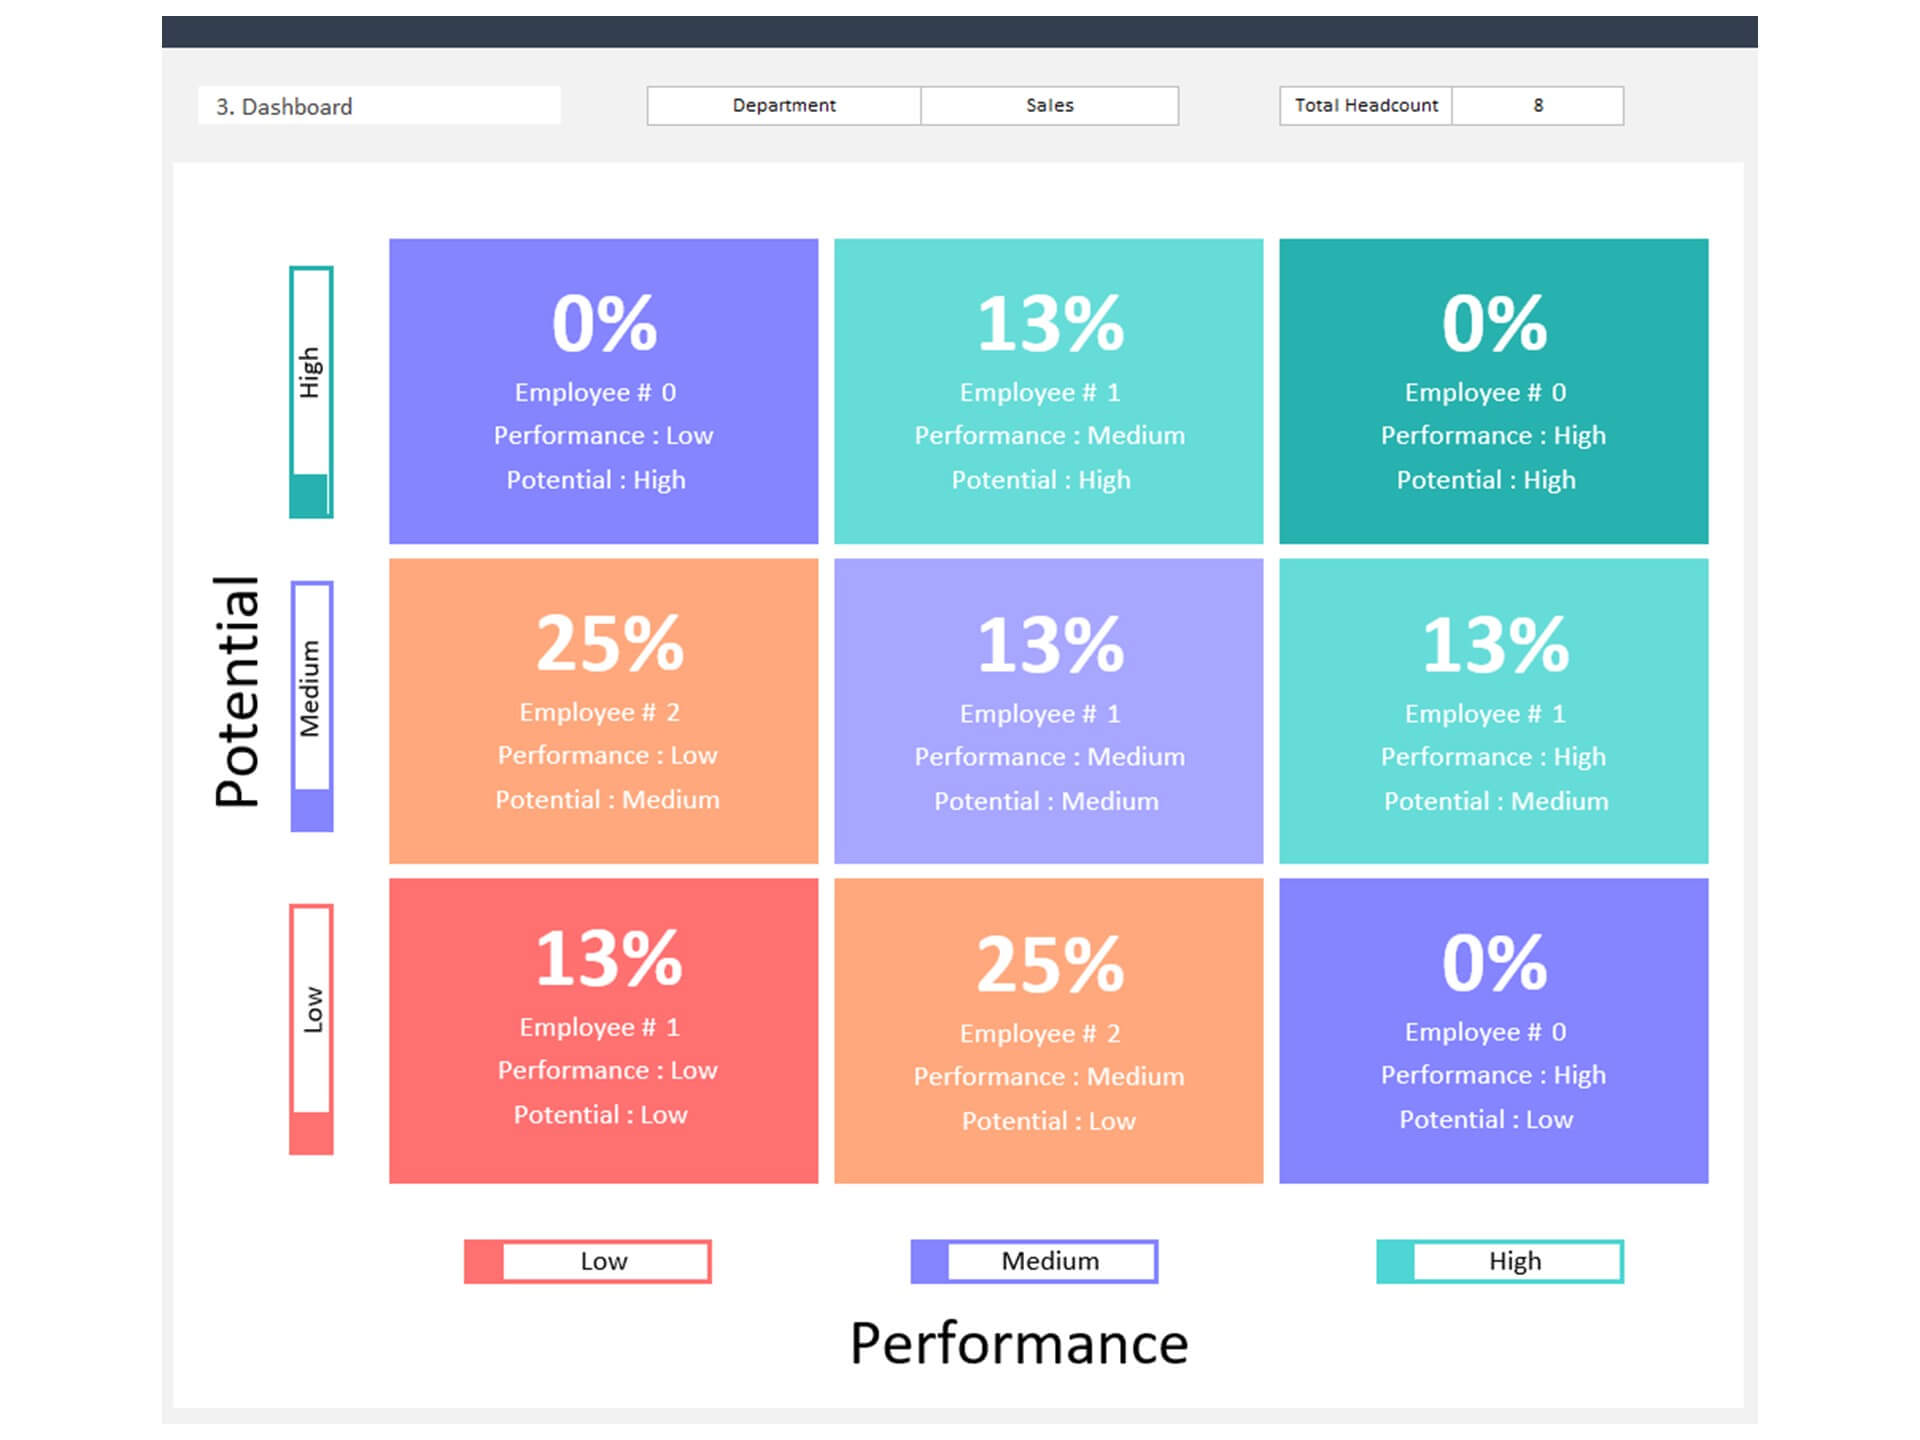
Determine the right KPIs and performance metrics in Excel that best reflect true employee engagement and satisfaction. Establish realistic targets for these KPIs to track organizational progress effectively. These metrics are instrumental in developing strategies aimed at improving retention, enhancing productivity, and increasing operational efficiency.
Action Planning Based on Dashboard Insights
Develop a structured action plan based on the analytics provided by your Employee Engagement Dashboard. Involve team leaders and employees in creating and implementing this plan to ensure comprehensive buy-in and more effective execution. This collaborative approach ensures that strategies are not only data-driven but also aligned with employee expectations and company goals.
The Role of Technology in Employee Engagement Analysis
Integrating Excel and Other Analytics Tools
Maximize the potential of your Employee Engagement Dashboard by integrating Excel with other Microsoft analytics tools. This combination provides deeper insights into track employee engagement and enables more detailed analysis. Evaluate different analytics platforms to determine the best fit for your organization's needs, ensuring a holistic approach to employee engagement analysis.
Maximizing ROI Through Agile HR Practices and Company Culture
Adopt agile methodologies based on the insights gained from your Employee Engagement Dashboard. Use Excel to track the effectiveness of engagement strategies and measure their ROI. This data-driven approach justifies future HR initiatives and budget allocations, ensuring resources are optimally utilized to enhance employee engagement and achieve significant business outcomes.
Key Features of Our Dashboard Template
- Monitor employee engagement indicators progress monthly
- Provide actionable insights
- Consolidate all your employee engagement metrics in one place
- Visualize overall employee engagement performance
- Fully editable, easy-to-use, template with sample data
- Eye-catching design and customizable
- Change the sample data with your data
- Spreadsheets ready for printing without Biz Infograph logo
- Consolidate key business performance indicators in one dashboard
- No monthly fees
- Immediate download
- No VBA, no Macro
- No installation necessary
- Professionally designed
What is included in this dashboard template?
- Ready dashboard just plug your data and start using it. The dashboard will be ready instantly.
- A text file that contains a password to view and edit the formula
- A guide to unlocking all the elements in the dashboard
Professional Support:
- Video tutorial guide on how to navigate and use each Dashboard Template
- Professional service to customize dashboard template in excel as per business need
- Help and support in post-purchase
- Payment secured by Stripe and PayPal (no PayPal account needed)
A brief guide to using the dashboard template:
- Open the dashboard template
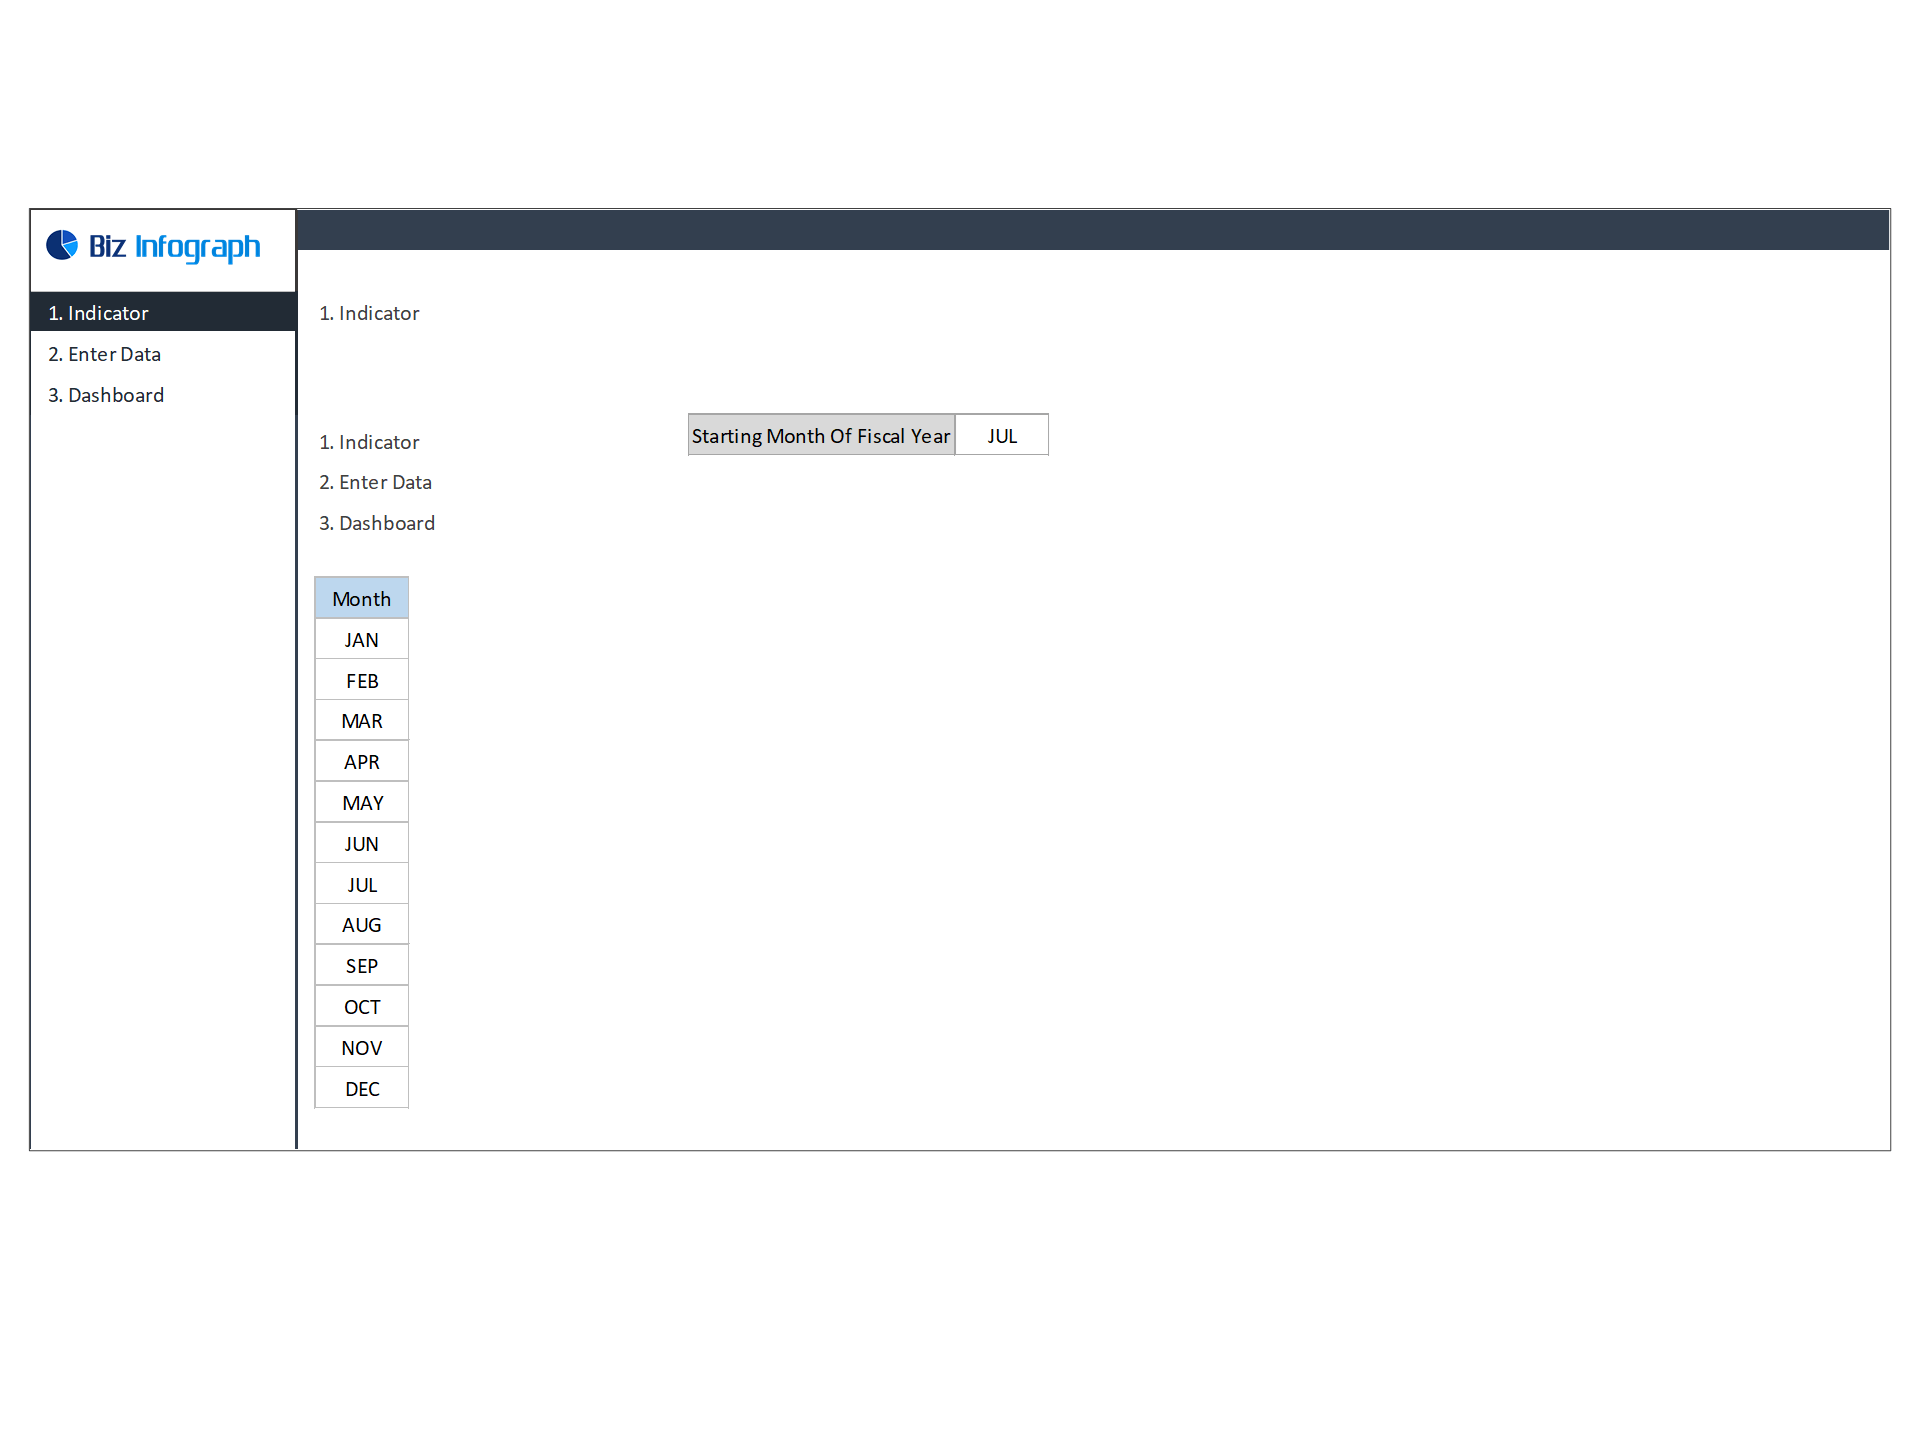
- Go to ‘Indicators’ menu – choose the start month of the fiscal year (i.e. Jan, Feb, Jul, etc.)
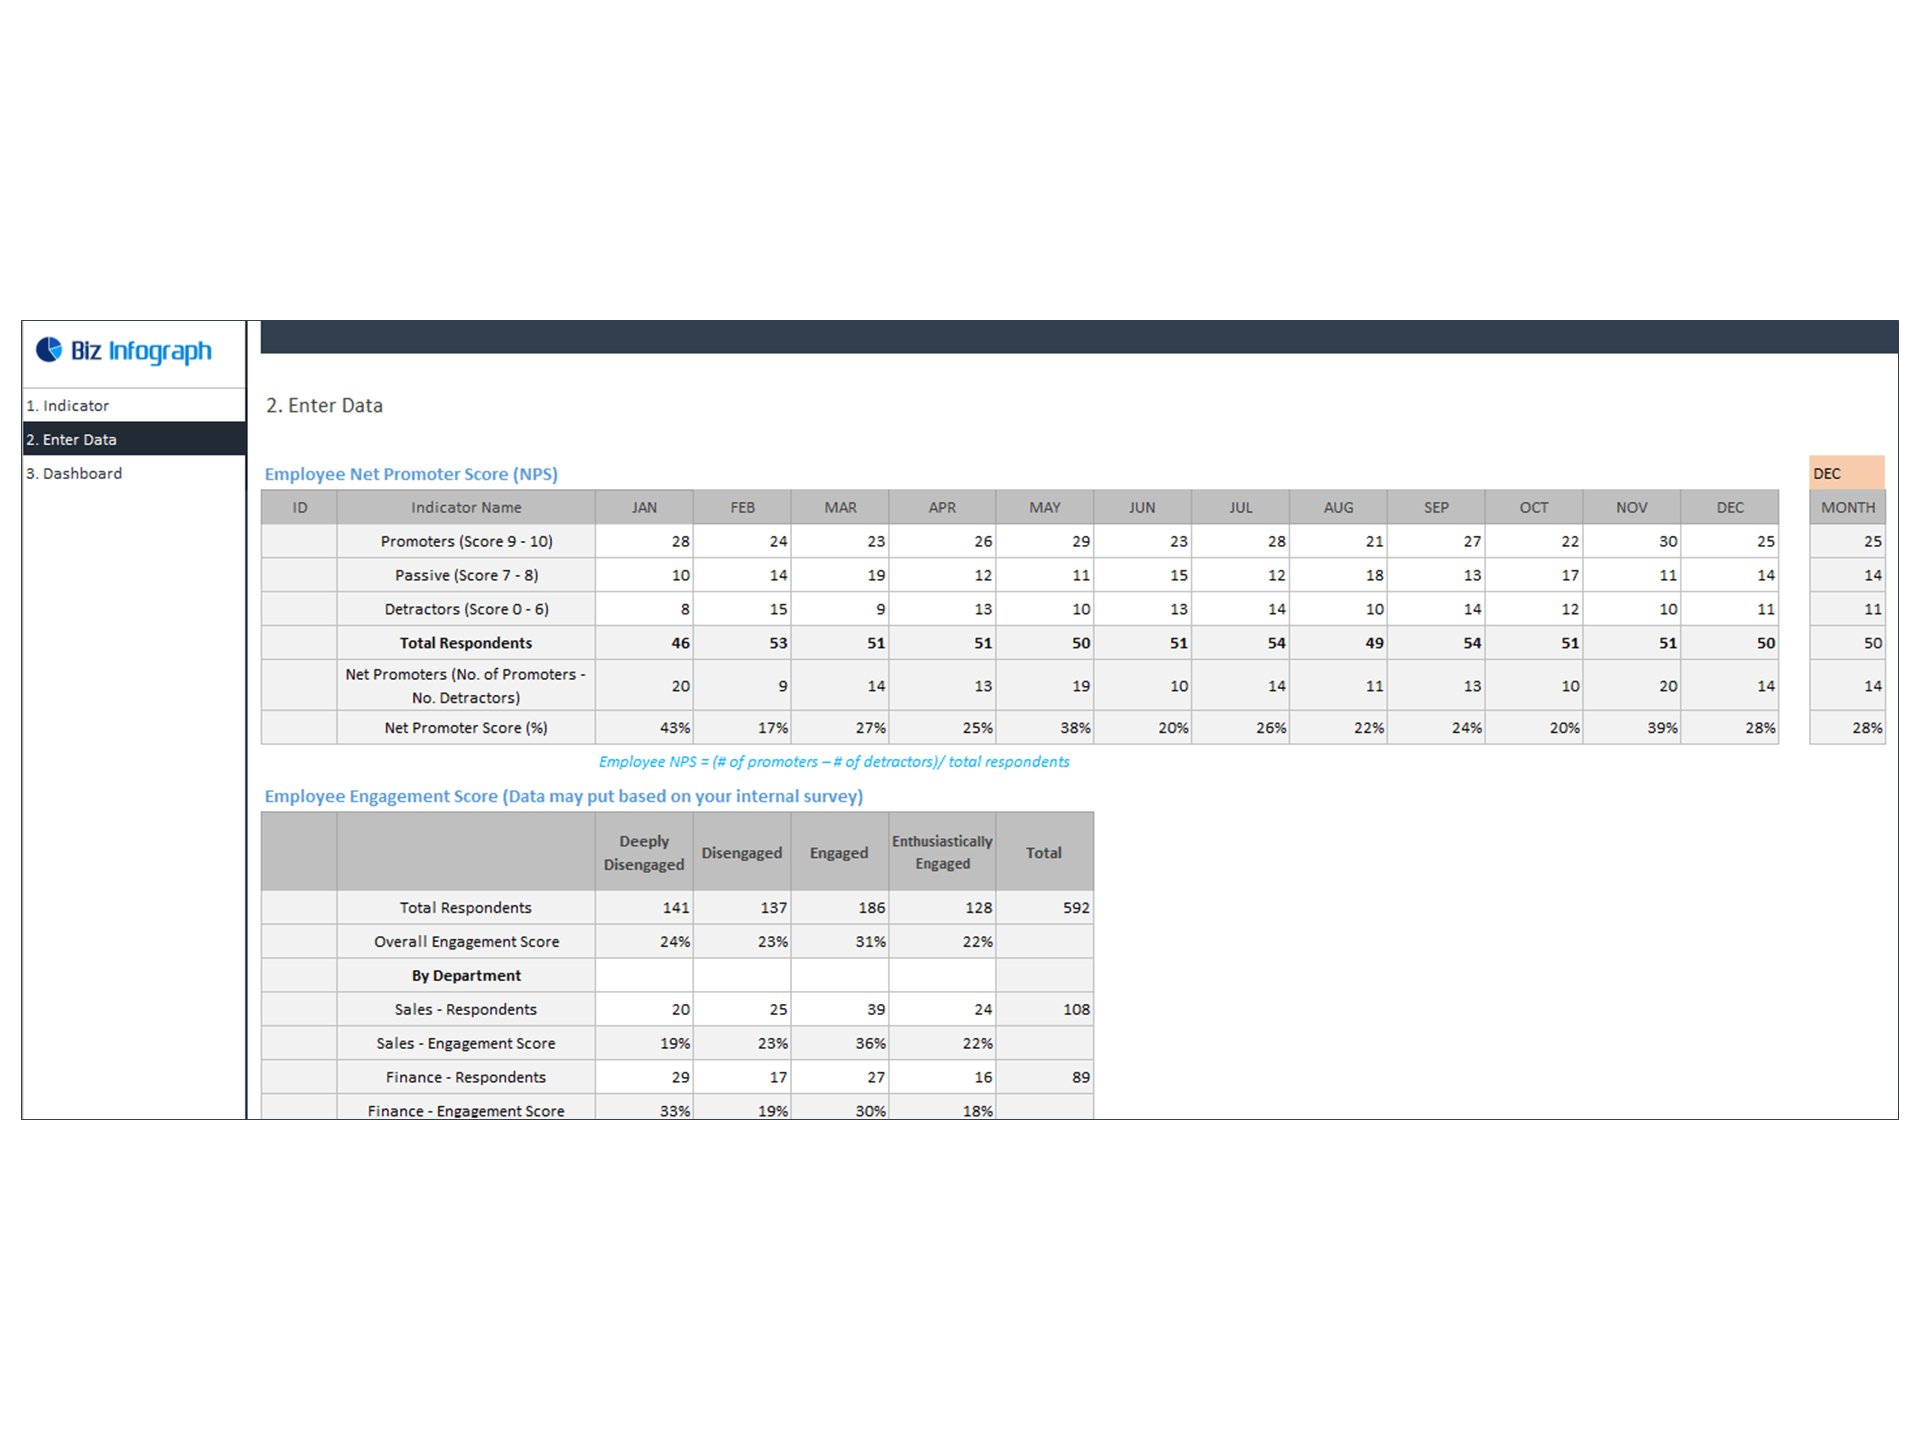
- Go to the ‘Enter Data’ menu – remove the sample data and give your actual data in the respective cells. Formula cells are locked, and you cannot edit it without a password.
- Go to the ‘Dashboard’ menu – select the month name from the drop-down to see the monthly picture of performance indicators
- Each page is ready for printing – just press CTRL+P
This Excel dashboard template is password-protected to avoid mistakes, such as accidentally deleting formulas. When you completed the purchase, the password will be available.
For ready-to-use Dashboard Templates: