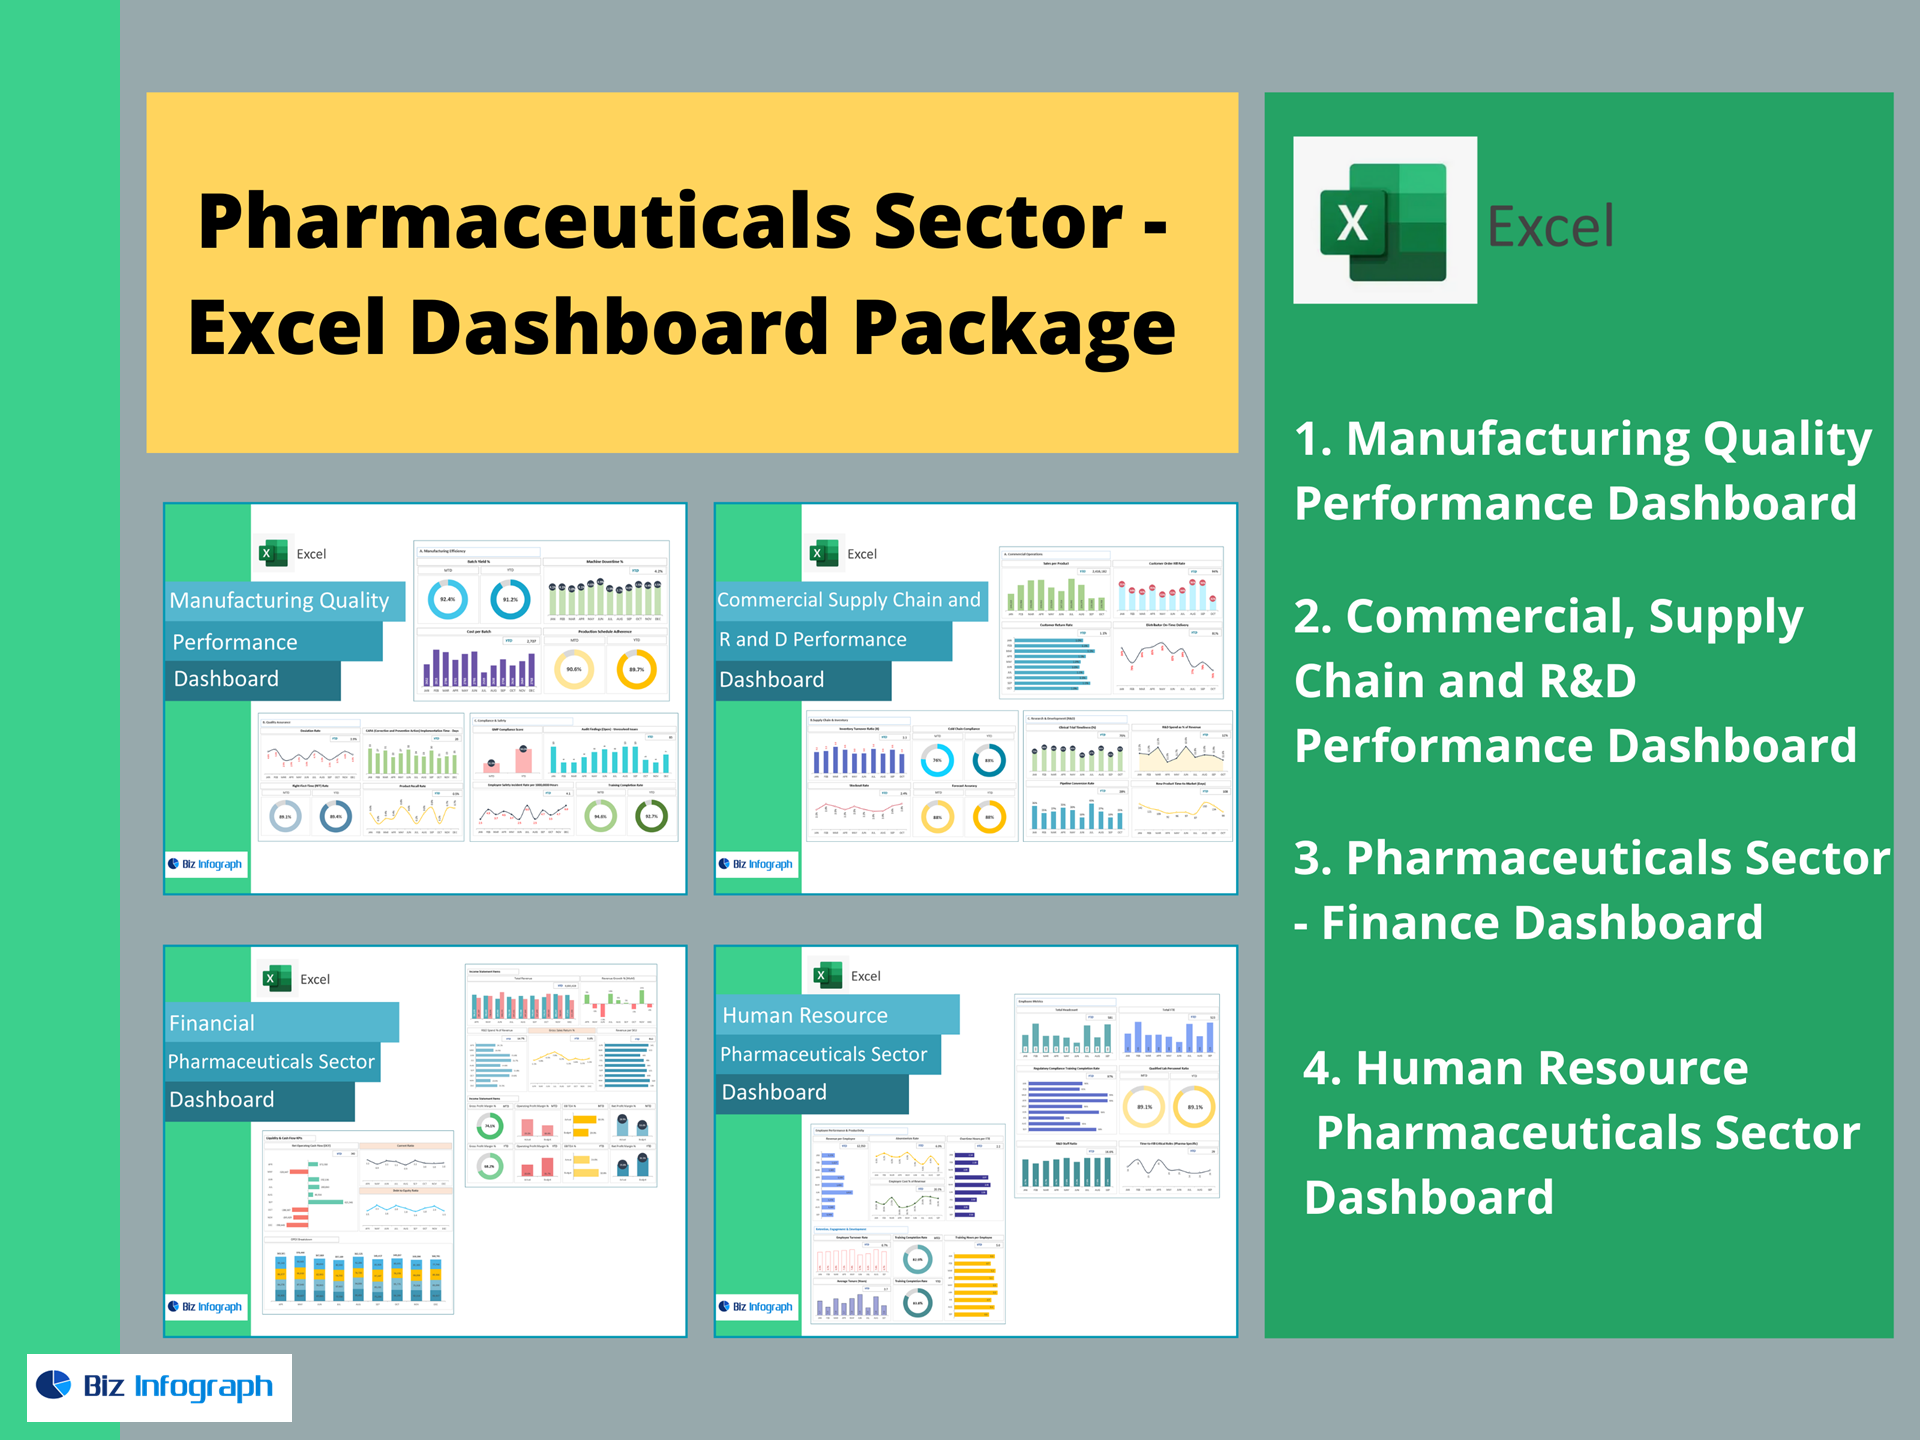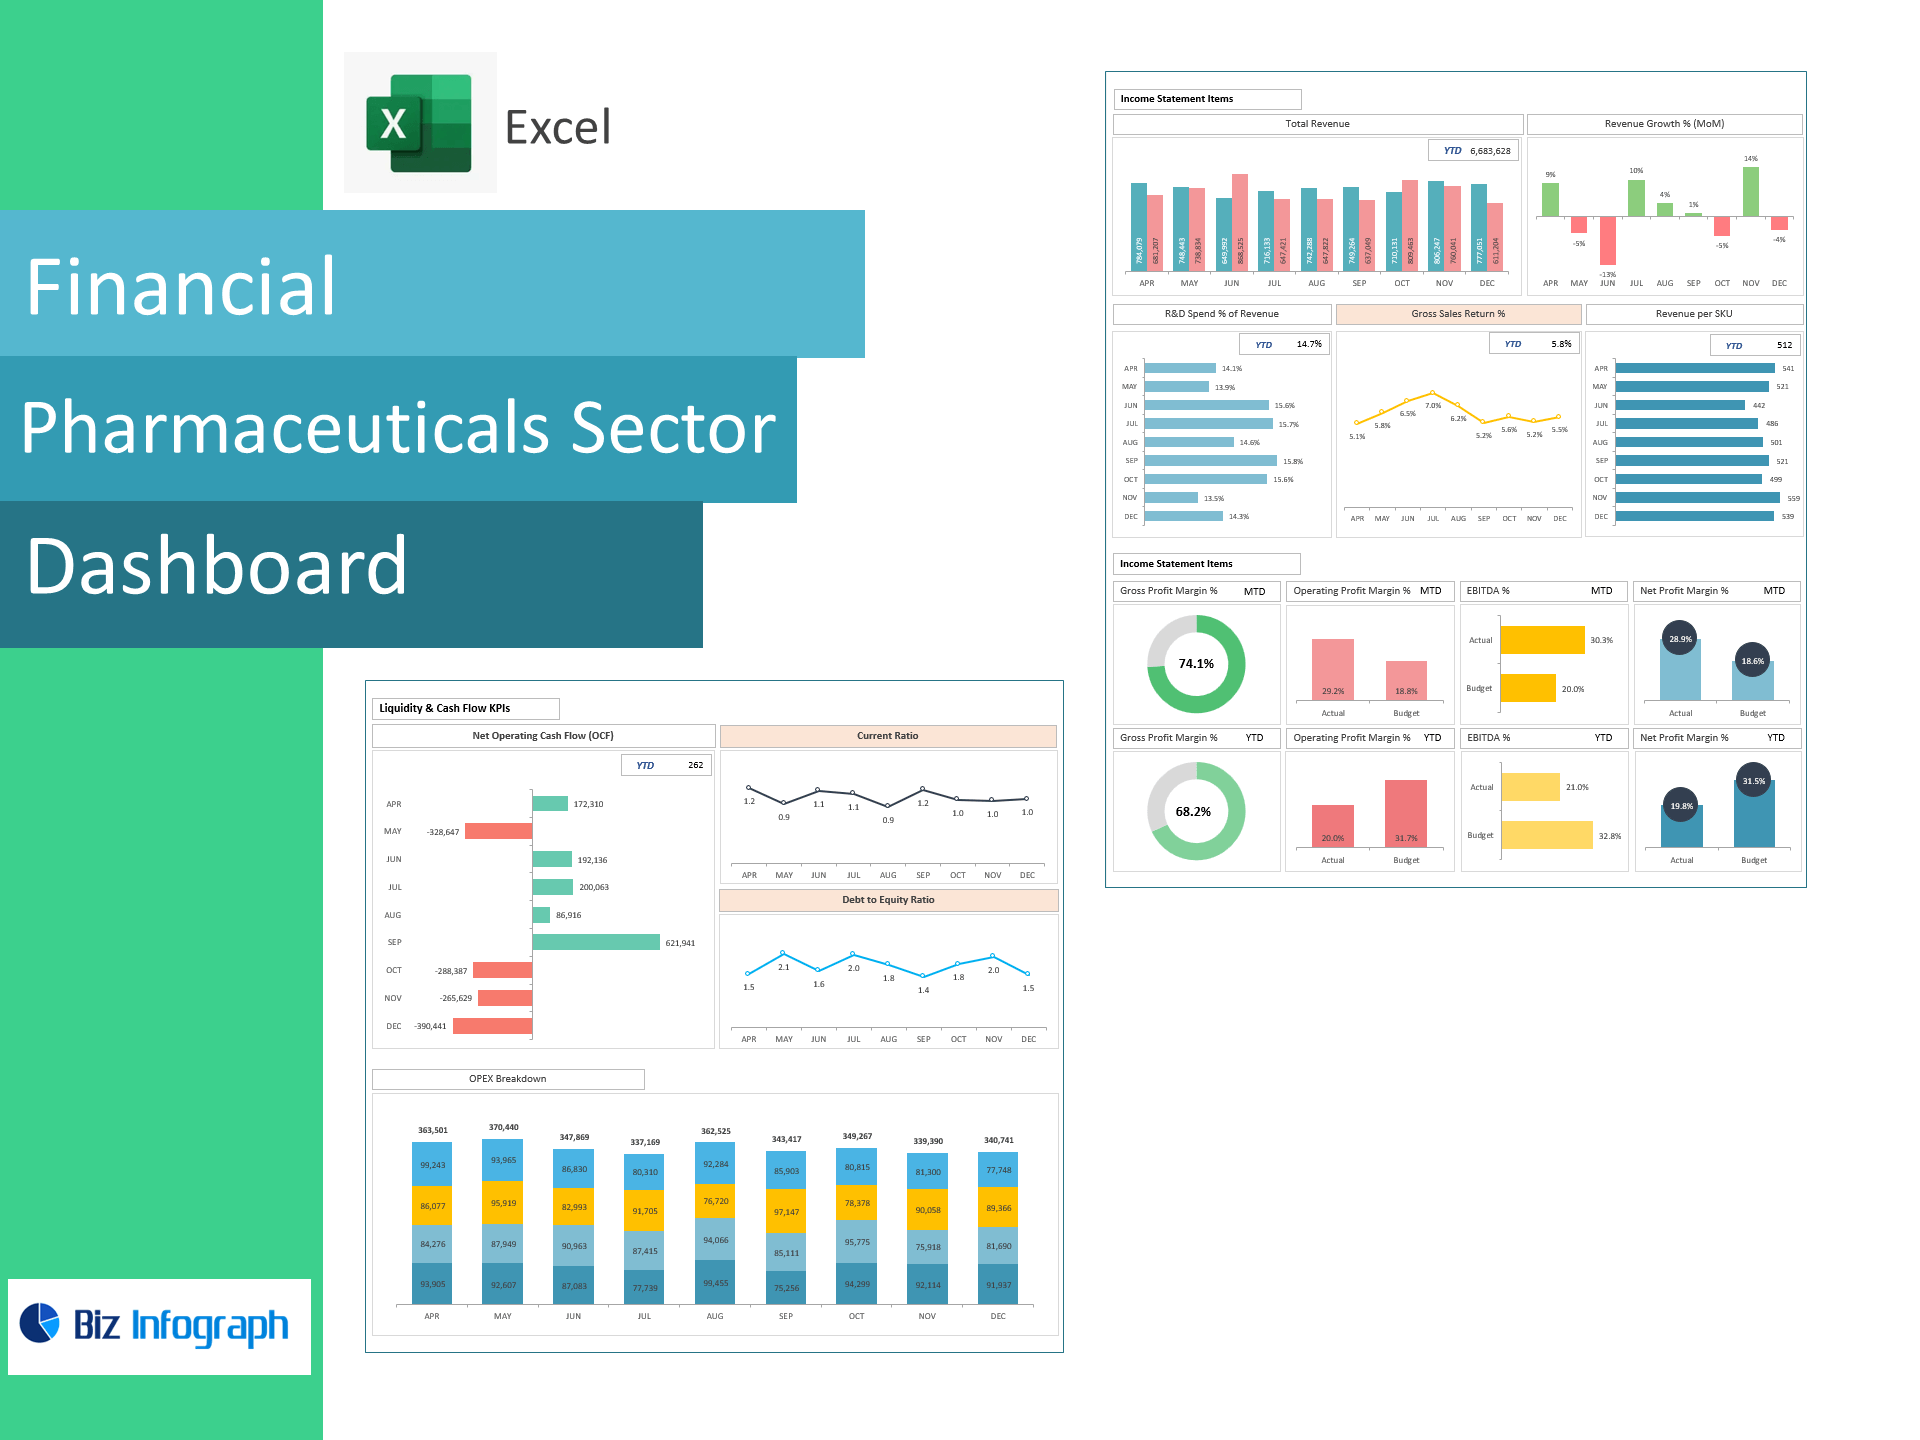
Pharmaceuticals Sector Financial Dashboard — Excel Template
Make pharma finance reviews faster and sharper with a ready-to-use Excel dashboard tailored to commercial, FP&A, and portfolio teams. Track P&L, liquidity, R&D intensity, product returns/expiry, and SKU productivity in one place—no macros, fully editable.
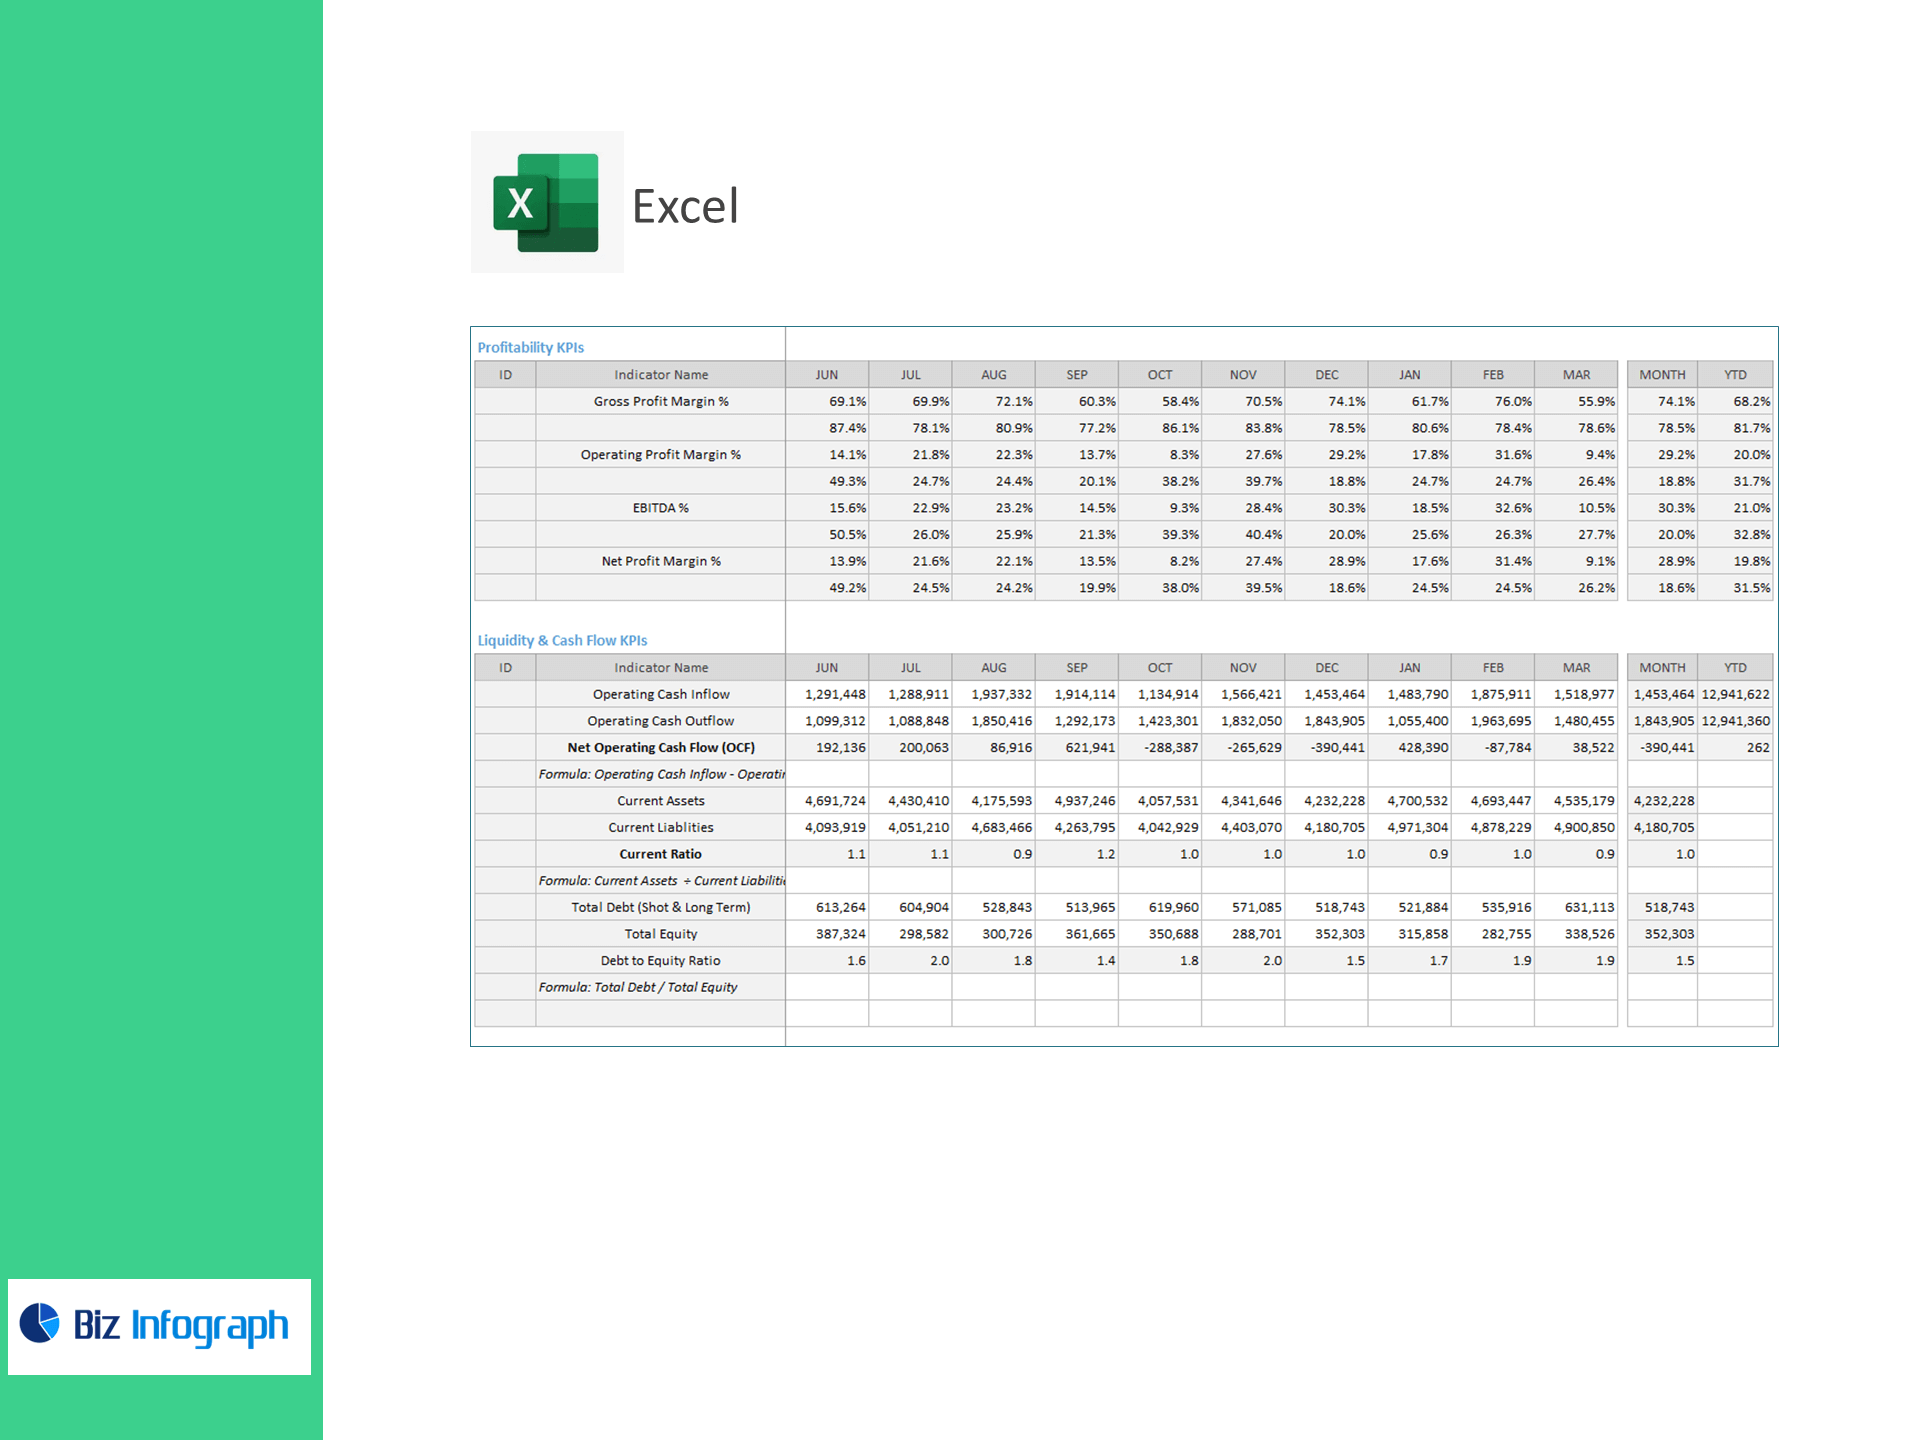
What it tracks (out of the box)
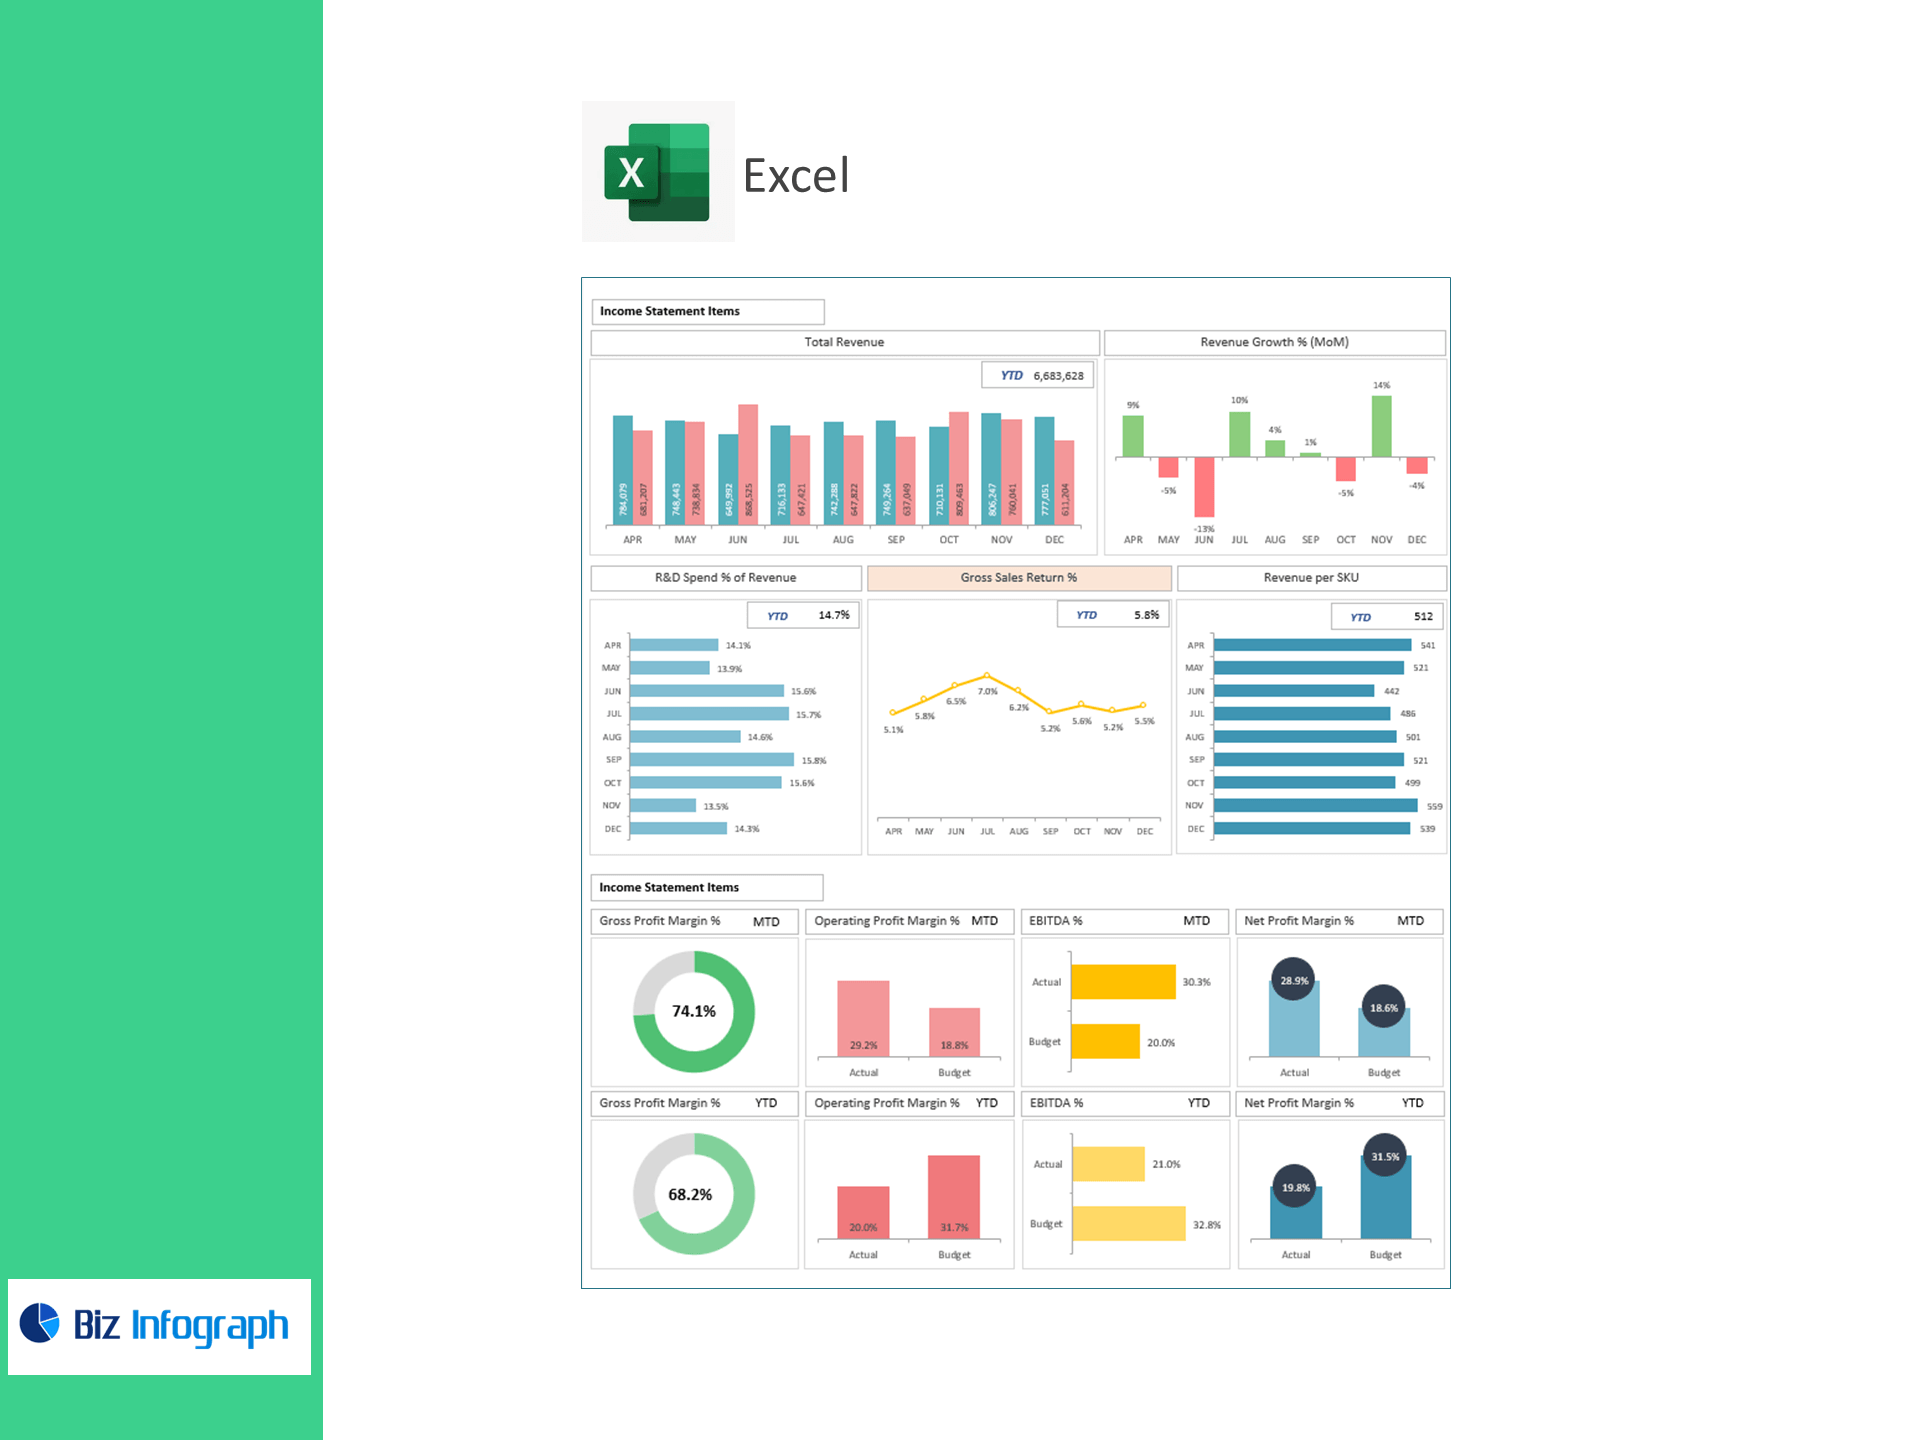
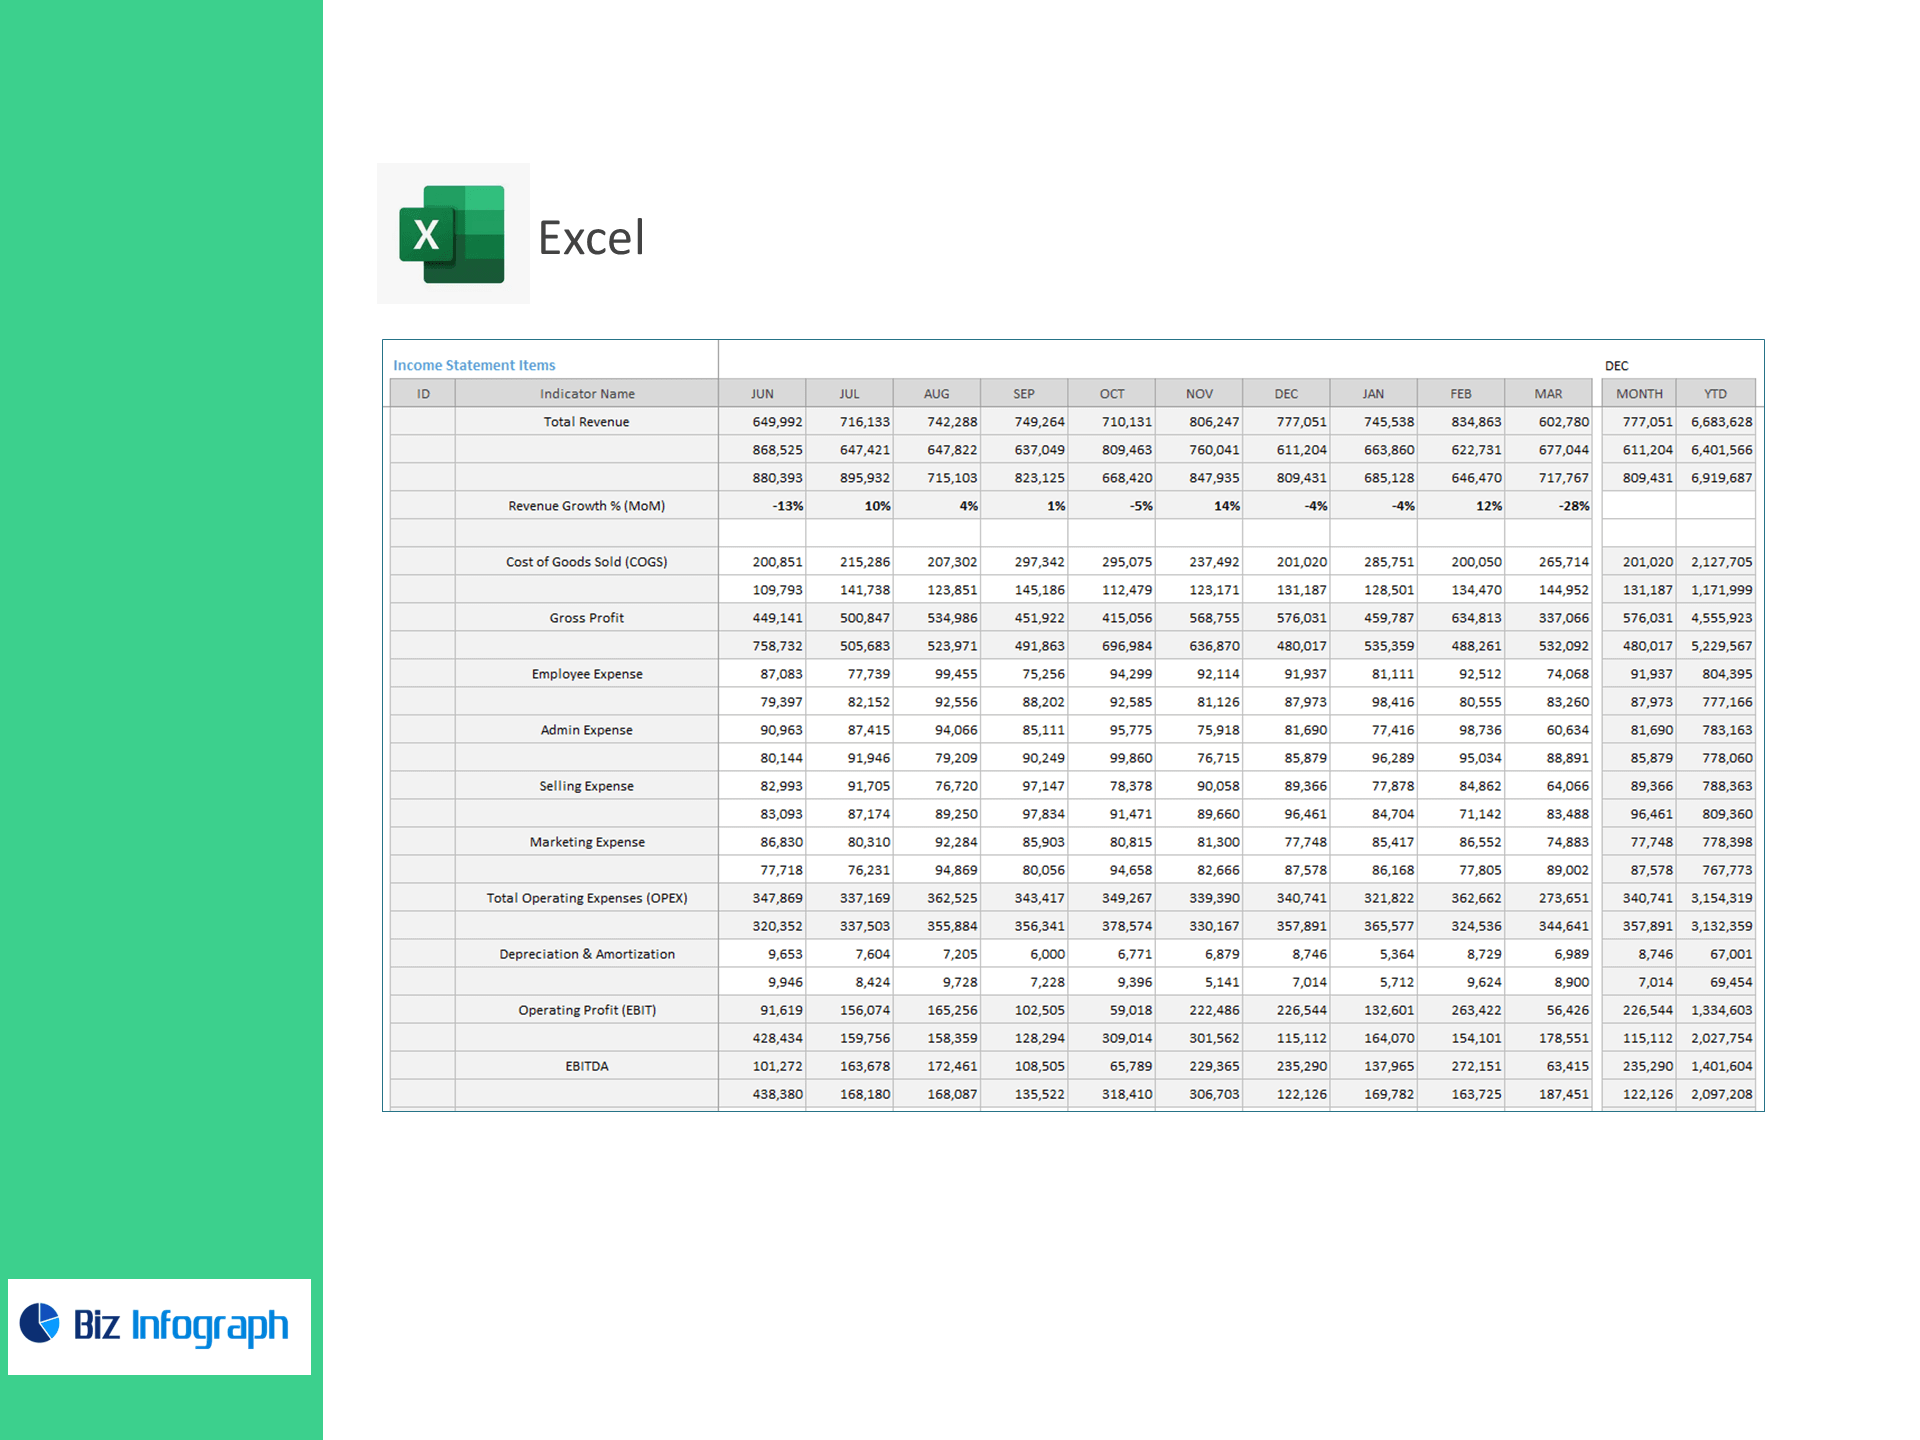
Income Statement & Profitability
-
Total Revenue, COGS, Gross Profit
-
OPEX breakdown (Employee, Admin, Selling, Marketing, D&A)
-
EBIT, EBITDA, Interest, Taxes, Net Profit
-
Margins: Gross, Operating, EBITDA %, Net
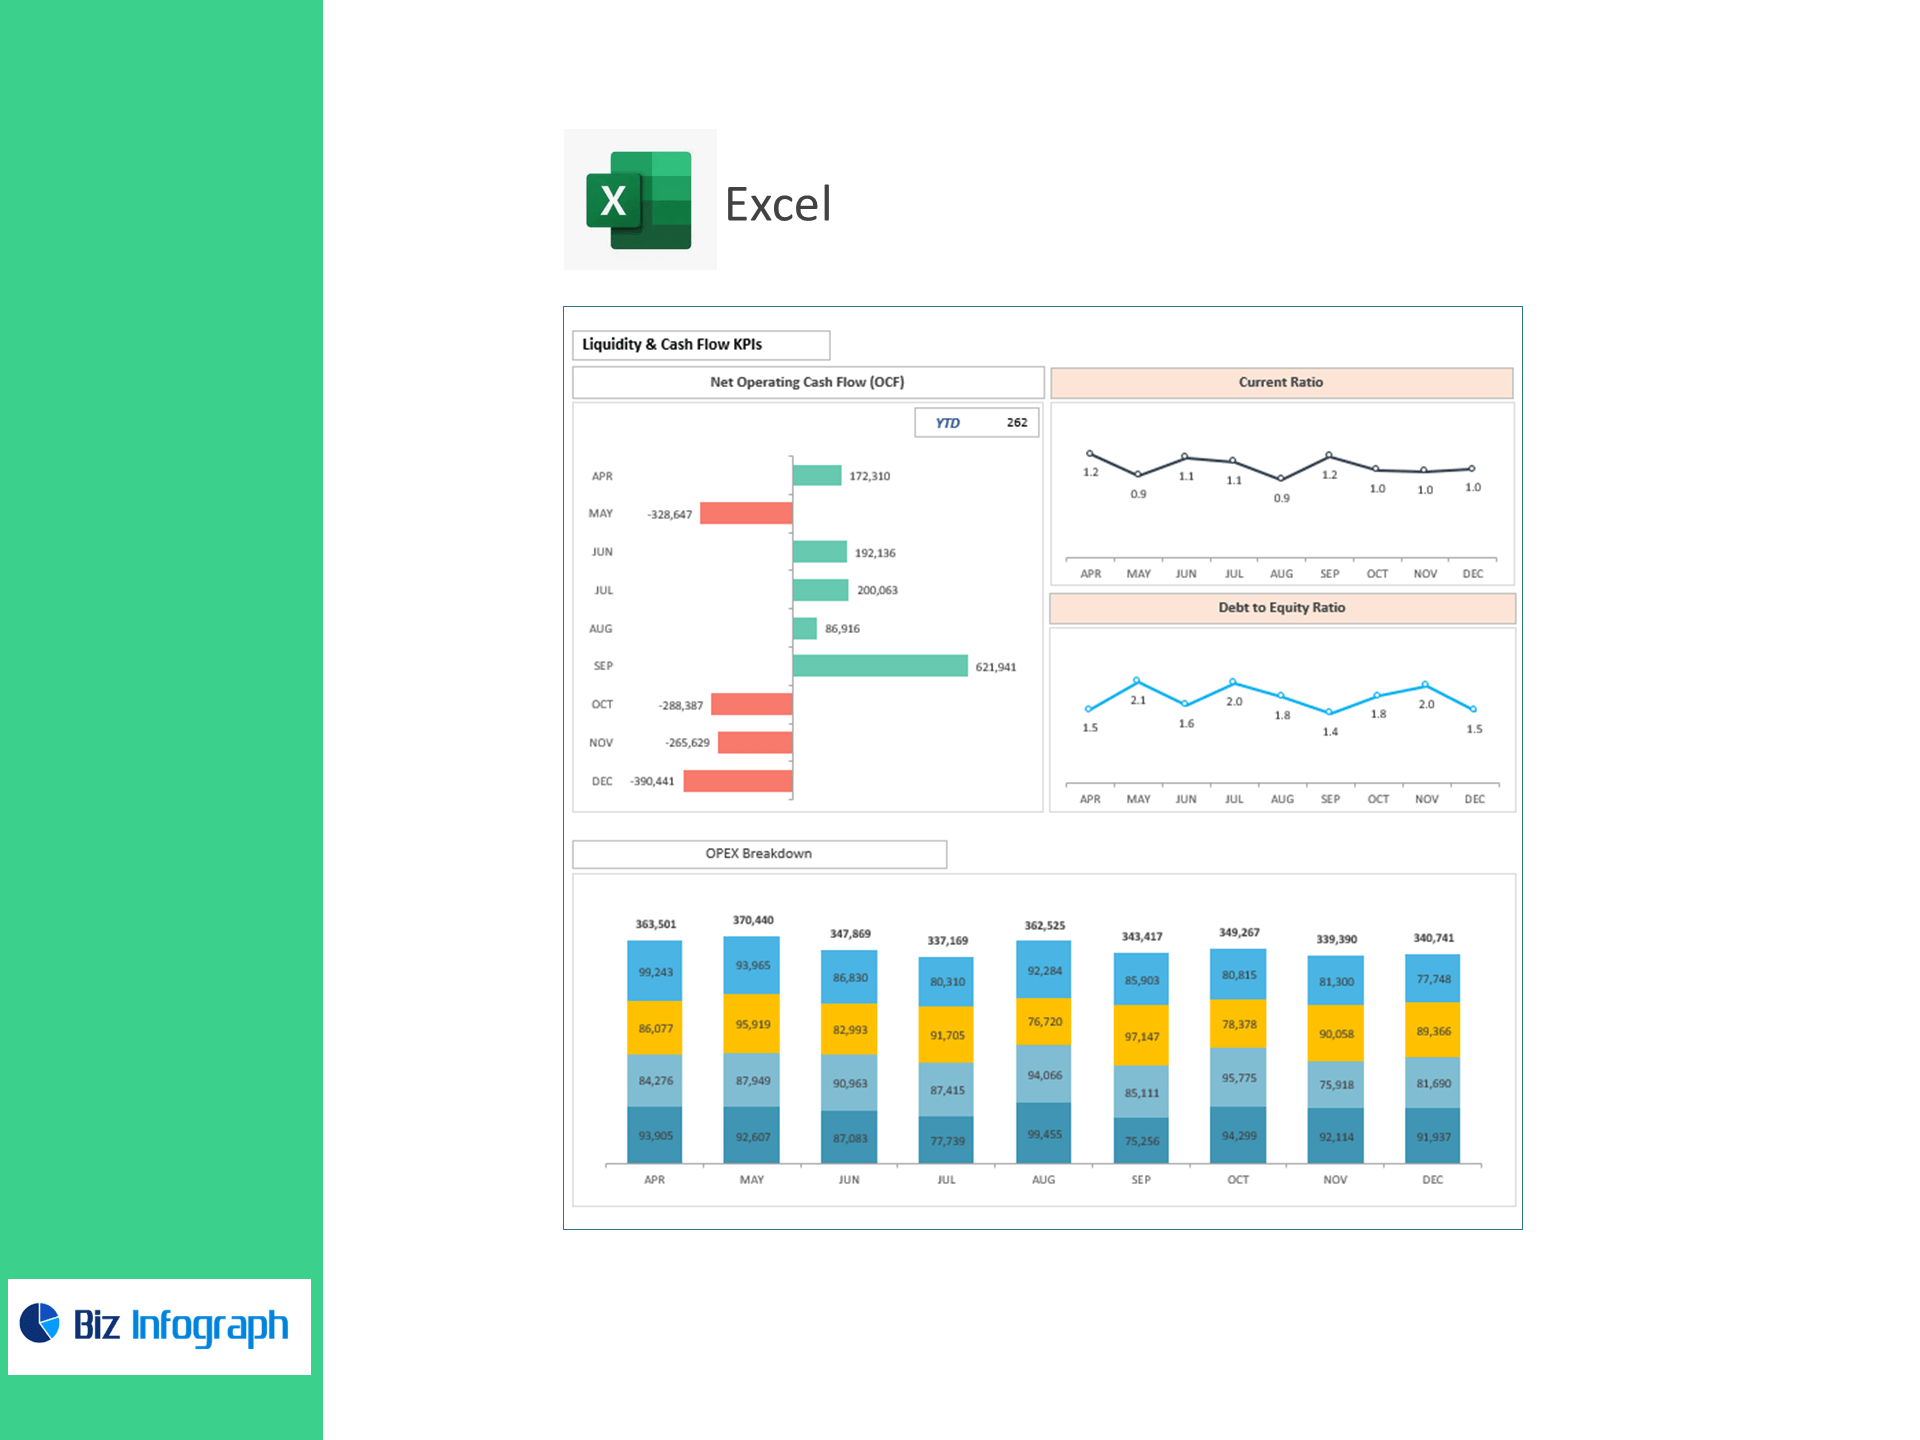
Liquidity & Capital Structure
-
Operating Cash Inflow/Outflow & Net OCF
-
Current Ratio (Current Assets ÷ Current Liabilities)
-
Debt-to-Equity and leverage snapshots
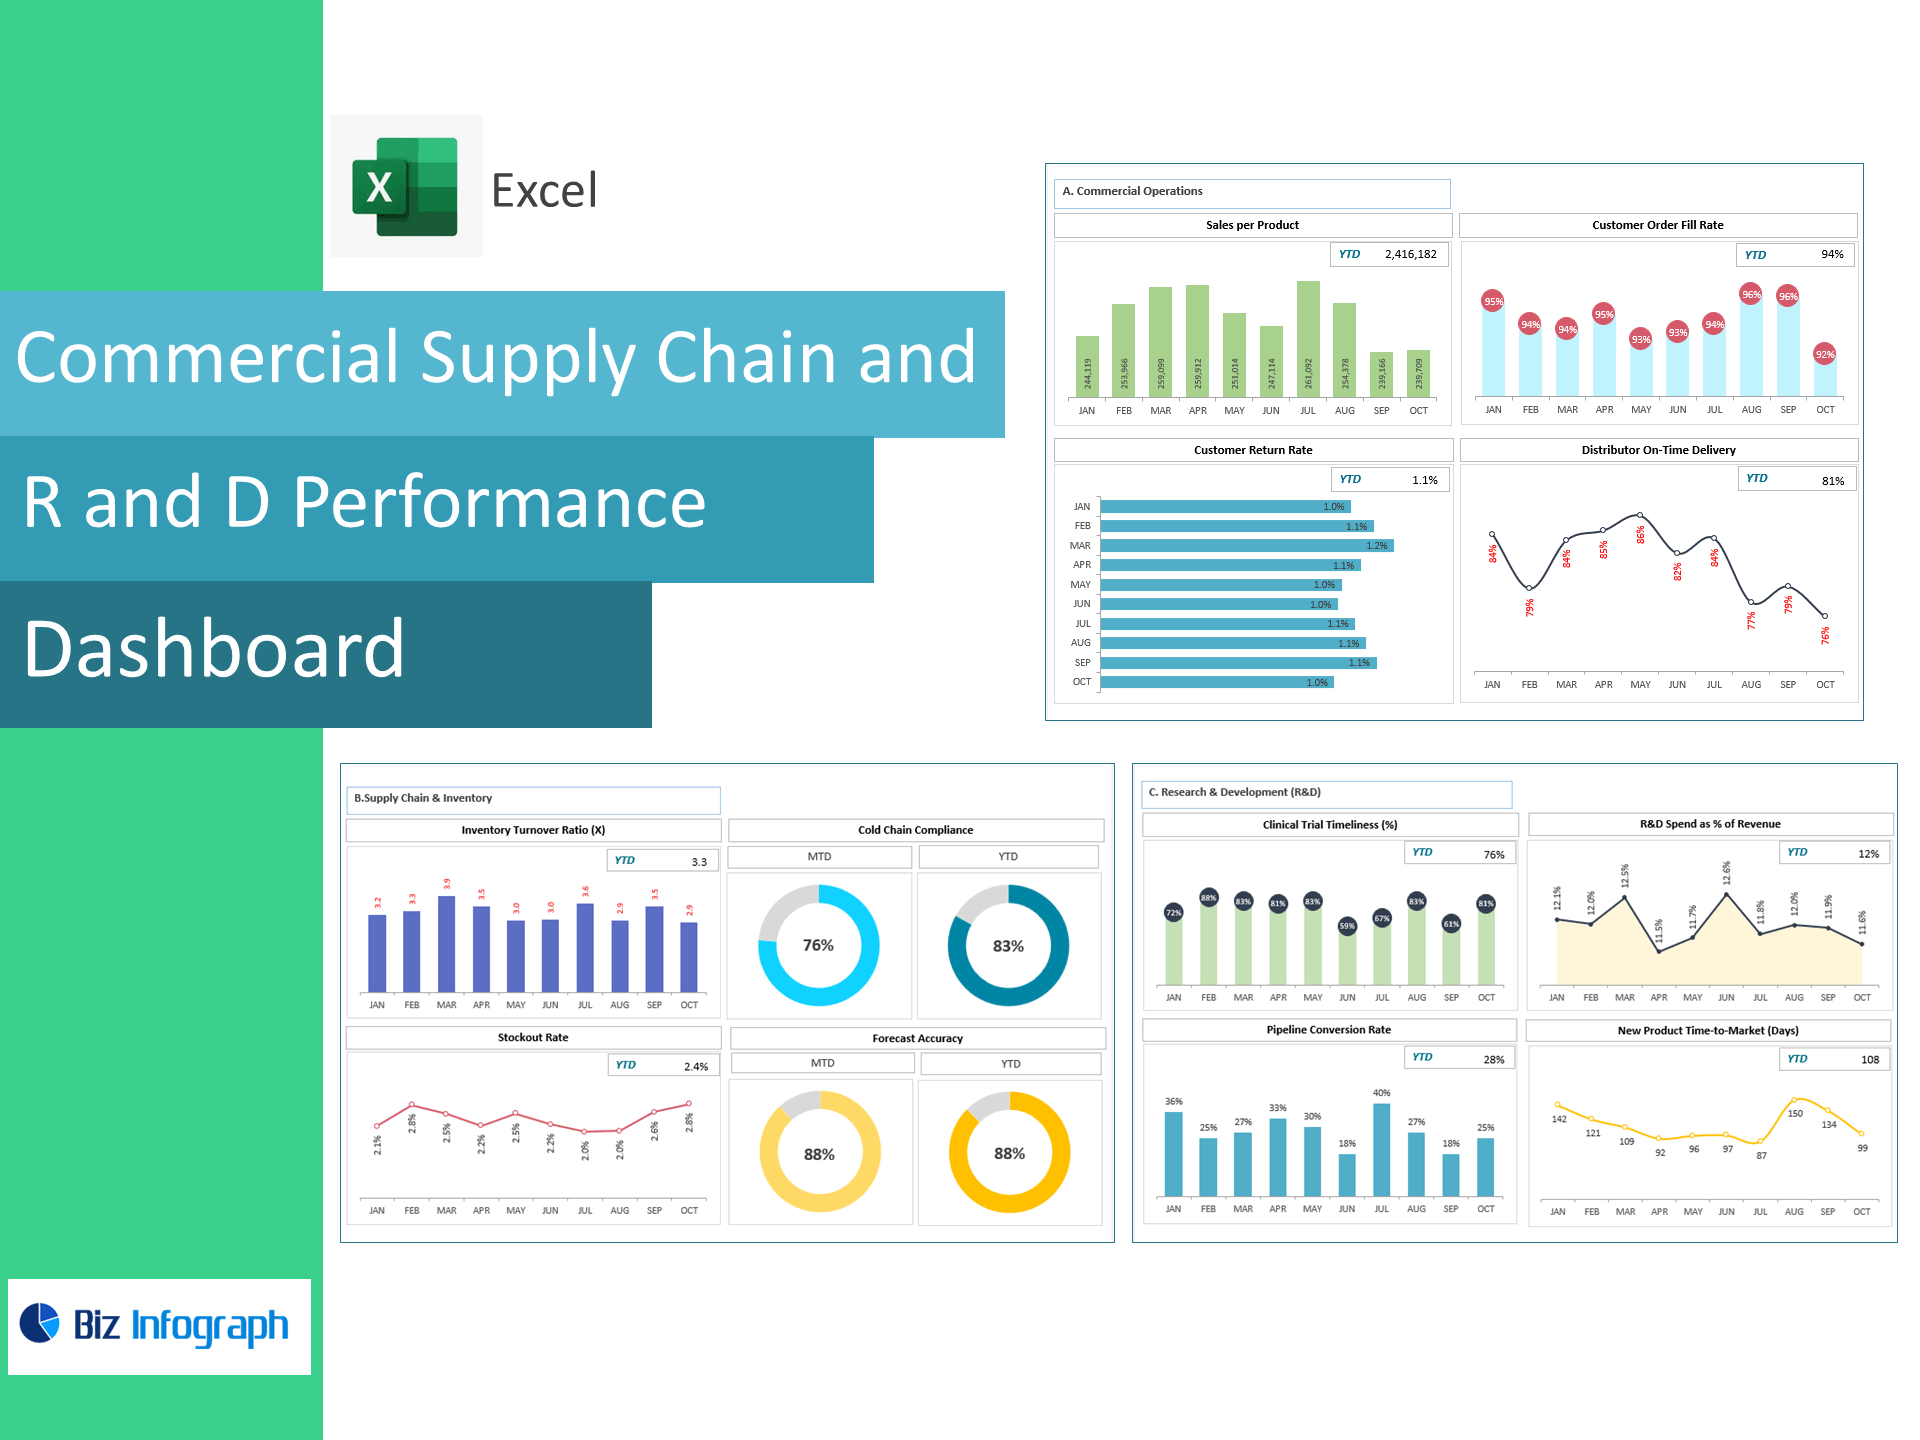
Pharma-Specific Operational KPIs
-
R&D Expenditure & R&D Spend % of Revenue
-
Gross Sales Return % (returns & expired products)
-
Active Products (SKUs) & Revenue per SKU
Why it’s built for Pharma
-
Isolate returns/expiry impact on gross-to-net quickly
-
Monitor R&D intensity against revenue and targets
-
Compare SKU productivity to prioritize the portfolio
-
One-click filters for brand, TA, region, month/quarter
What you get
-
Executive KPI cards, trend lines, variance vs. plan
-
Clean data tabs for quick paste from ERP/BI exports (CSV/XLSX)
-
Thresholds & RAG alerts; export to PDF/PPT for MBR/QBR
-
Works with Excel 365/2021 (Windows & Mac)
For ready-to-use Dashboard Templates: