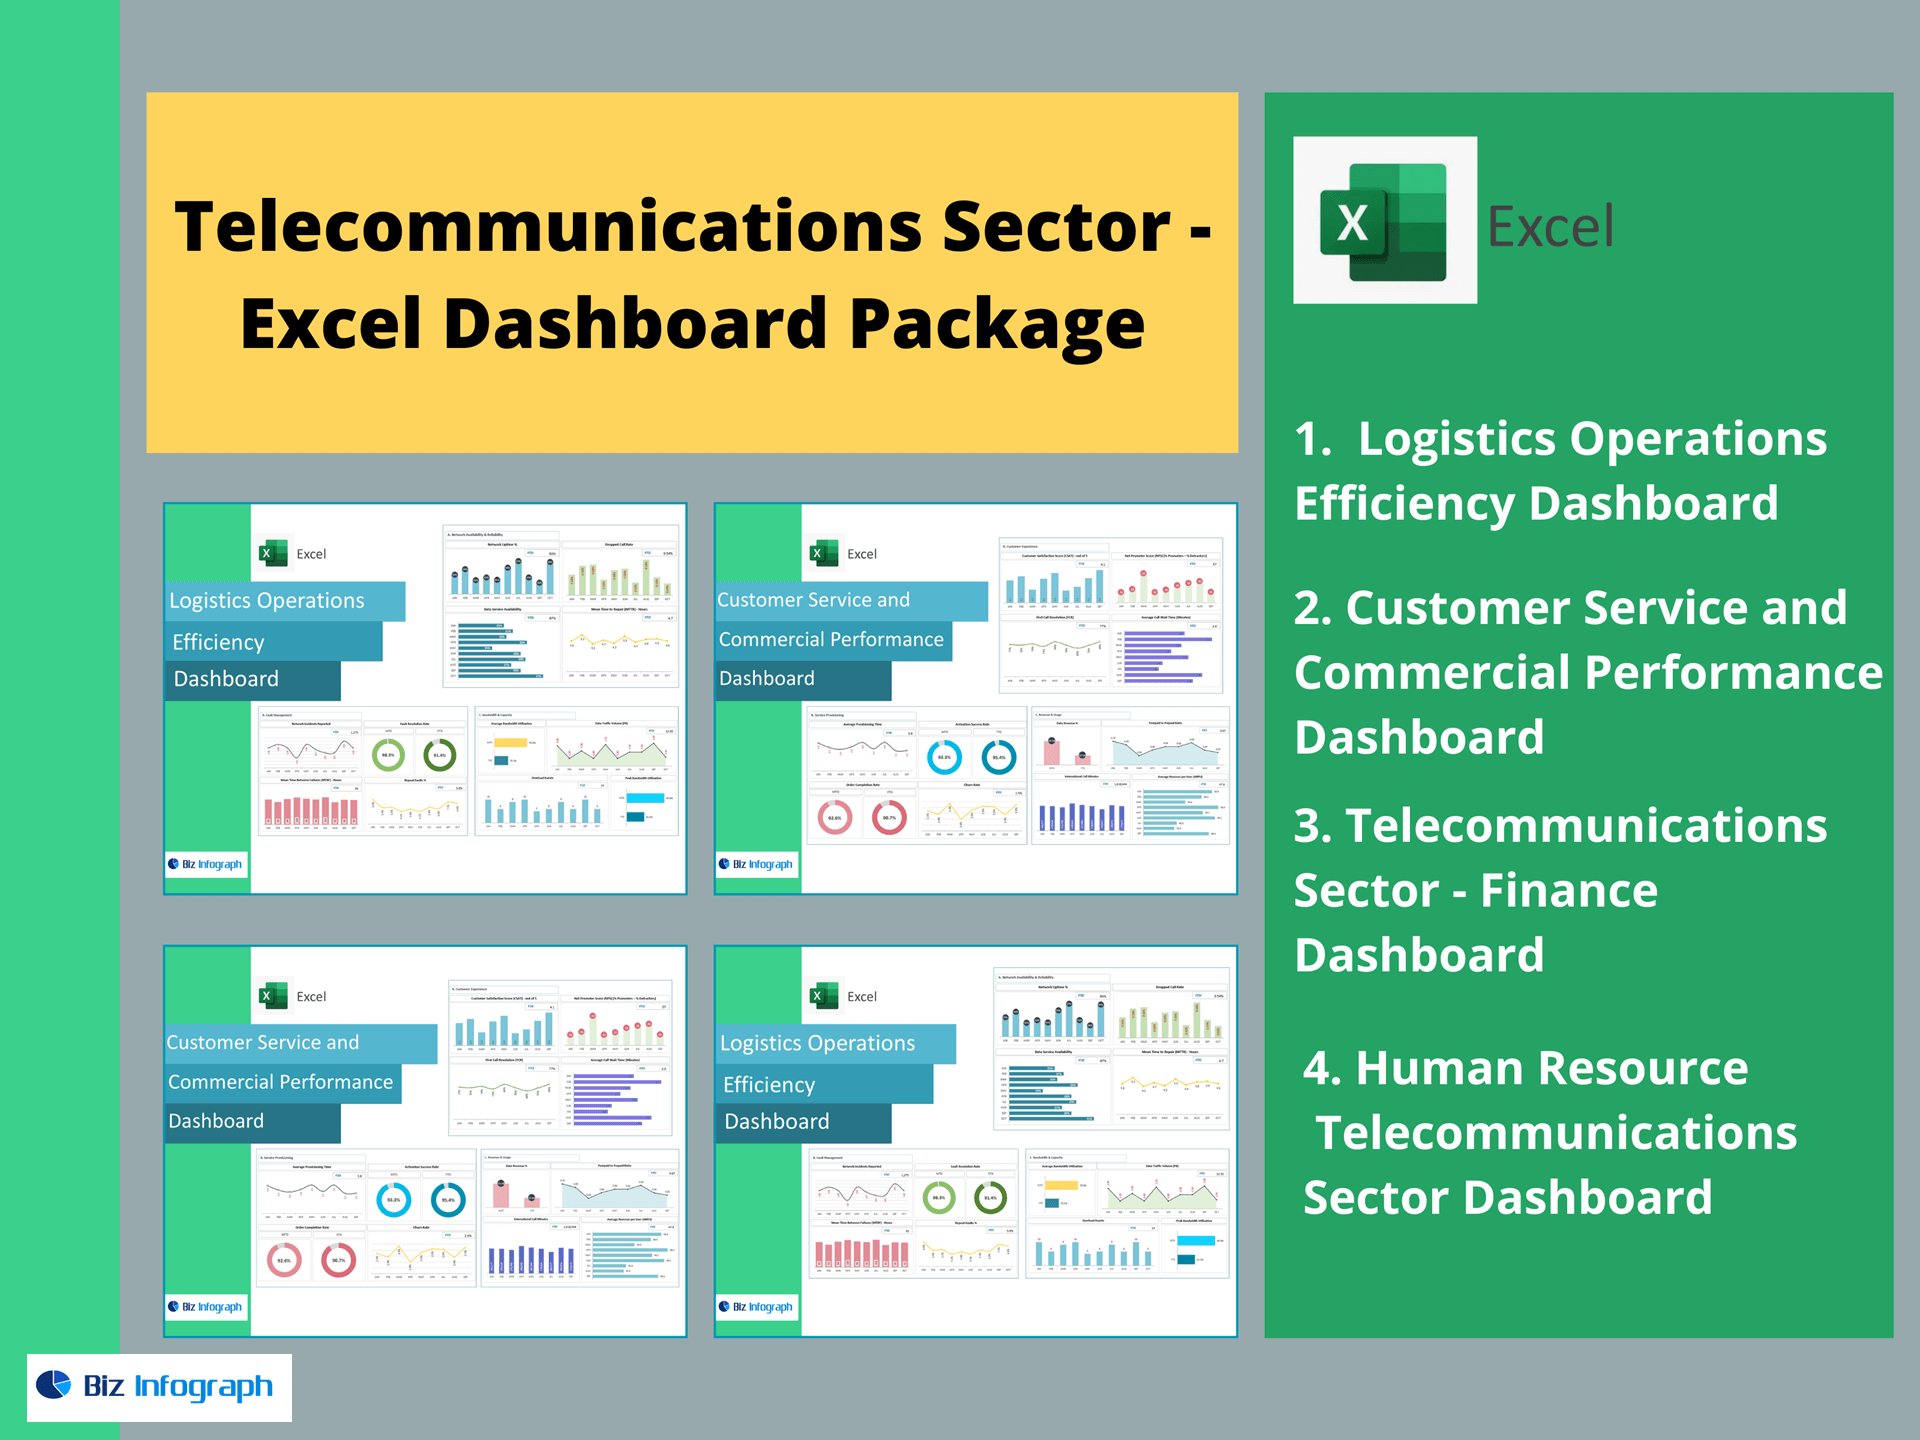
Logistics Operations Efficiency Dashboard — Excel Template
Run your logistics network like a pro. This ready-to-use Excel dashboard turns fleet, warehouse, and linehaul data into clear KPIs—so you can lift on-time performance, protect capacity, and cut downtime without building a model from scratch.
Built for logistics teams
-
No macros or add-ins (Excel 2016+ Win/Mac).
-
Drop-in data tabs for fleet hours, trips, incidents, repairs, capacity, and throughput.
-
Targets & RAG (red/amber/green) with MoM/YoY trends and variance to goal.
-
Filters by site, region, lane, vehicle class, customer segment, and time period.
KPIs included (with formulas)
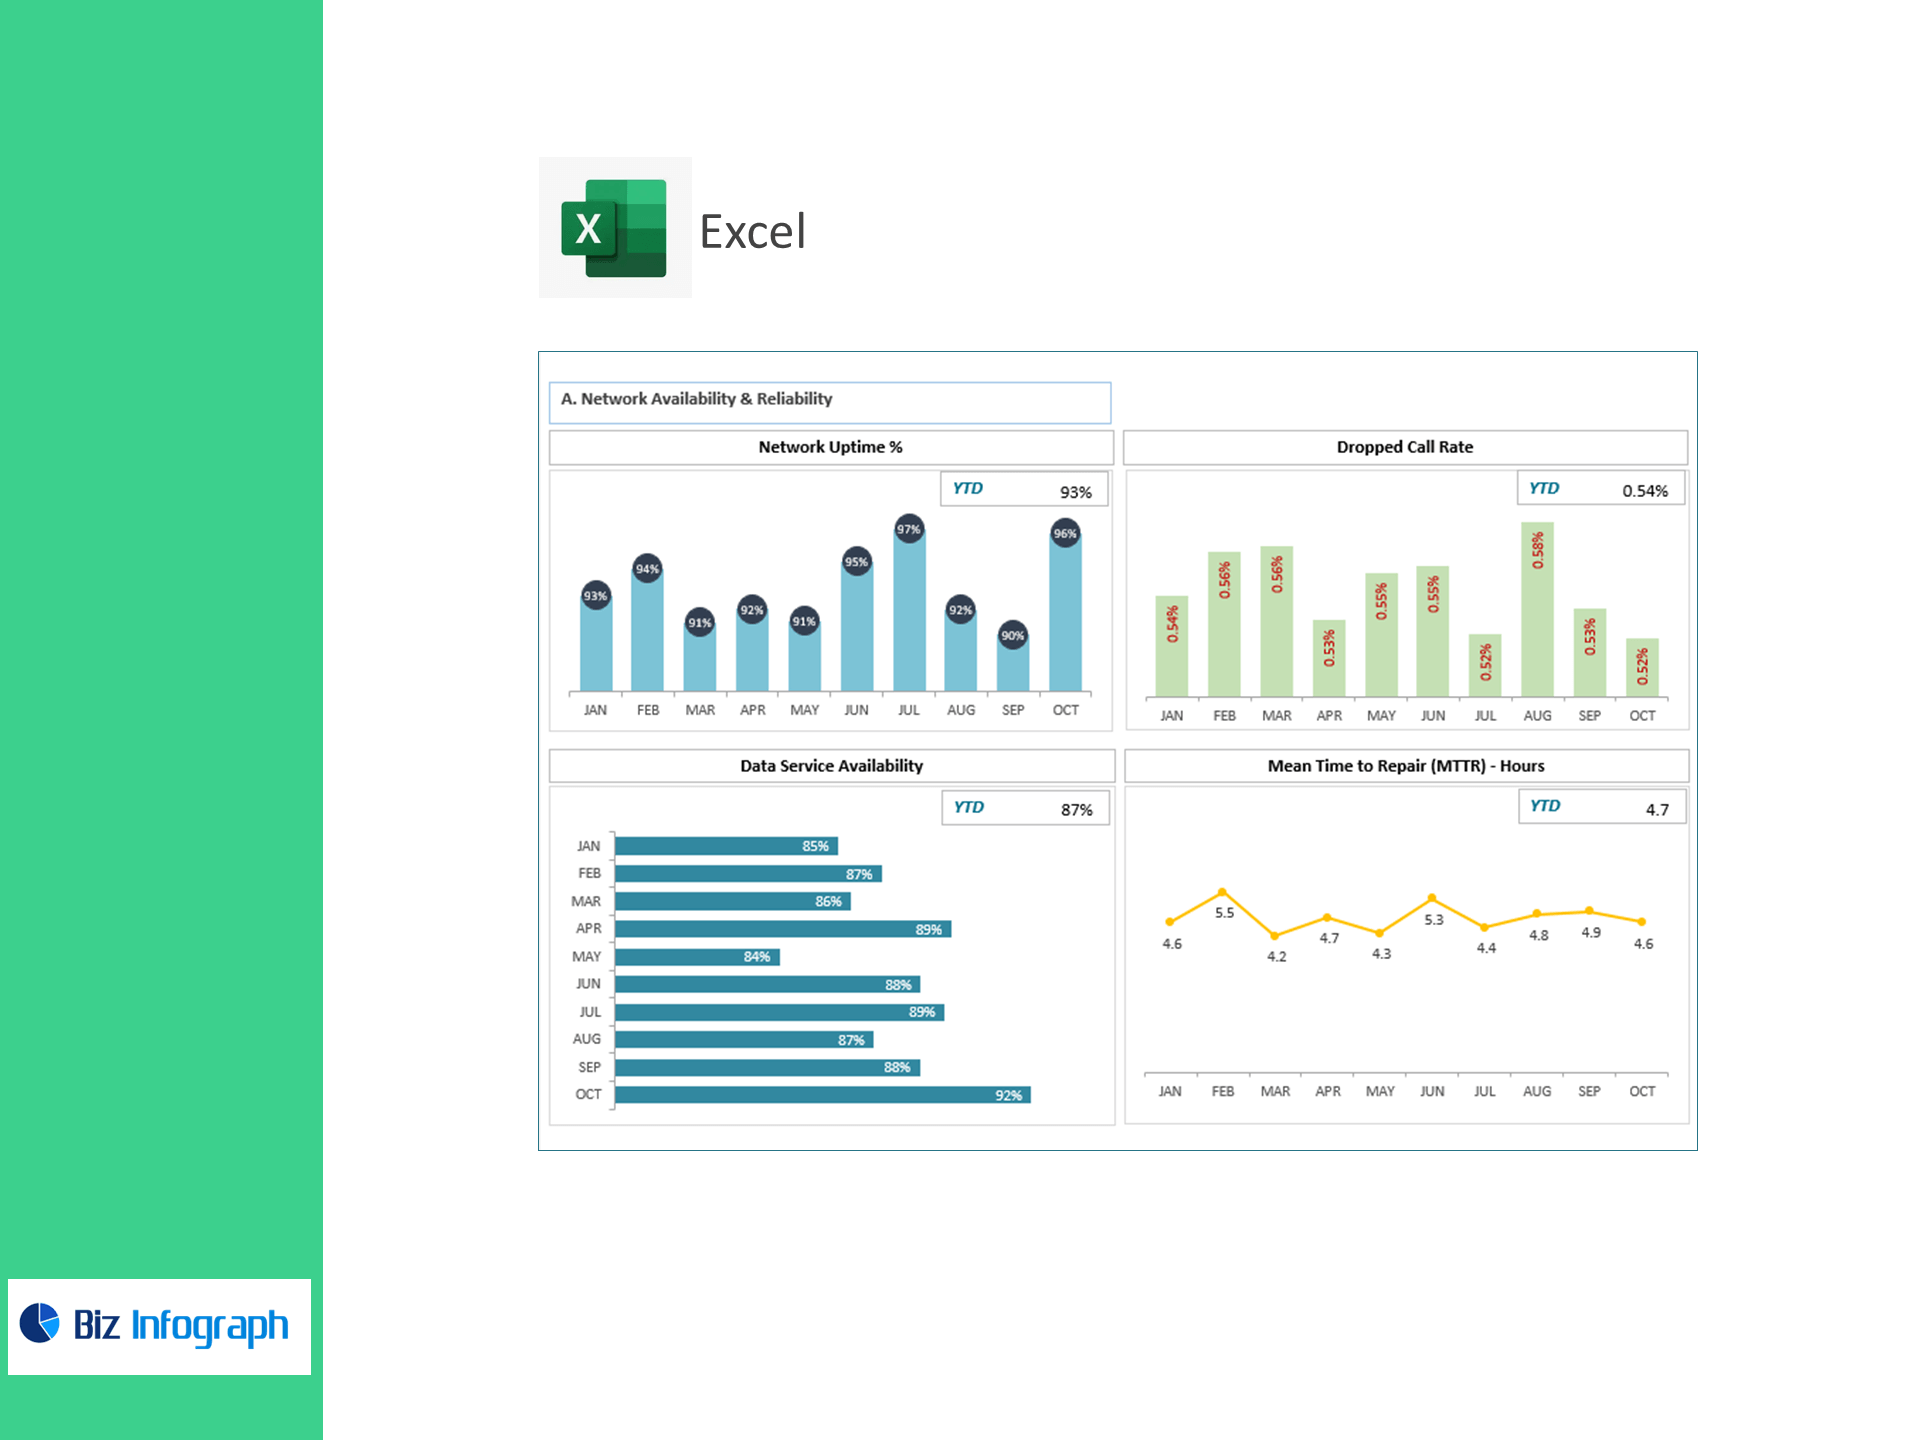
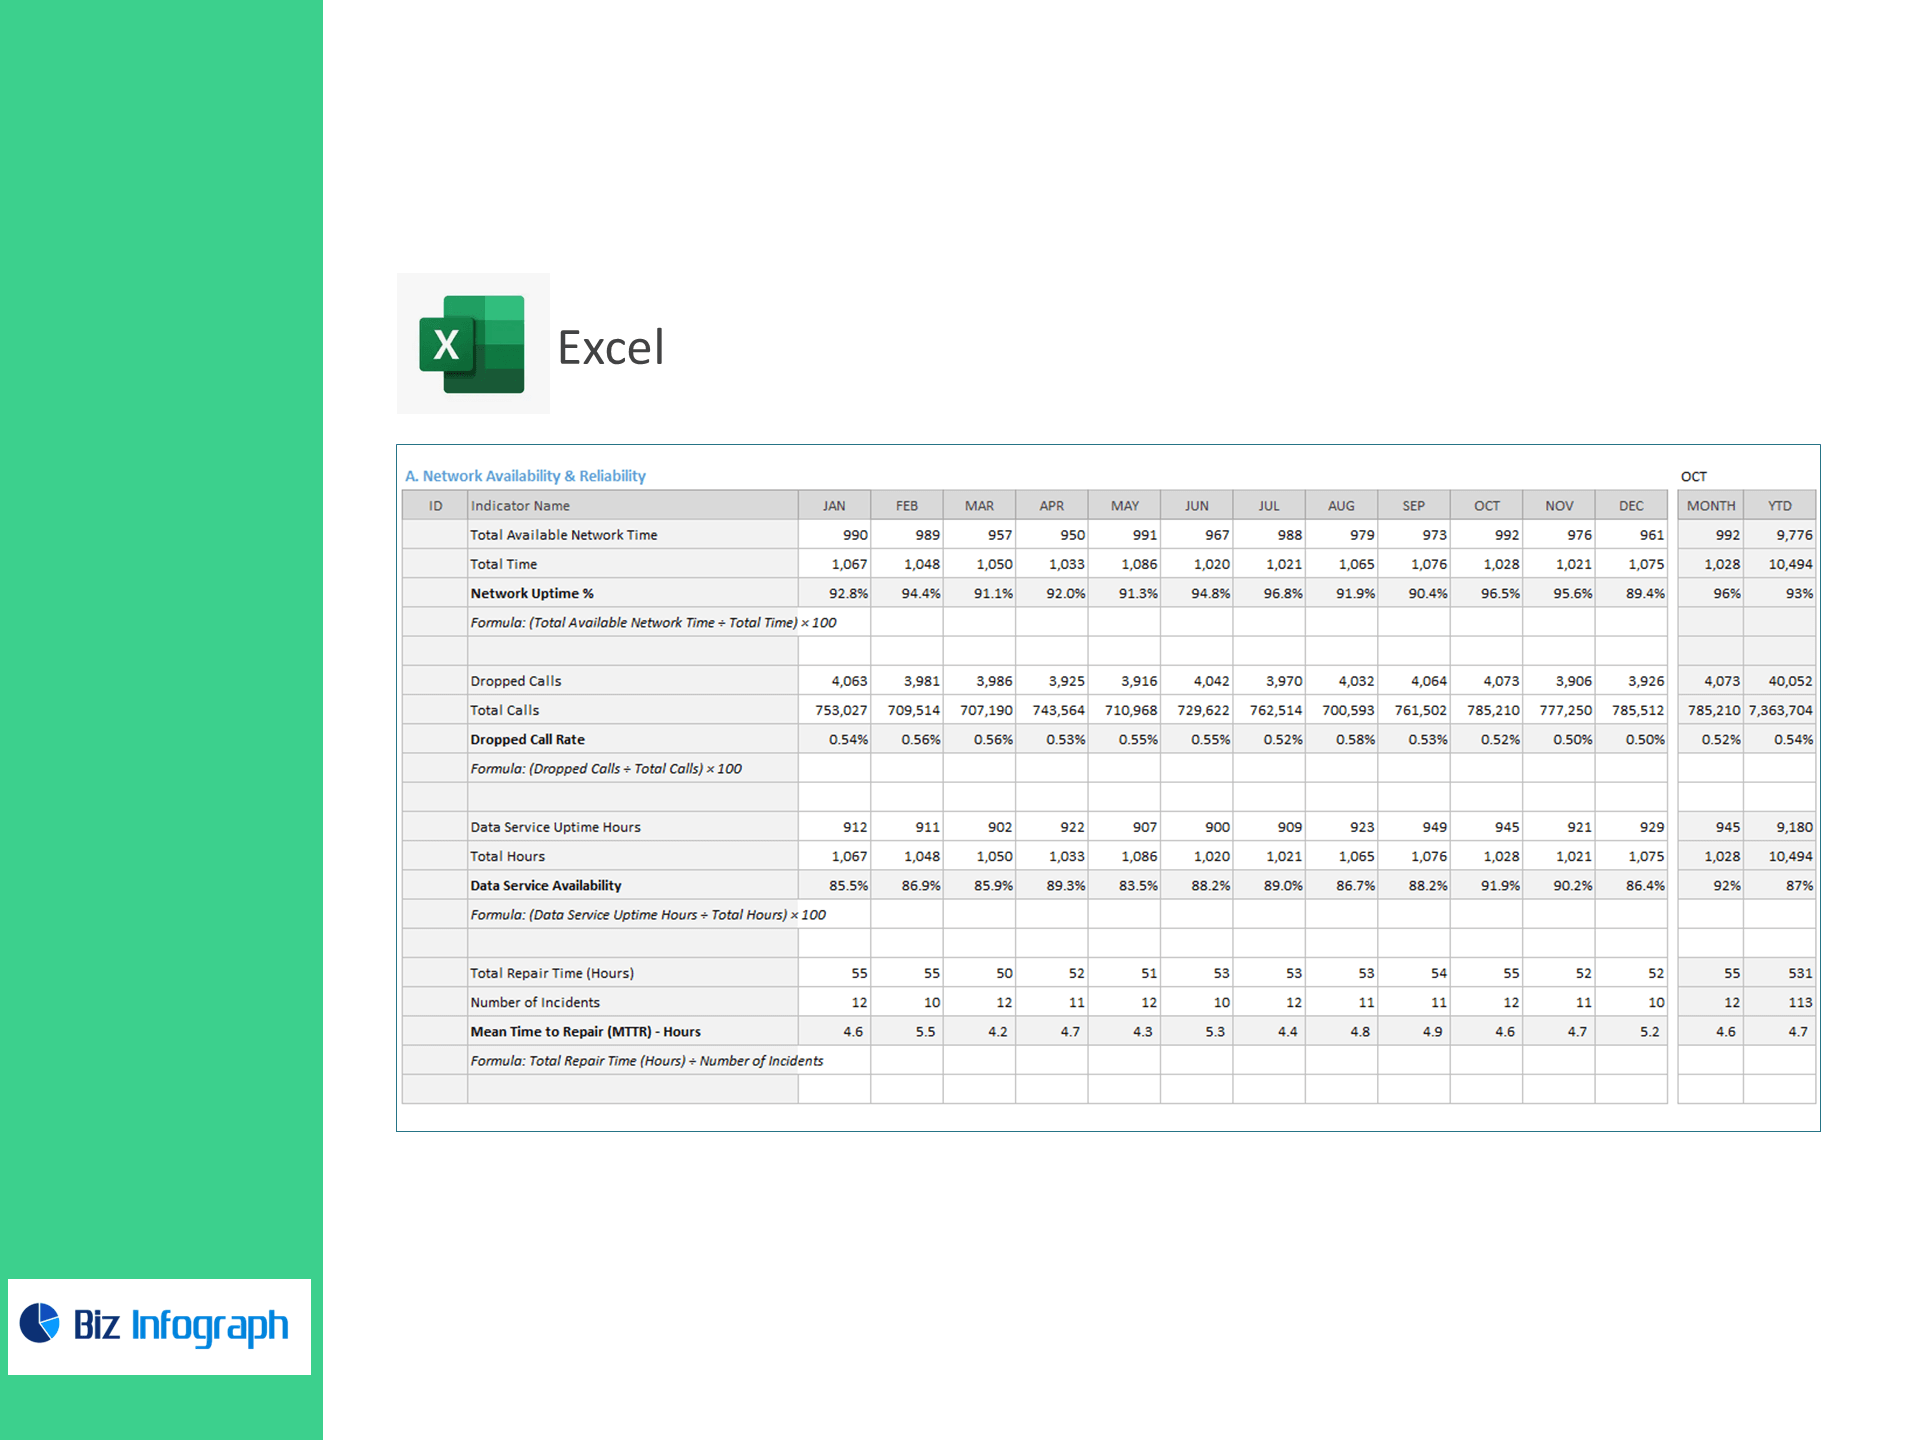
A) Availability & Reliability
-
Fleet Uptime %
(Total Available Fleet Hours ÷ Total Fleet Hours) × 100 -
Failed Delivery Rate (analog to dropped calls)
(Failed/Cancelled Deliveries ÷ Total Deliveries) × 100 -
Warehouse/System Uptime % (WMS, sorters, conveyors)
(Data Service Uptime Hours ÷ Total Hours) × 100 -
Mean Time to Repair (MTTR) – Hours (vehicles/equipment)
Total Repair Time (Hours) ÷ Number of Incidents
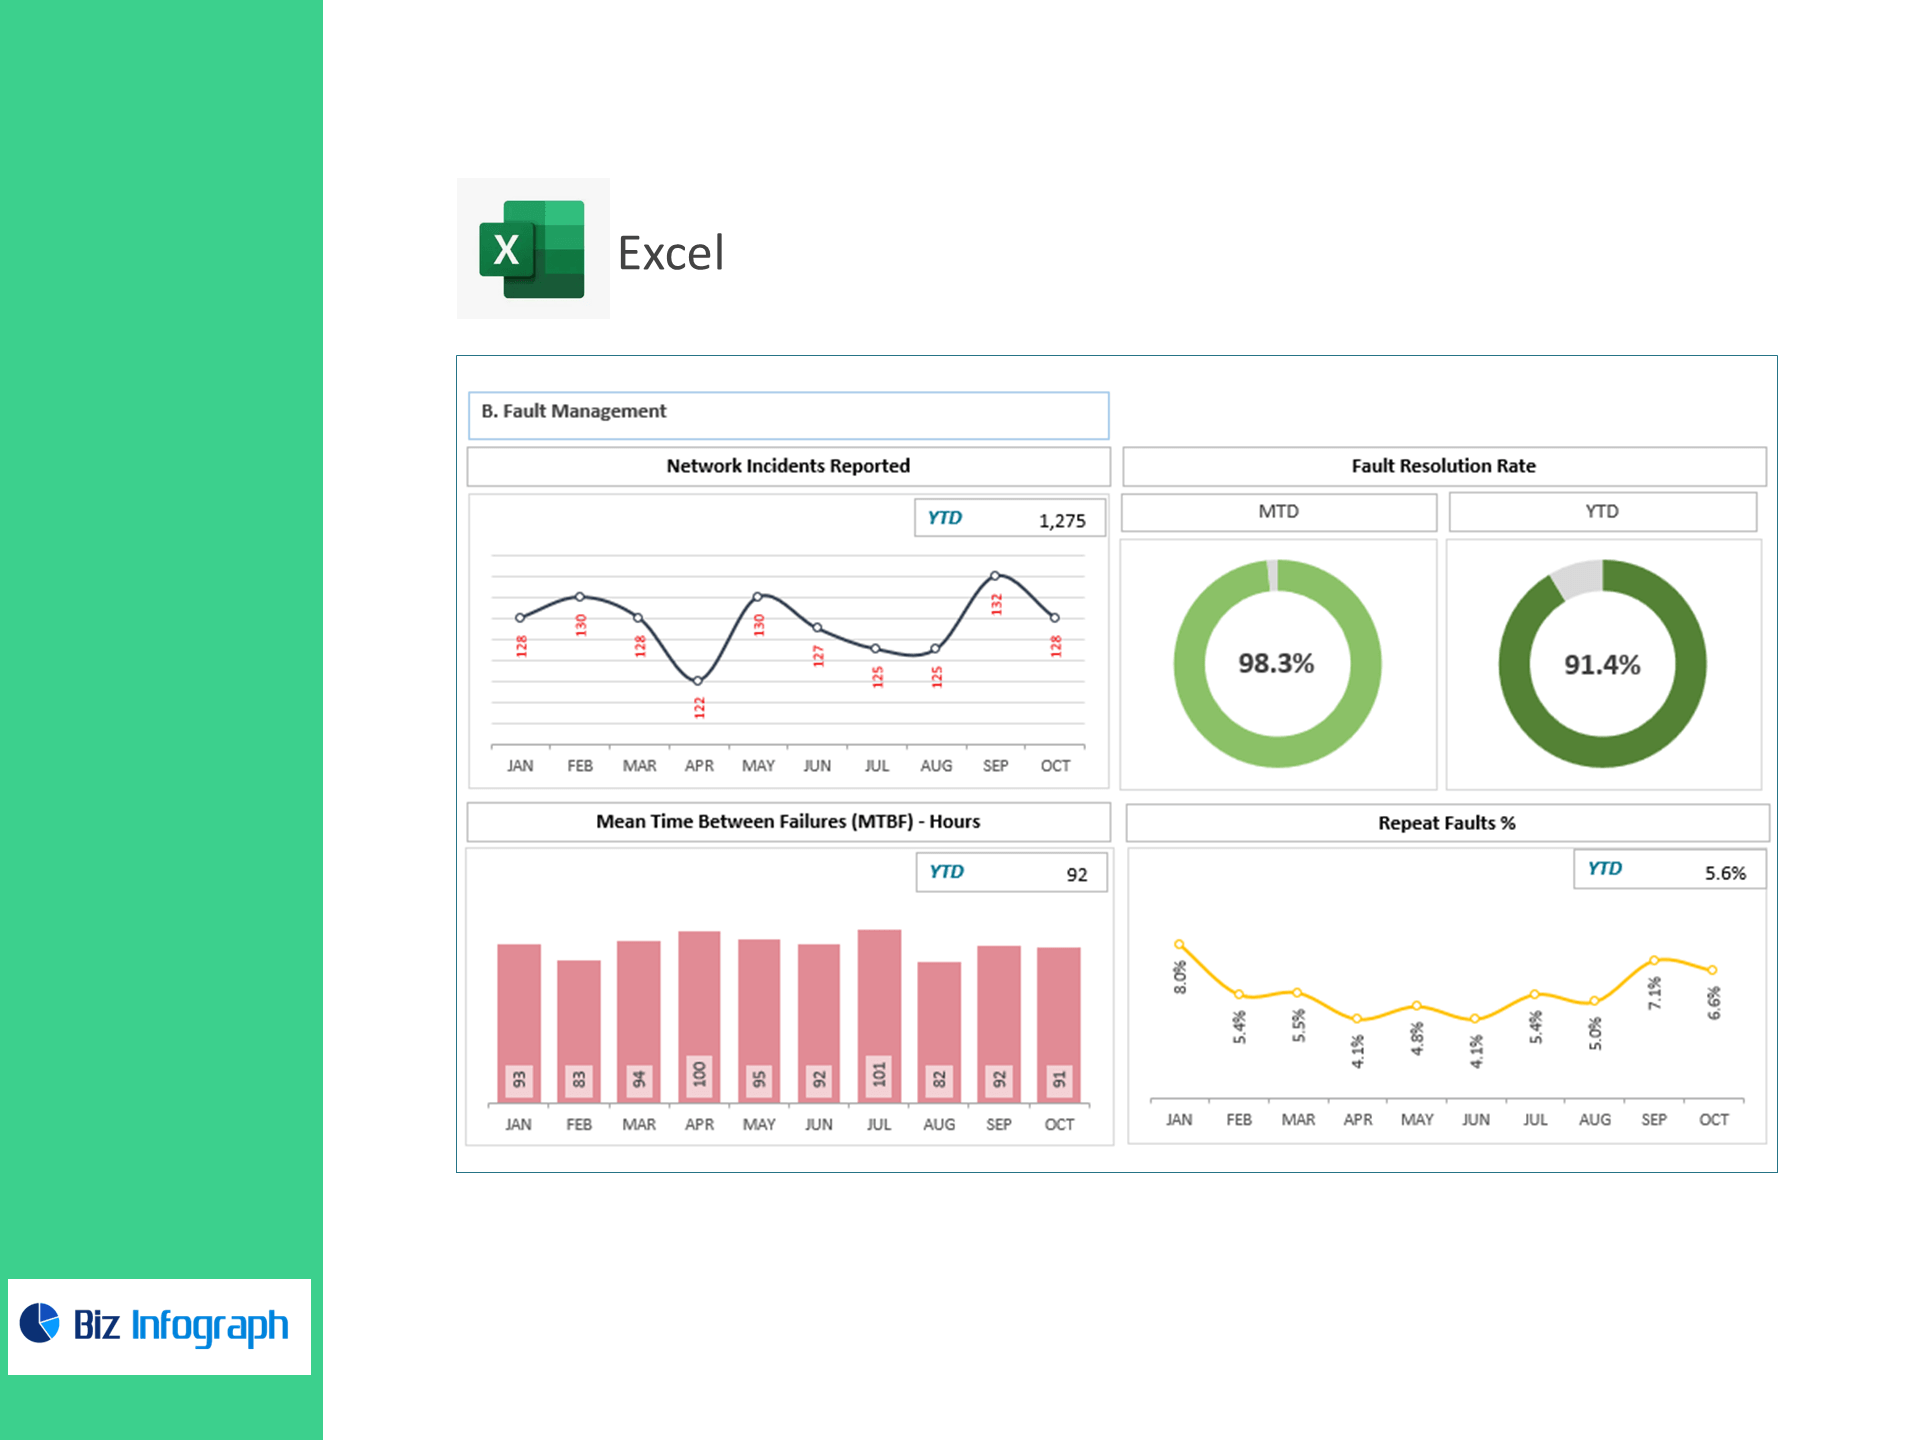
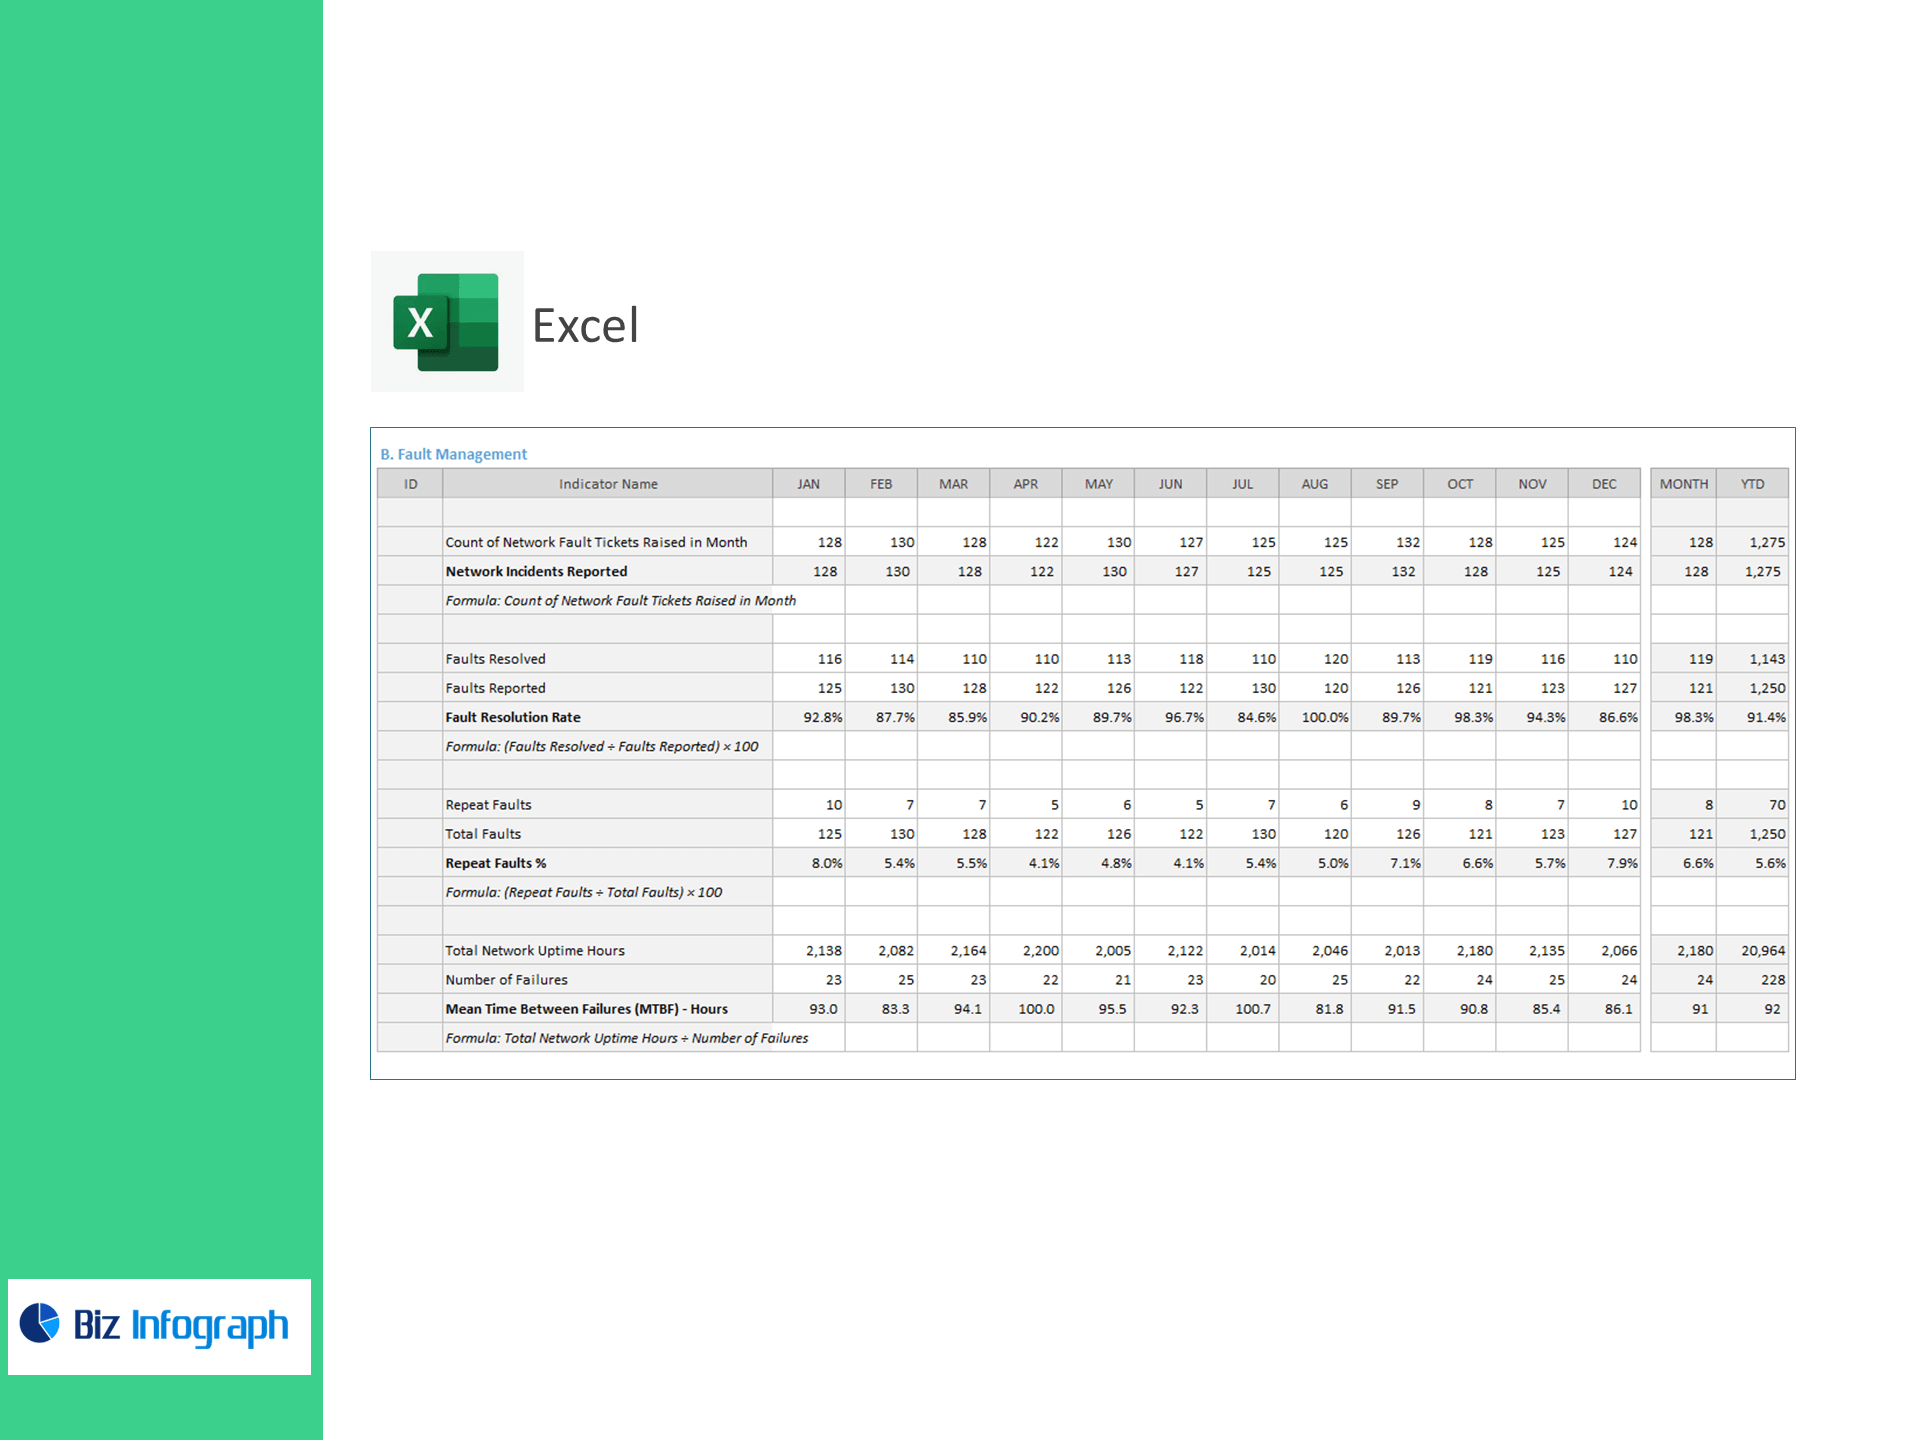
B) Incident & Fault Management
-
Incidents Reported (vehicle breakdowns, WMS faults, dock faults)
Count of Fault Tickets Raised in Month -
Fault/Incident Resolution Rate %
(Incidents Resolved ÷ Incidents Reported) × 100 -
Repeat Incidents %
(Repeat Incidents ÷ Total Incidents) × 100 -
Mean Time Between Failures (MTBF) – Hours (or use MDBF – distance)
Total Operating/Uptime Hours ÷ Number of Failures
Alt (MDBF):Total Distance Driven ÷ Number of Failures
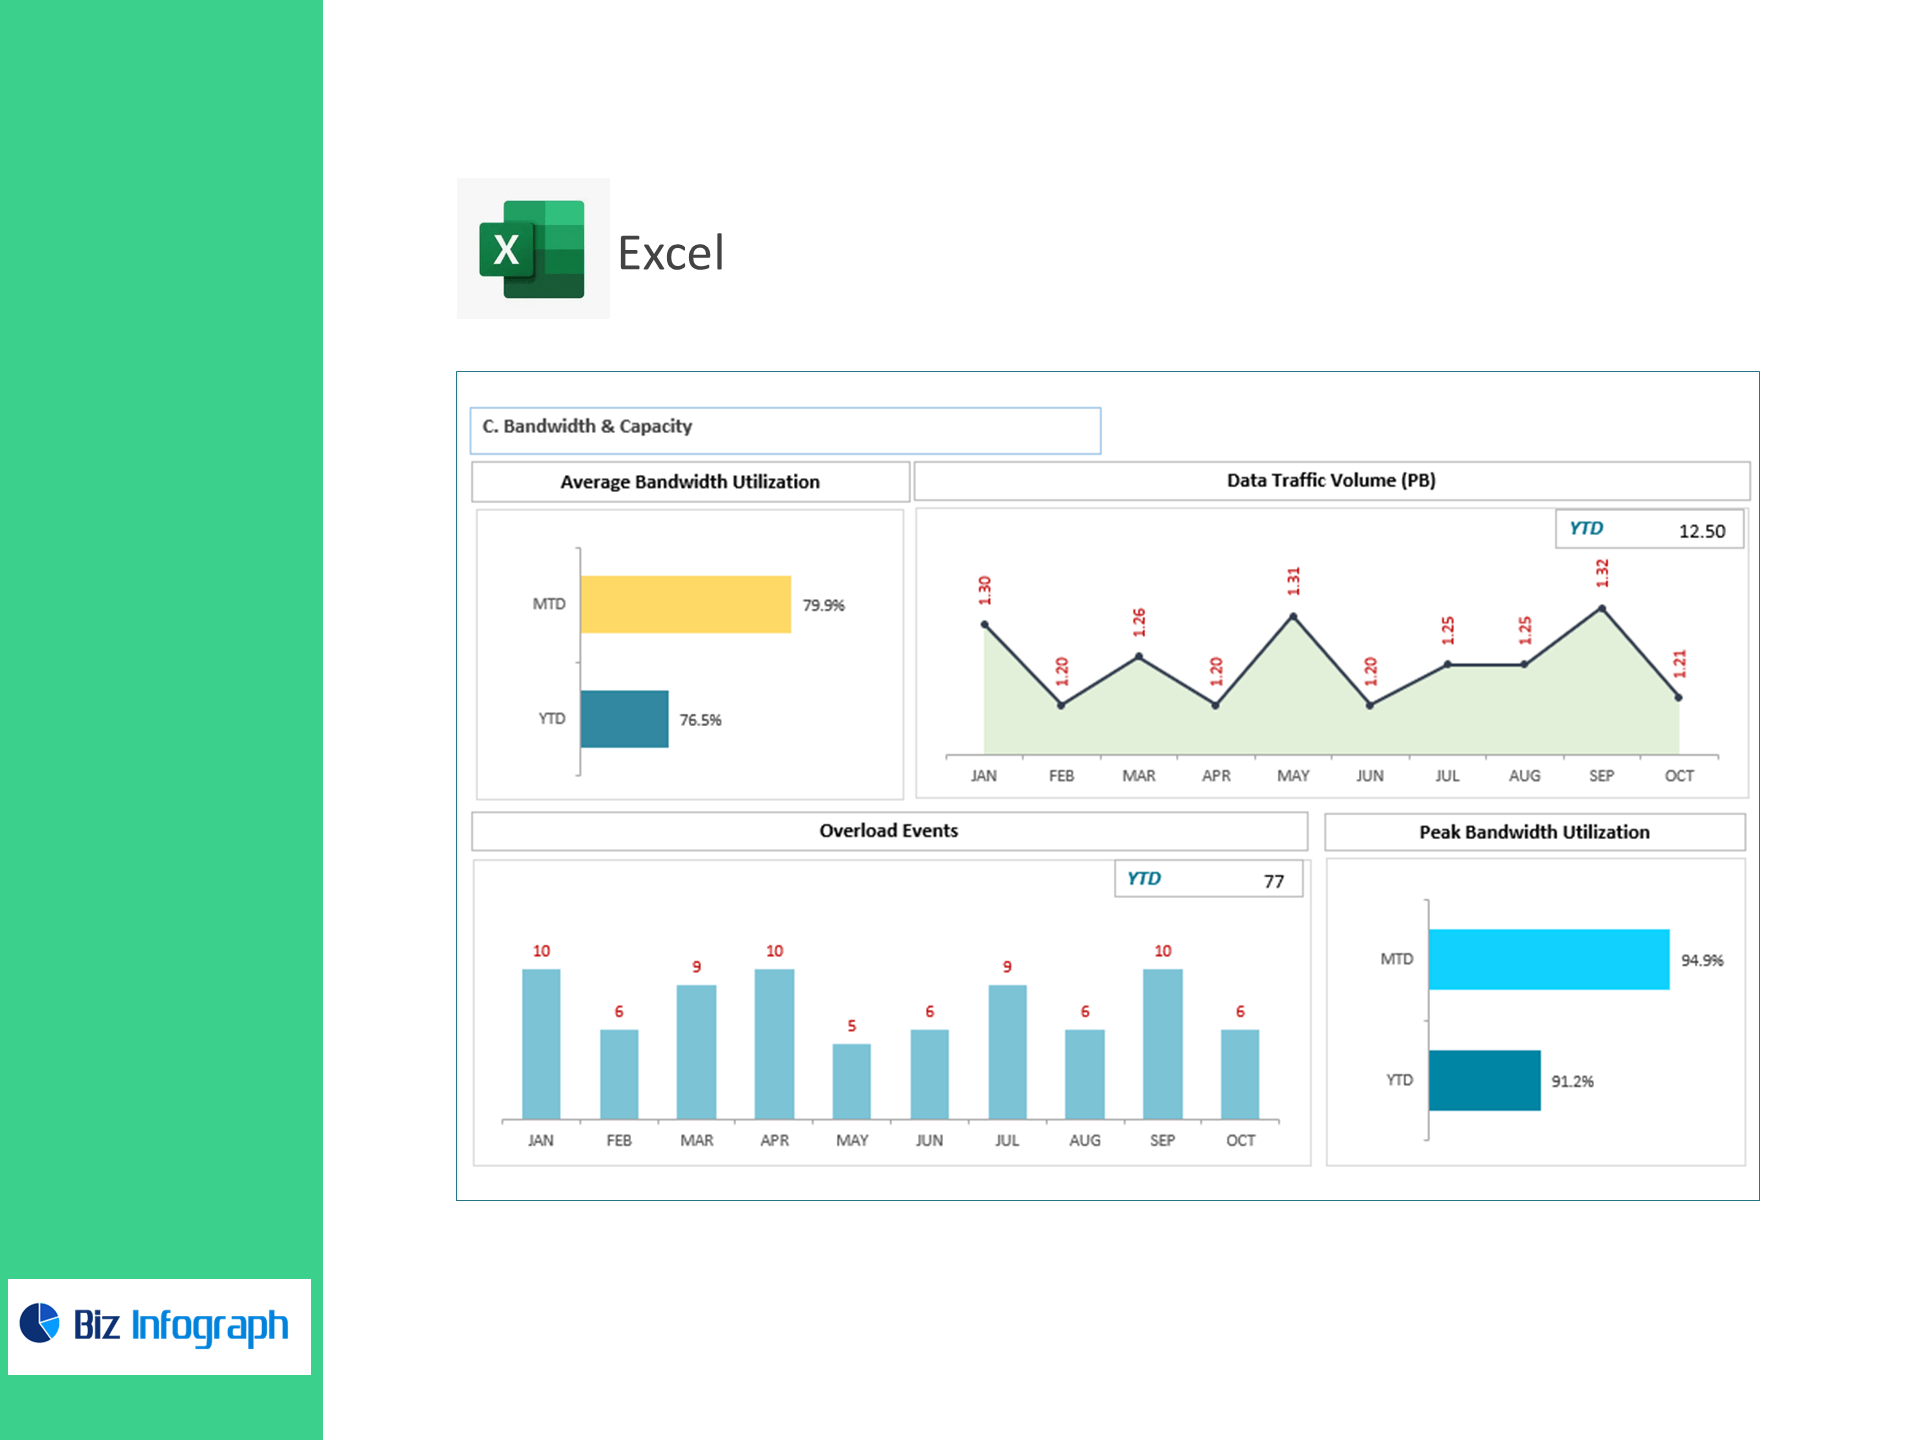
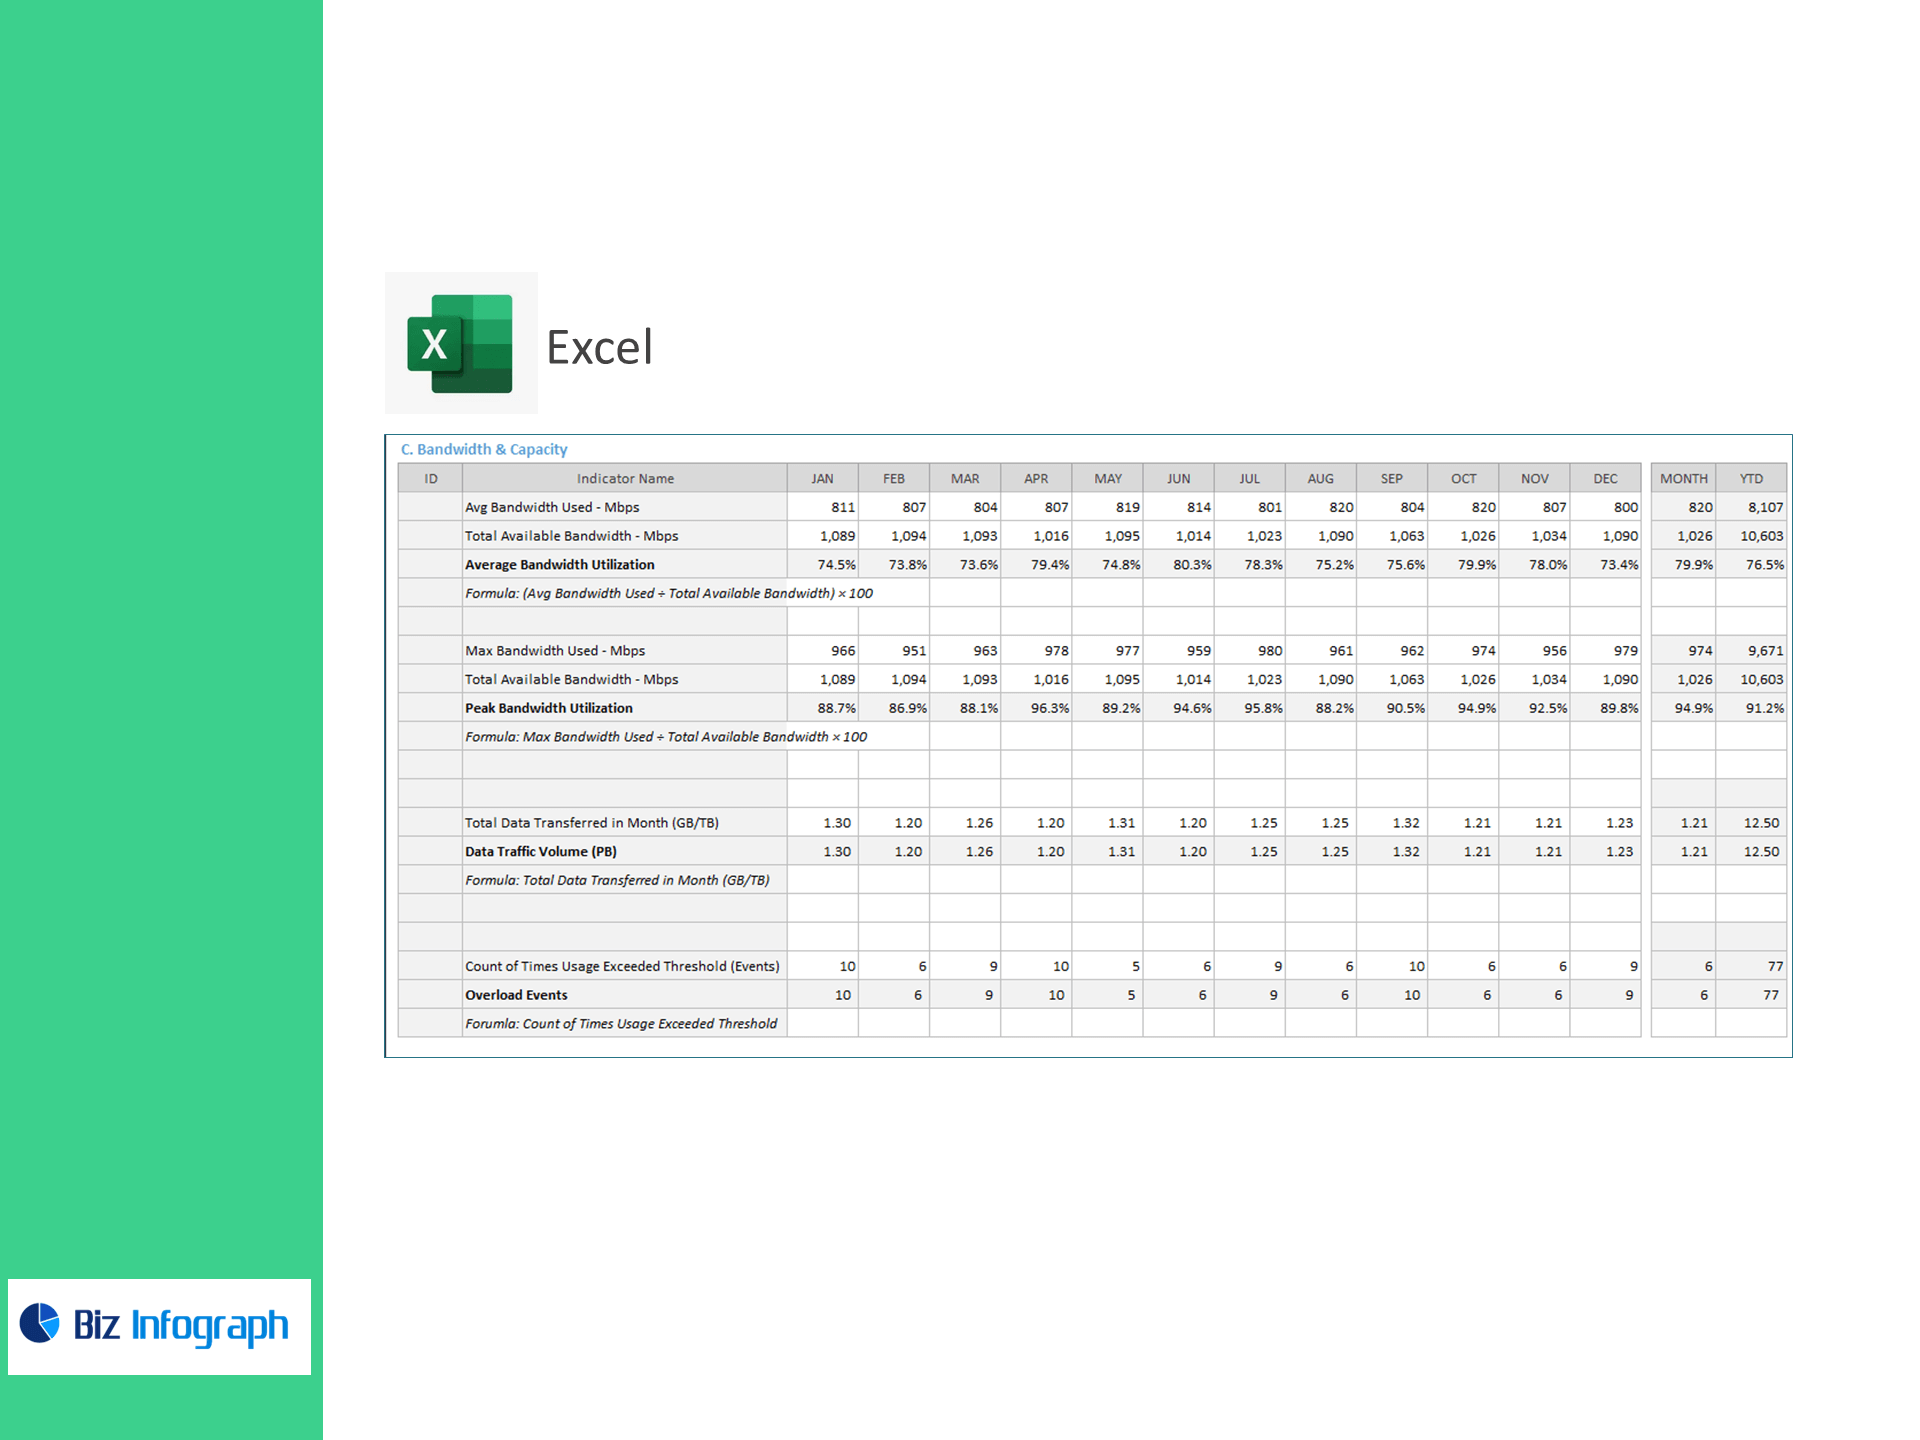
C) Capacity & Throughput
-
Average Capacity Utilization % (trailers, pallets, cubic meters, dock slots)
(Average Utilized Capacity ÷ Total Available Capacity) × 100 -
Peak Capacity Utilization %
(Max Utilized Capacity ÷ Total Available Capacity) × 100 -
Freight Volume (tons/CBM/pallets/parcels)
Total Volume Transferred in Month -
Overload Events (times thresholds were exceeded)
Count of Times Usage Exceeded Threshold
What’s inside
-
Executive Dashboard: one page for uptime, incidents, MTTR/MTBF, utilization, and volume—plus trend lines, goal tracking, and exception flags.
-
Data Sheets: Fleet Hours, Deliveries, Warehouse/IT Uptime, Fault Tickets, Repairs, Capacity (avg/max/thresholds), and Throughput.
-
KPI Engine: prebuilt calculations & error checks with clear definitions.
-
Settings & Targets: set unit types (tons, pallets, parcels), business calendar, and thresholds per site/lane.
-
Print-ready views: export to PDF for ops reviews and customer QBRs.
For ready-to-use Dashboard Templates: