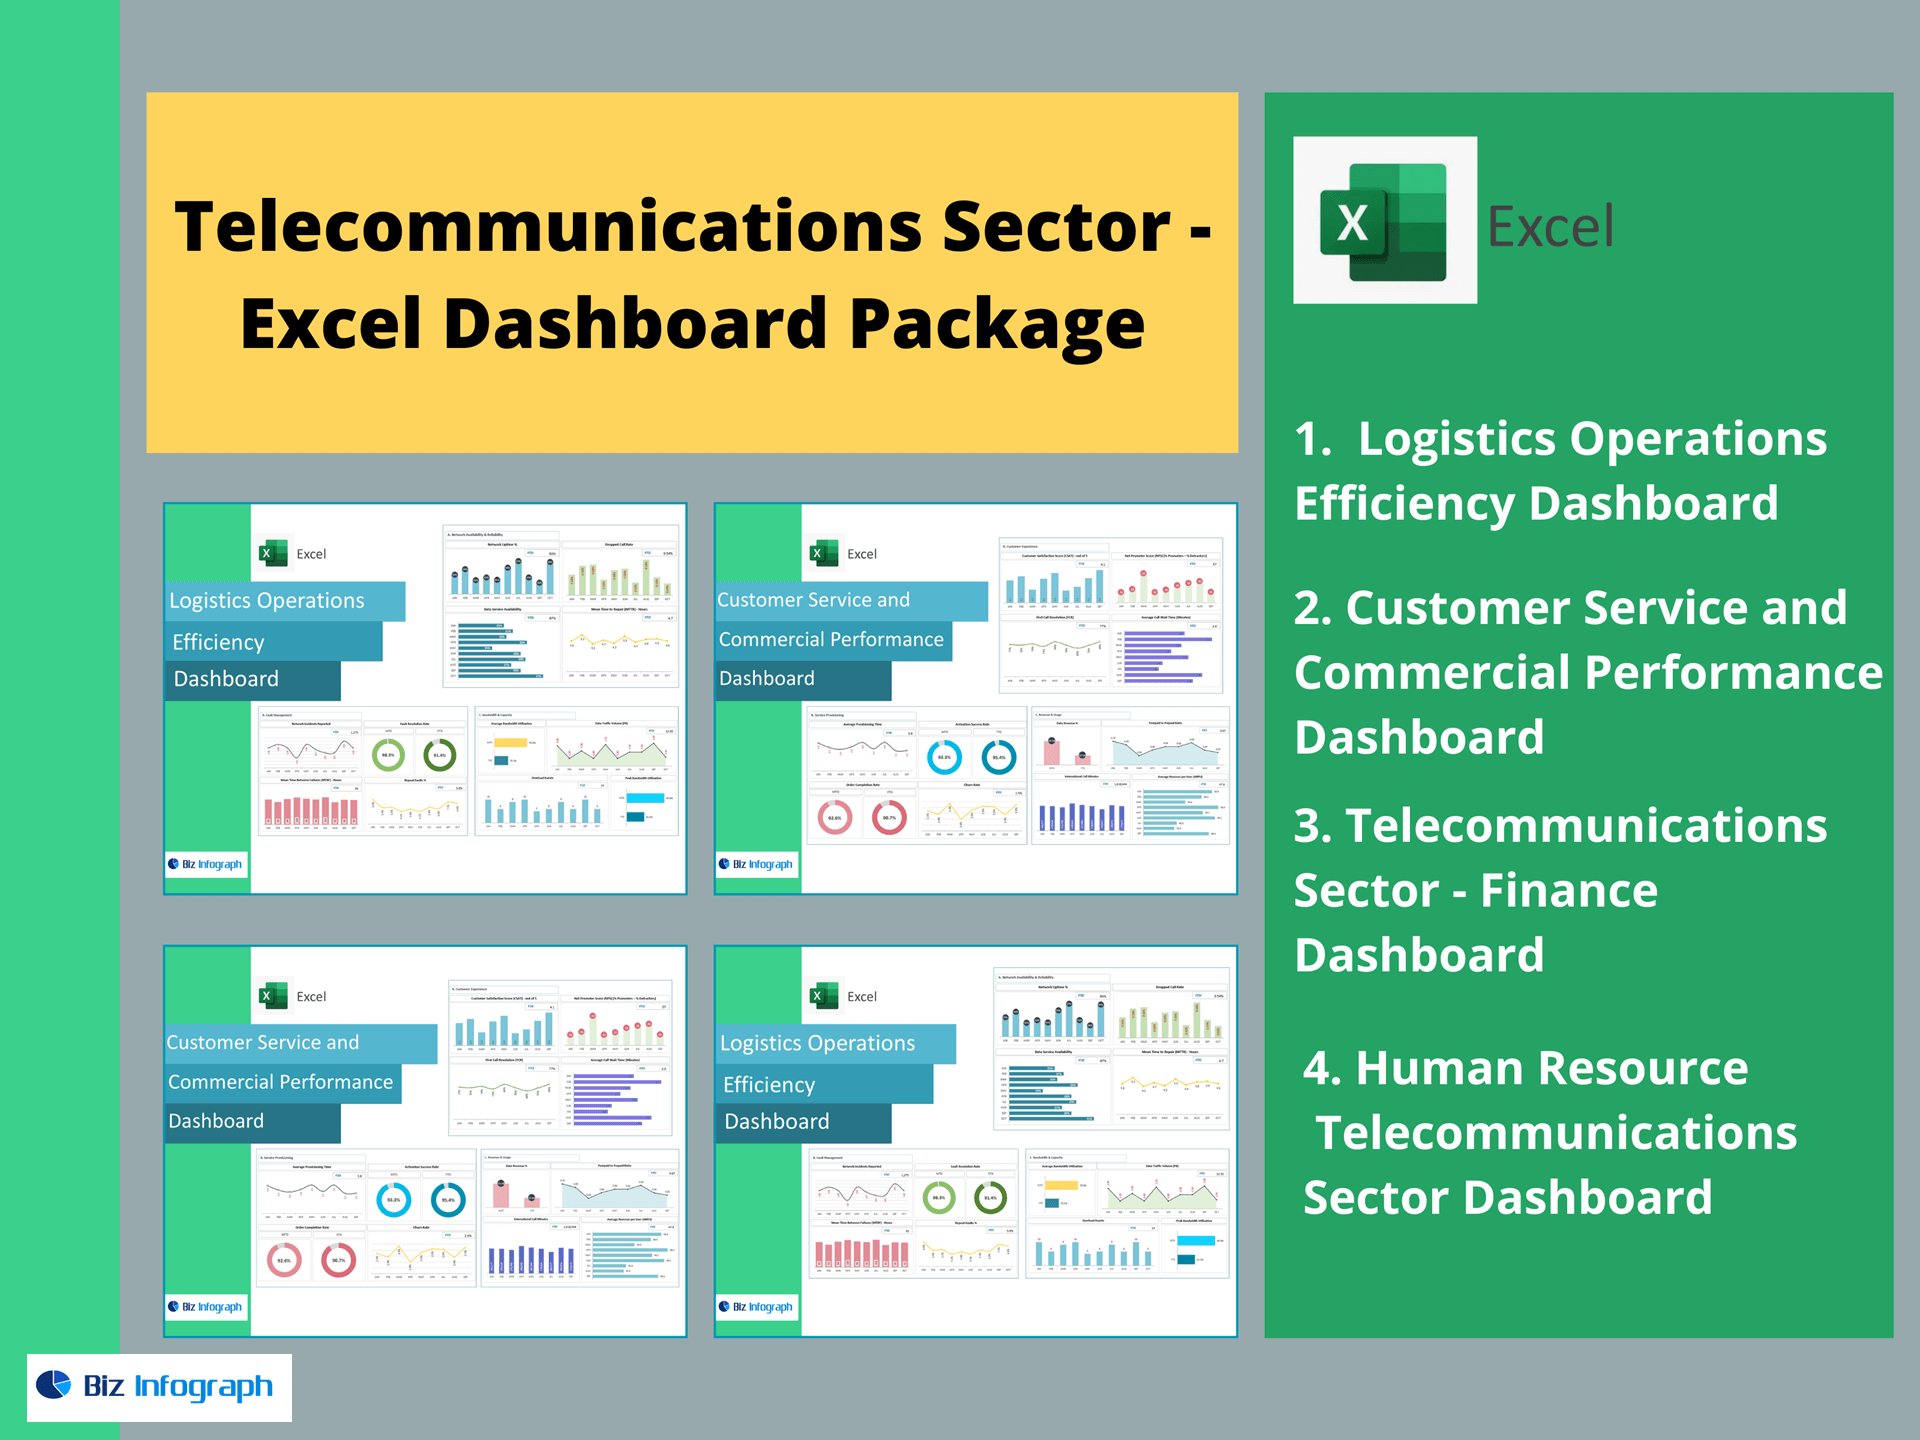
Telecommunications Sector Financial Dashboard — Excel Template
A plug-and-play finance dashboard for telecoms that unifies P&L, cash flow, balance-sheet health, and subscriber economics (ARPU, churn, network OPEX) in one Excel workbook. Built for CFOs, FP&A, and finance leaders at mobile, fiber, cable, and ISP operators.
Why this template
-
Telco-specific metrics: ARPU, churn, network OPEX %, and subscriber base alongside core financials.
-
No macros or add-ins (Excel 2016+ Win/Mac). Paste your data, refresh, and review.
-
Executive-ready visuals: trendlines (MoM/YoY), variance-to-budget, and RAG thresholds.
KPIs included (with formulas)
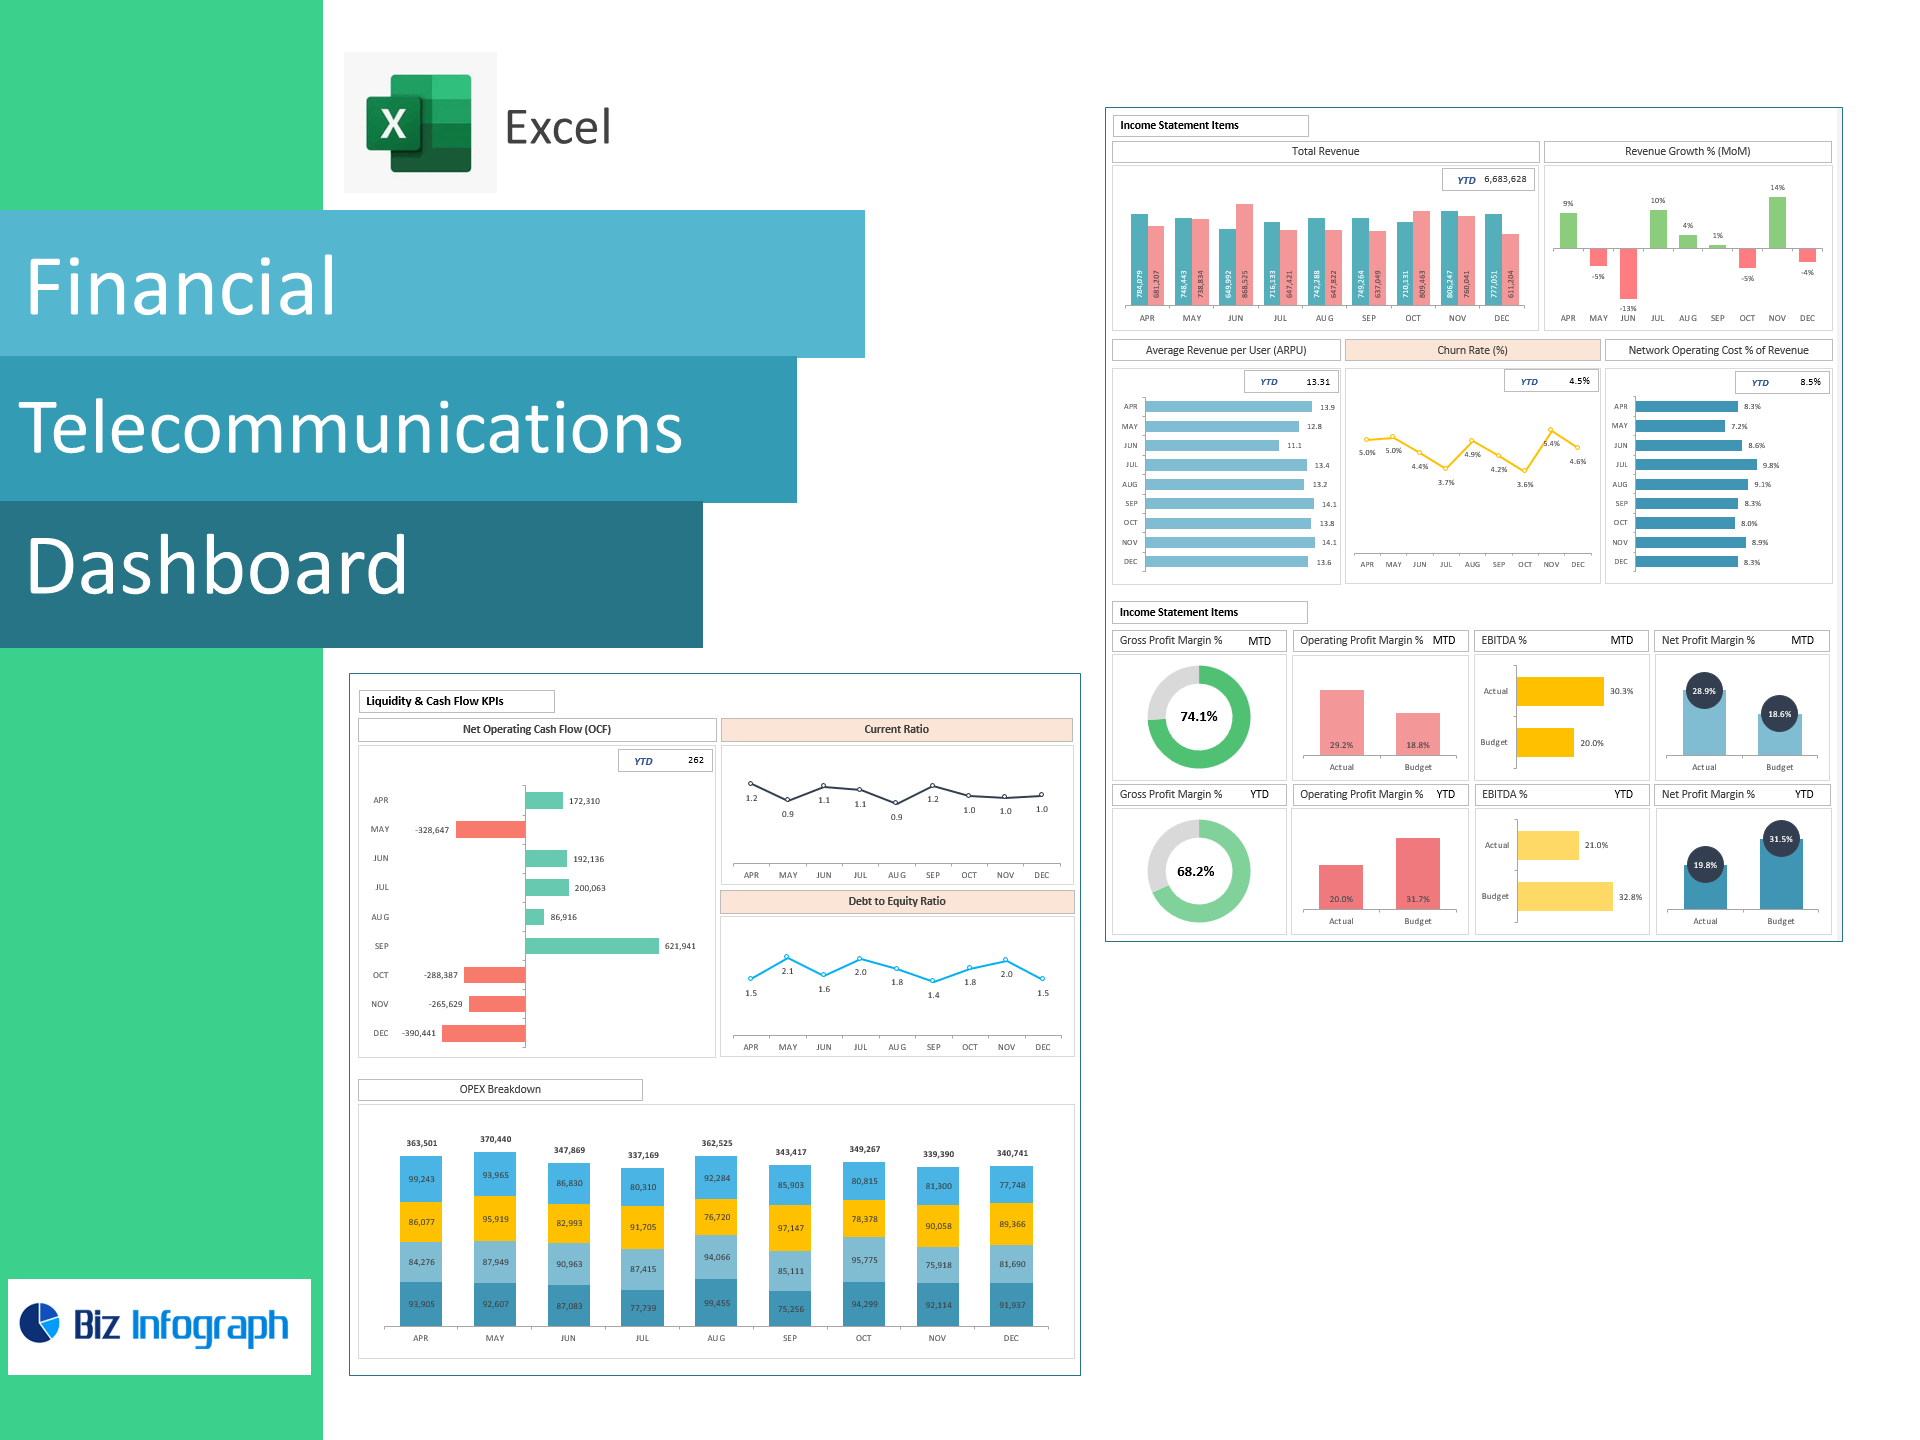
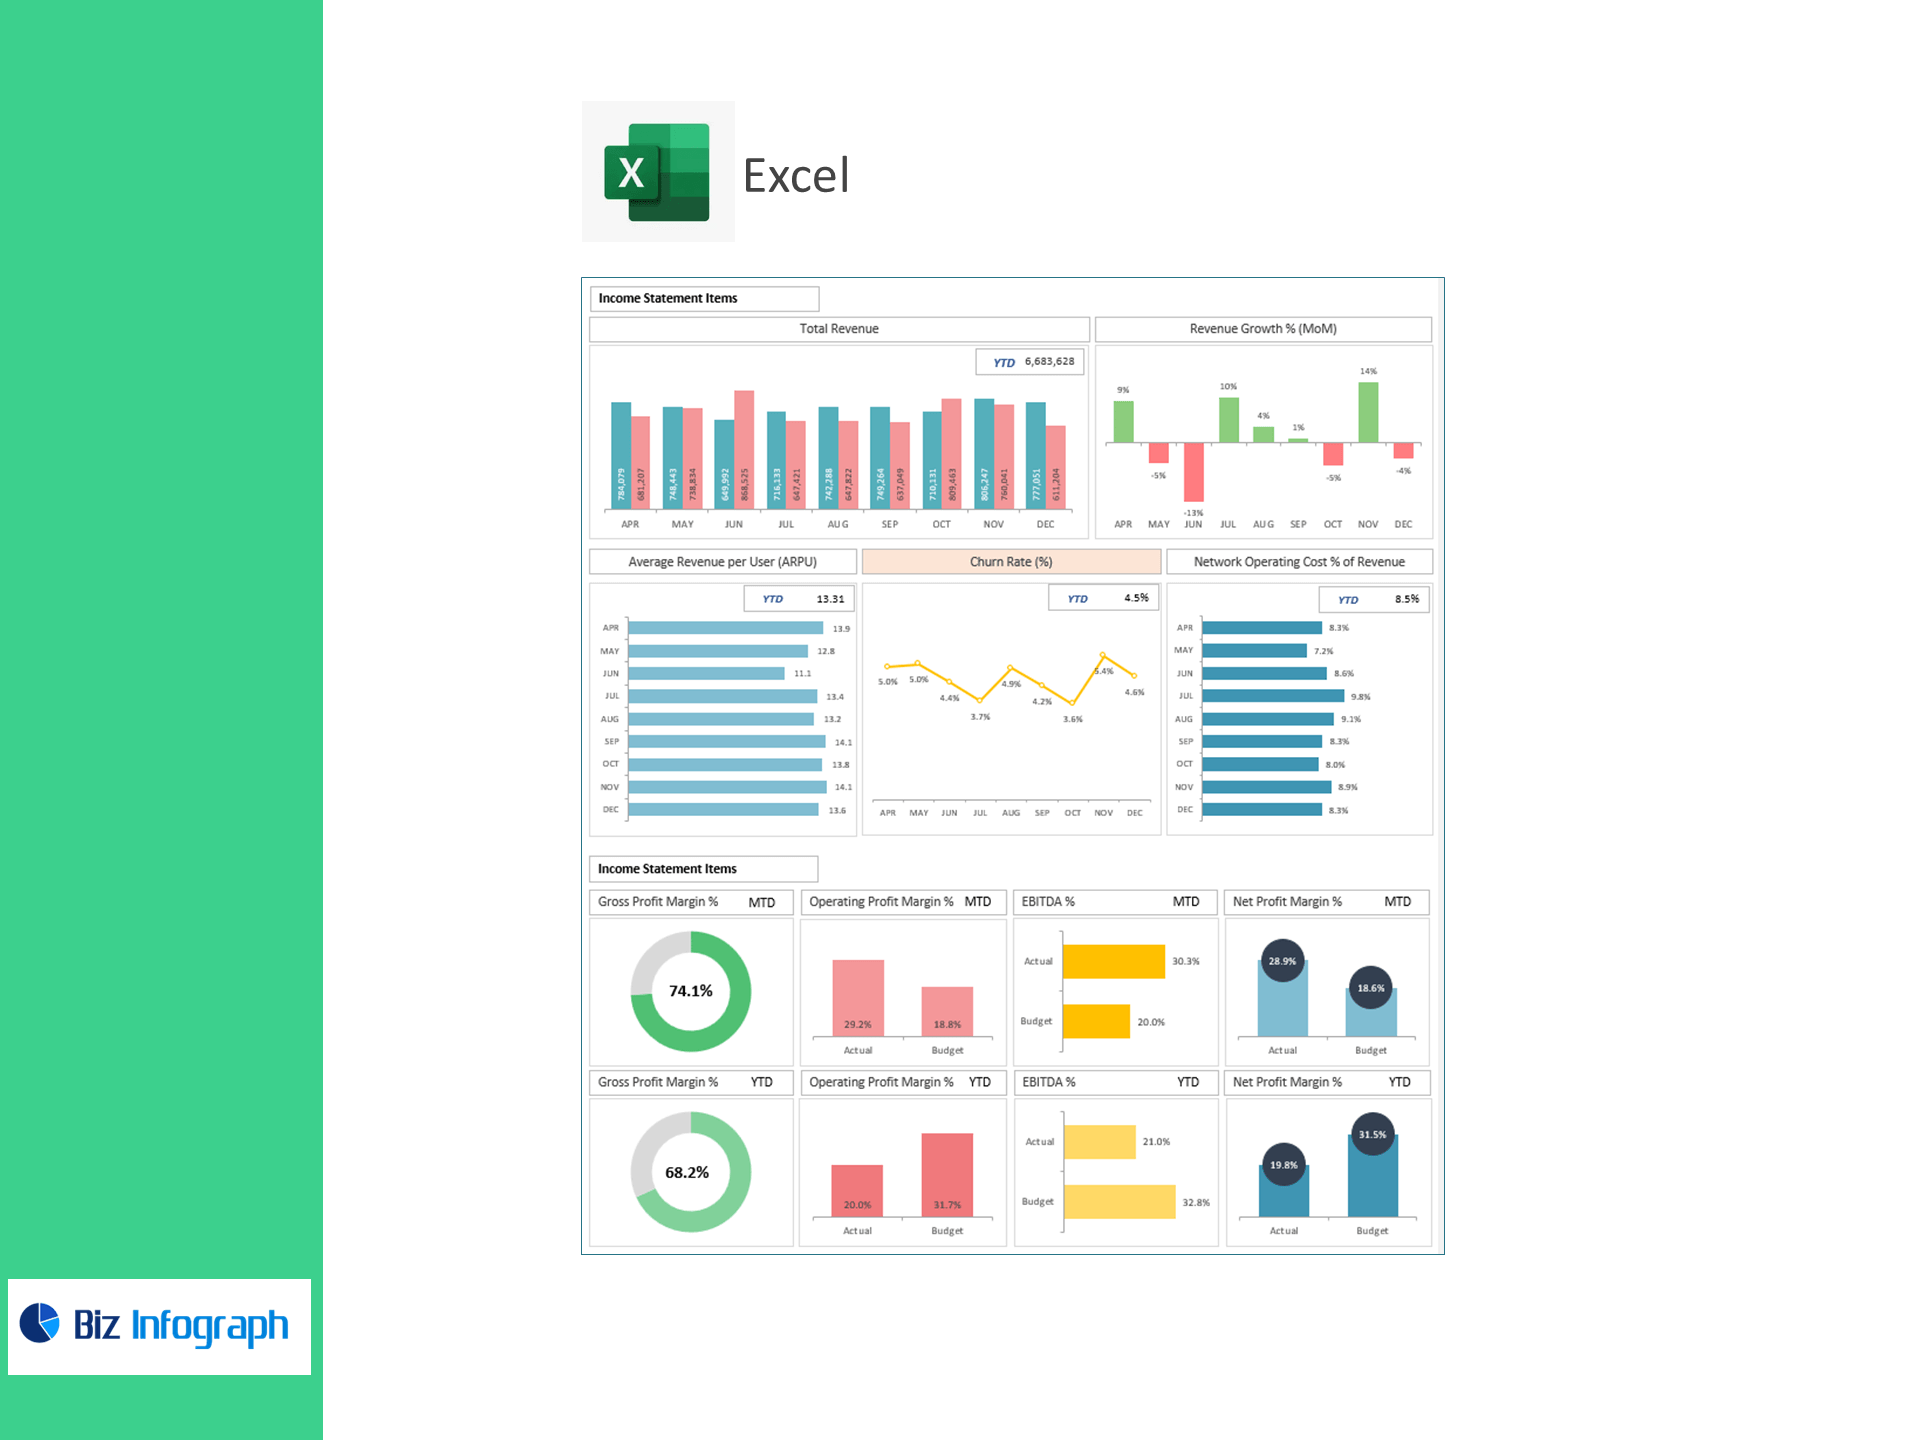
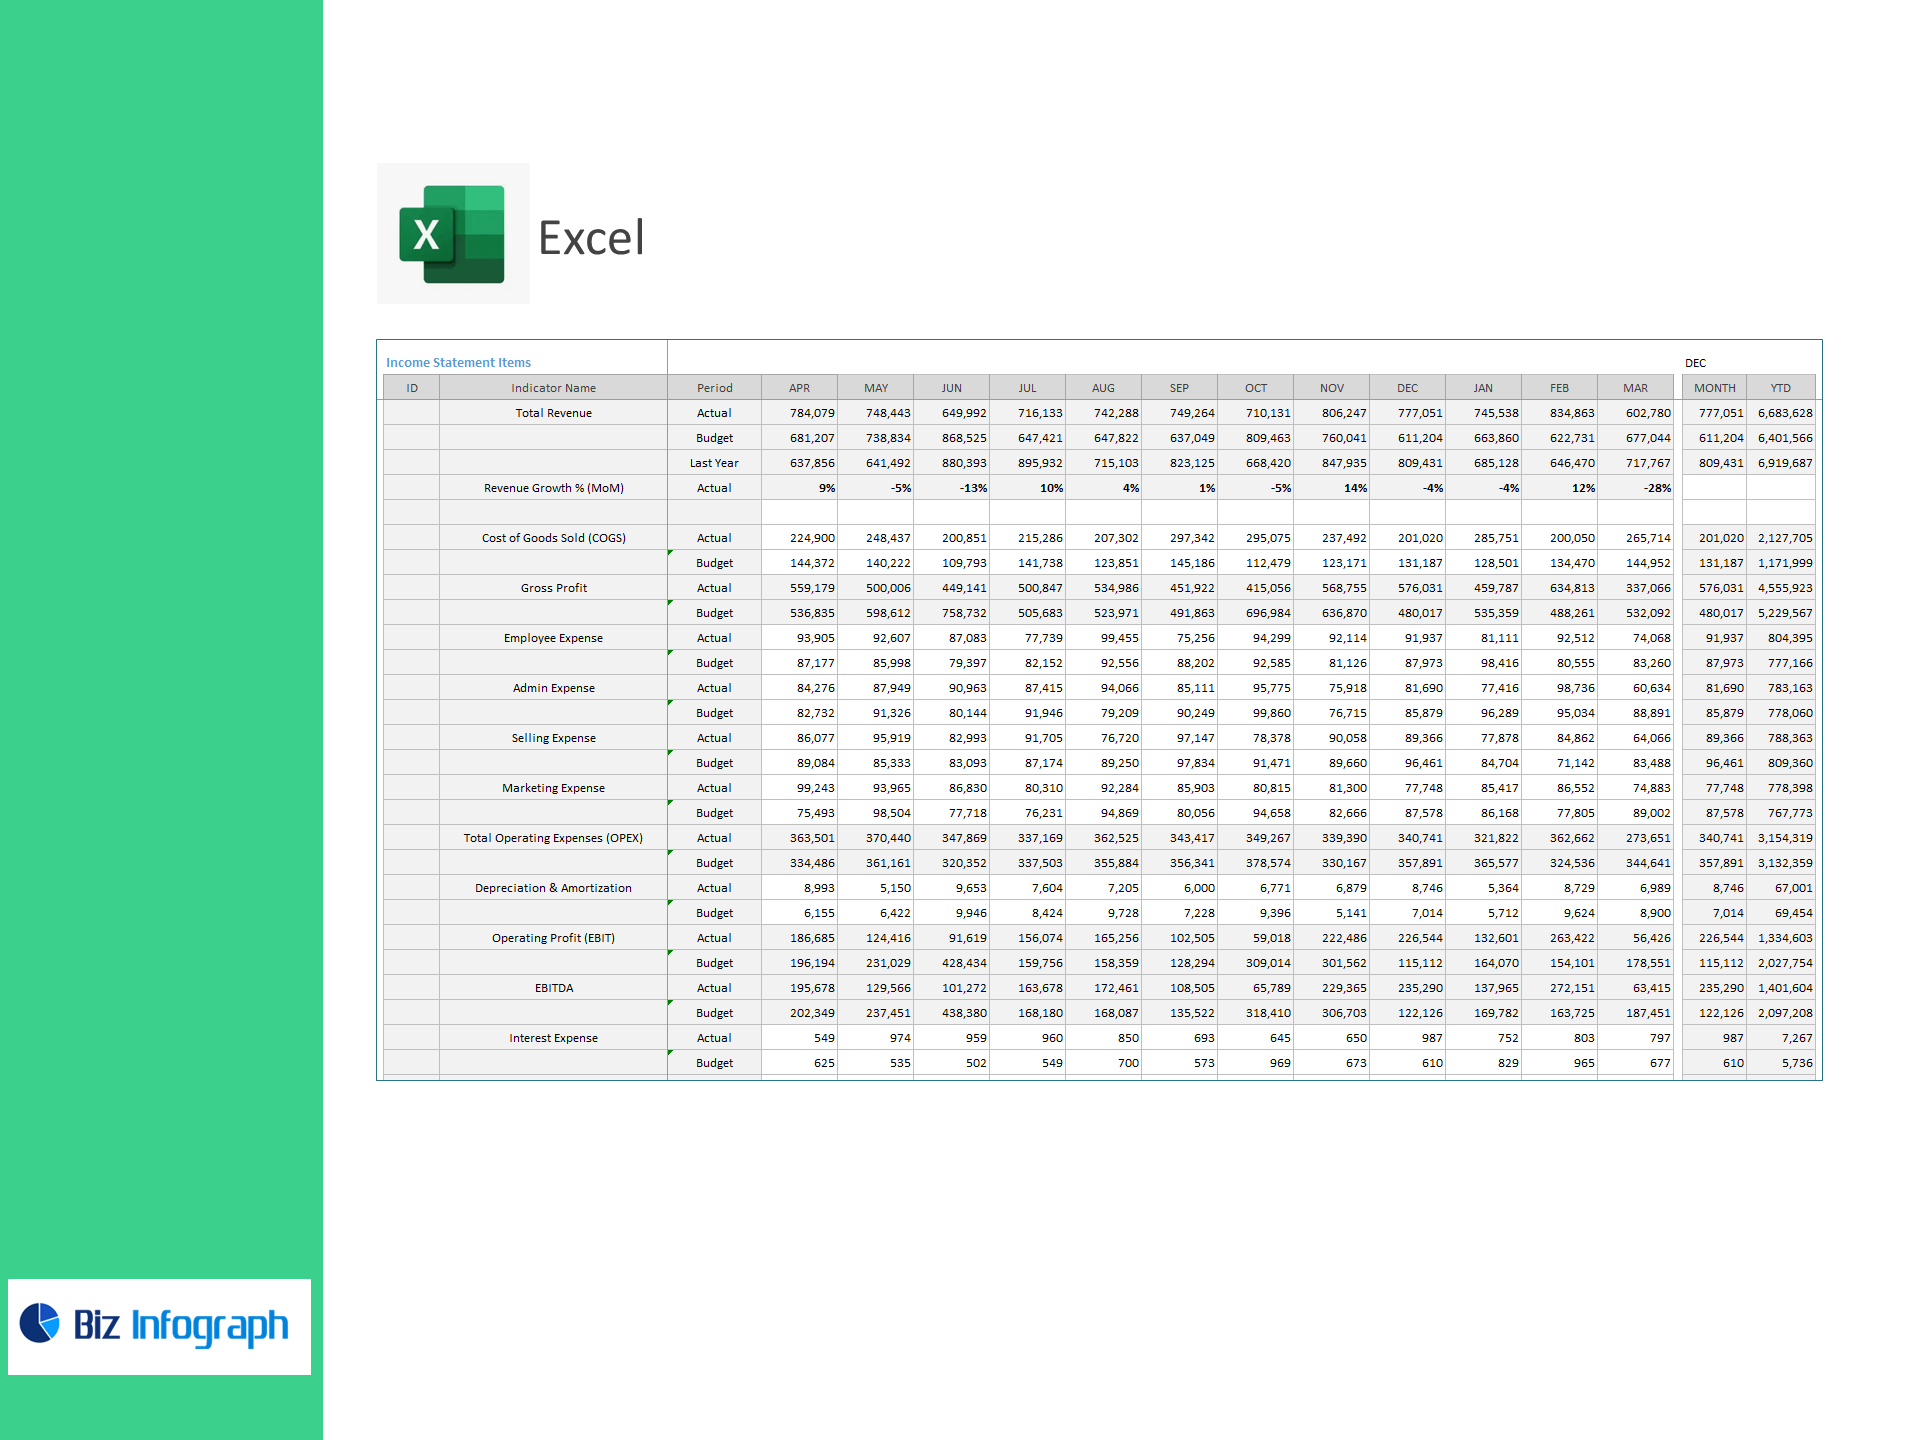
Income Statement Items
-
Total Revenue | Revenue Growth % (MoM)
-
COGS → Gross Profit
-
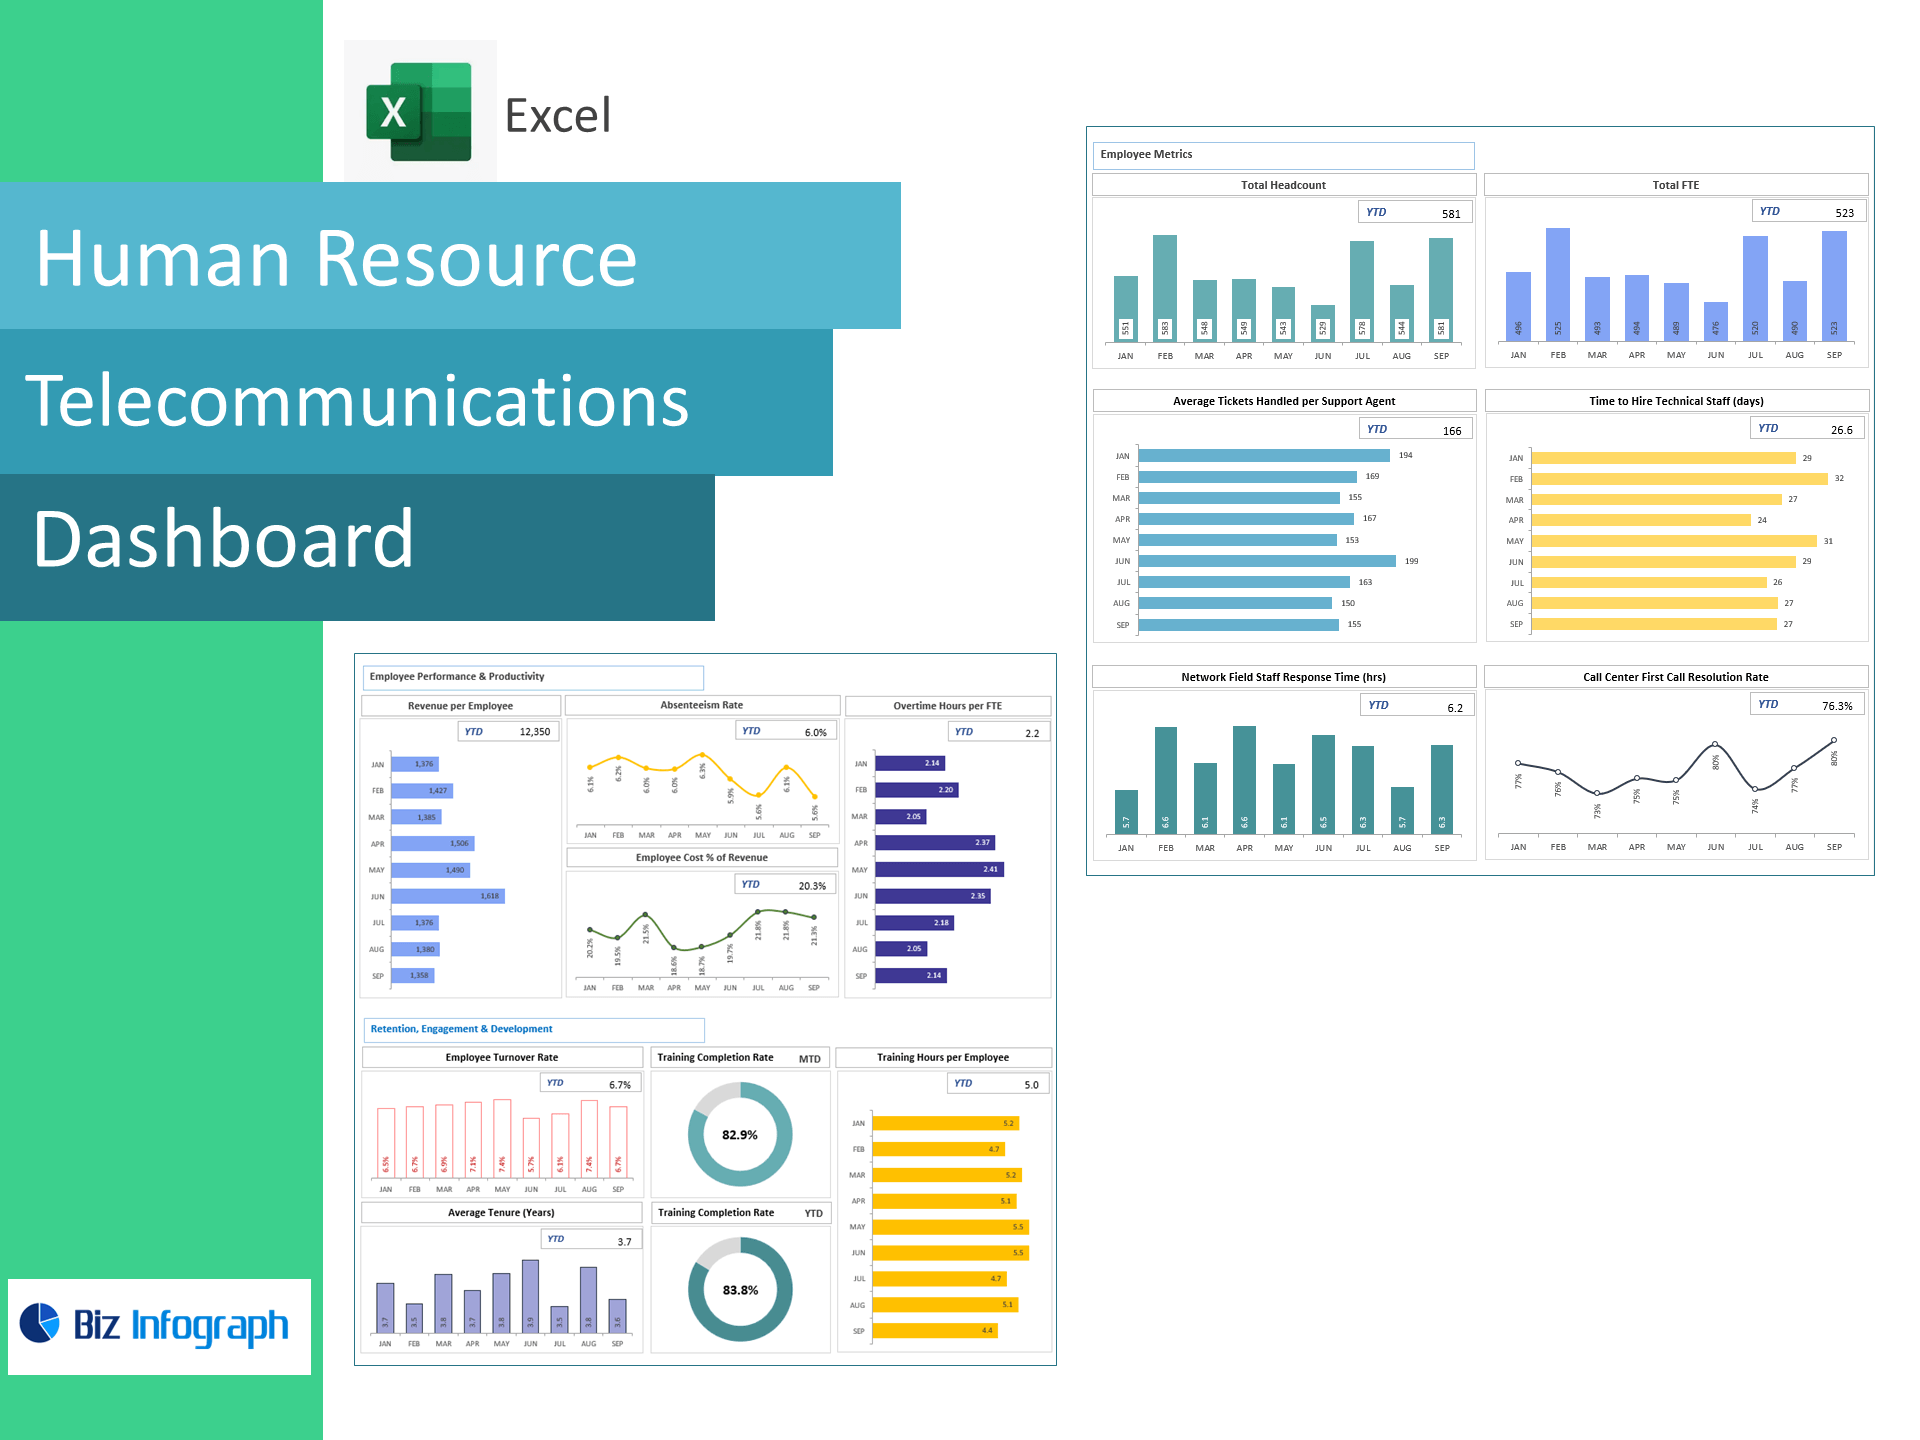
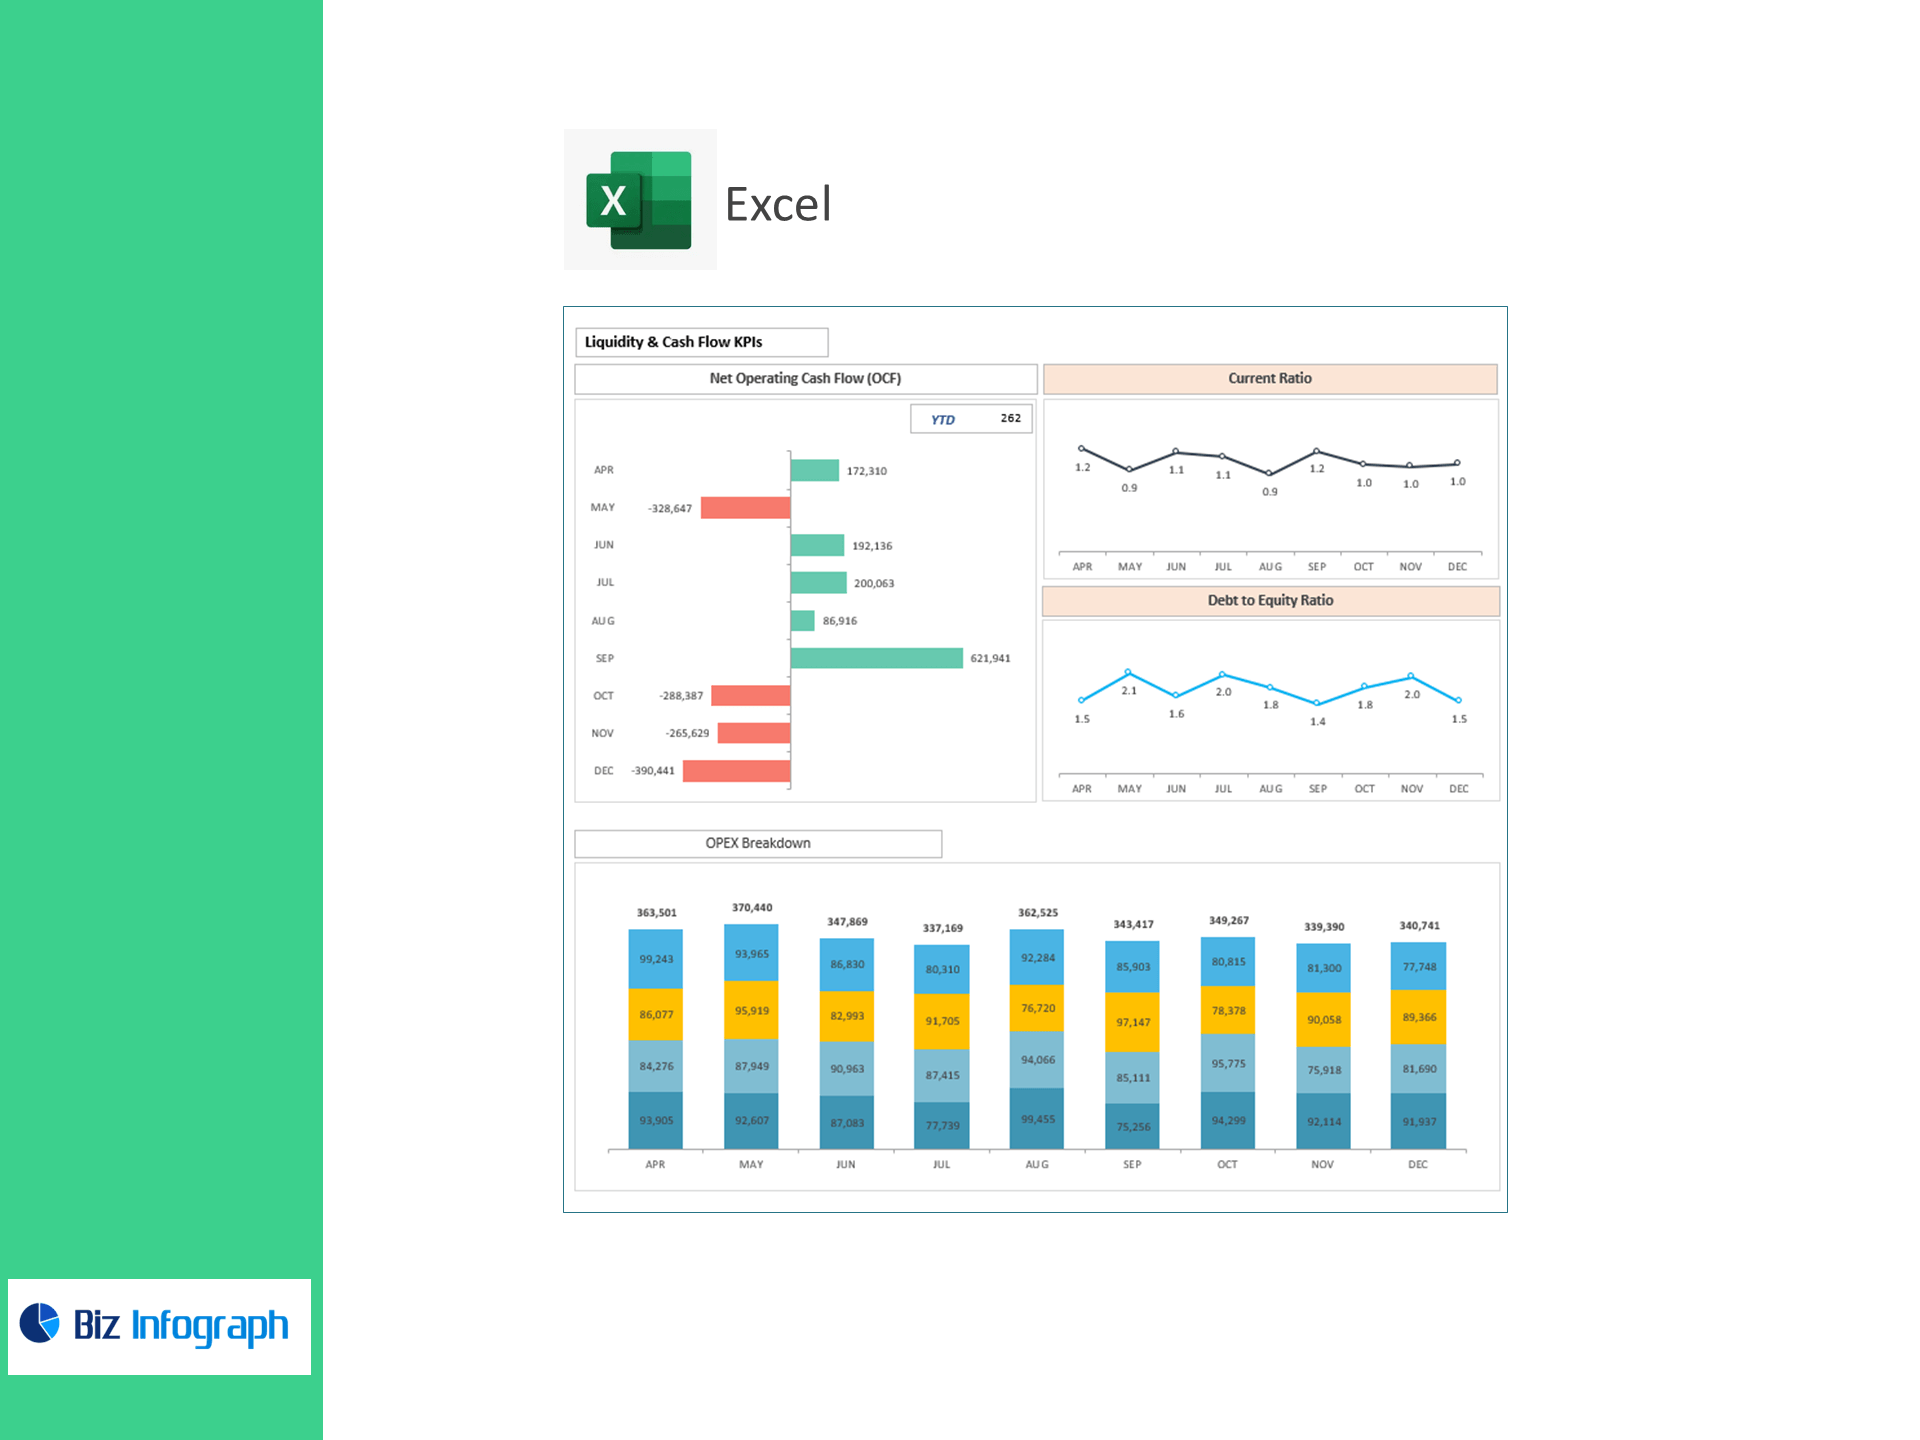
Employee, Admin, Selling, Marketing Expense → Total OPEX (with breakdown)
-
Depreciation & Amortization
-
Operating Profit (EBIT), EBITDA, Interest, Other Income/(Expense), Taxes, Net Profit
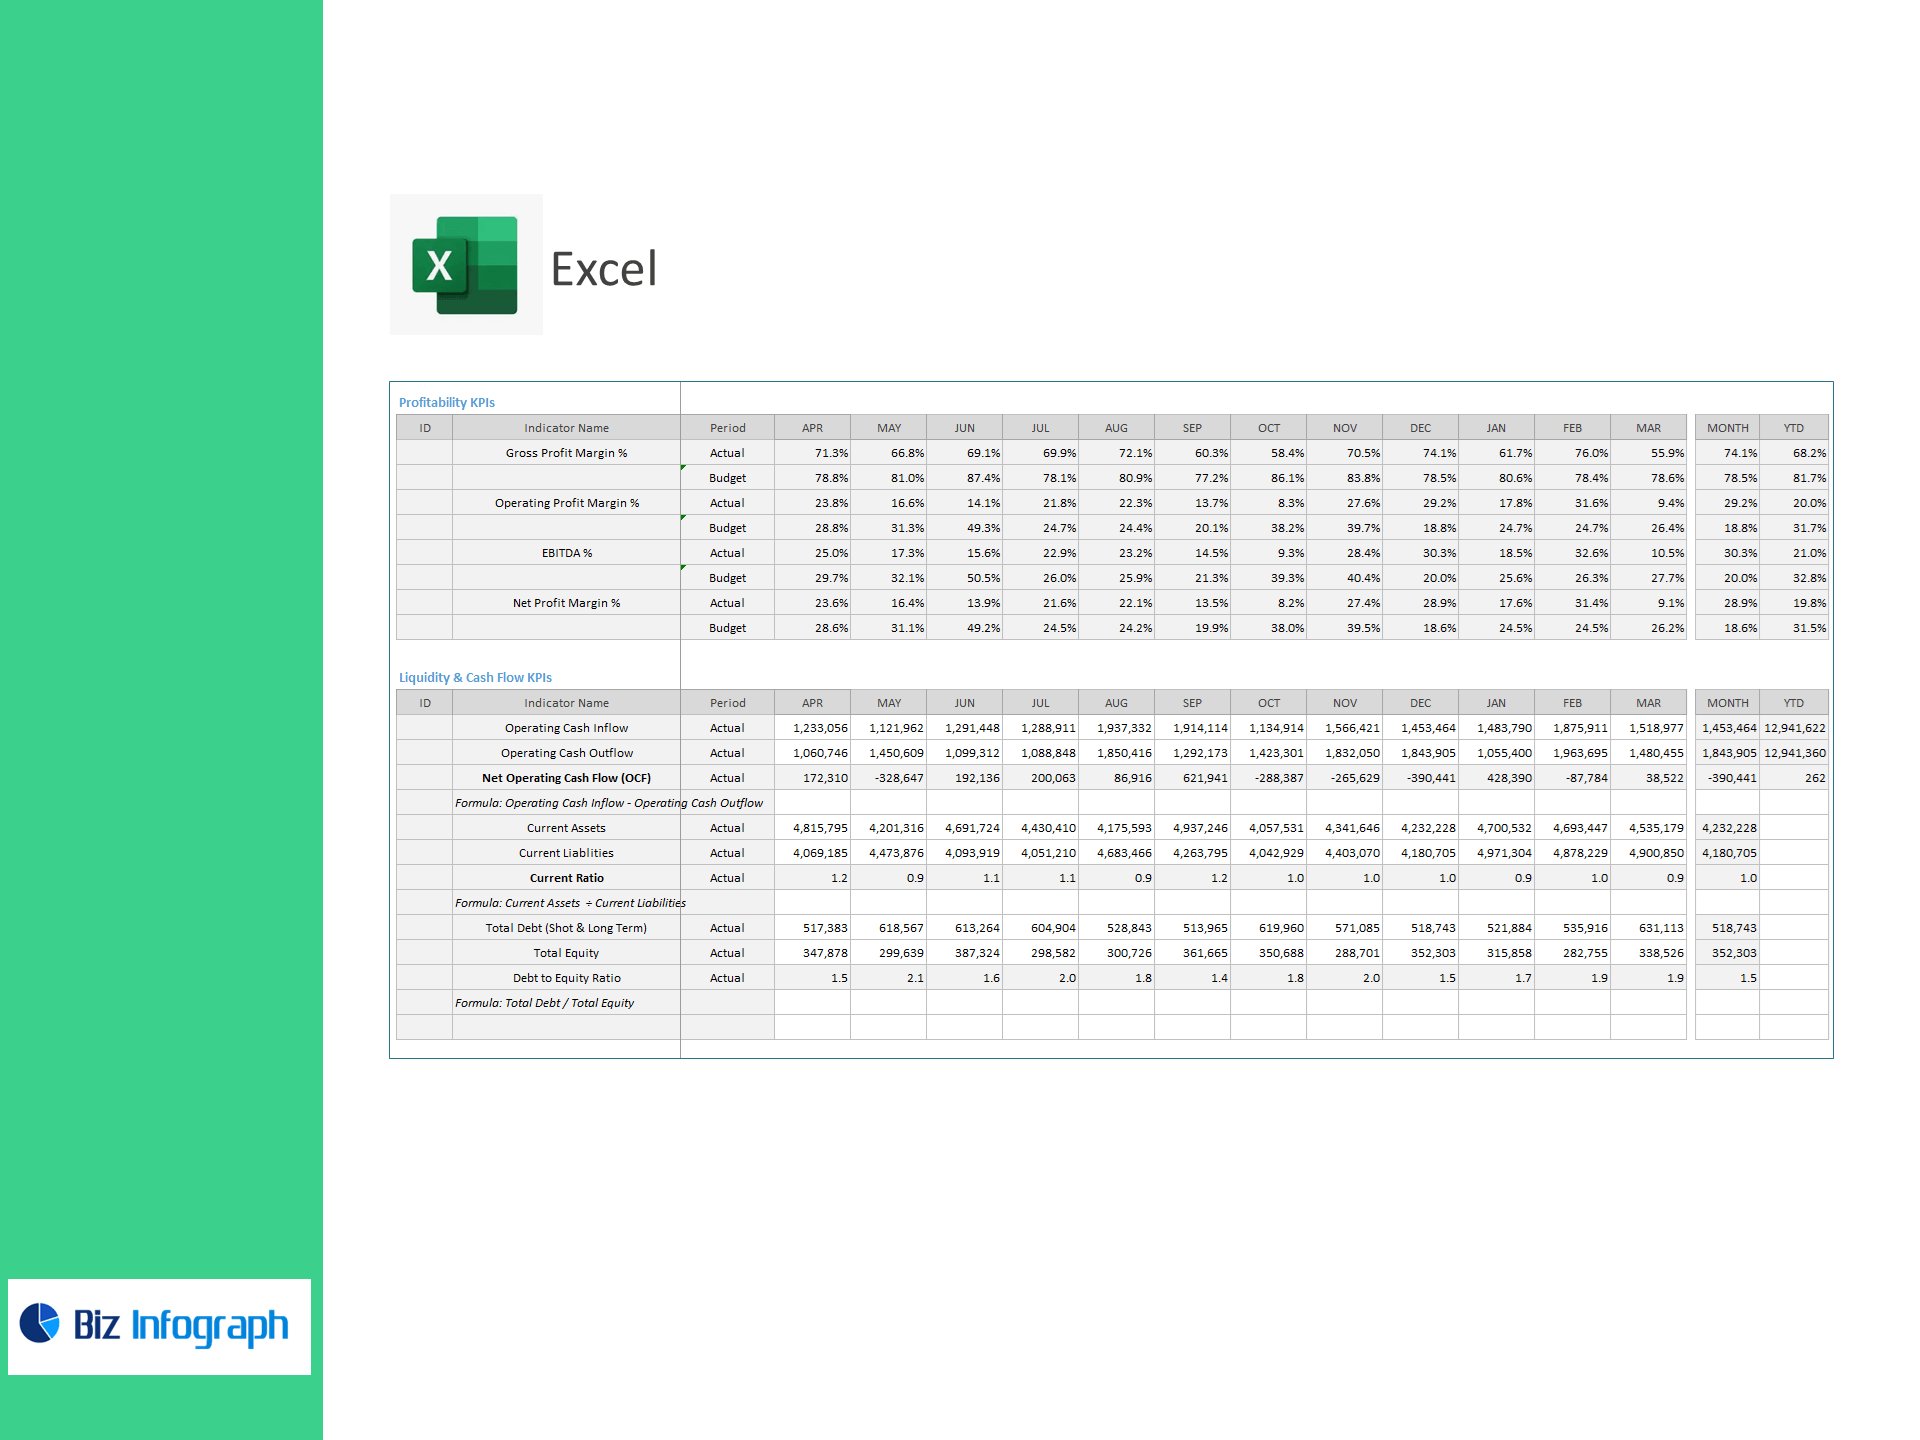
Profitability
-
Gross Profit Margin %
-
Operating Profit Margin %
-
EBITDA %
-
Net Profit Margin %
Liquidity & Cash Flow
-
Operating Cash Inflow / Outflow
-
Net Operating Cash Flow (OCF) = Operating Cash Inflow − Operating Cash Outflow
-
Current Assets / Current Liabilities → Current Ratio = Current Assets ÷ Current Liabilities
-
Total Debt / Total Equity → Debt to Equity Ratio = Total Debt ÷ Total Equity
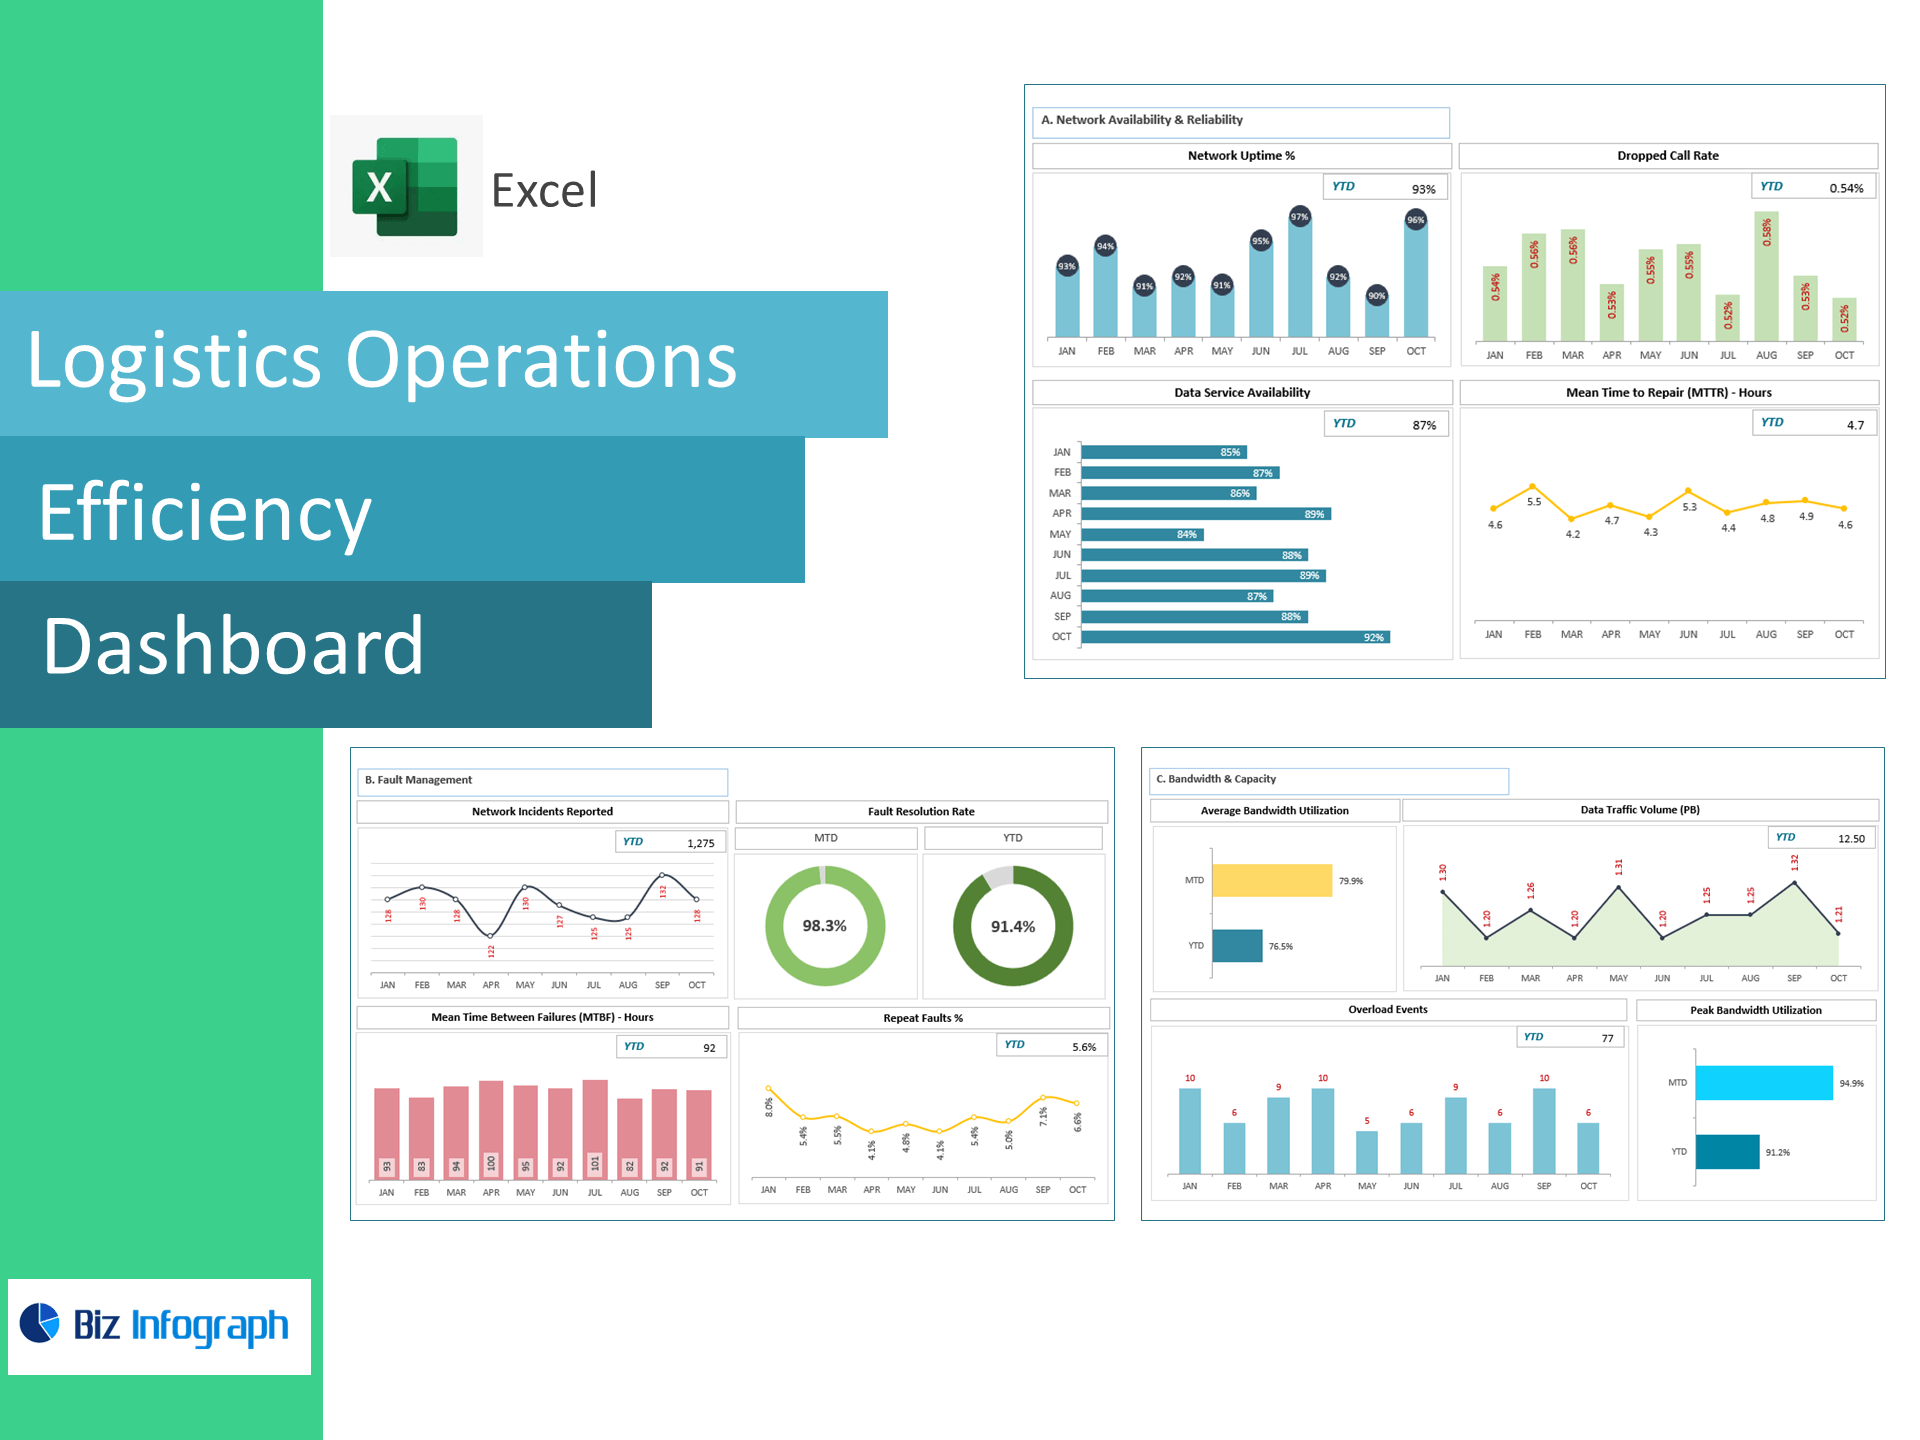
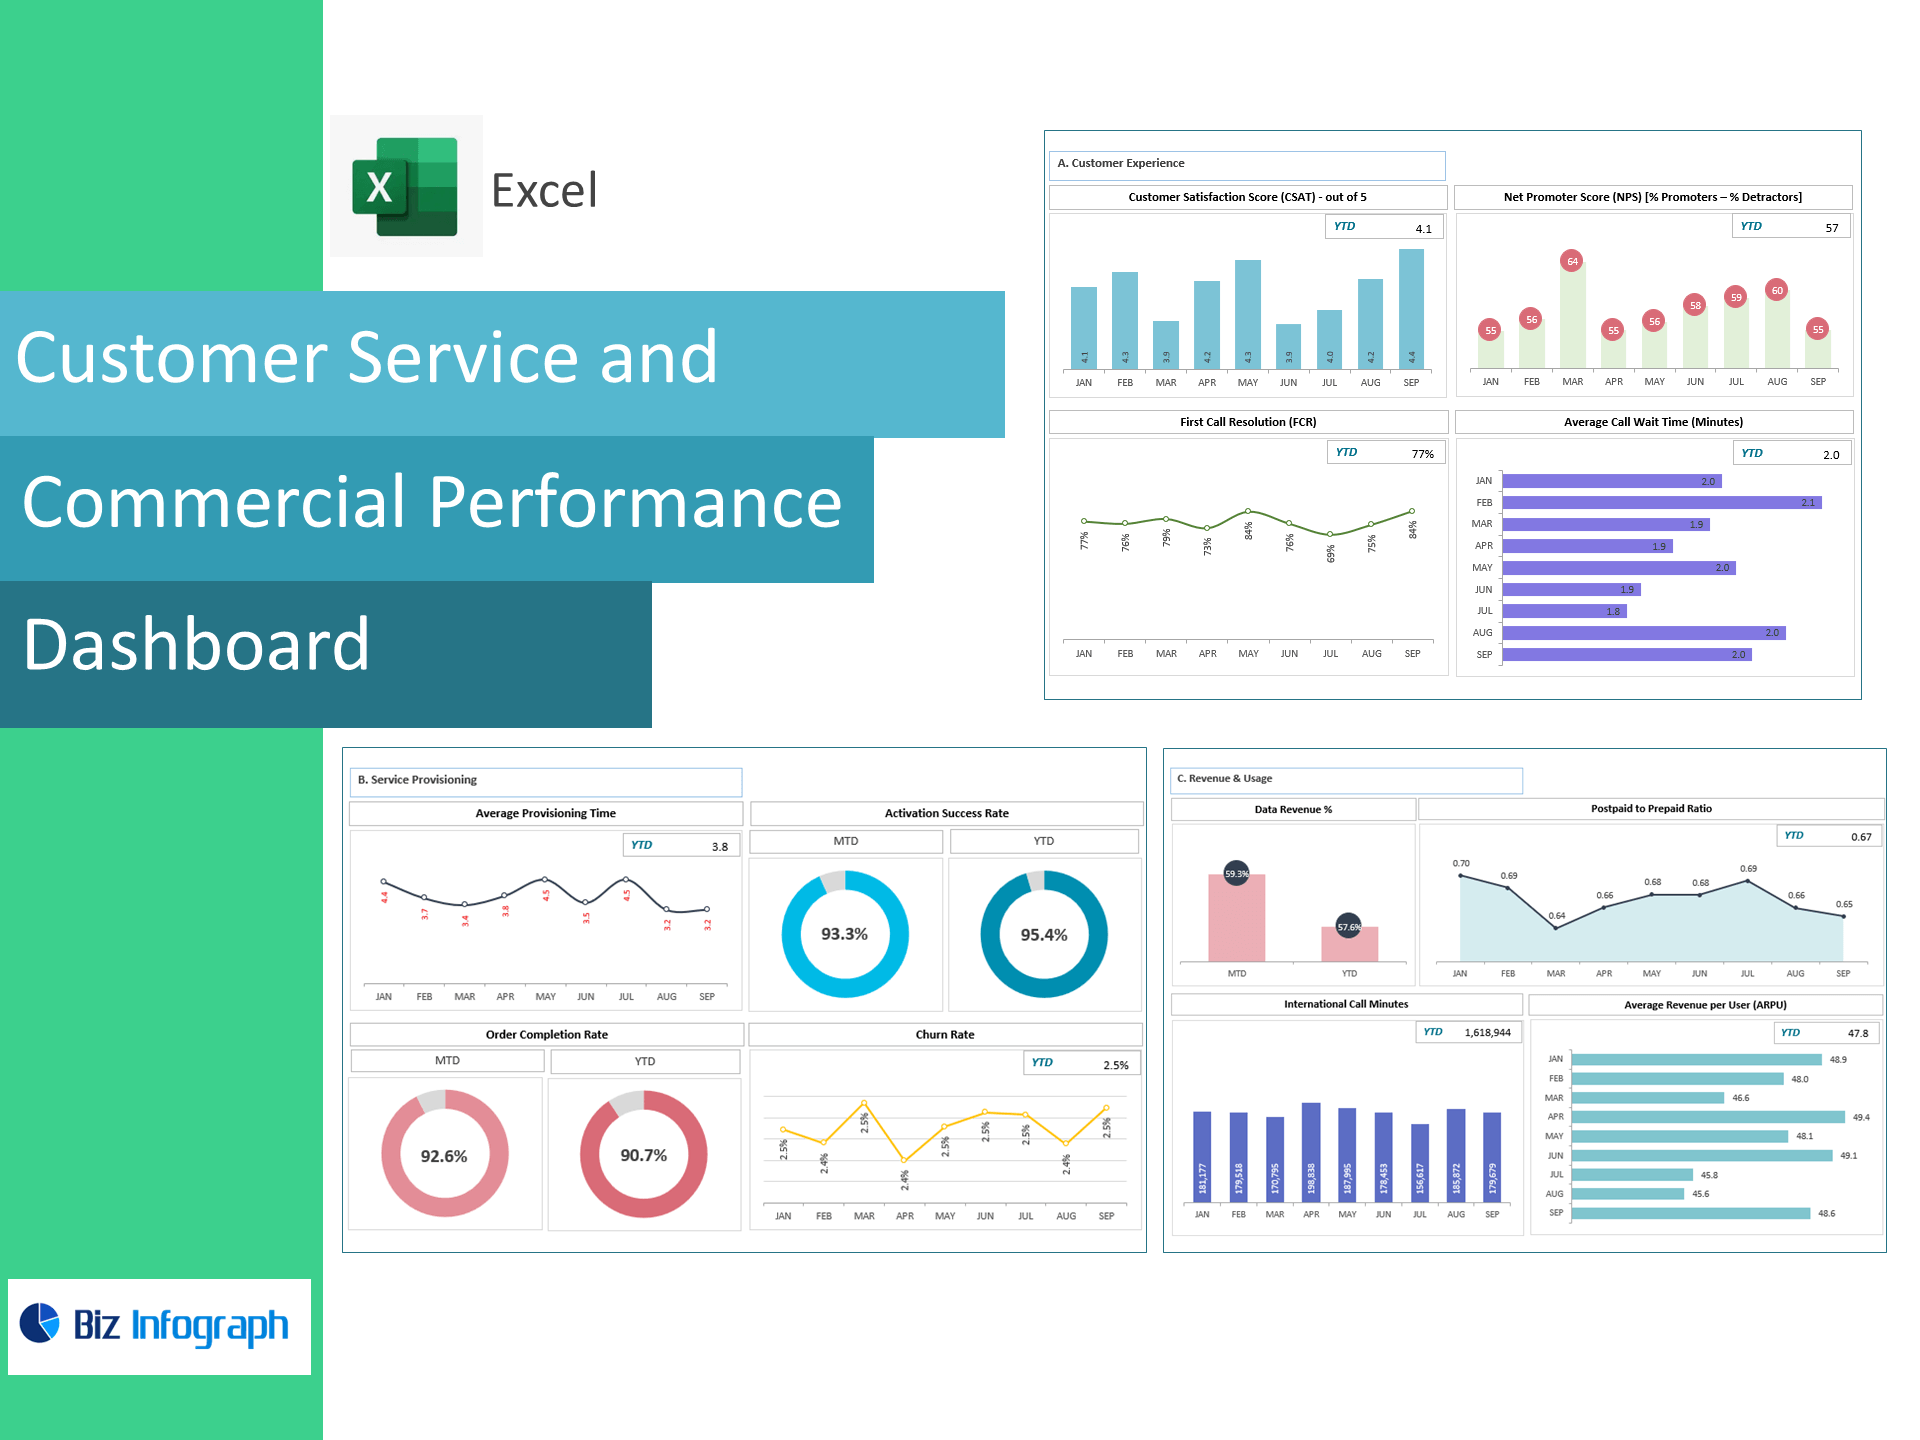
Operational (Telco)
-
Number of Active Subscribers
-
Average Revenue per User (ARPU) = Total Revenue ÷ Number of Active Subscribers
-
Churn Rate (%) = (Lost Subscribers ÷ Total Subscribers at Start of Period) × 100
-
Network OPEX % of Revenue = (Network OPEX ÷ Total Revenue) × 100
What’s inside
-
Finance Control Tower: P&L, margins, cash flow, liquidity, leverage, and subscriber KPIs in one view.
-
Drill-downs: revenue by product/plan, OPEX breakdowns, and network cost share.
-
Scenario inputs: targets, budget, and sensitivity toggles for margin and churn.
-
Data tabs: P&L, balance-sheet currents, cash flow, subscriber movement, ARPU, and network OPEX.
-
Documentation: plain-English KPI definitions & formulas.
Benefits for telecom finance teams
-
Link subscribers to margins: see how ARPU and churn drive revenue, EBITDA, and cash.
-
Control costs: monitor network OPEX %, selling/marketing mix, and EBITDA conversion.
-
Protect liquidity: track OCF, current ratio, and debt-to-equity before board reviews.
-
Close faster: standardized structure speeds monthly closes and QBR prep.
For ready-to-use Dashboard Templates: