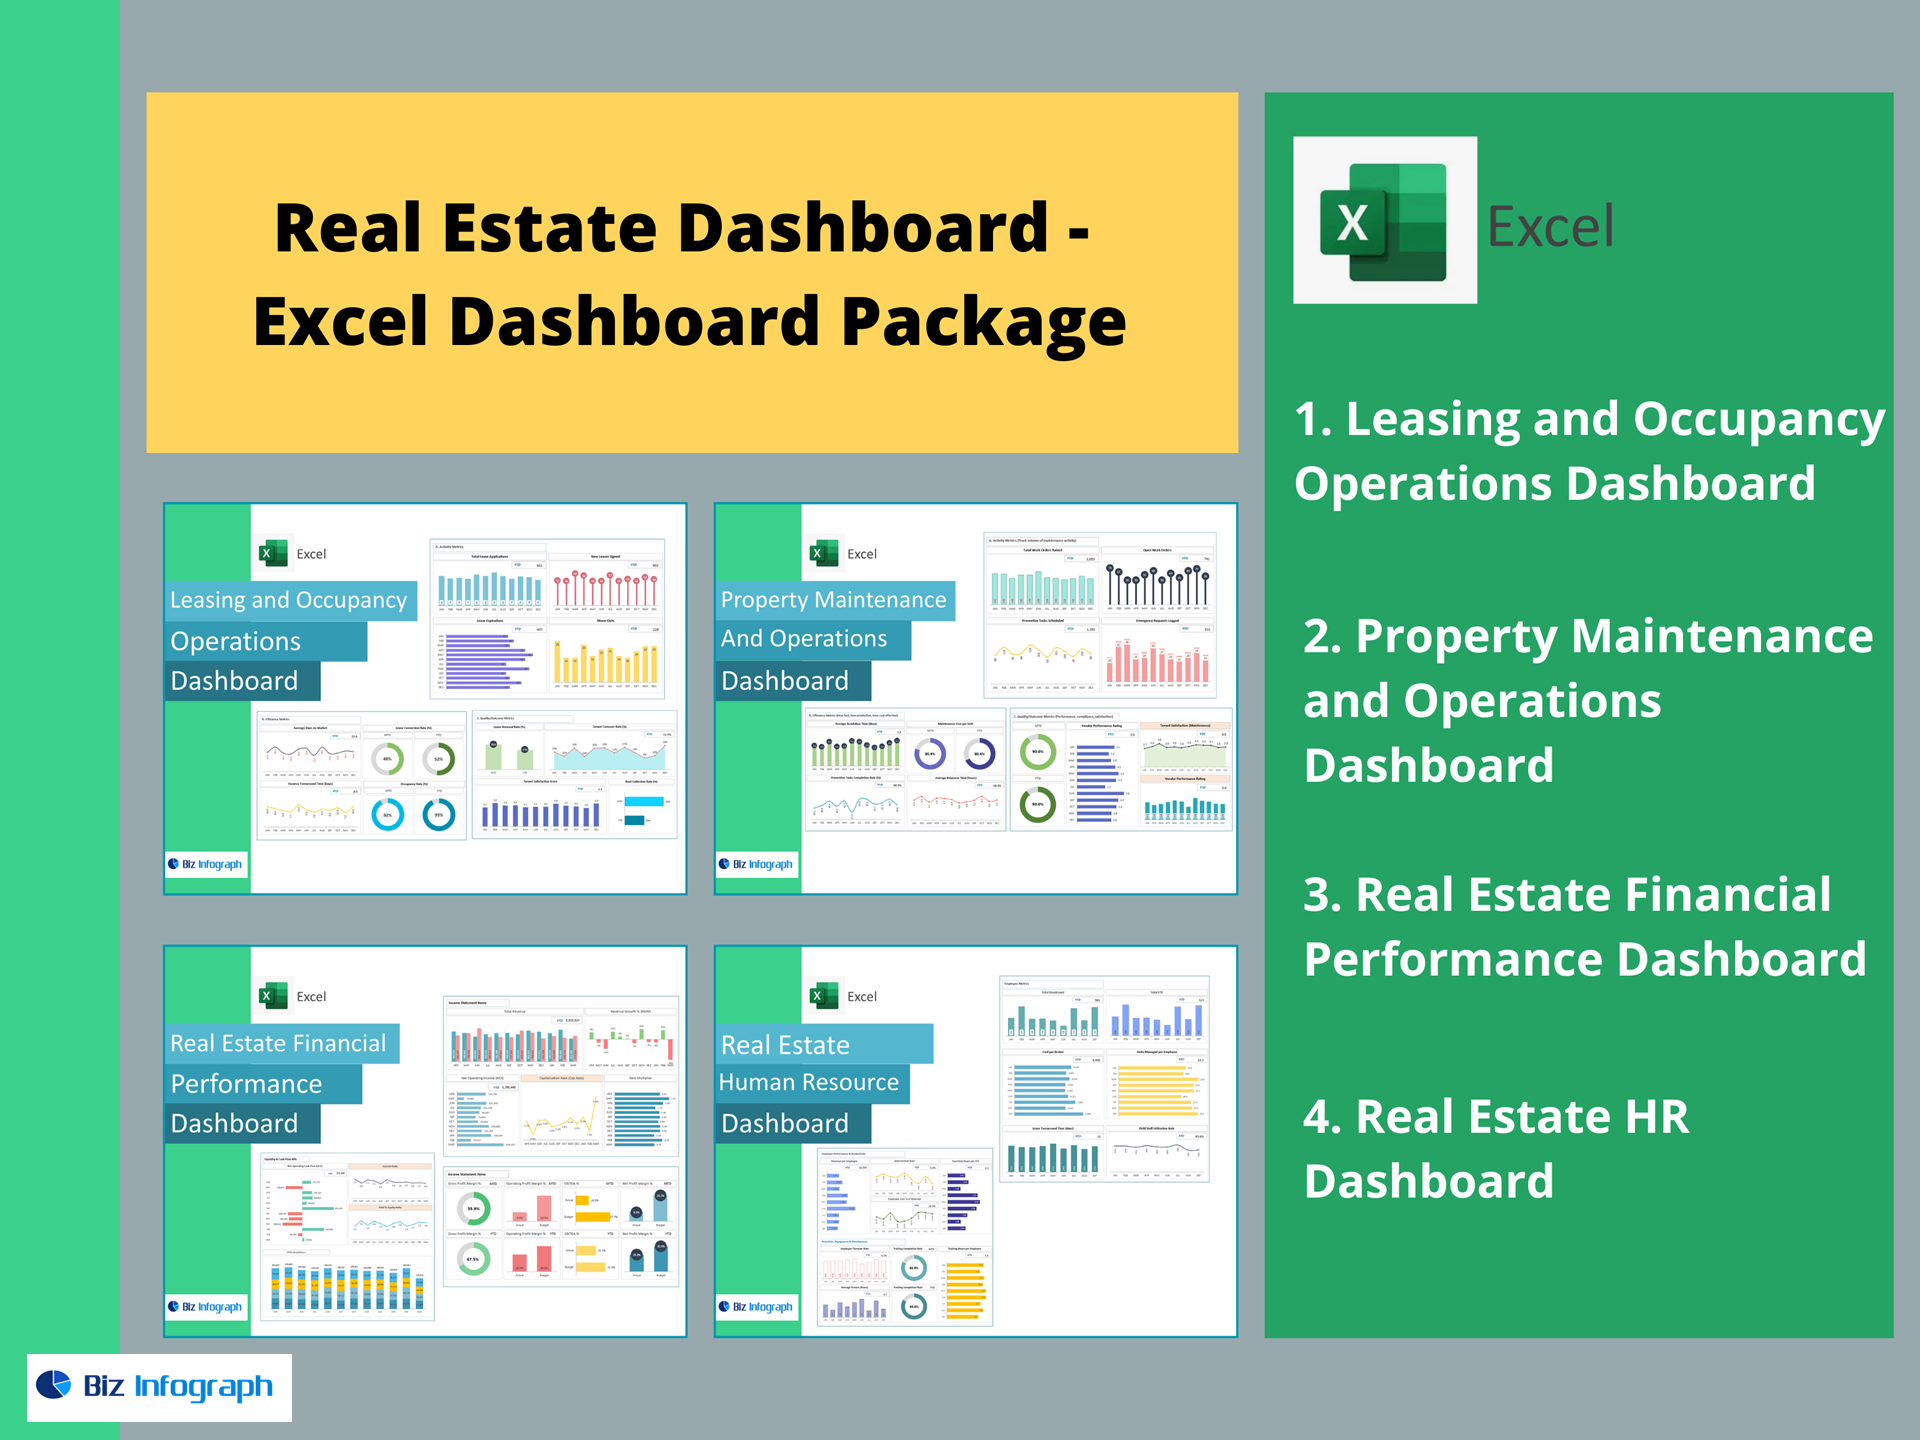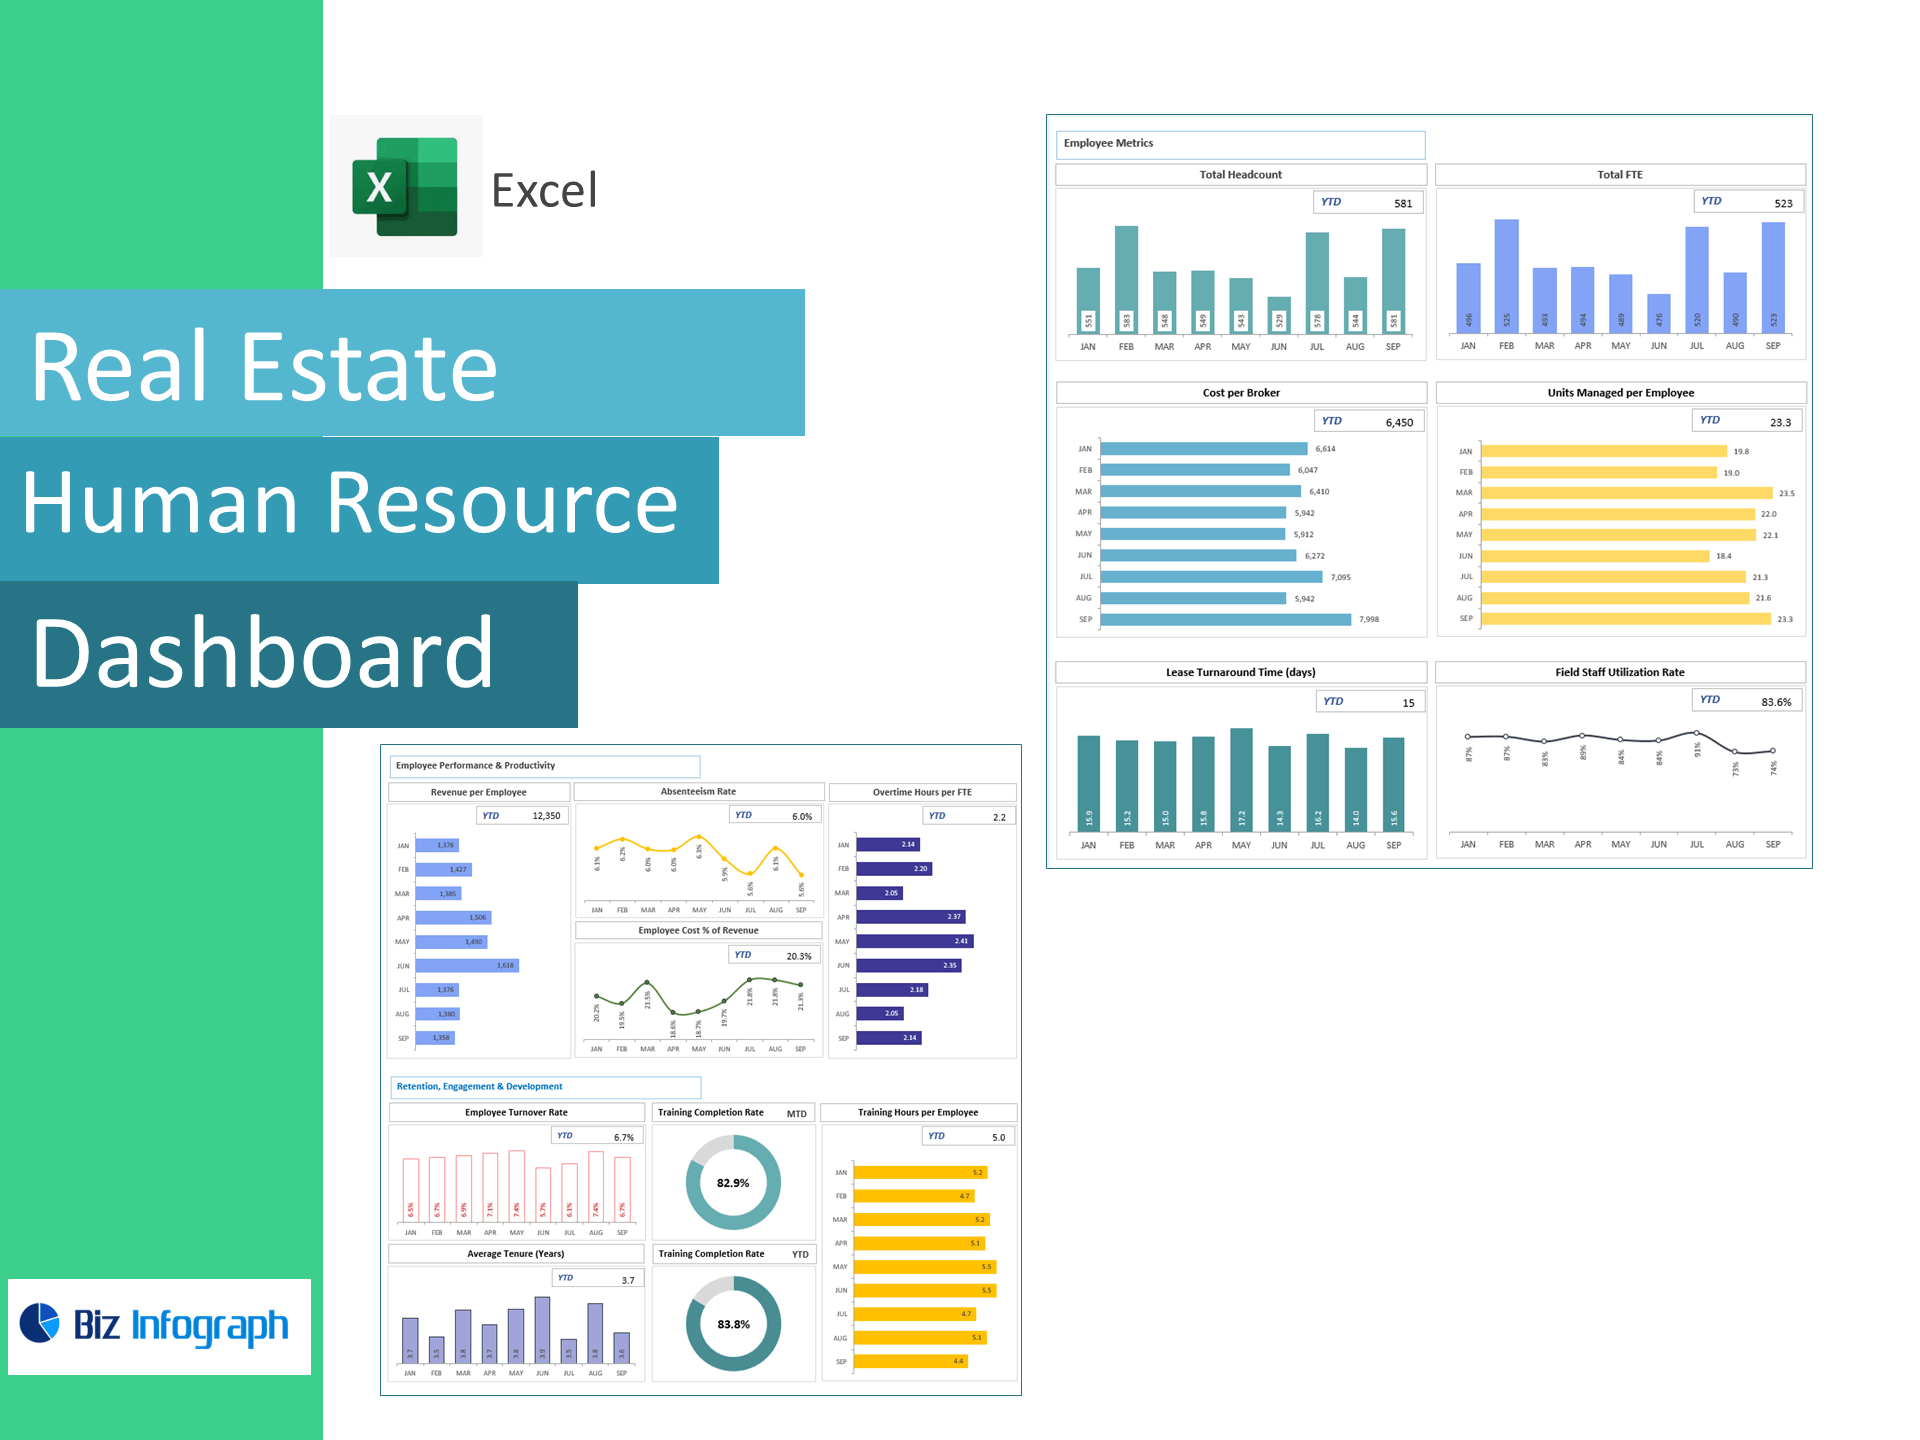
Real Estate HR Dashboard — Excel Template
Control labor costs, speed leasing, and boost team utilization—right in Excel. Purpose-built for property management and brokerage teams, this template converts HR, payroll, leasing, and operations data into a live dashboard tracking headcount & FTEs, Cost per Broker, Units Managed per Employee, Lease Turnaround Time, Field Staff Utilization, Revenue per Employee, Absenteeism, Overtime per FTE, Employee Cost % of Revenue, Turnover, Tenure, and Training metrics.
Why real estate teams choose this template
-
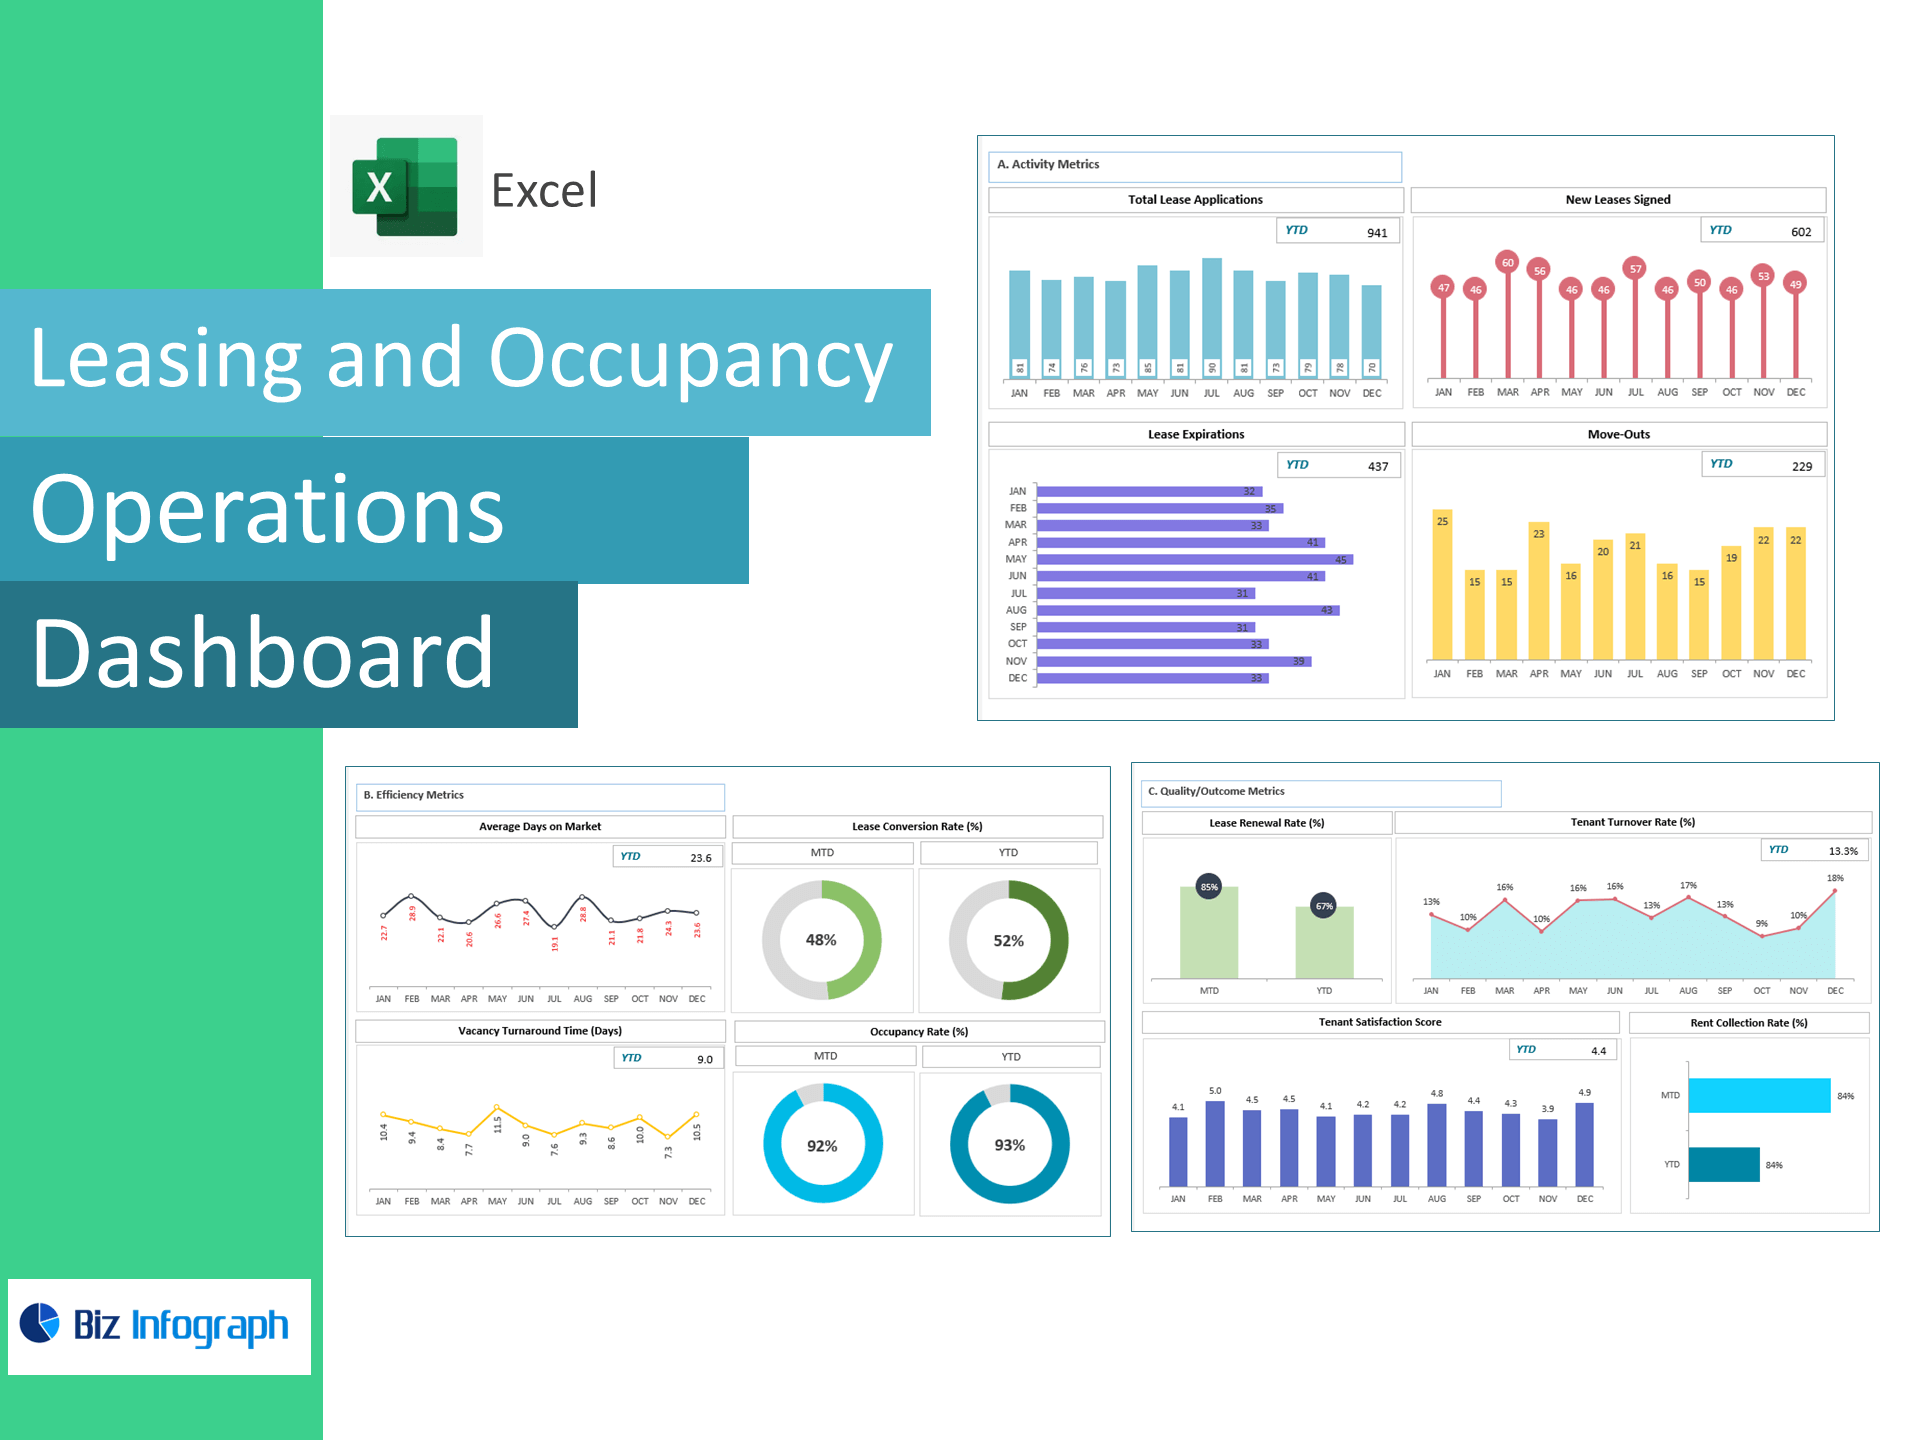
Leasing & ops visibility: See how staffing impacts lease turnaround and units managed.
-
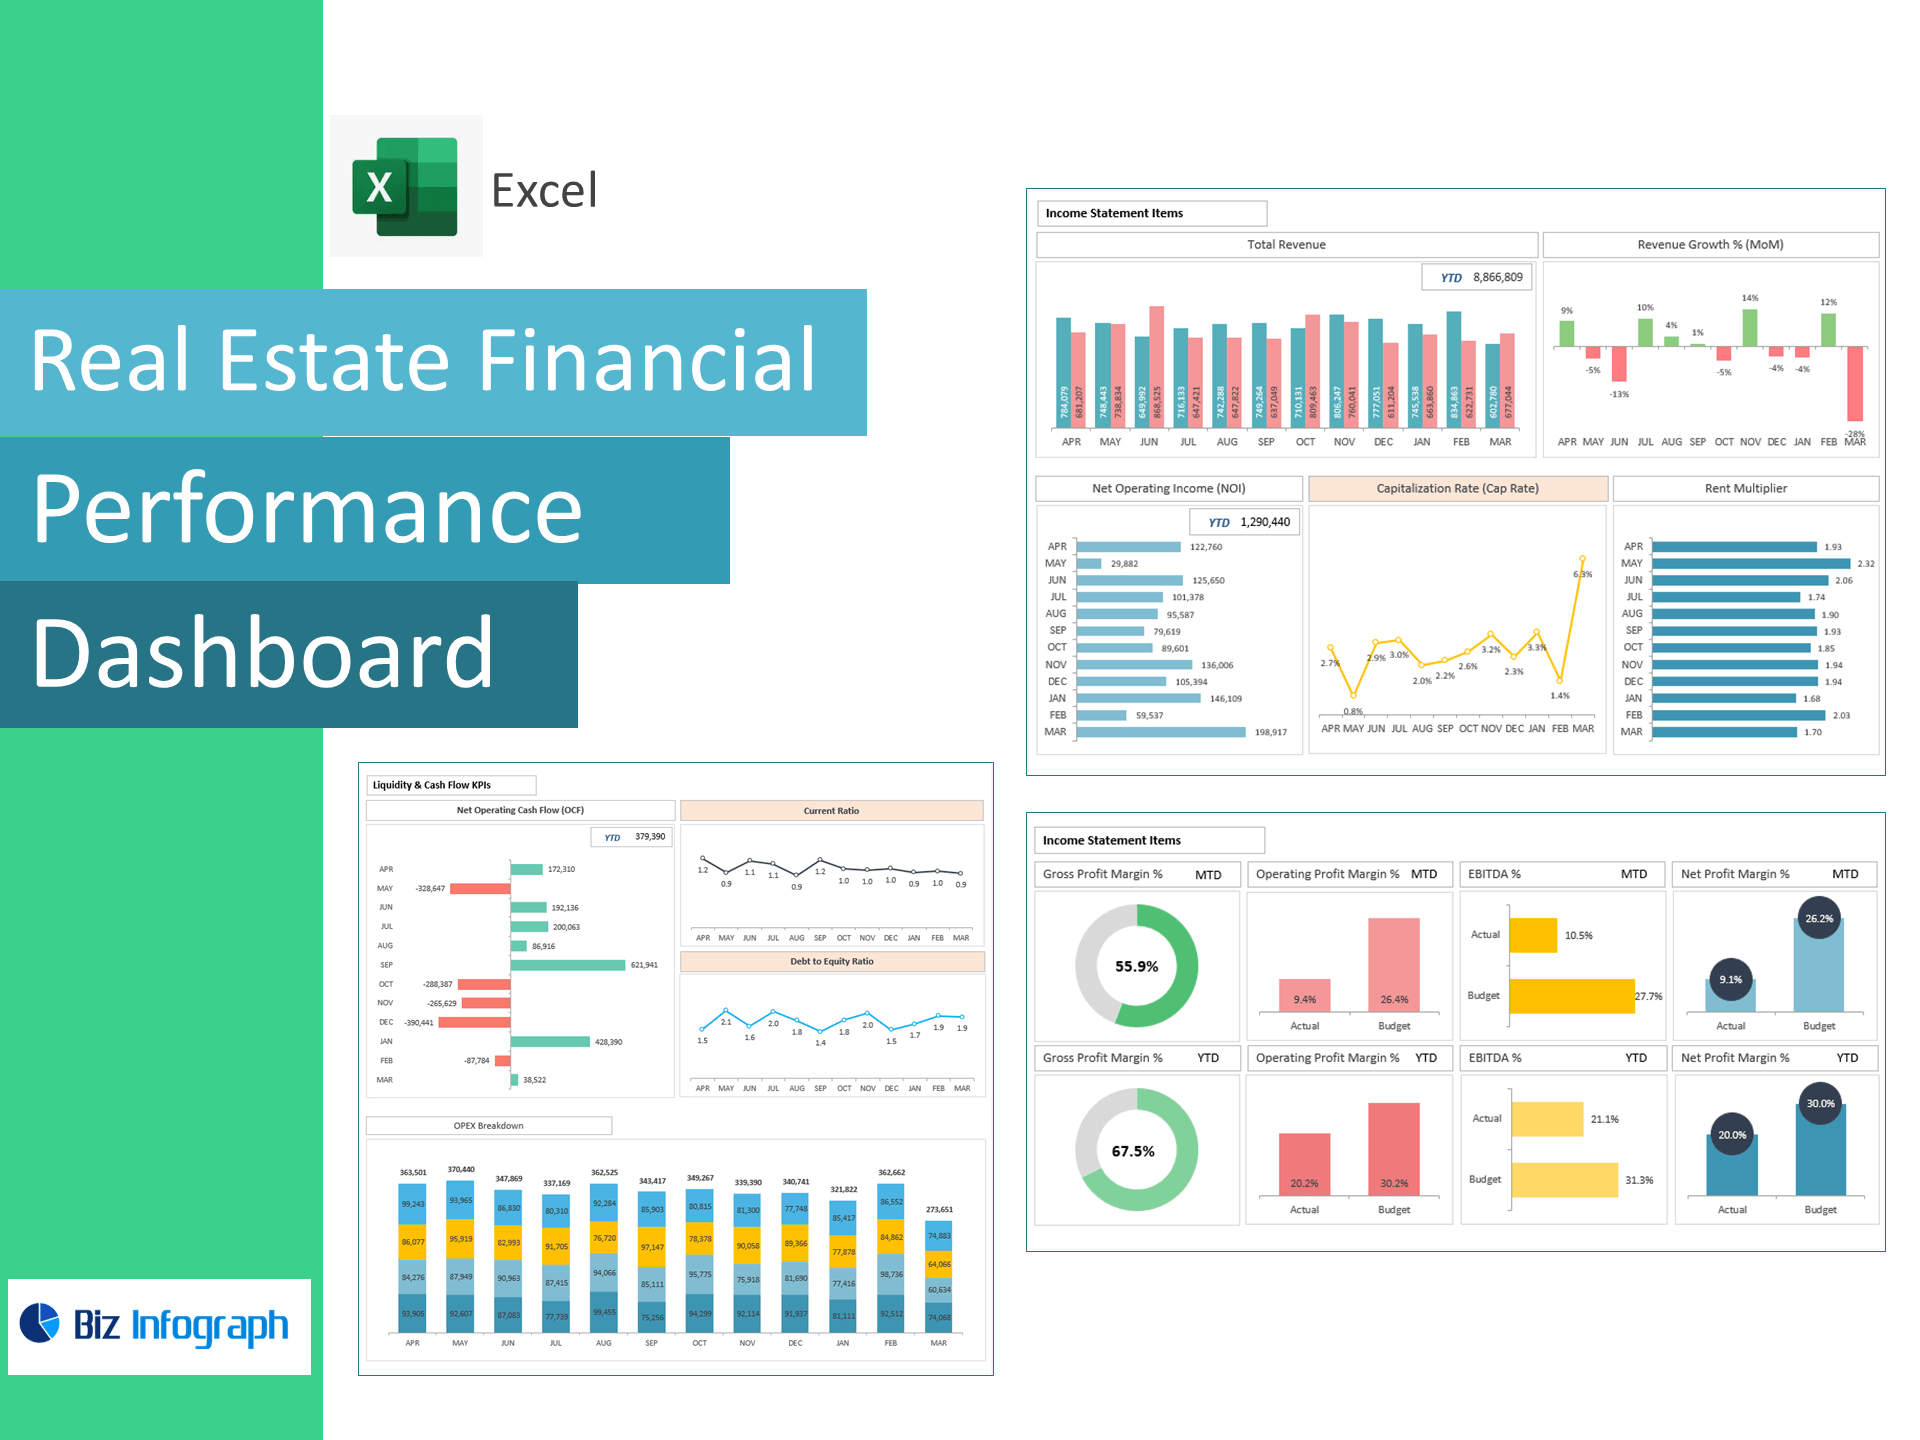
Cost control: Monitor Employee Cost % of Revenue, Overtime per FTE, and Cost per Broker with instant variance cues.
-
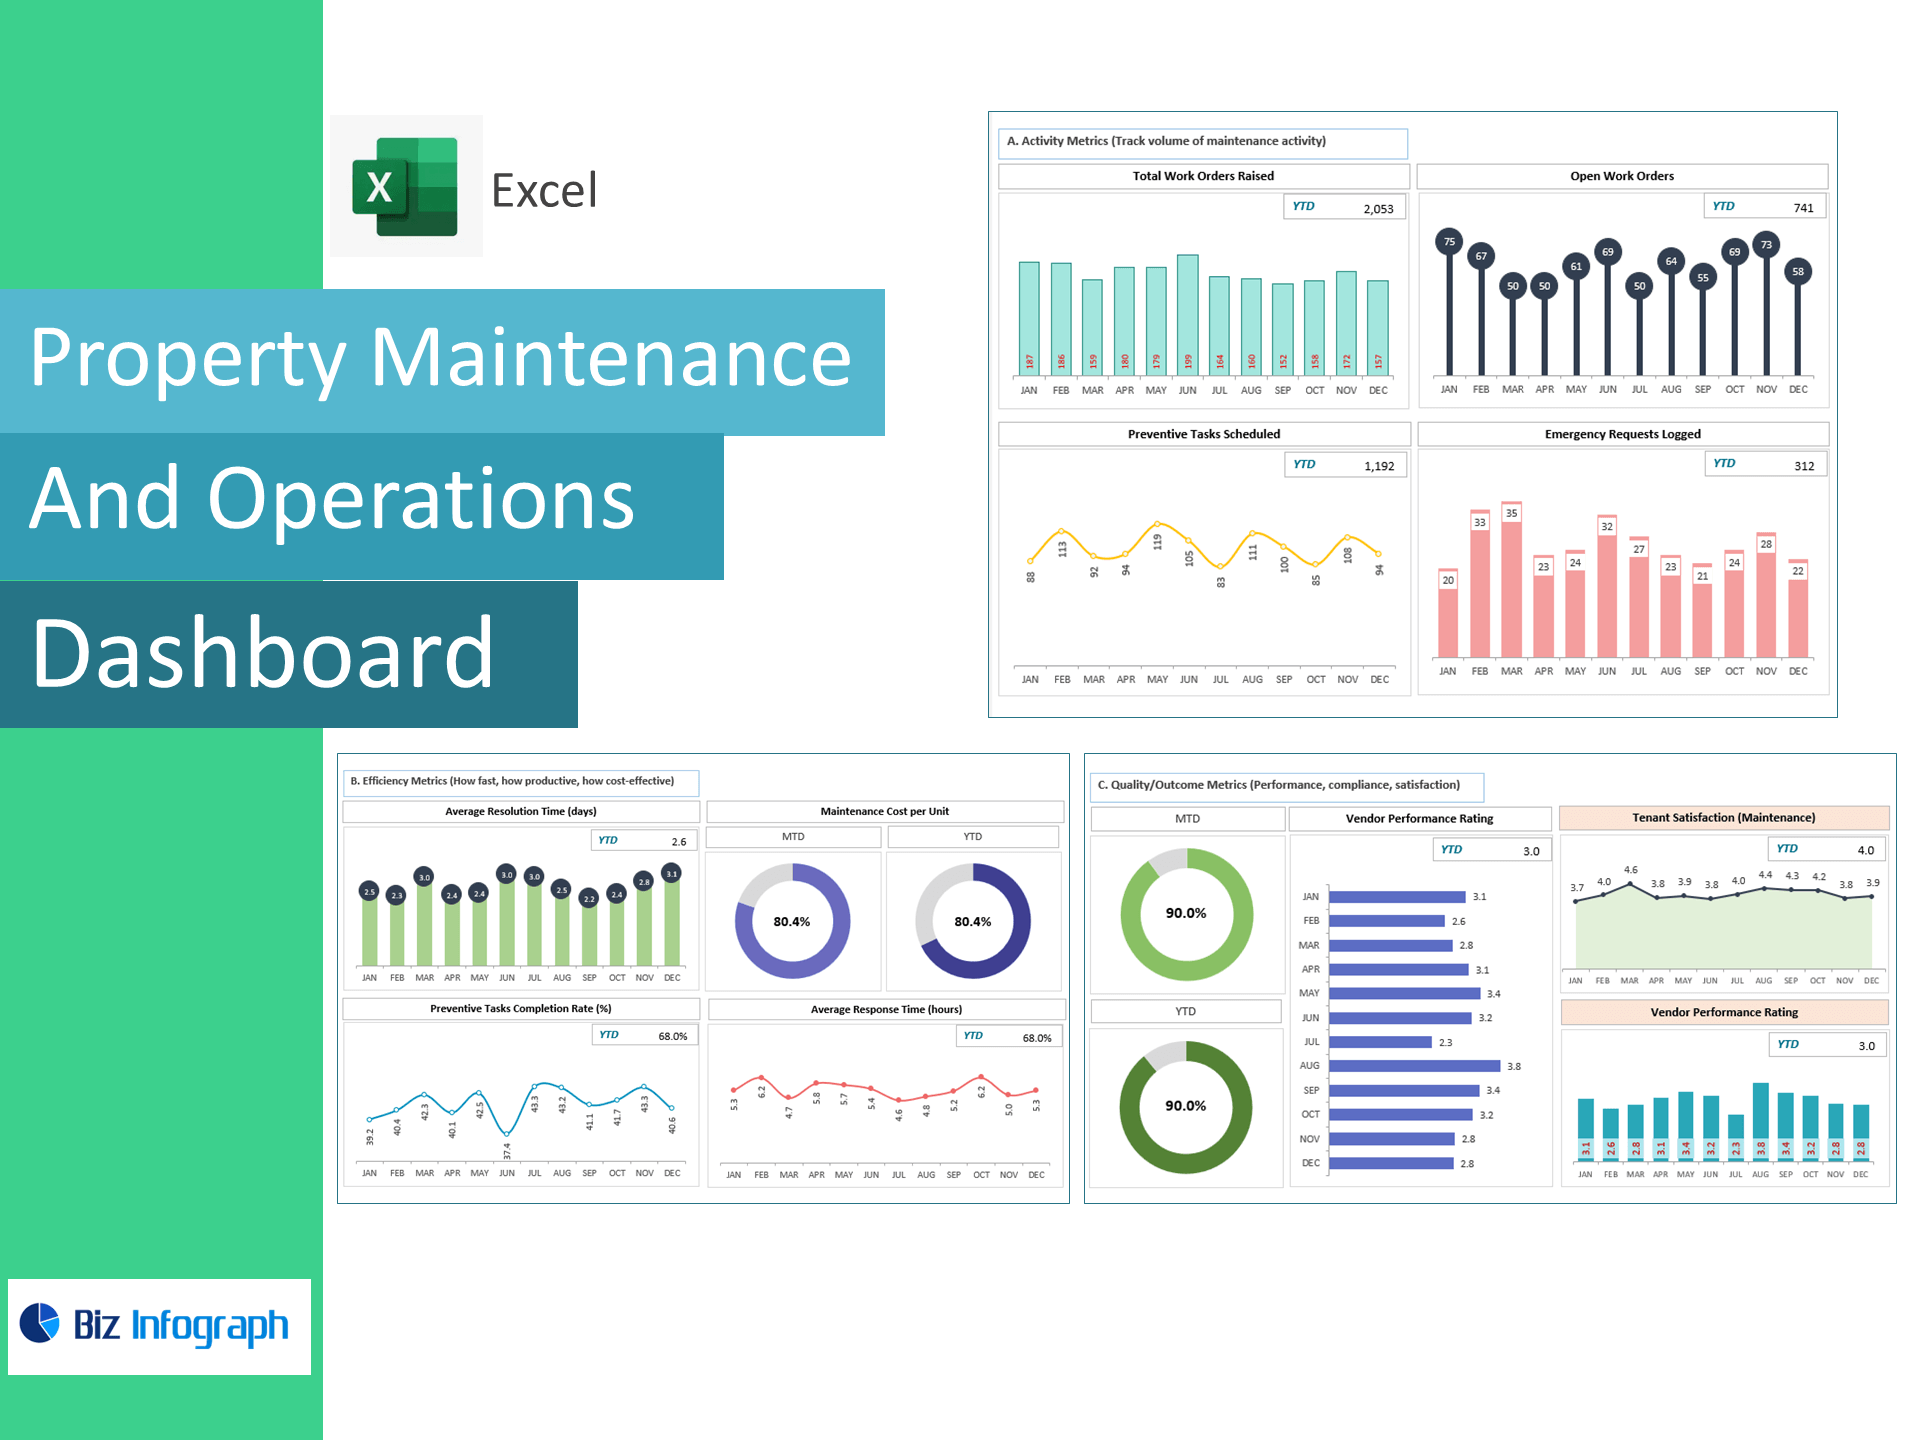
Utilization first: Track Field Staff Utilization Rate to balance workload across properties.
-
Ready on day one: Paste your data—everything calculates automatically. No add-ins or BI tools.
KPIs included (with ready-made formulas)
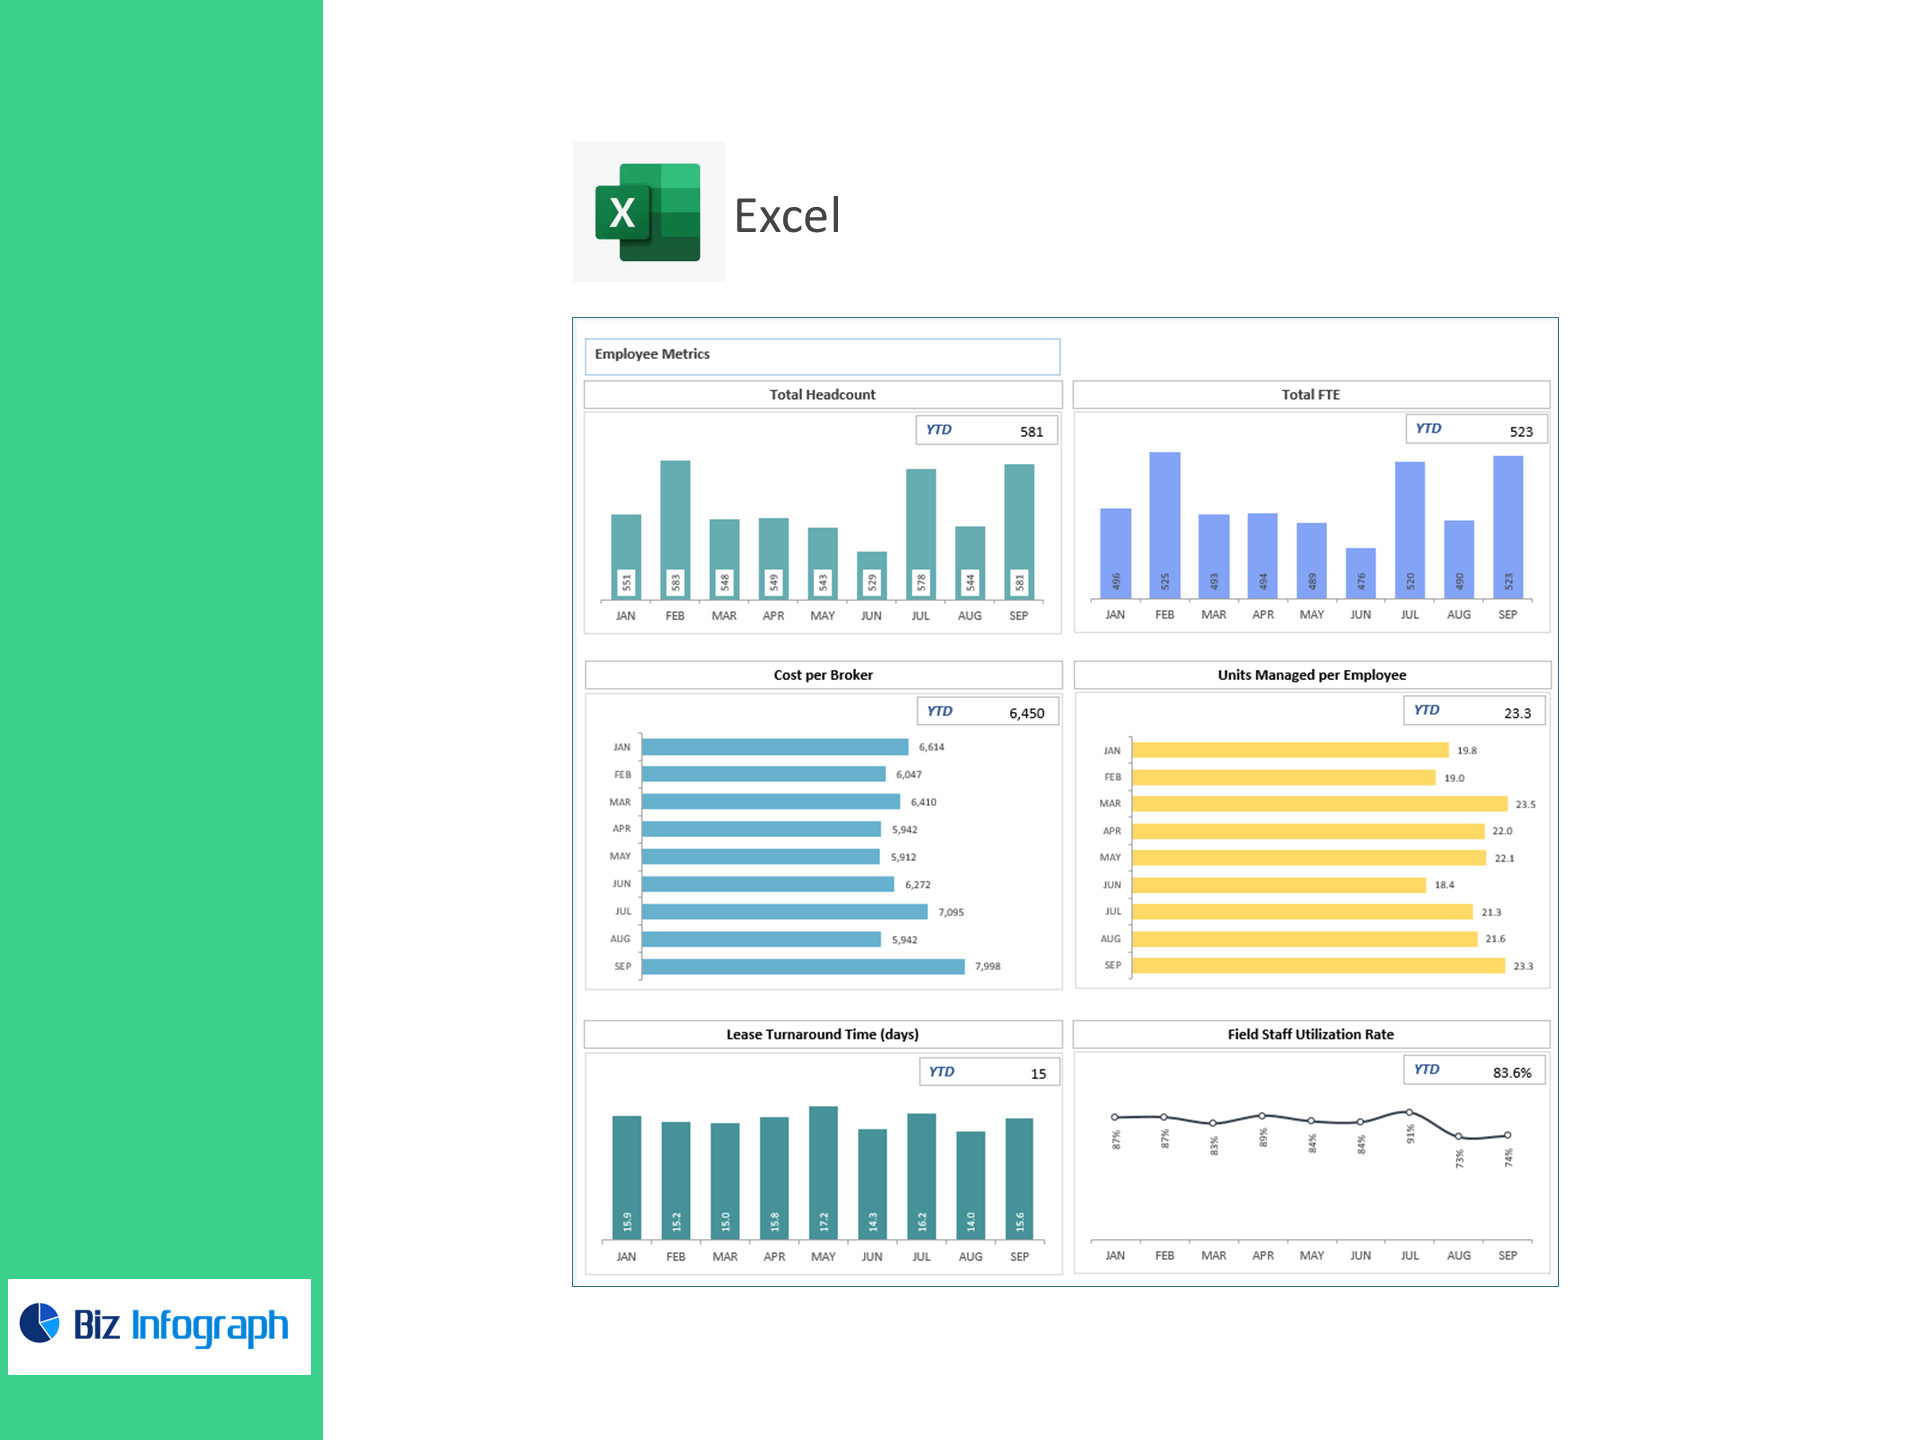
Workforce & Operations
-
Total Headcount, Total FTE
-
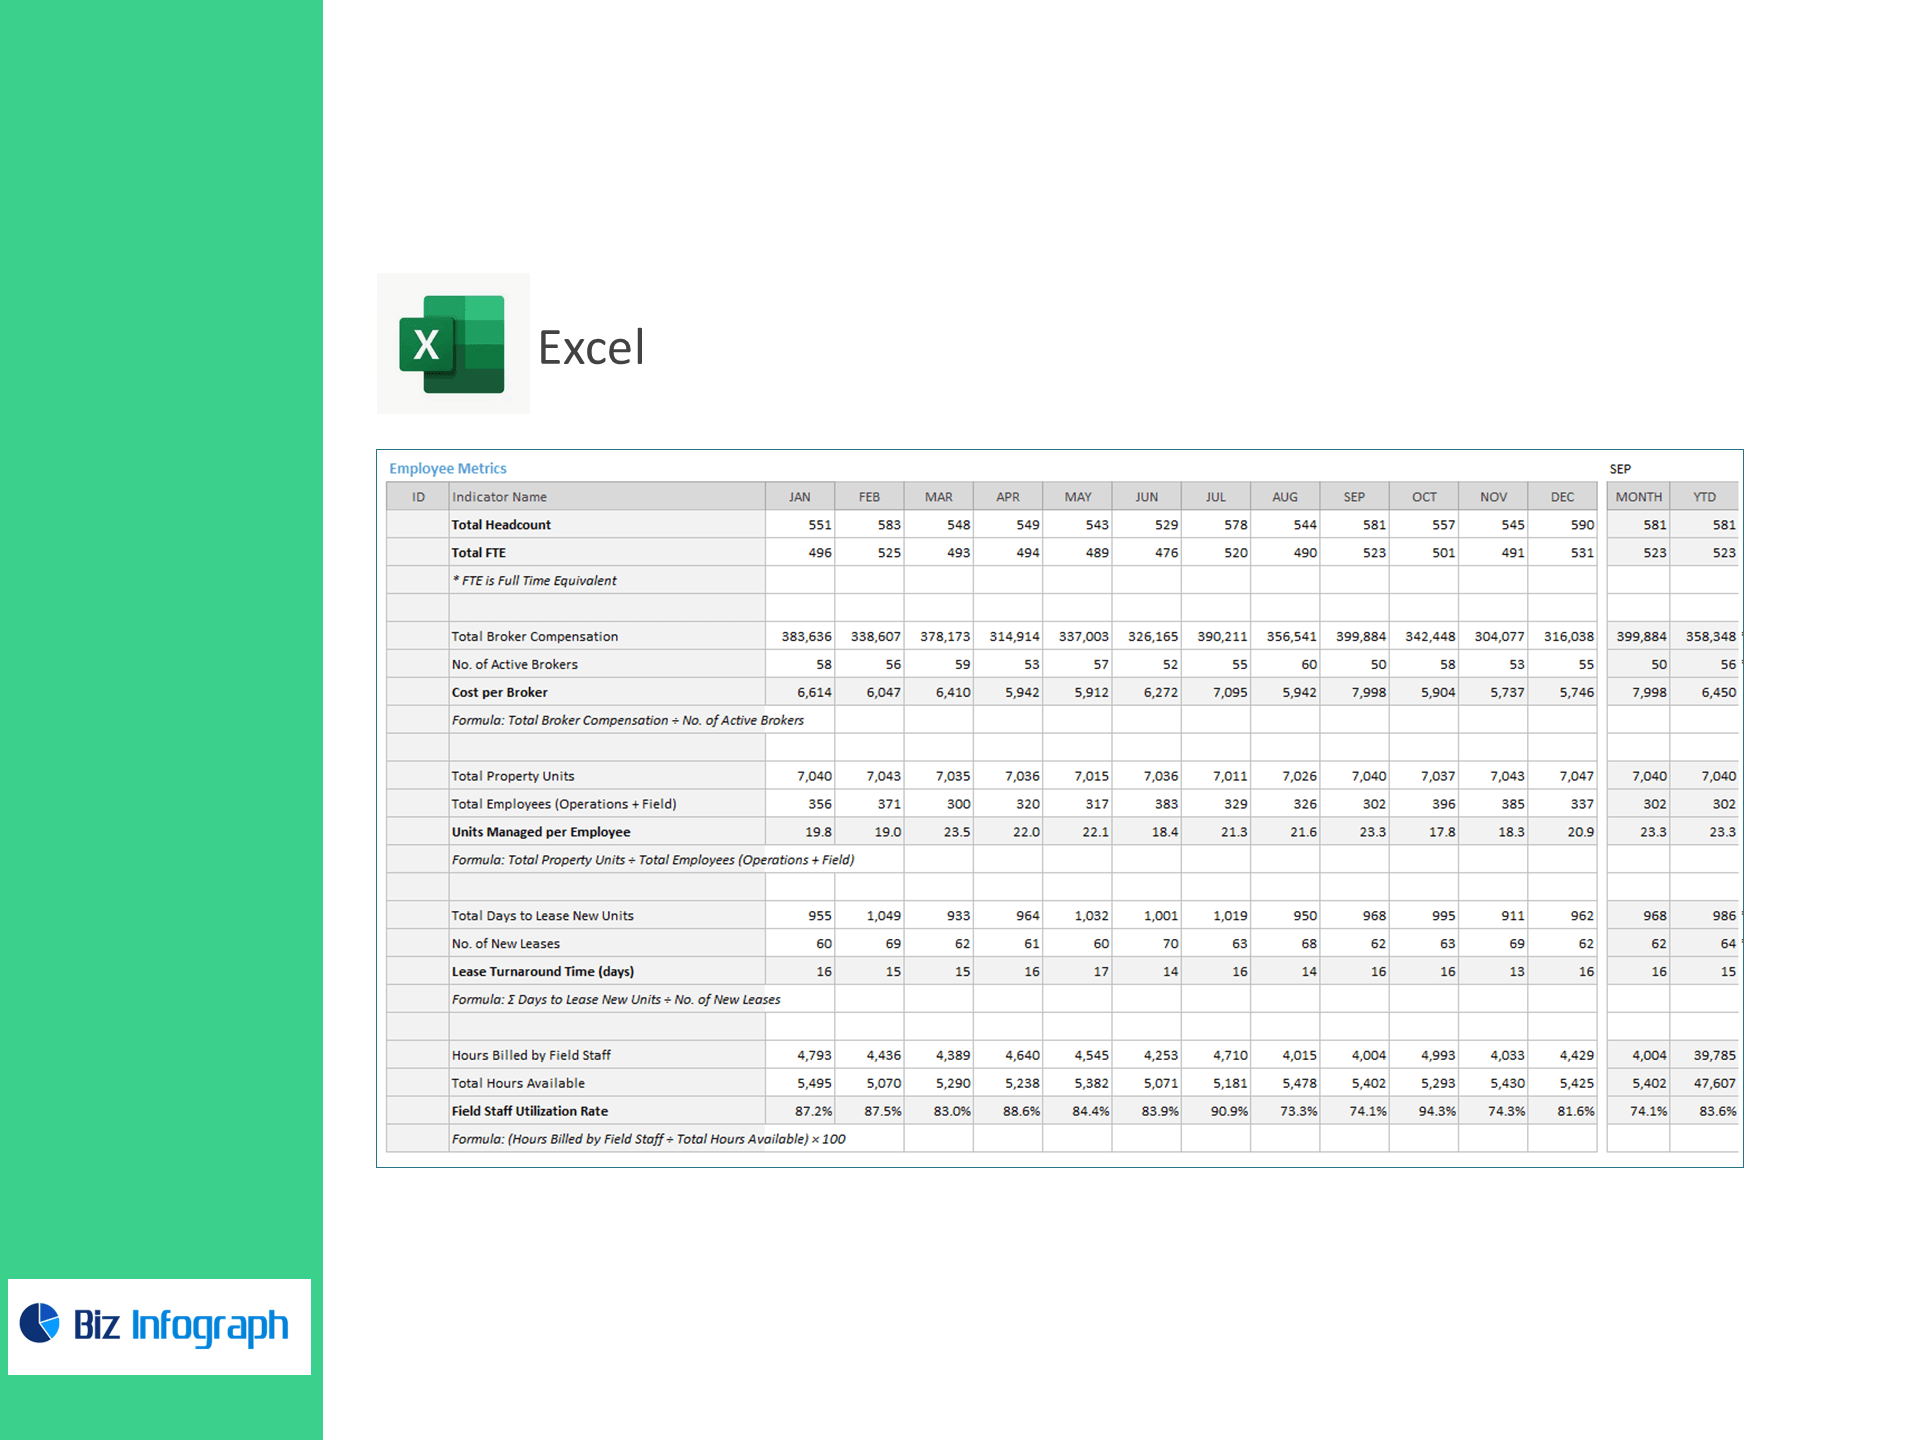
Cost per Broker = Total Broker Compensation ÷ Active Brokers
-
Units Managed per Employee = Total Property Units ÷ (Ops + Field Employees)
-
Lease Turnaround Time (days) = Σ Days to Lease New Units ÷ No. of New Leases
-
Field Staff Utilization Rate (%) = (Hours Billed ÷ Total Hours Available) × 100
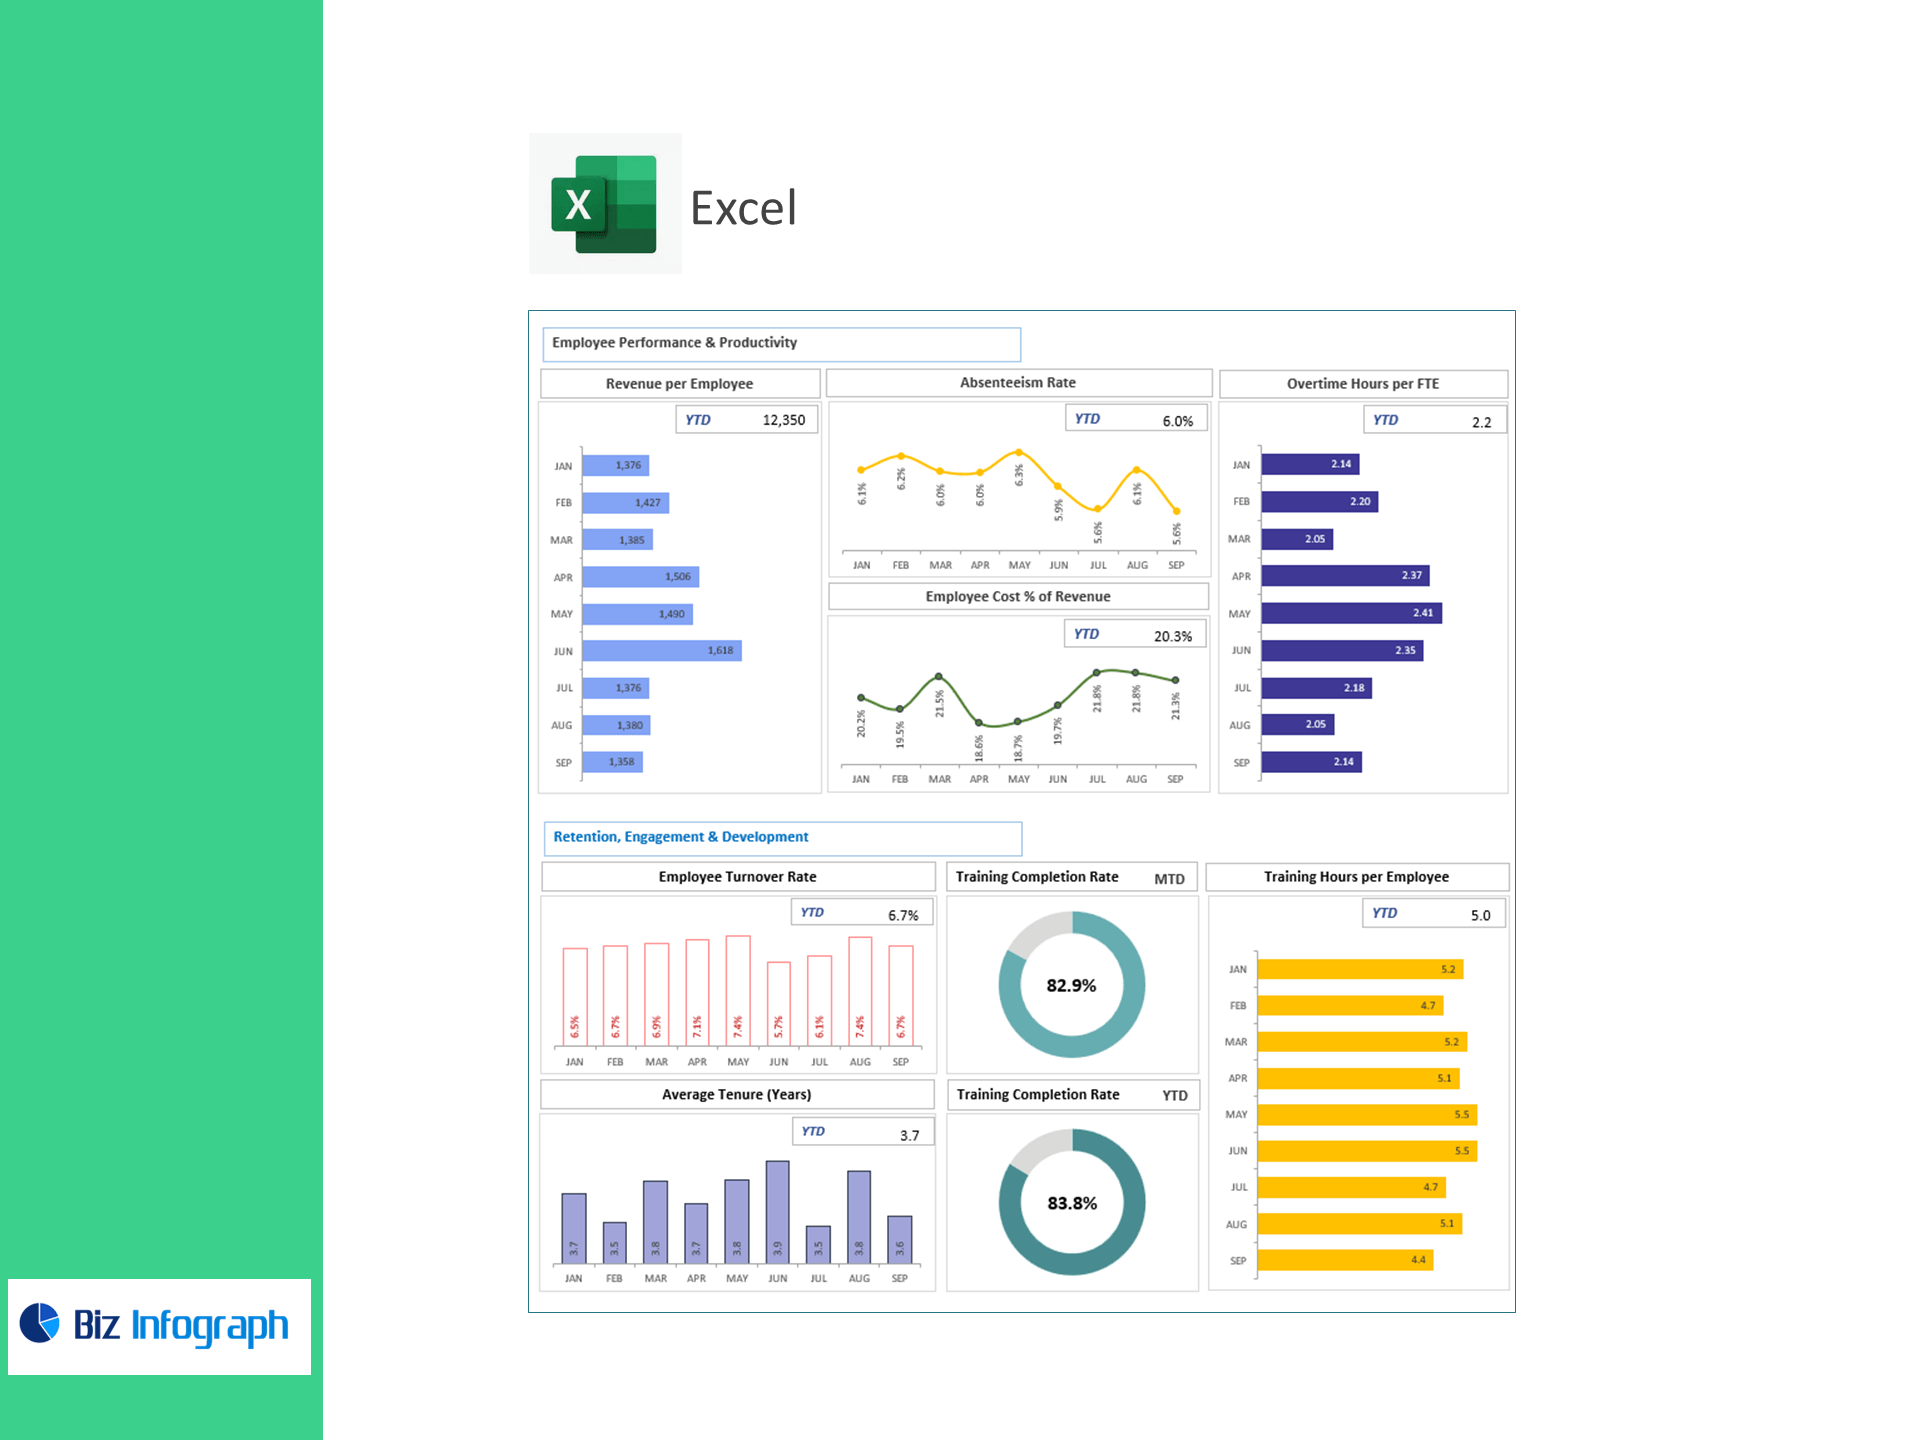
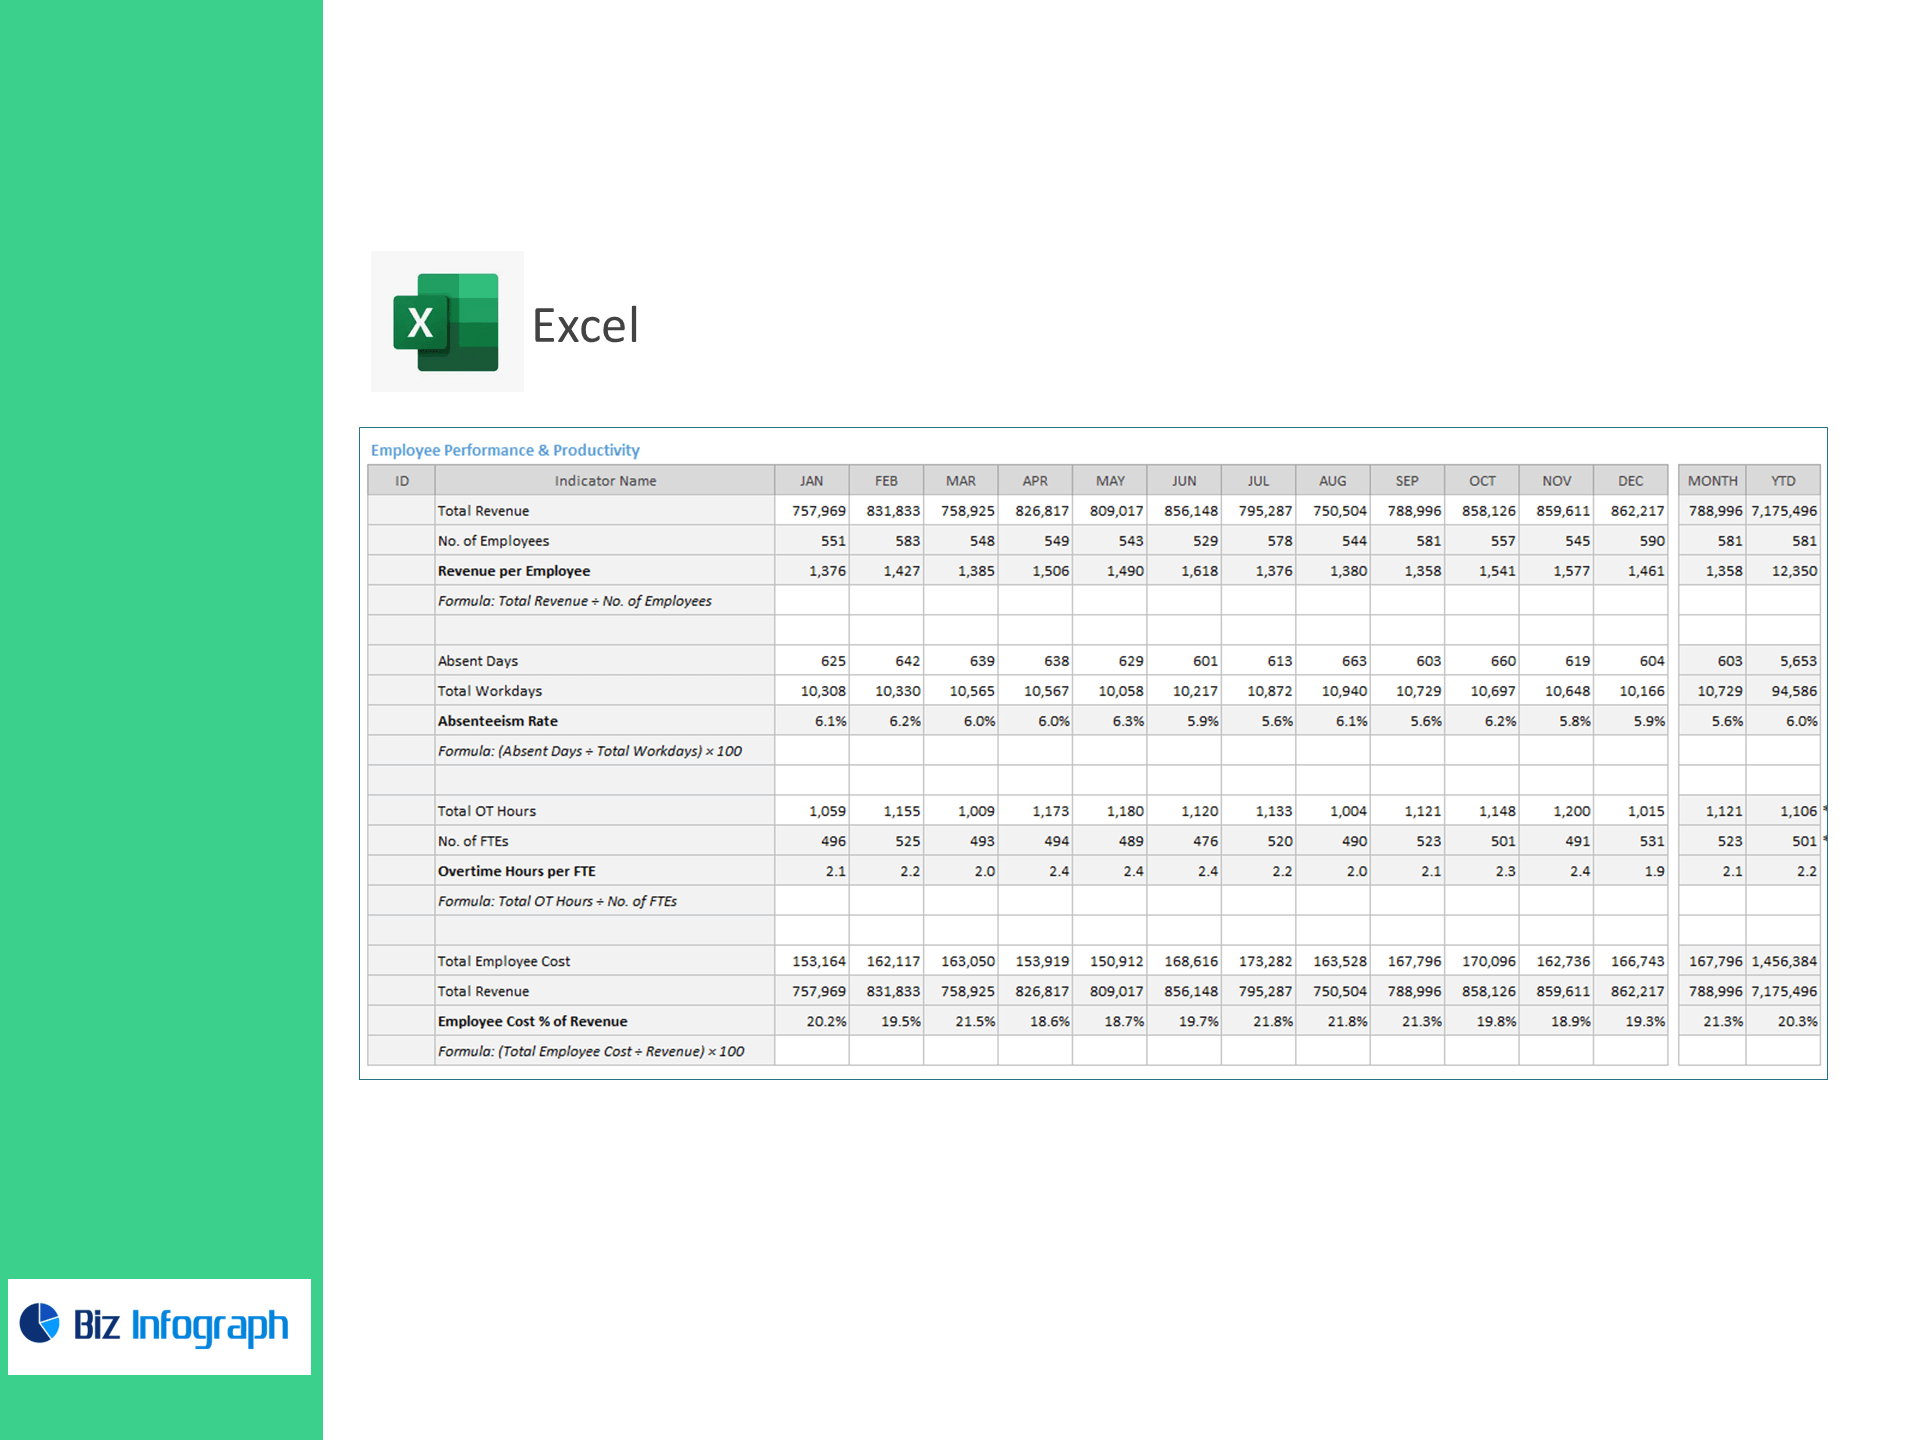
Performance & Productivity
-
Revenue per Employee = Total Revenue ÷ No. of Employees
-
Absenteeism Rate (%) = (Absent Days ÷ Total Workdays) × 100
-
Overtime Hours per FTE = Total OT Hours ÷ No. of FTEs
-
Employee Cost % of Revenue = (Total Employee Cost ÷ Revenue) × 100
Retention, Engagement & Development
-
Employee Turnover Rate (%) = (Exits ÷ Avg. Headcount) × 100
-
Average Tenure (Years) = Σ Total Tenure ÷ No. of Employees
-
Training Completion Rate (%) = (Completed ÷ Assigned Trainings) × 100
-
Training Hours per Employee = Total Training Hours ÷ No. of Employees
What’s inside
-
Executive Dashboard: Tiles for FTEs, Cost per Broker, Utilization, Lease Turnaround, Revenue/Employee, Overtime/FTE, Cost % of Revenue, Turnover, Tenure, and Training.
-
Leasing & Field Ops View: Drill into lease cycle times, billed vs. available hours, and property workload.
-
Comp & Cost Tracker: Broker comp, payroll, and employee cost vs. revenue.
-
Engagement & Development Hub: Absenteeism, turnover, tenure, and training progress by team/site.
-
Assumptions & Targets: Enter KPI targets; automatic “above/below target” highlighting.
-
Clean Data Tables: Import-ready sheets for Headcount, FTEs, Compensation, Leasing, Timesheets/OT, Training, and Revenue.
How it works
-
Paste your CSV/Excel data into the provided tables.
-
Set reporting periods and KPI targets.
-
Review visuals to optimize staffing, reduce overtime, and accelerate leasing.
Who it’s for
Property managers, brokerage leaders, HR/People Ops, and operations directors across residential, commercial, and mixed-use portfolios.
Benefits
-
Accelerate leasing: Track and reduce lease turnaround across sites.
-
Lift utilization: Balance workloads with a clear view of field staff utilization.
-
Protect margins: Keep employee cost % of revenue and overtime in check.
-
Retain talent: Monitor turnover, tenure, and training to reduce attrition.
For ready-to-use Dashboard Templates: