Marketing KPI Dashboard Excel Template - Unlocking Marketing Success
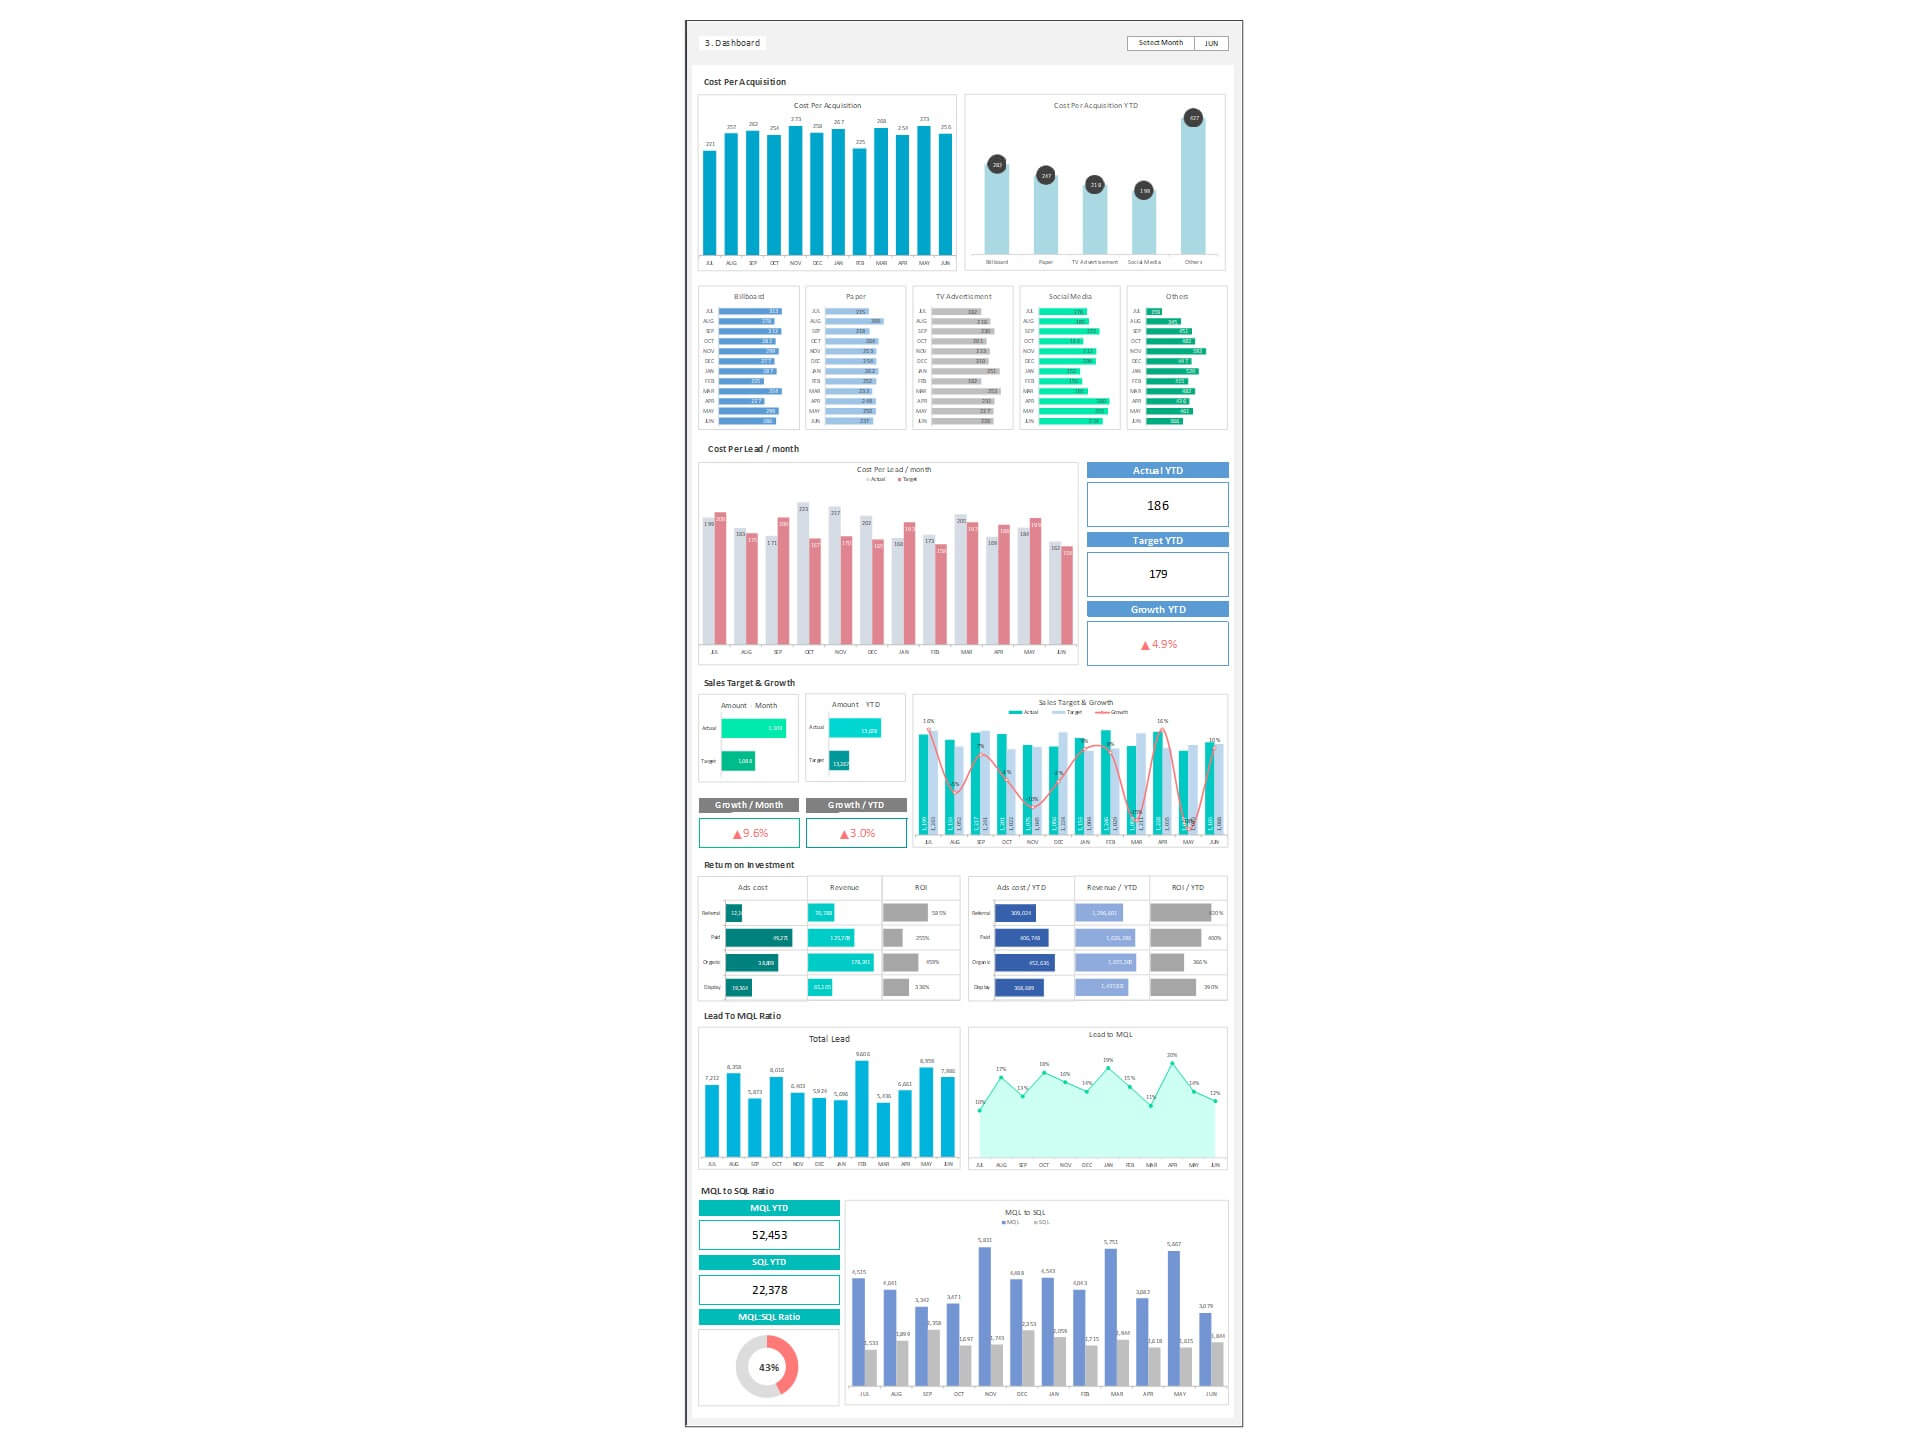
Marketing KPI Dashboard Excel Template is designed to track the most important Key Performance Indicators for the sales department of the company.
Introduction to Marketing KPI Dashboards
The Importance of KPIs in Marketing
Key Performance Indicators (KPIs) are crucial in marketing as they provide measurable values that reflect the effectiveness of marketing strategies and campaigns. They help in identifying what works and what doesn't, allowing for data-driven decisions. A marketing KPI dashboard consolidates these KPIs, offering a visual snapshot of performance across different marketing channels and activities. Utilizing a marketing dashboard enables marketing teams to track essential metrics such as leads, conversion rates, and ROI, ensuring that marketing efforts align with overall business objectives and demonstrate real value.
Overview of Marketing KPI Dashboard Features
A comprehensive marketing KPI dashboard helps marketers to get a high-level overview of a company’s marketing activities, showcasing real-time data across various marketing channels. Essential features include interactive and customizable elements, such as filters for different time periods or campaigns, making it easier for digital marketers to analyze trends and patterns. A well-designed dashboard includes metrics and KPIs for marketing performance, digital marketing efforts, email marketing campaigns, and social media marketing, all in one place, thus enabling the marketing team to monitor and measure the effectiveness of their marketing strategies efficiently.
Essential Components to Create a Marketing Dashboard
Identifying Key Marketing Performance Indicators
Selecting the right KPIs is crucial for the effectiveness of a marketing dashboard. Essential marketing KPIs to measure include lead generation numbers, conversion rates, website traffic sources, social media engagement rates, email open and click-through rates, and overall ROI. These metrics should align with the marketing goals and objectives, providing clear insights into the performance and effectiveness of marketing campaigns and strategies. By tracking these KPIs, marketing teams can understand the impact of their marketing efforts and make informed decisions to optimize future campaigns.
Designing Your Marketing Dashboard for Clarity and Efficiency
The design of your marketing dashboard should prioritize clarity and efficiency to enable quick understanding and decision-making. A well-designed dashboard presents complex information in an accessible format, using charts, graphs, and color coding to highlight key data points. It should be organized logically, with the most important metrics at the top or center and less critical data on the periphery. Customization features, such as the ability to toggle between different data sets or time frames, enhance the dashboard’s usability and relevance for different users within the marketing department.
Step-by-Step Guide to Building Your Digital Marketing Dashboard
Selecting the Right Analytics Dashboard Template
Choosing the right dashboard template is the first step to creating and using a marketing KPI dashboard. The marketing dashboard templates should be compatible with the tools and software your marketing team uses, such as Excel, Google Sheets, or specialized dashboard tools. It should offer the flexibility to customize layouts, colors, and data sources to match your specific marketing KPIs and aesthetic preferences. Additionally, the template should support integration with data from different channels and marketing analytics platforms, allowing for a comprehensive view of all marketing activities.
Incorporating Key Metrics for a Comprehensive Overview
Once the template is selected, the next step is to incorporate key metrics that offer a comprehensive overview of the marketing performance dashboard. This includes digital marketing metrics like website traffic, social media engagement, and SEO performance, as well as traditional metrics like lead conversion rates and marketing ROI. The dashboard should allow for easy updates and real-time data retrieval to ensure that the marketing team has access to the latest information. Incorporating a mix of historical and real-time data helps in identifying trends and making timely adjustments to marketing strategies.
Integrating Advanced Analytics in Your Dashboard
Leveraging Digital Marketing Data for Enhanced Insights
Incorporating digital marketing data into your dashboard allows for a deeper understanding of online marketing activities and their effectiveness. This should include data from your digital marketing dashboard, such as traffic from various online sources, engagement rates from social media platforms, and performance metrics from SEO efforts. Integrating these analytics provides a holistic view of digital marketing performance, enabling the marketing team to pinpoint successful strategies and areas needing improvement. Advanced analytics features, like clickstream analysis or heat maps, can also offer insights into customer behavior, further enhancing marketing strategies.
Utilizing Google Analytics with Your Excel-based Marketing KPI Dashboard
Incorporating Google Analytics data into your Excel-based Marketing KPI Dashboard can significantly enhance your understanding of online marketing performance. By exporting key Google Analytics metrics into Excel, you can analyze website traffic, user engagement, conversion rates, and more, alongside other marketing KPIs. This approach allows for a comprehensive analysis within a familiar environment, enabling detailed comparisons and trend identification over time. Customizing your Excel template to integrate Google Analytics data helps the marketing team perform in-depth analysis, track the effectiveness of marketing campaigns, and make data-driven decisions. By leveraging Excel's analytical tools, you can dissect customer behavior, assess campaign success, and refine strategies to improve traffic and conversions, all within one unified dashboard.
Marketing Dashboard Examples for Diverse Channels
Crafting a Social Media Dashboard for Engagement Metrics
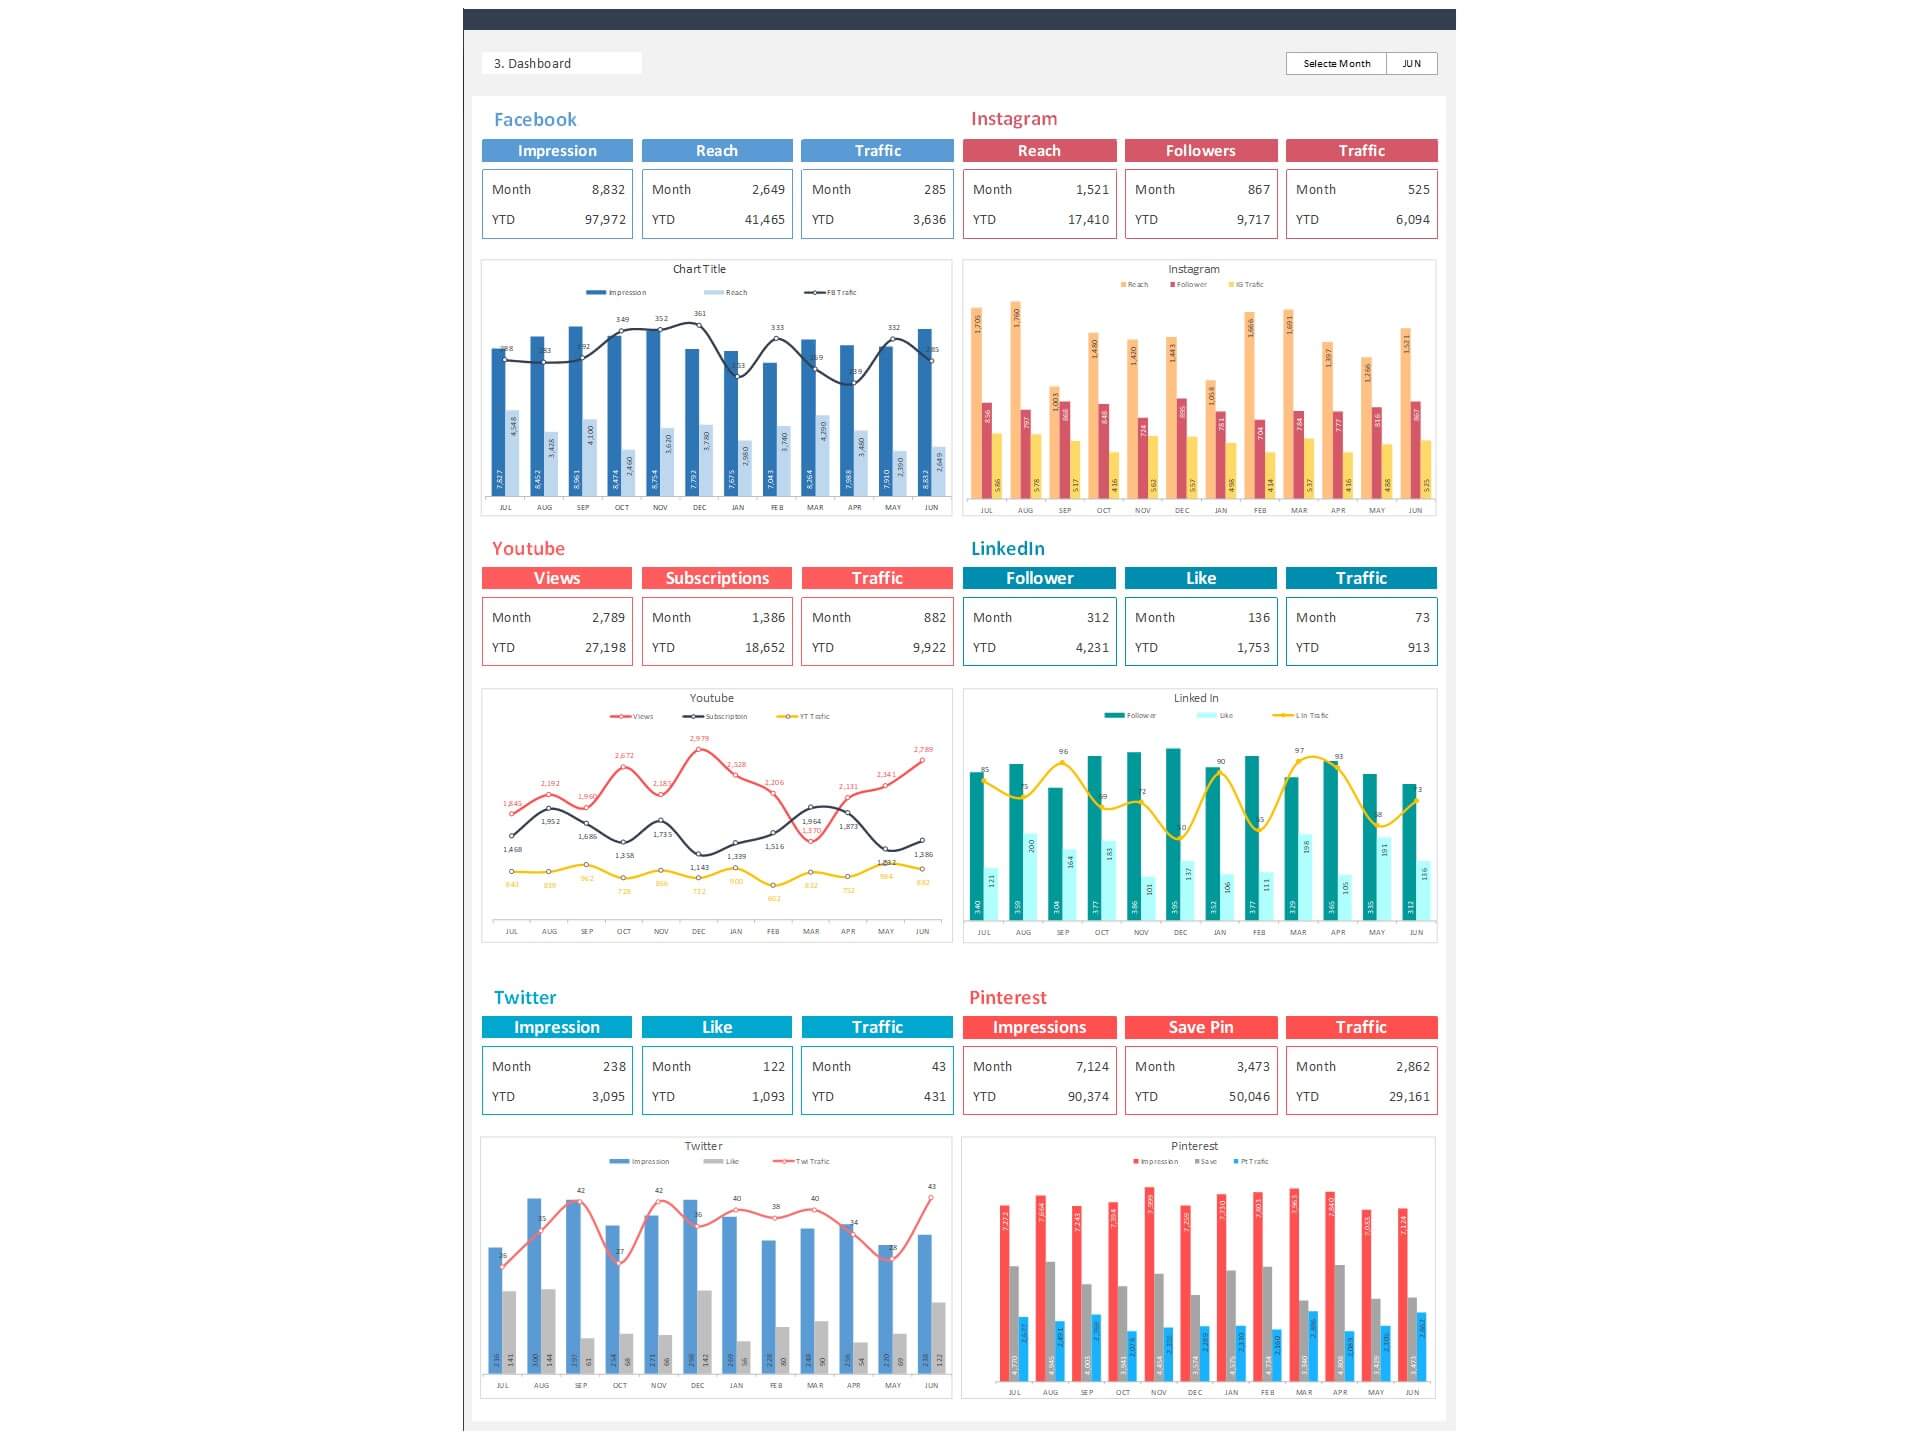
A social media dashboard focuses on metrics specific to platforms like Facebook, Twitter, Instagram, and LinkedIn. It should track engagement metrics such as likes, shares, comments, and follower growth. Additionally, it can monitor campaign performance, brand mentions, and audience demographics. A well-crafted social media dashboard makes in understanding how different content and strategies resonate with the audience, helping in refining social media marketing approaches for better engagement and reach.
Developing an SEO Dashboard for Web Performance Tracking
An SEO dashboard is essential for monitoring website performance in search engine results. It should include metrics like search rankings, organic traffic, bounce rates, and backlink quality. This specialized dashboard allows marketers to assess the effectiveness of their SEO strategies and make necessary adjustments to improve search visibility and drive more organic traffic to their website.
Designing an Email Marketing Dashboard for Campaign Analysis
An email marketing dashboard focuses on metrics related to email campaigns, such as open rates, click-through rates, conversion rates, and unsubscribe rates. It helps in analyzing the performance of different email marketing strategies, understanding subscriber behavior, and identifying the types of content that generate the best responses. By monitoring these metrics, marketers can optimize their email marketing campaigns for better engagement and conversions.
Utilizing Your Marketing KPI Dashboard for Maximum Impact
Regular Monitoring and Updates for Real-Time Insights
To ensure that your marketing dashboard remains effective, it's crucial to monitor and update it regularly. This means checking that the data feeds are functioning correctly, that the metrics displayed are still relevant, and that the dashboard reflects the current marketing strategies and objectives. Regular updates ensure that the marketing team has access to the latest data for making informed decisions.
Analyzing Data to Drive Marketing Decisions and Strategies
The true value of a marketing KPI dashboard lies in its ability to provide insights that drive marketing decisions and strategies. By analyzing dashboard data, marketers can identify successful tactics, pinpoint areas for improvement, and test new ideas. The dashboard should enable the marketing team to track the impact of changes in real-time, allowing for agile marketing that responds quickly to market dynamics.
Marketing Dashboard Management and Best Practices
Ensuring Your Dashboard Meets the CMO Dashboard Needs
A successful marketing dashboard must align with the needs and objectives of the marketing team. This involves customizing the dashboard to include metrics that are most relevant to the team's goals and ensuring that it provides clear, actionable insights. Regular feedback from team members can help identify any gaps or areas for improvement.
Sharing Insights and Collaborating with Your Marketing Team
Effective dashboards are not just for individual use; they should facilitate sharing insights and collaborating across the marketing team and beyond. This might involve setting up regular dashboard reviews, integrating dashboard data into marketing reports and presentations, or using the dashboard as a basis for strategic discussions. By making the dashboard a central part of the marketing team’s workflow, you can ensure that everyone is aligned and working towards the same objectives.
Key Features our Marketing KPI Dashboard:
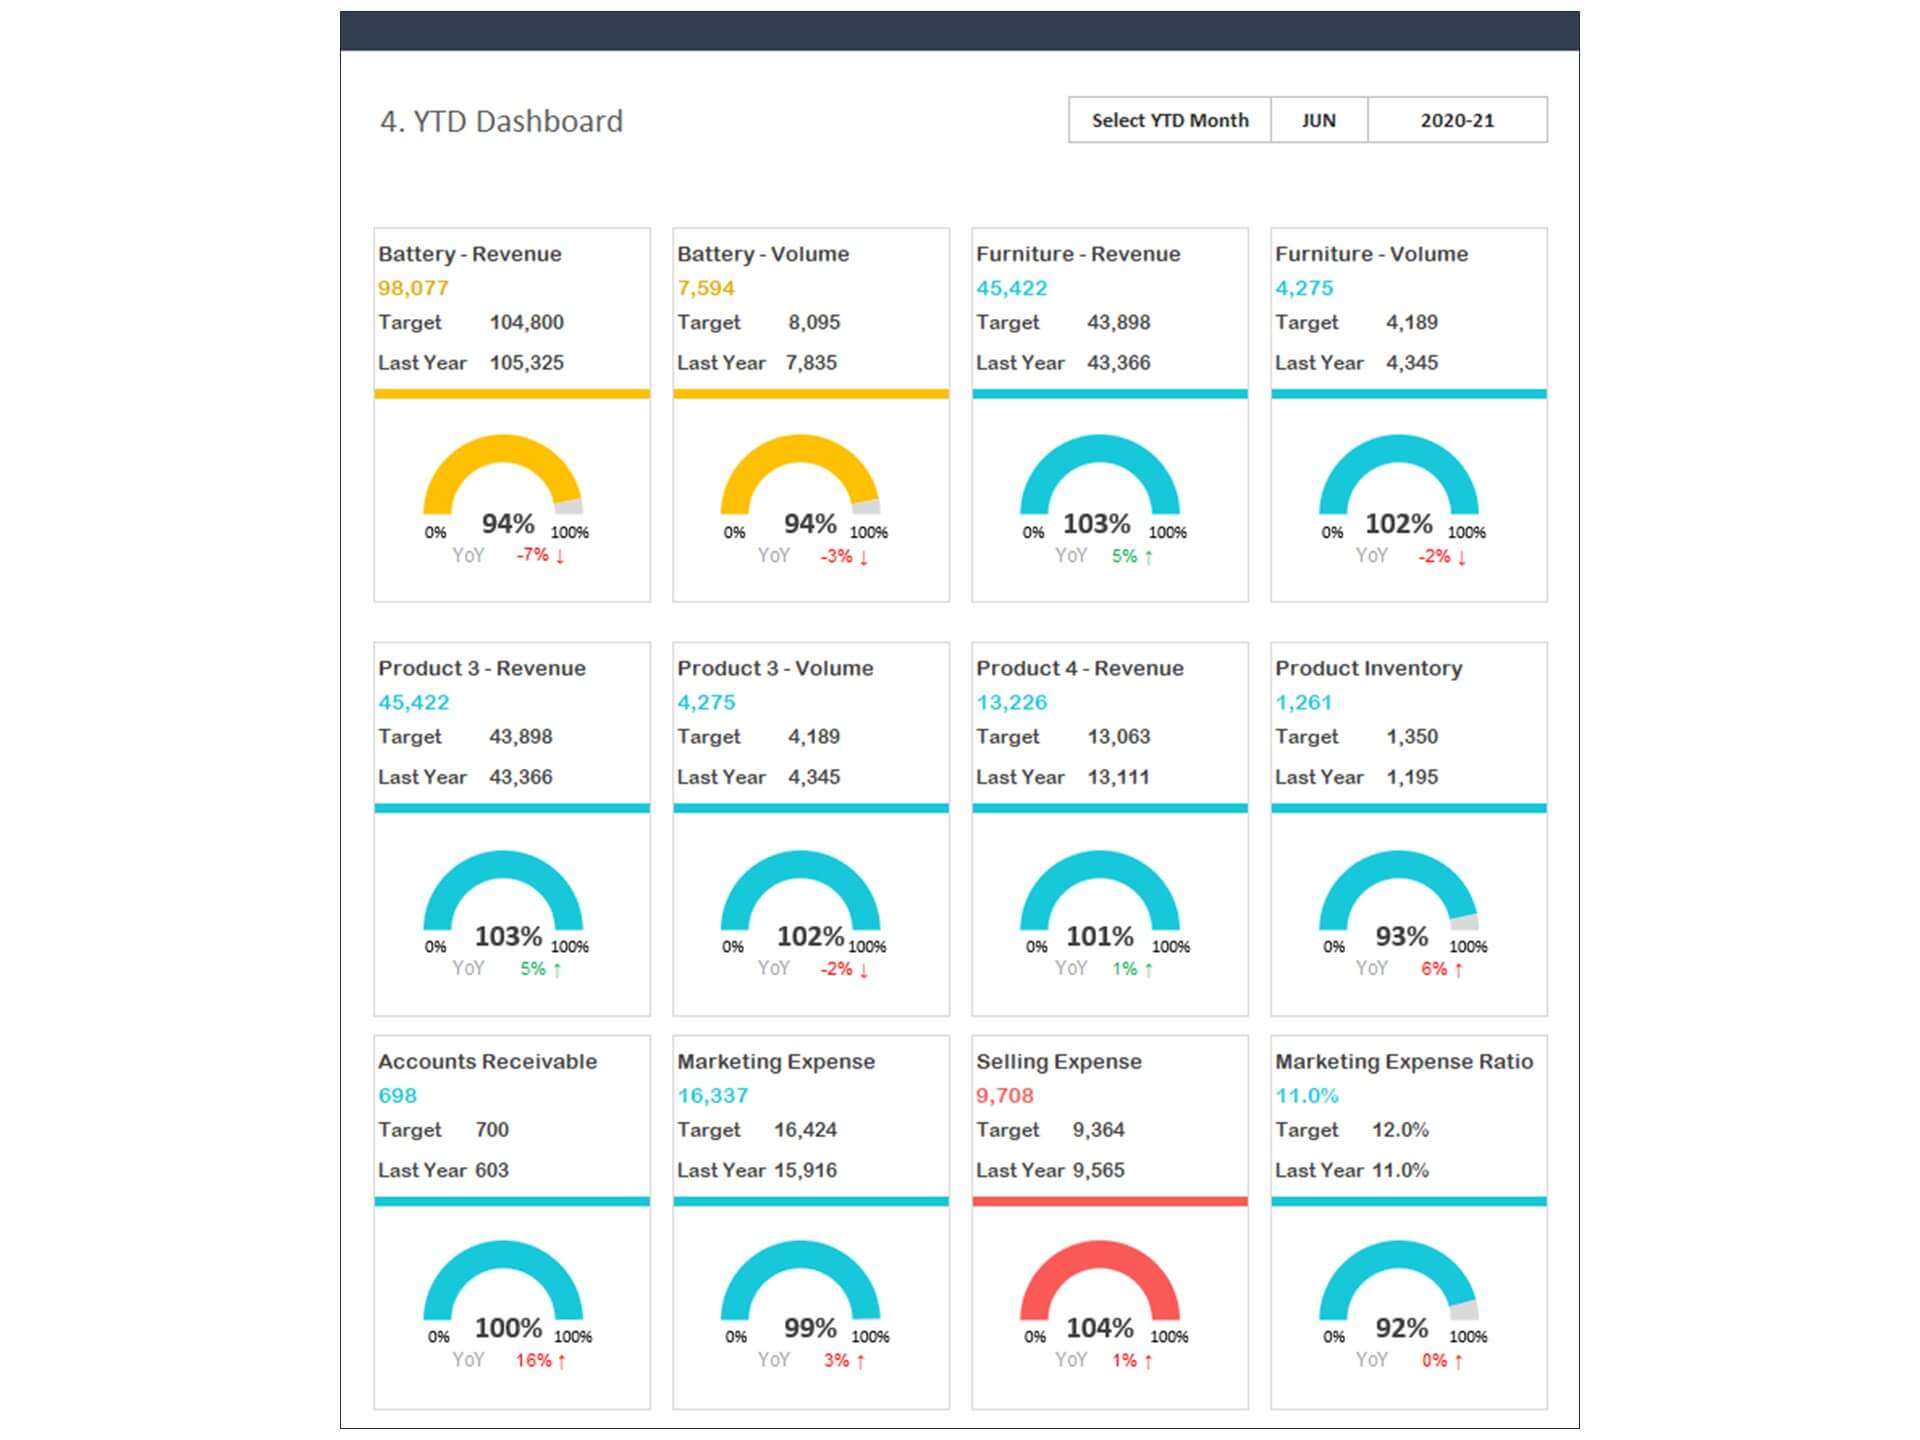
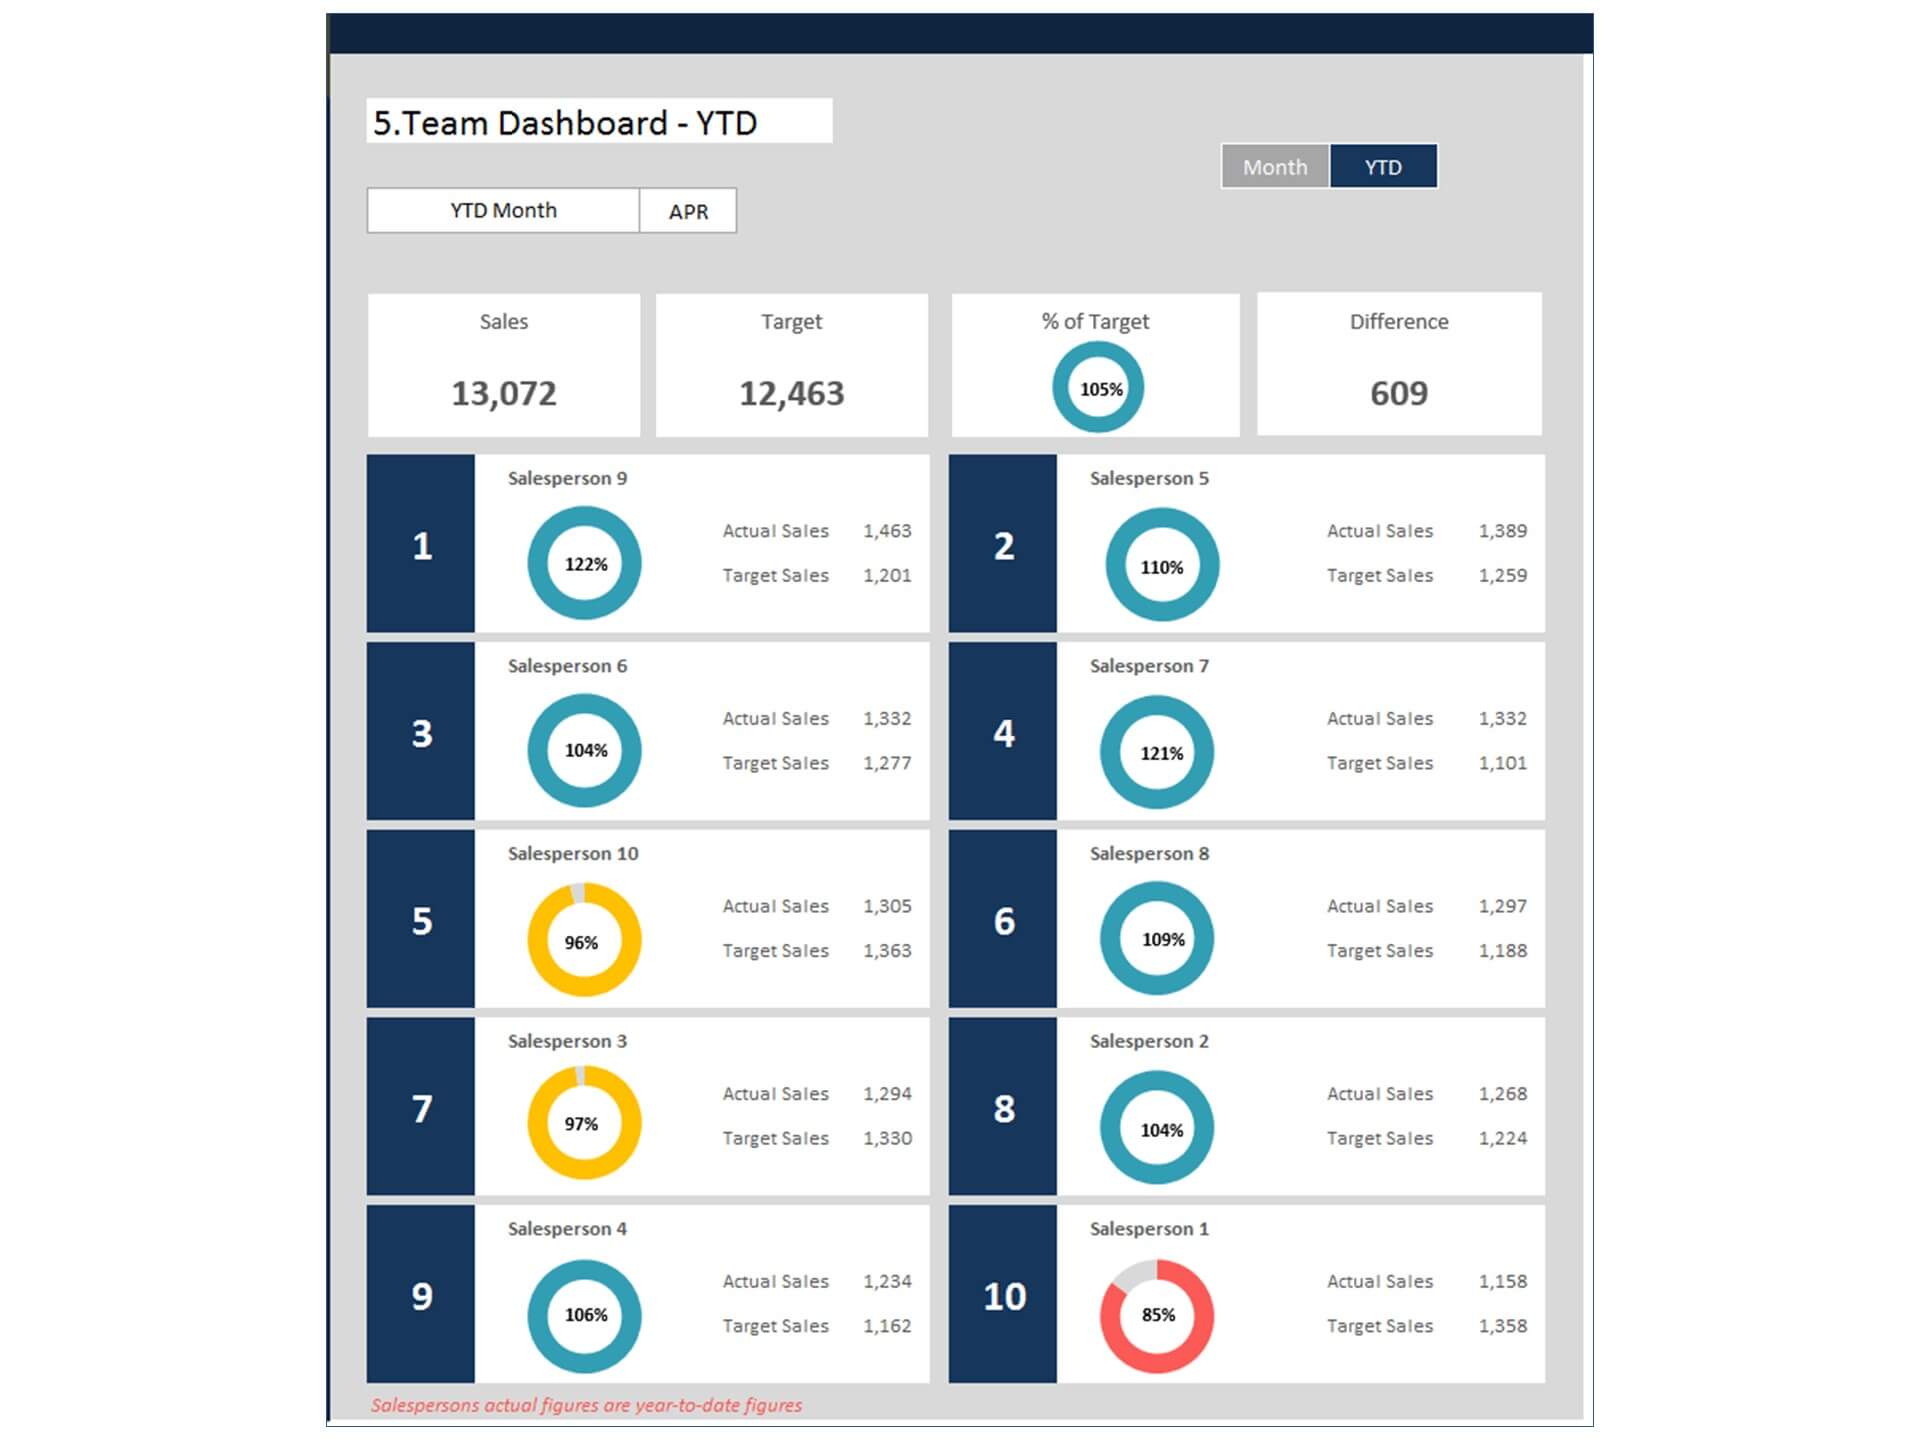
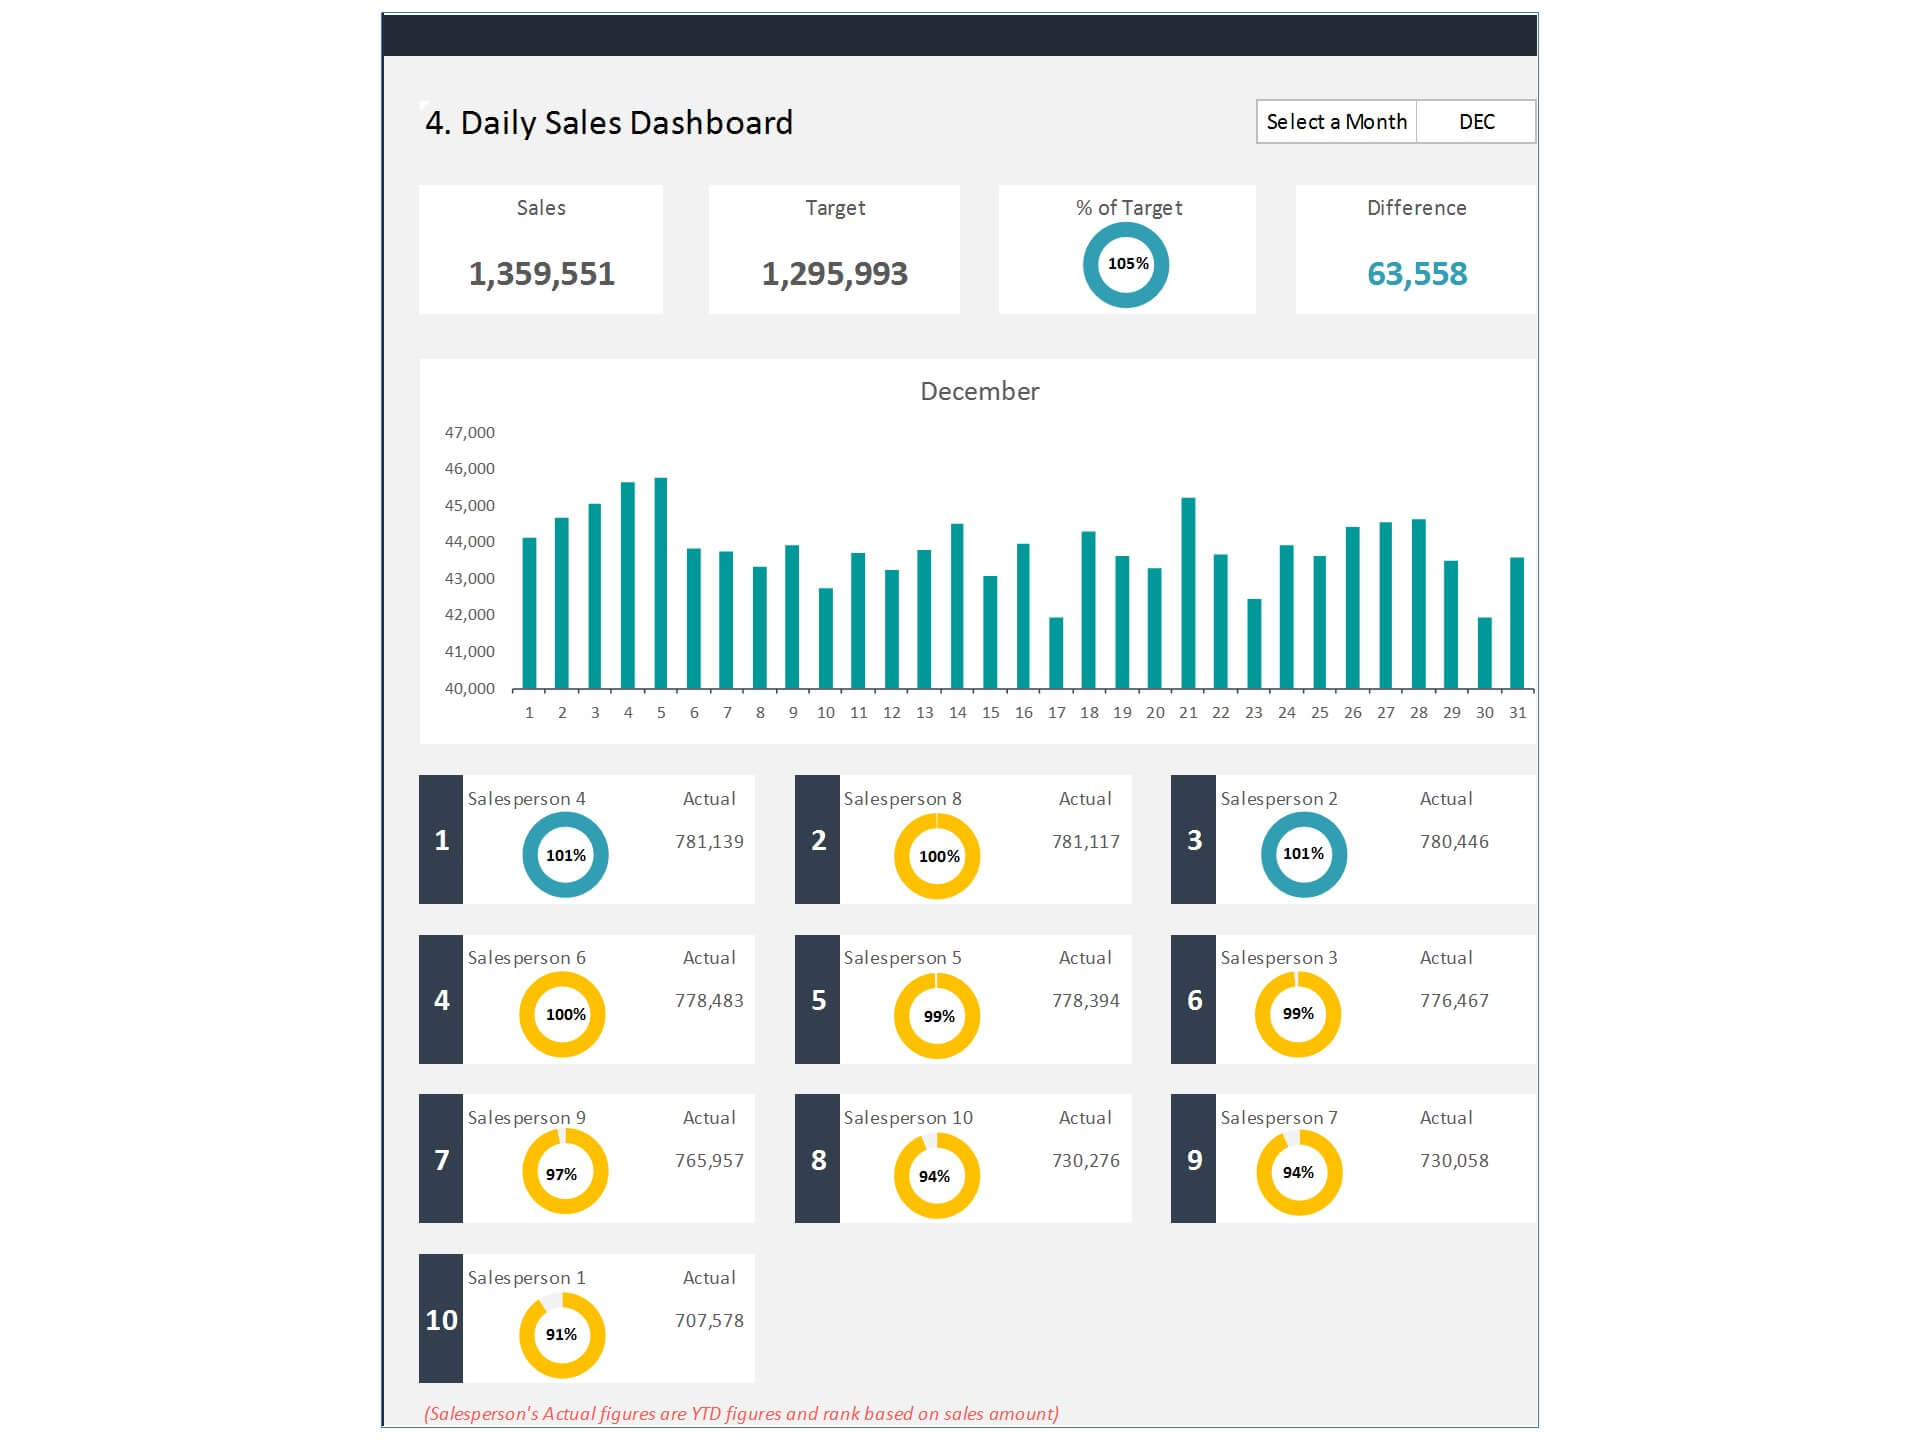
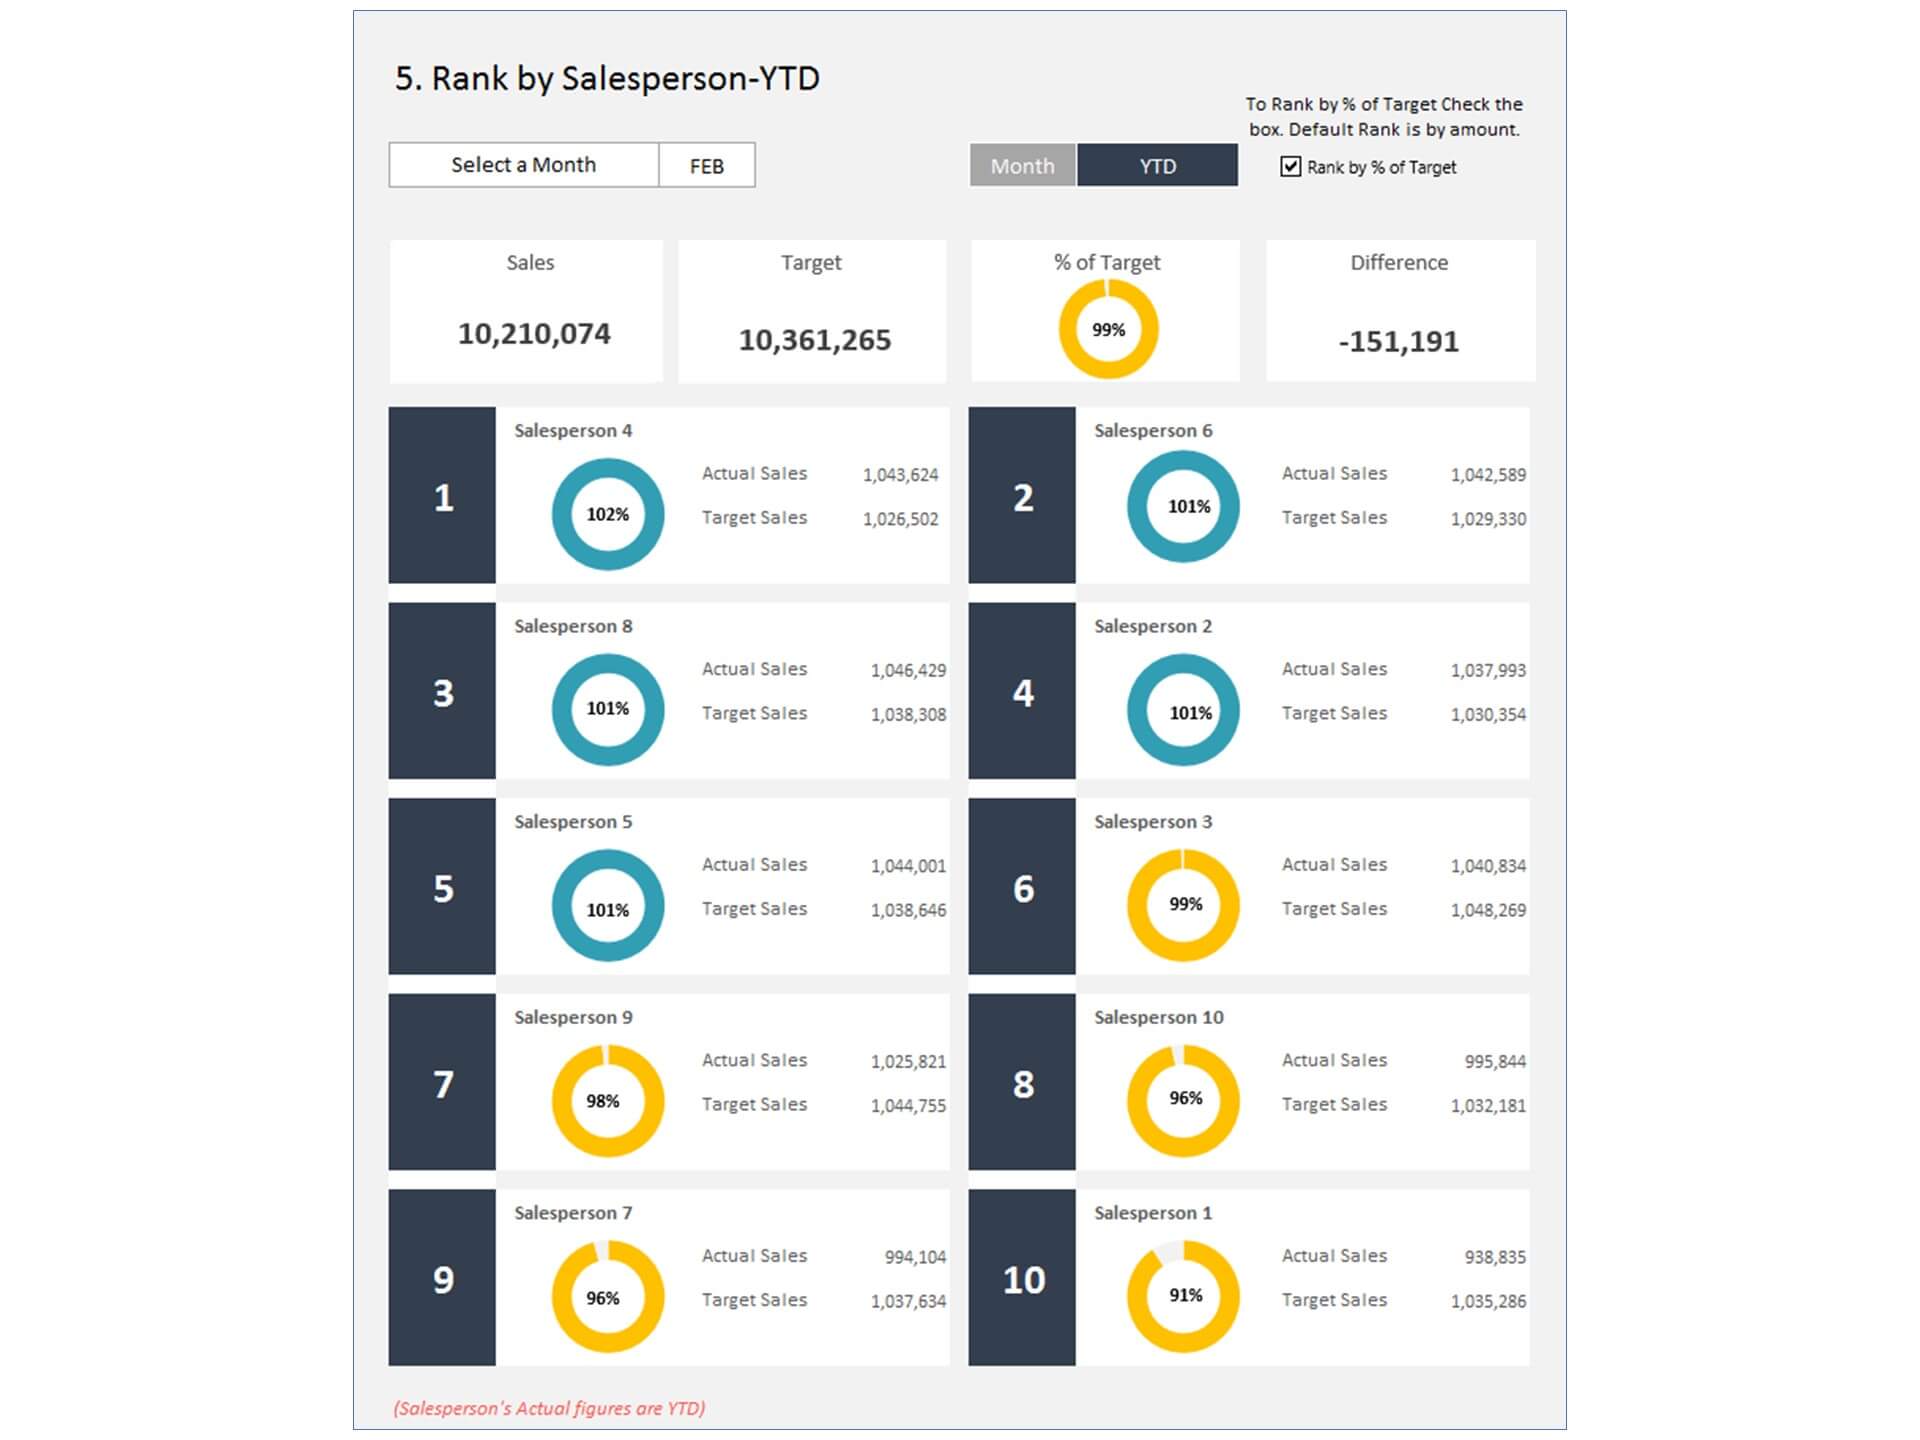
- Provides key financial insights for the Sales team with details of targeted vital performance indicators
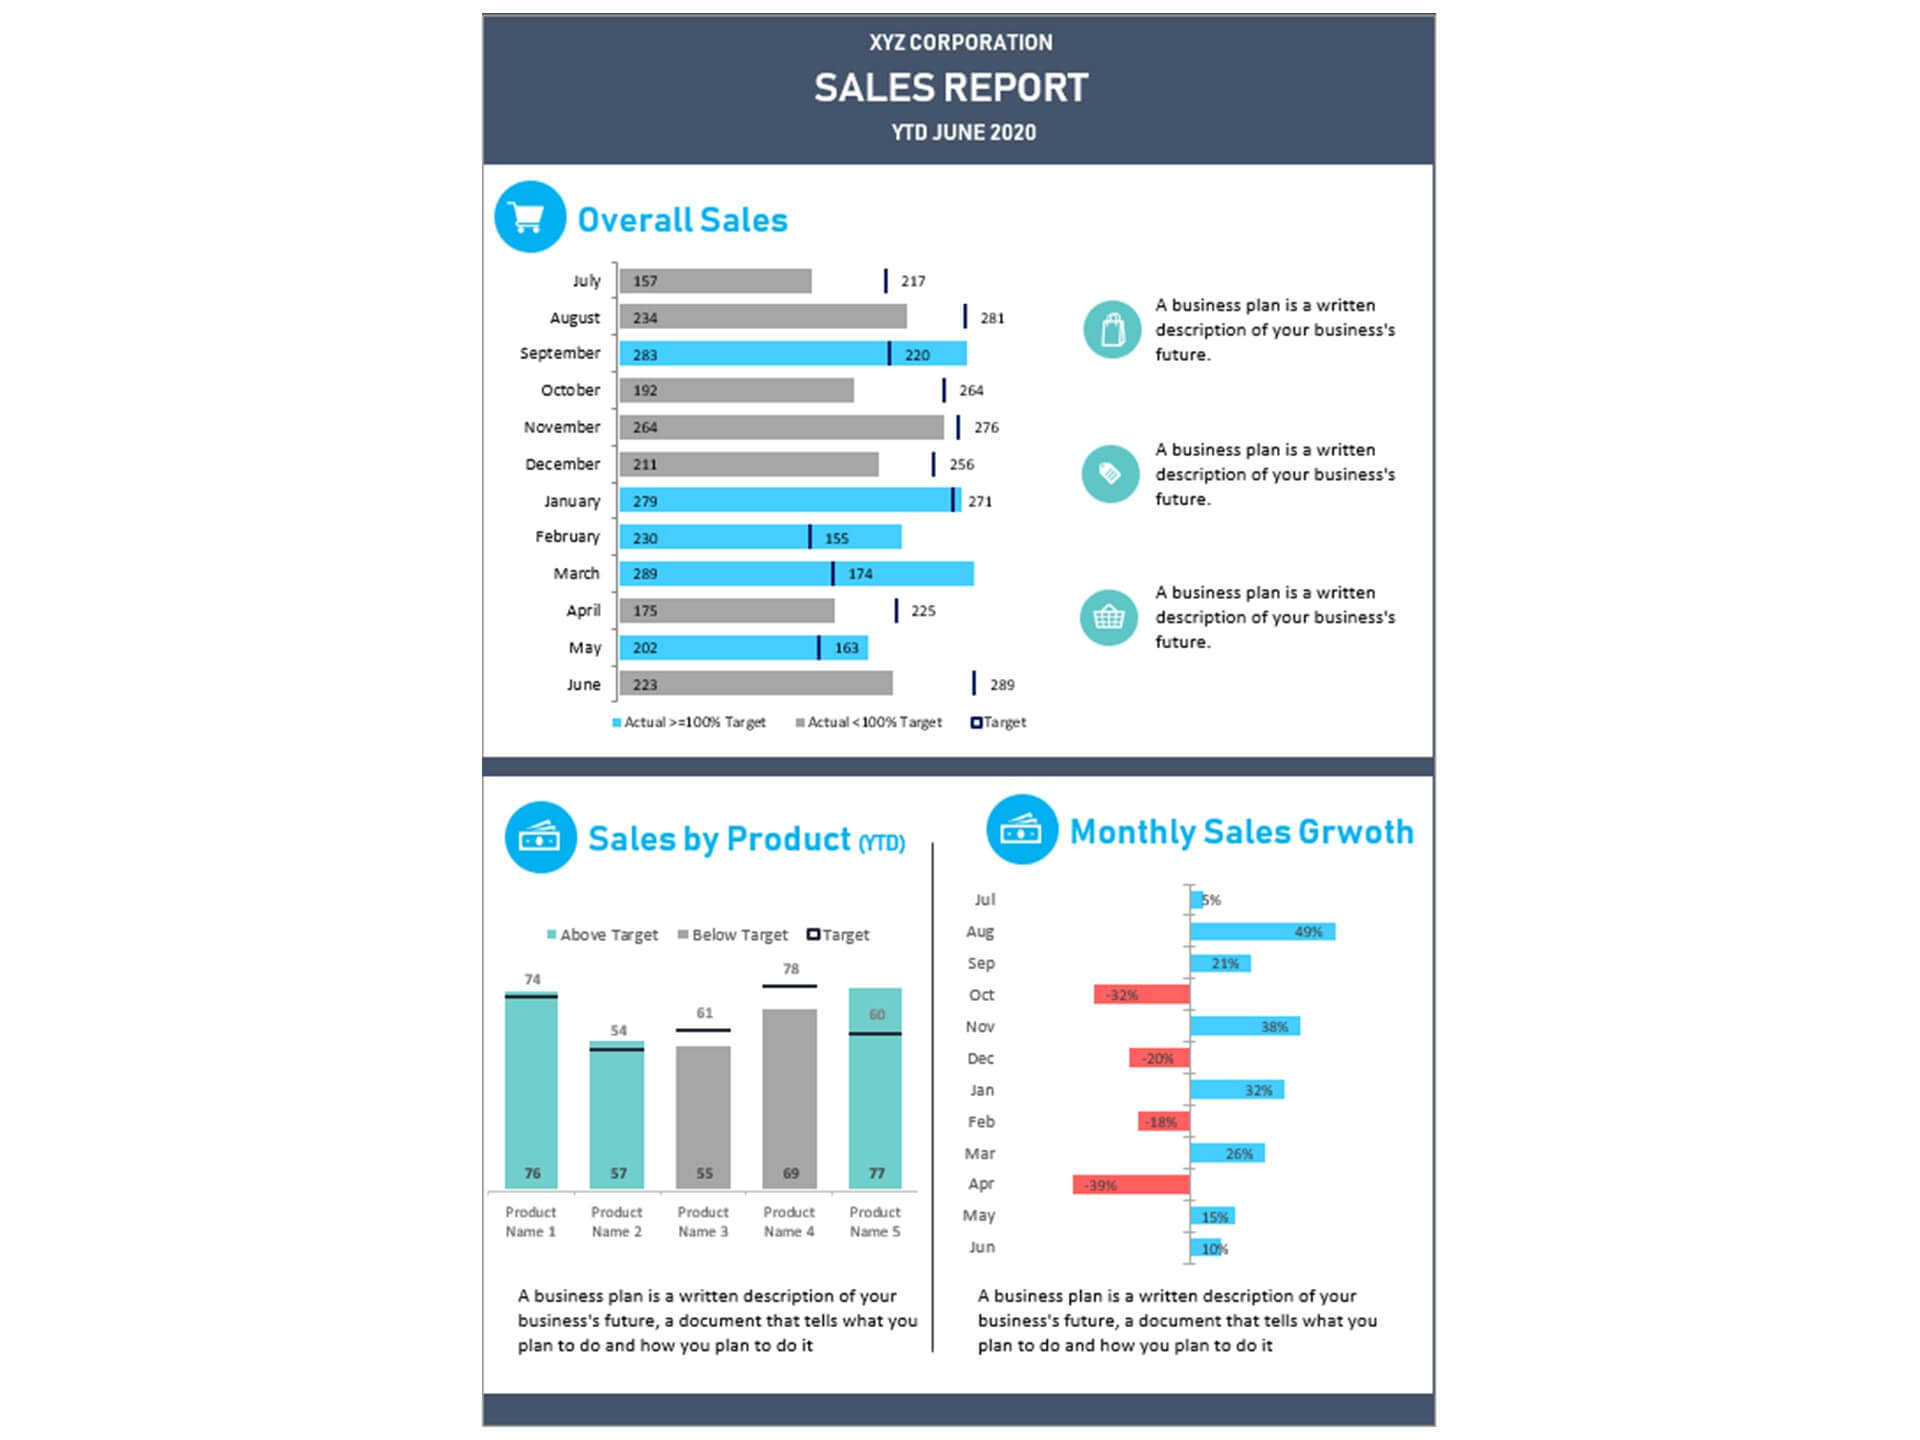
- Beautiful dashboard and reports to display performance KPI’s
- Fully editable, easy to use, template with sample data
- Eye-catching design and customizable
- Change the sample data with your data
- Spreadsheets ready for printing without Biz Infograph logo
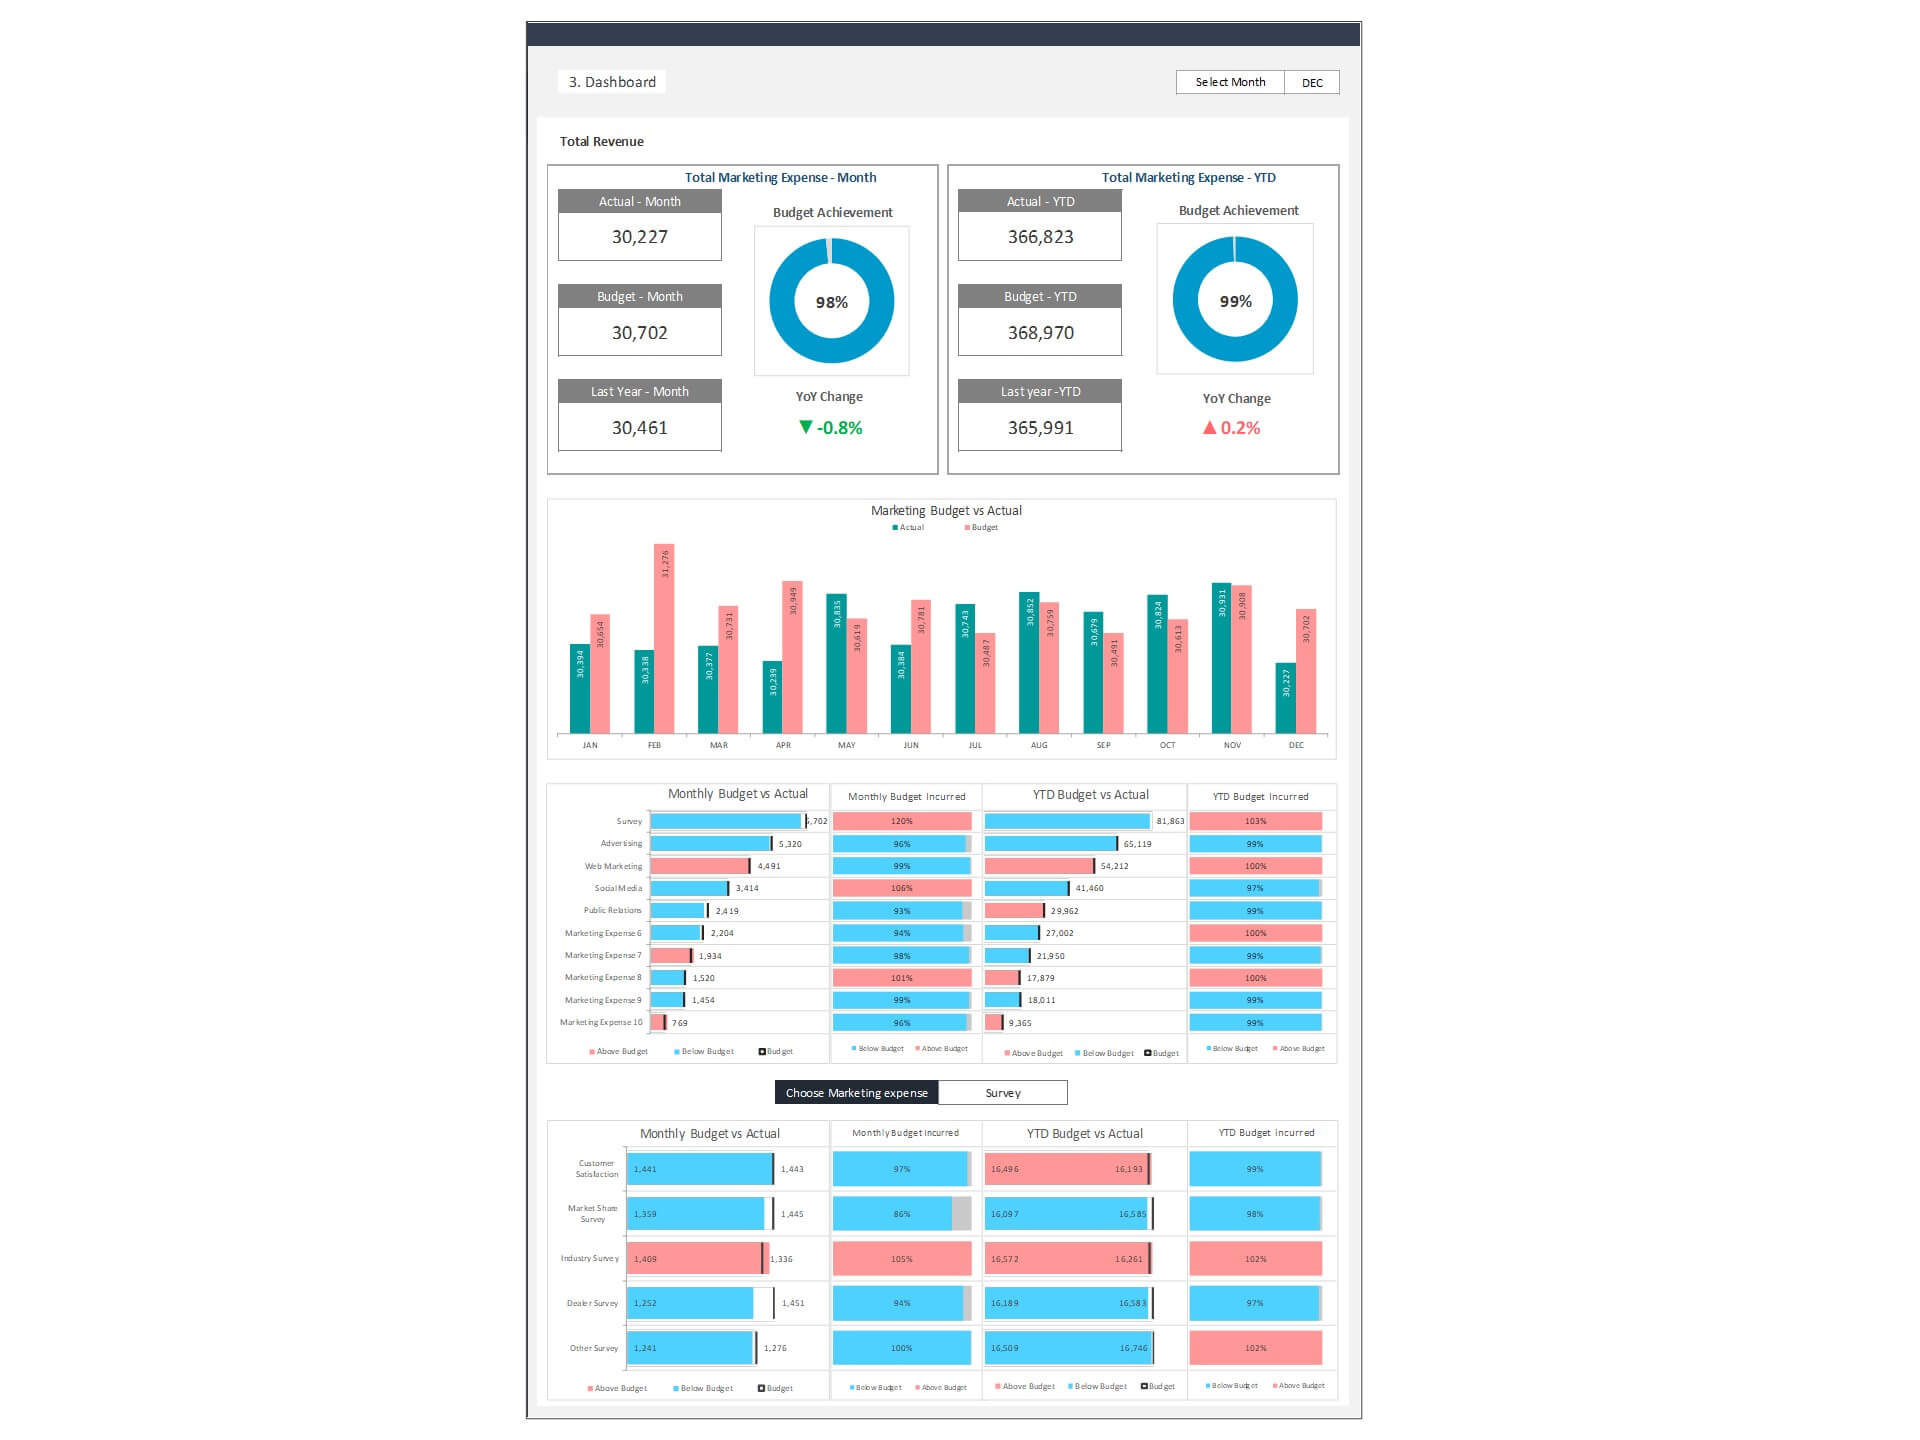
- Consolidate key financial performance indicators in one dashboard
- No monthly fees
- Immediate download
- No VBA, no Macro
- No installation necessary
- Professionally designed
What is included in this dashboard template?
- Just plug your data, the dashboard will be ready instantly and start using.
- A text file which contains a password to view and edit the formula
- A guide to unlocking all the elements in the dashboard
Professional Support:
- Video tutorial guide on how to navigate and use Marketing KPI Dashboard Template
- Professional service to customize dashboard template in excel as per business need
- Help and support in post-purchase
- Payment secured by Stripe and PayPal (no PayPal account needed)
A brief guide to using the dashboard template:
- Open the dashboard template
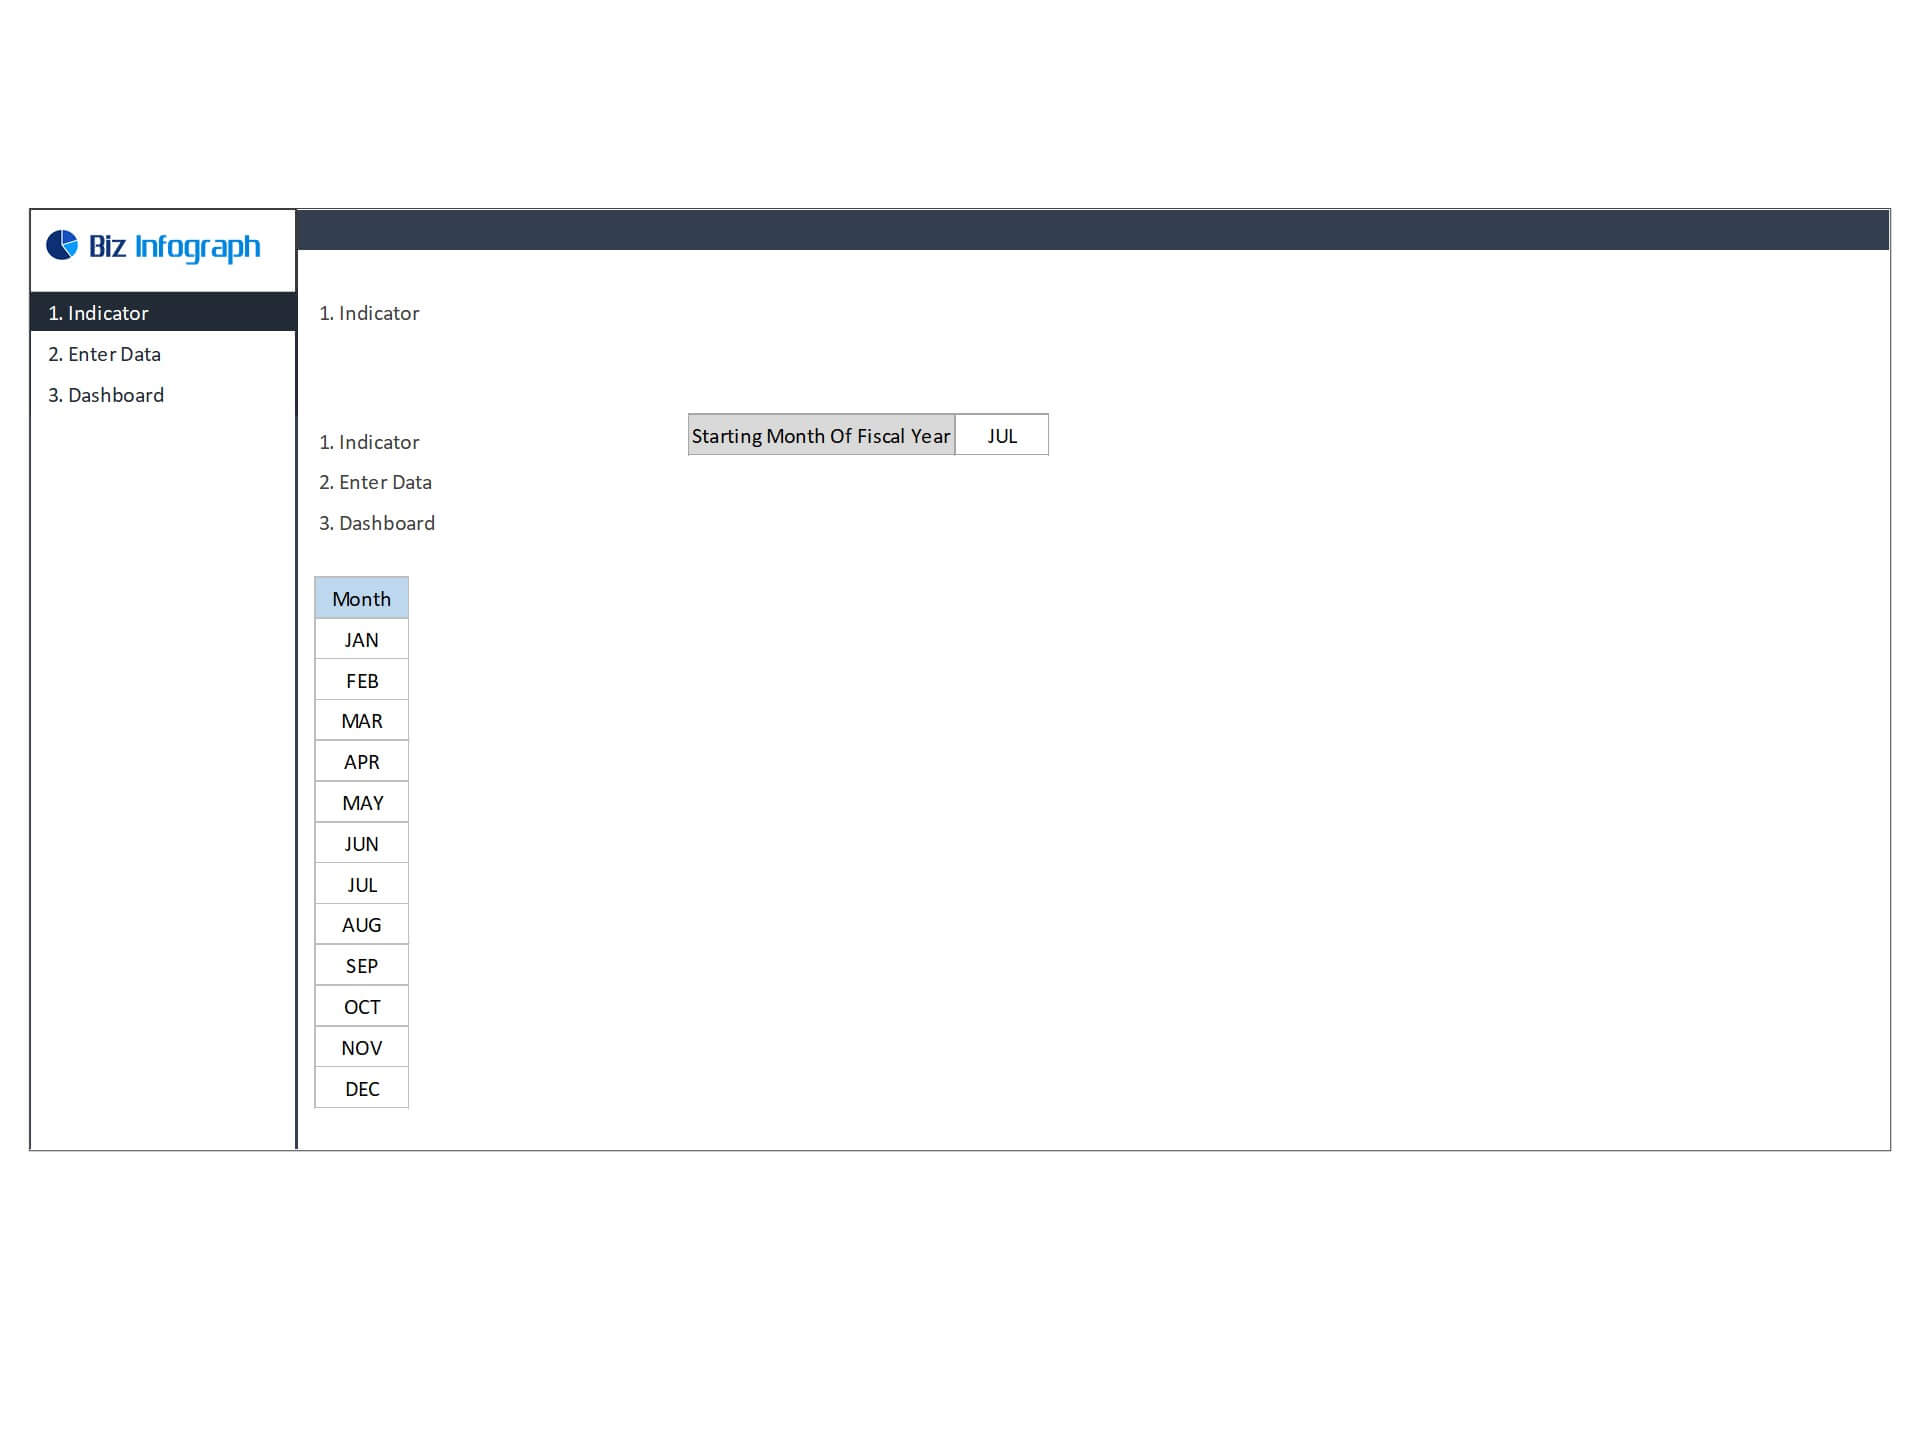
- Go to ‘Indicators’ menu – choose the start month of the fiscal year (i.e. Jan, Feb, Jul, etc.)
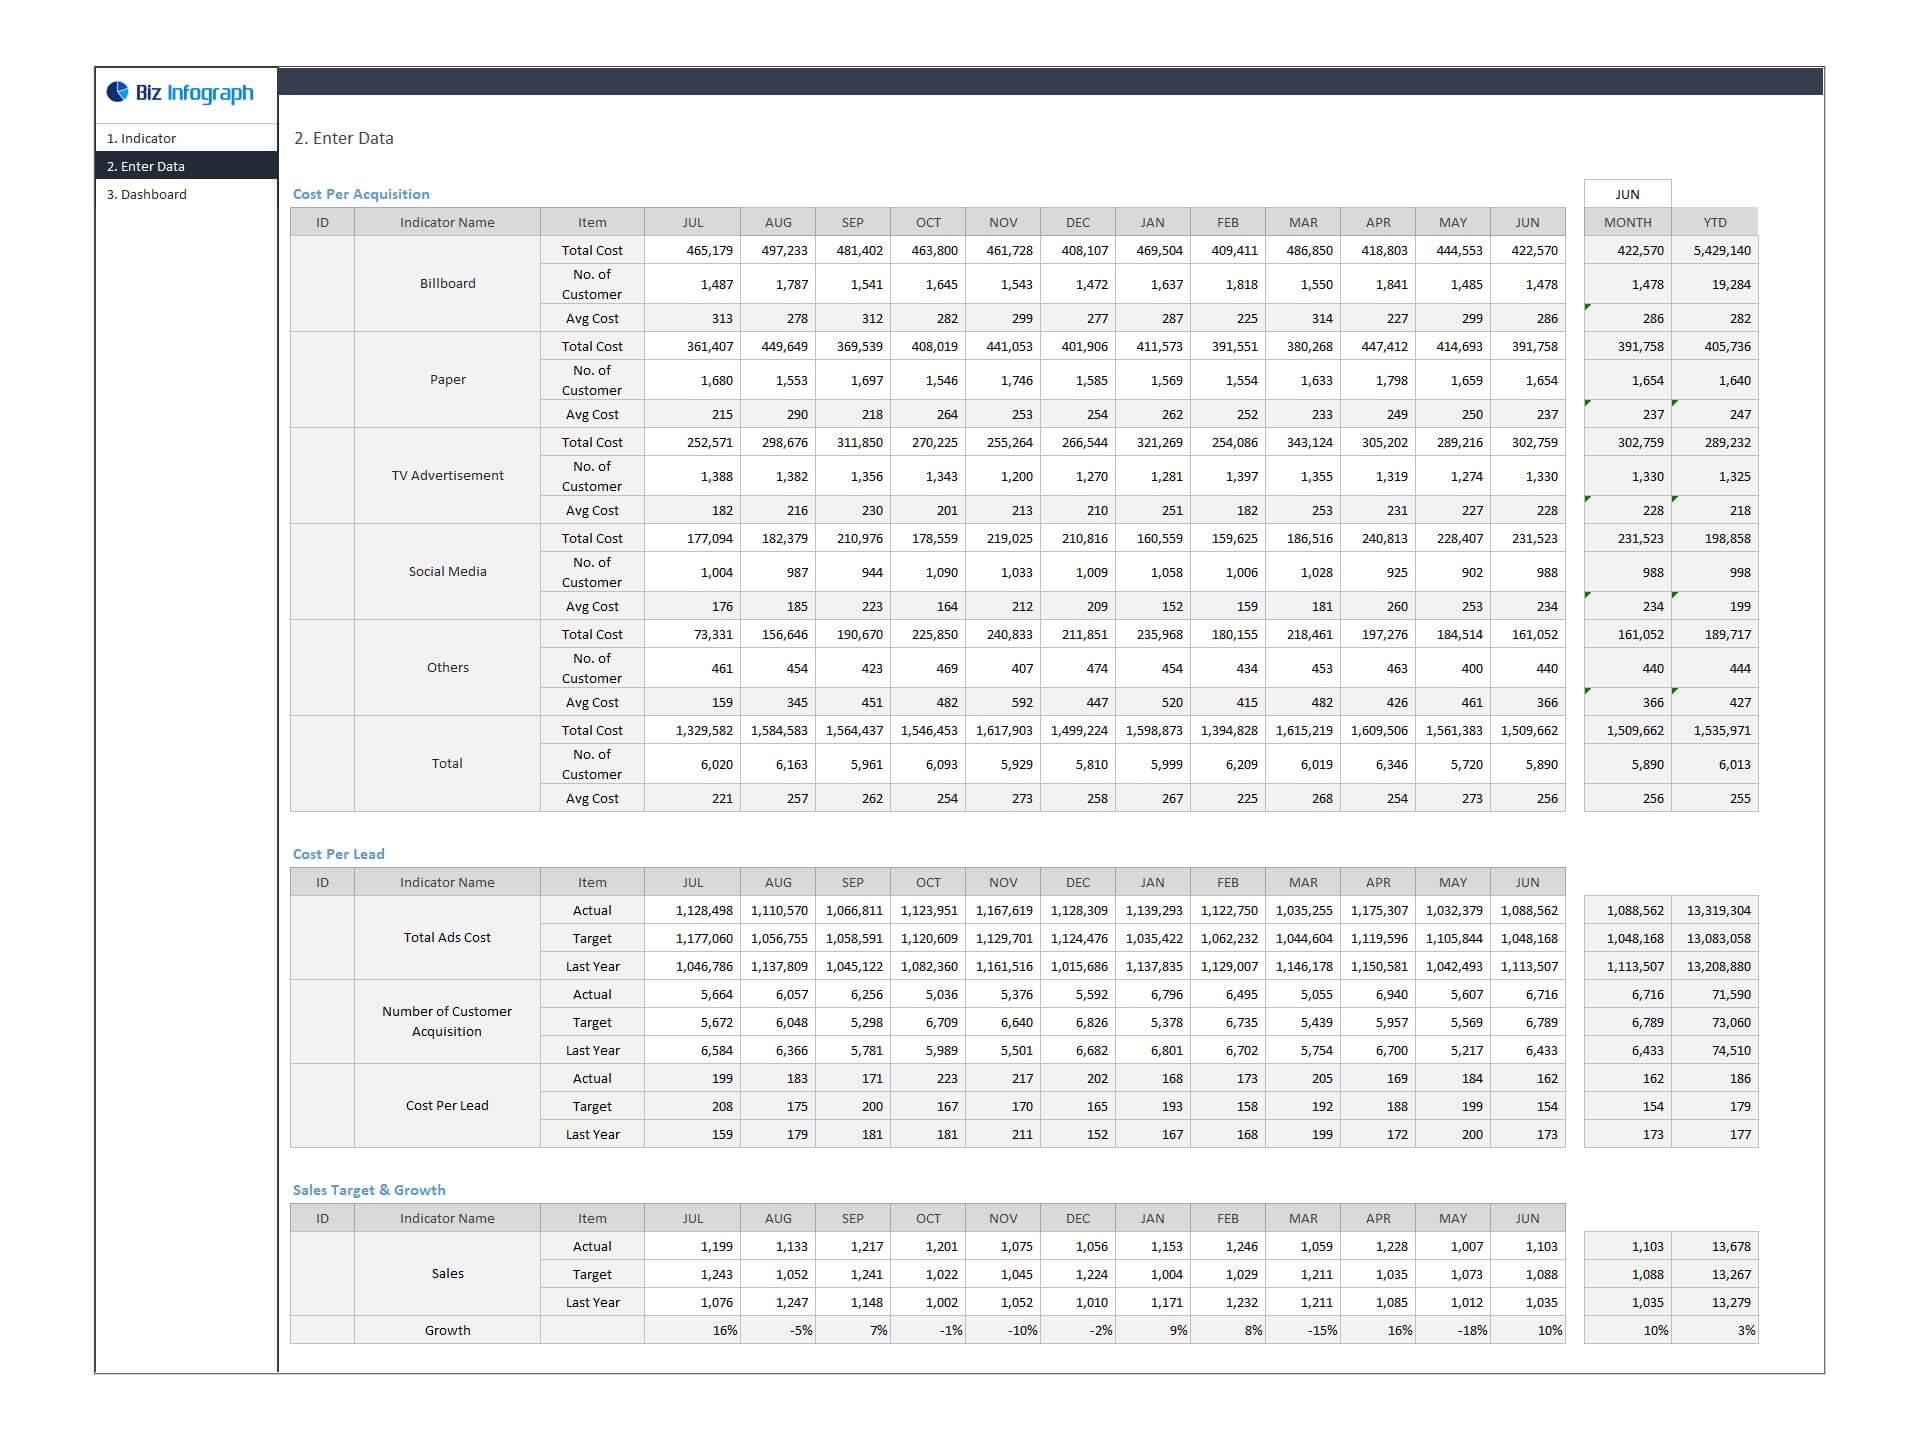
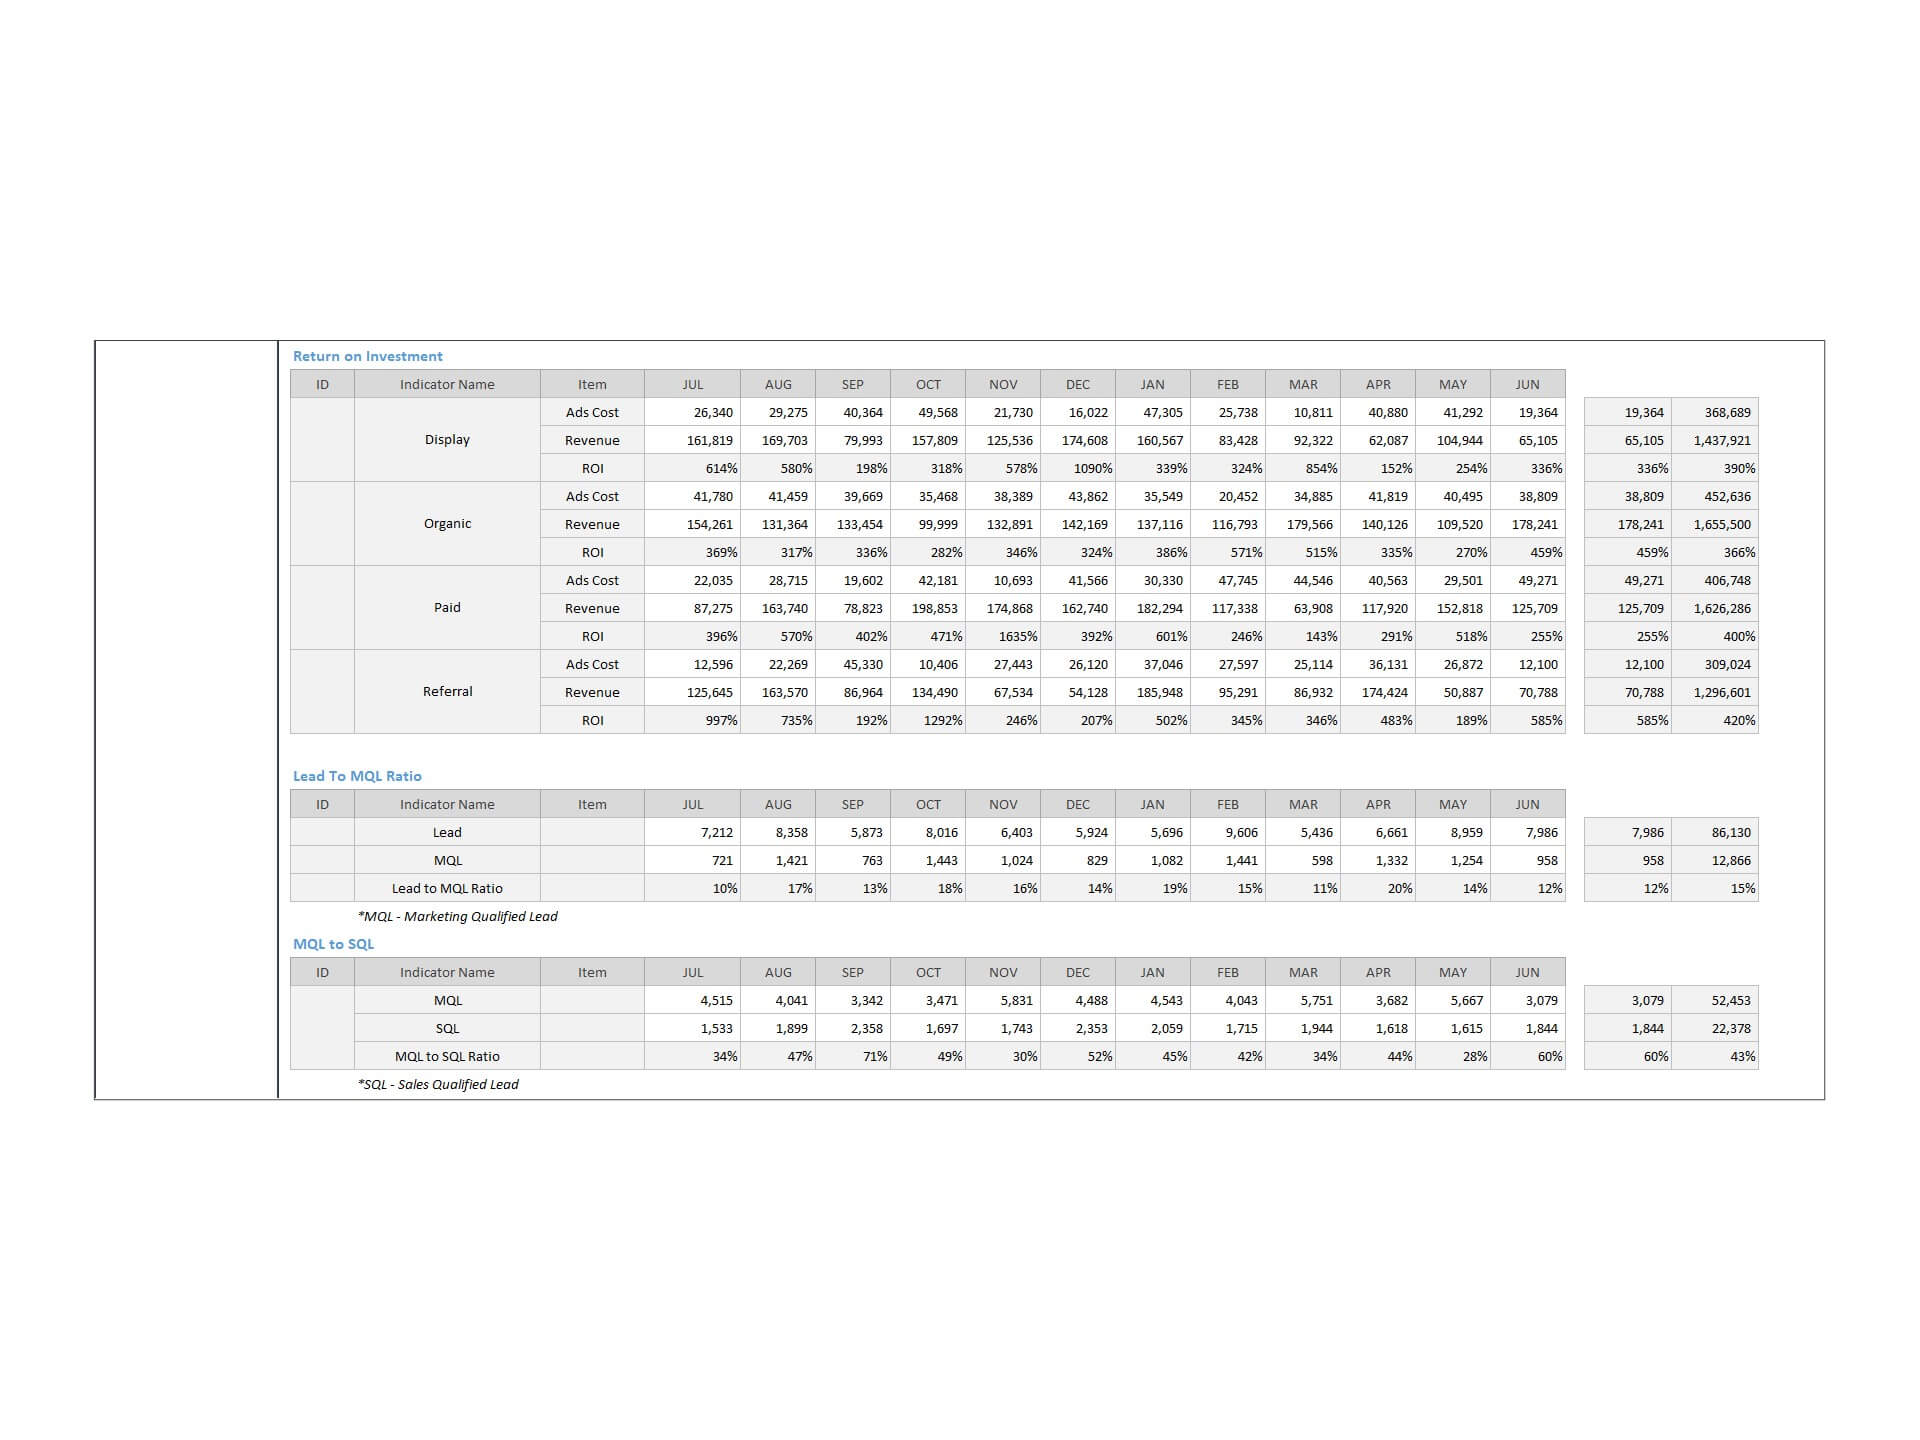
- Go to the ‘Enter Data’ menu – remove the sample data and give your actual data in the respective cells. Formula cells are locked, and you cannot edit it without a password.
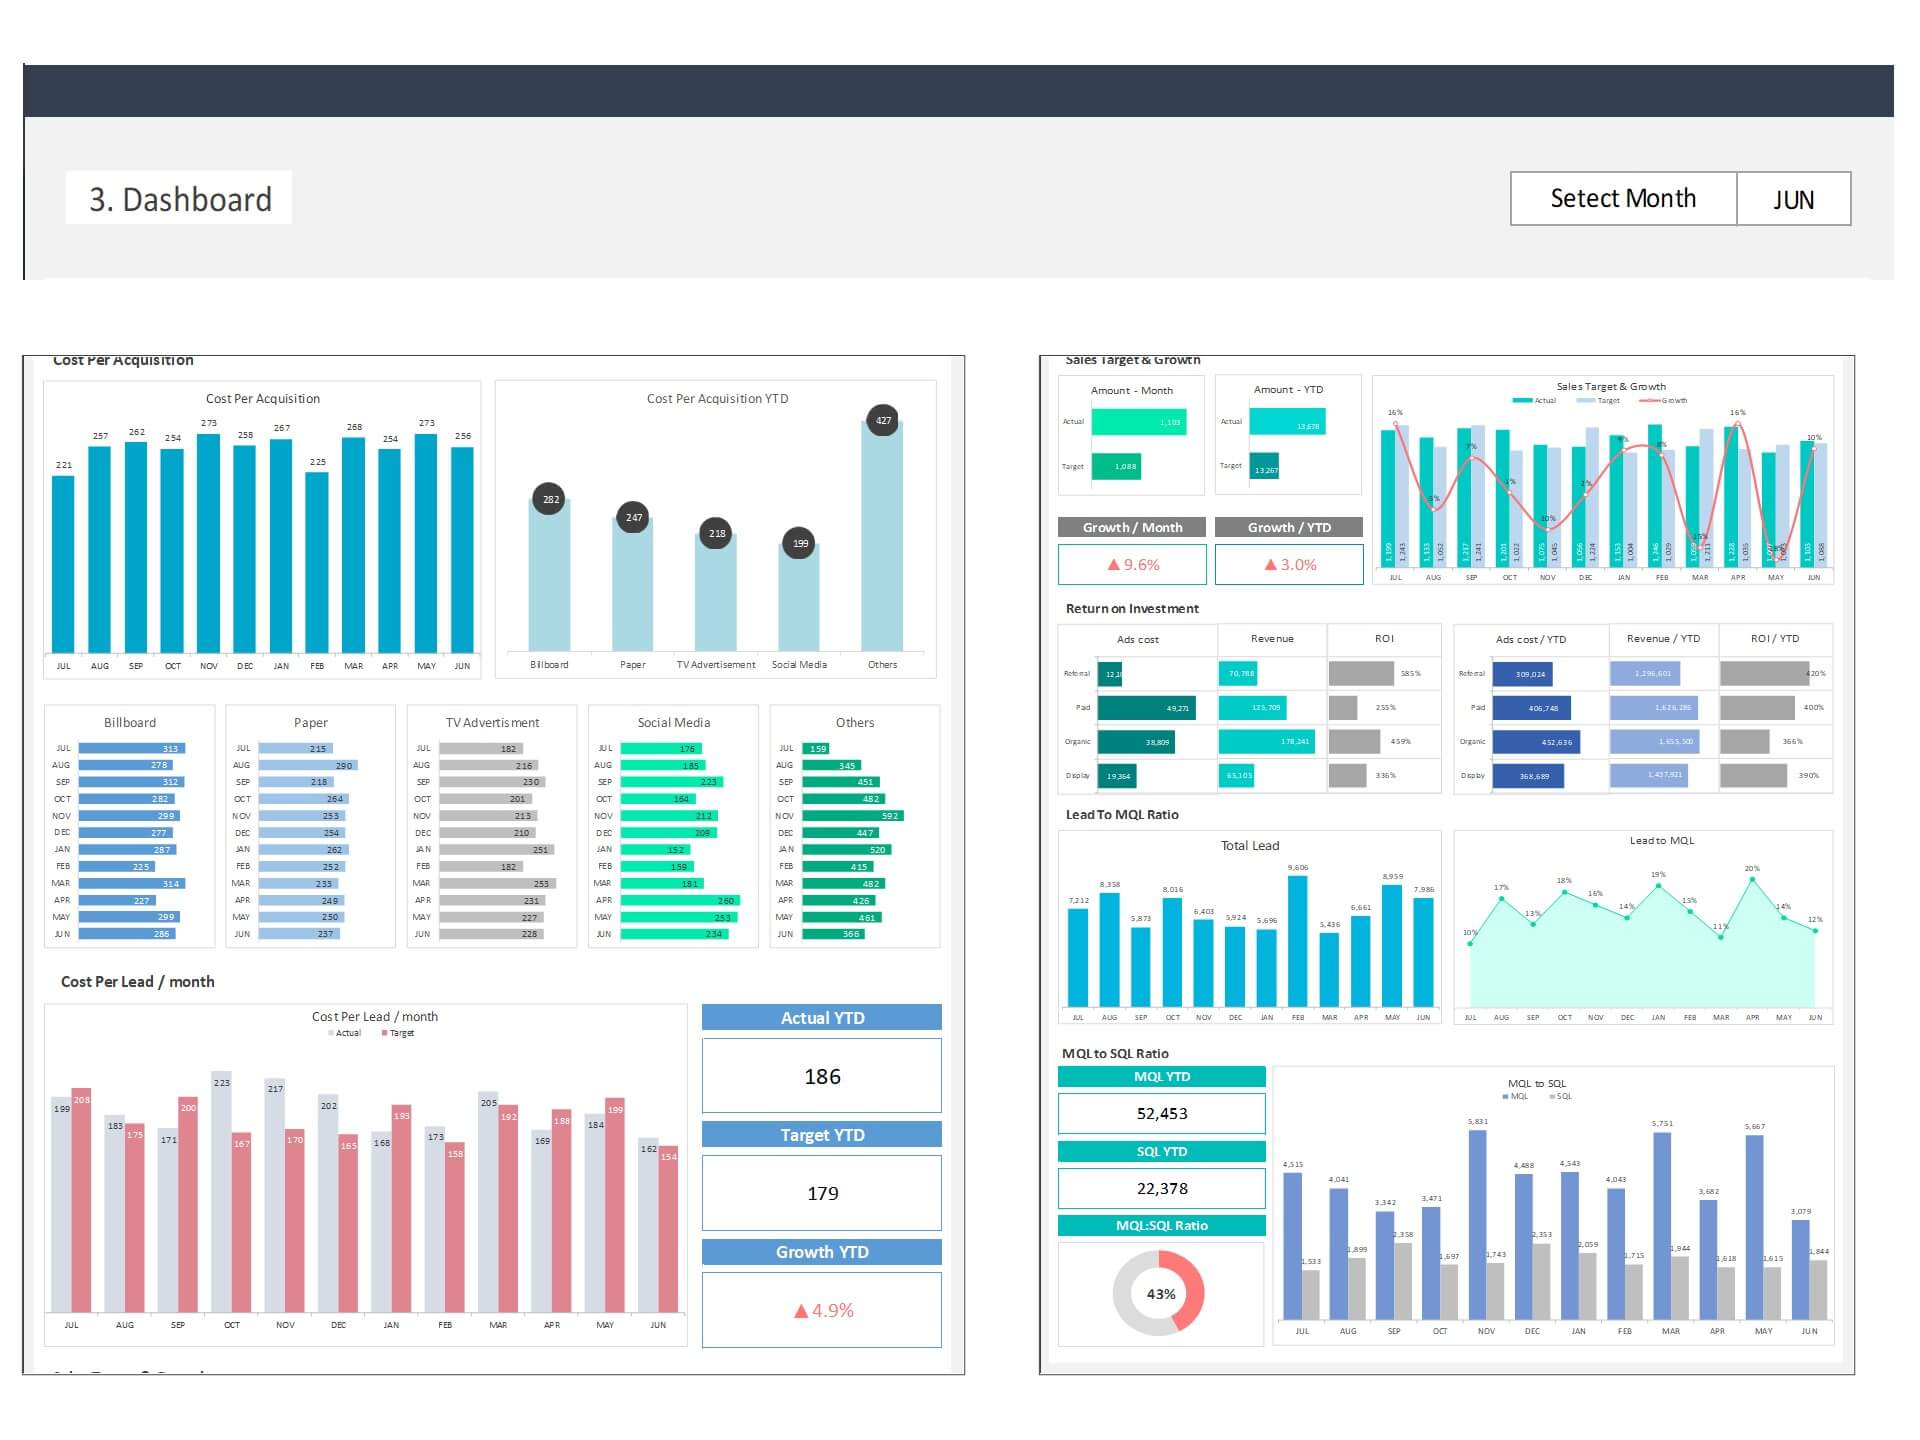
- Go to the ‘Dashboard’ menu – select the month name from the drop-down to see the monthly and YTD picture of performance indicators
- Each page is ready for printing – just press CTRL+P
This Excel dashboard template is password-protected to avoid mistakes, such as accidentally deleting formulas. When you completed the purchase, the password will be available.
For ready-to-use Dashboard Templates: