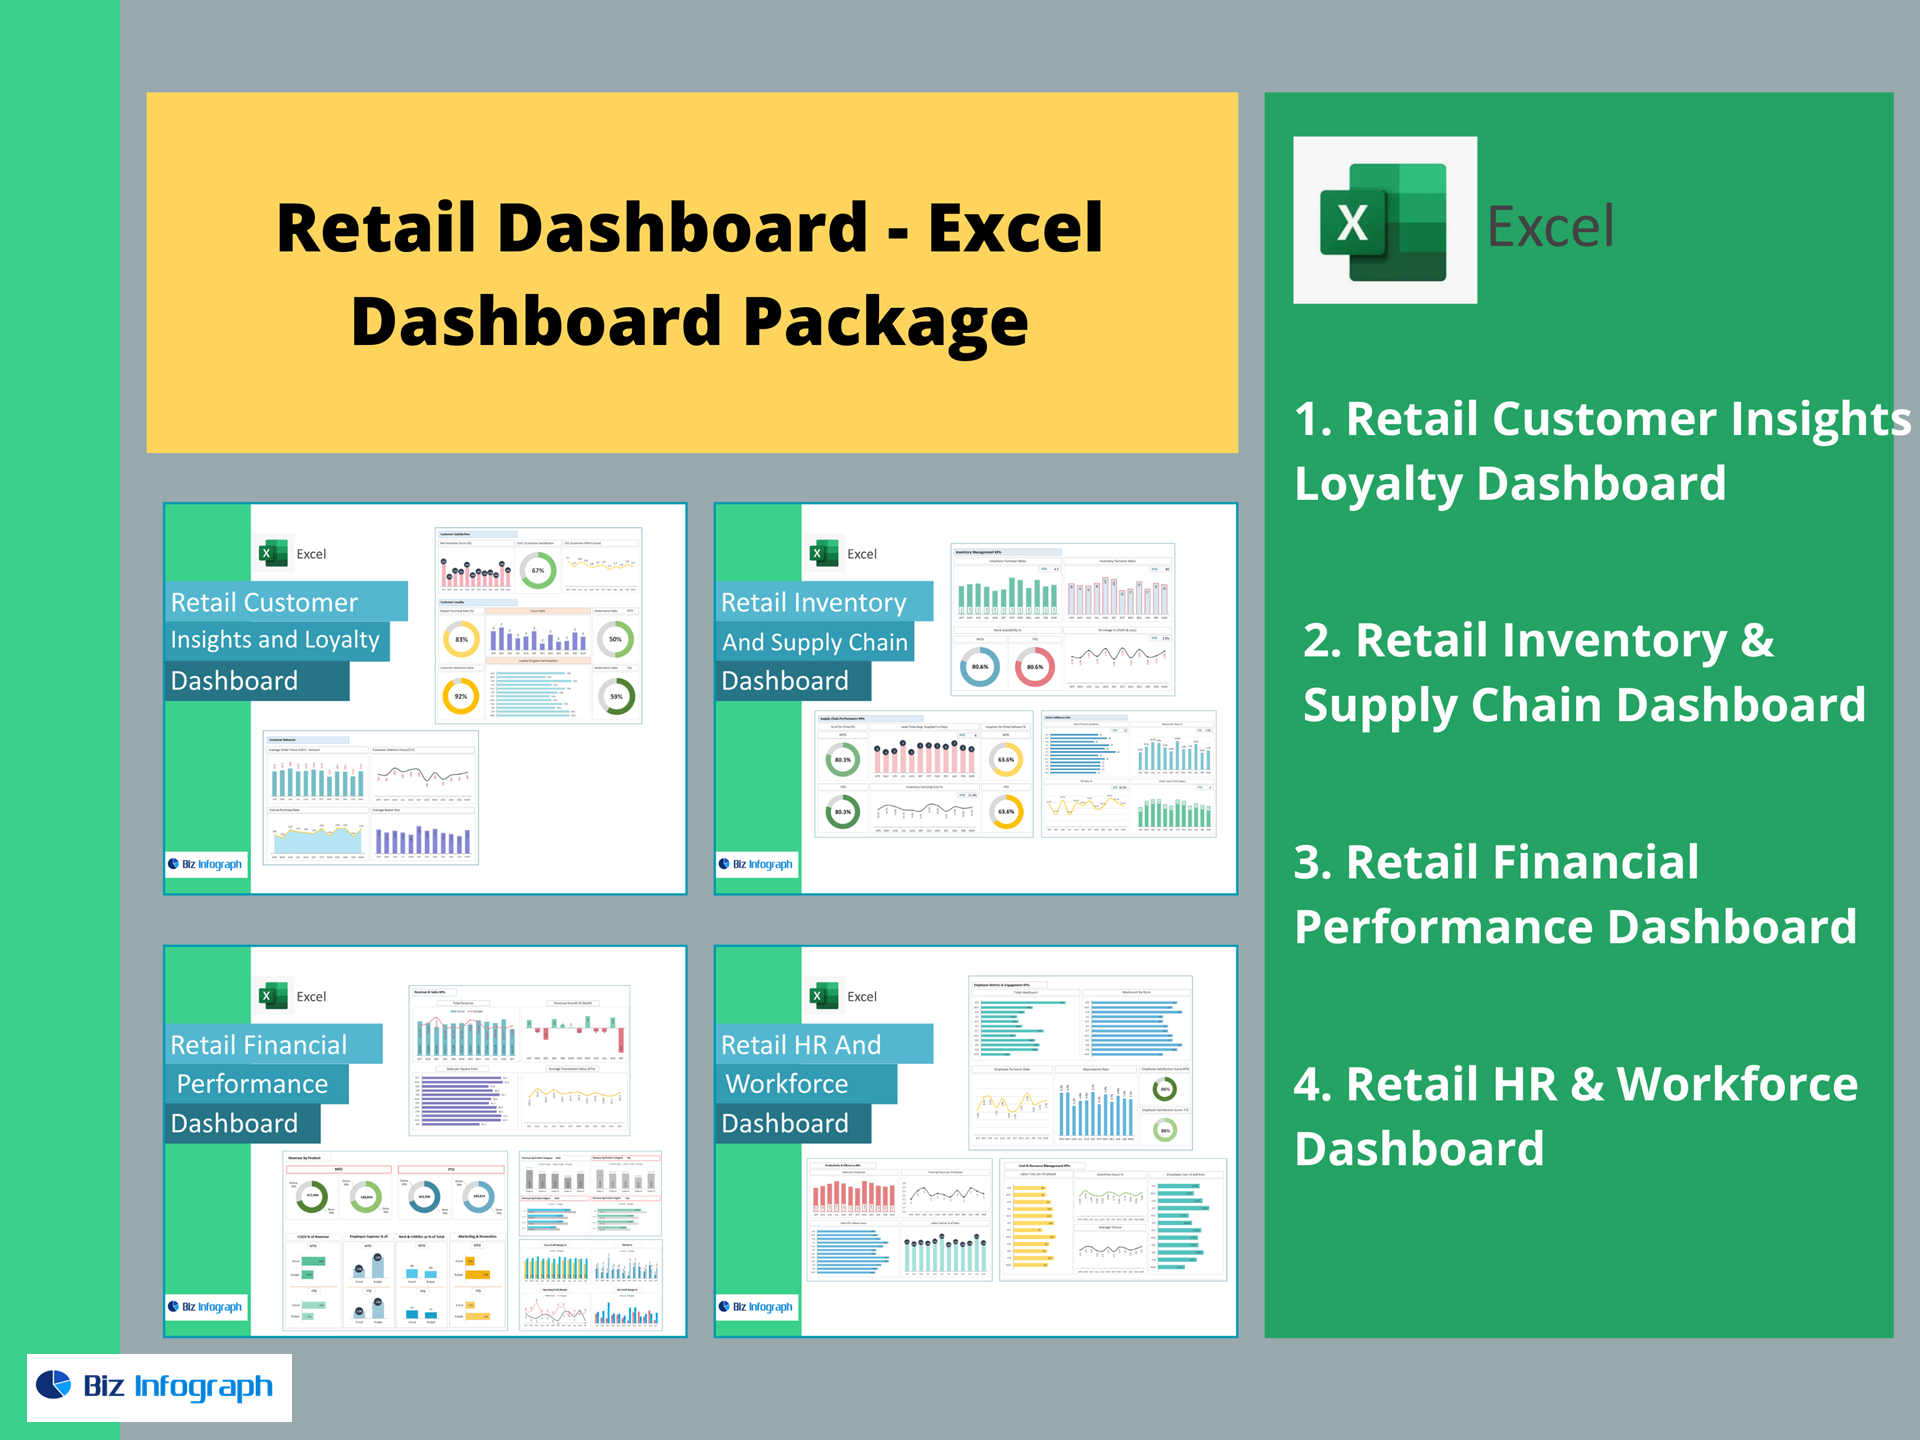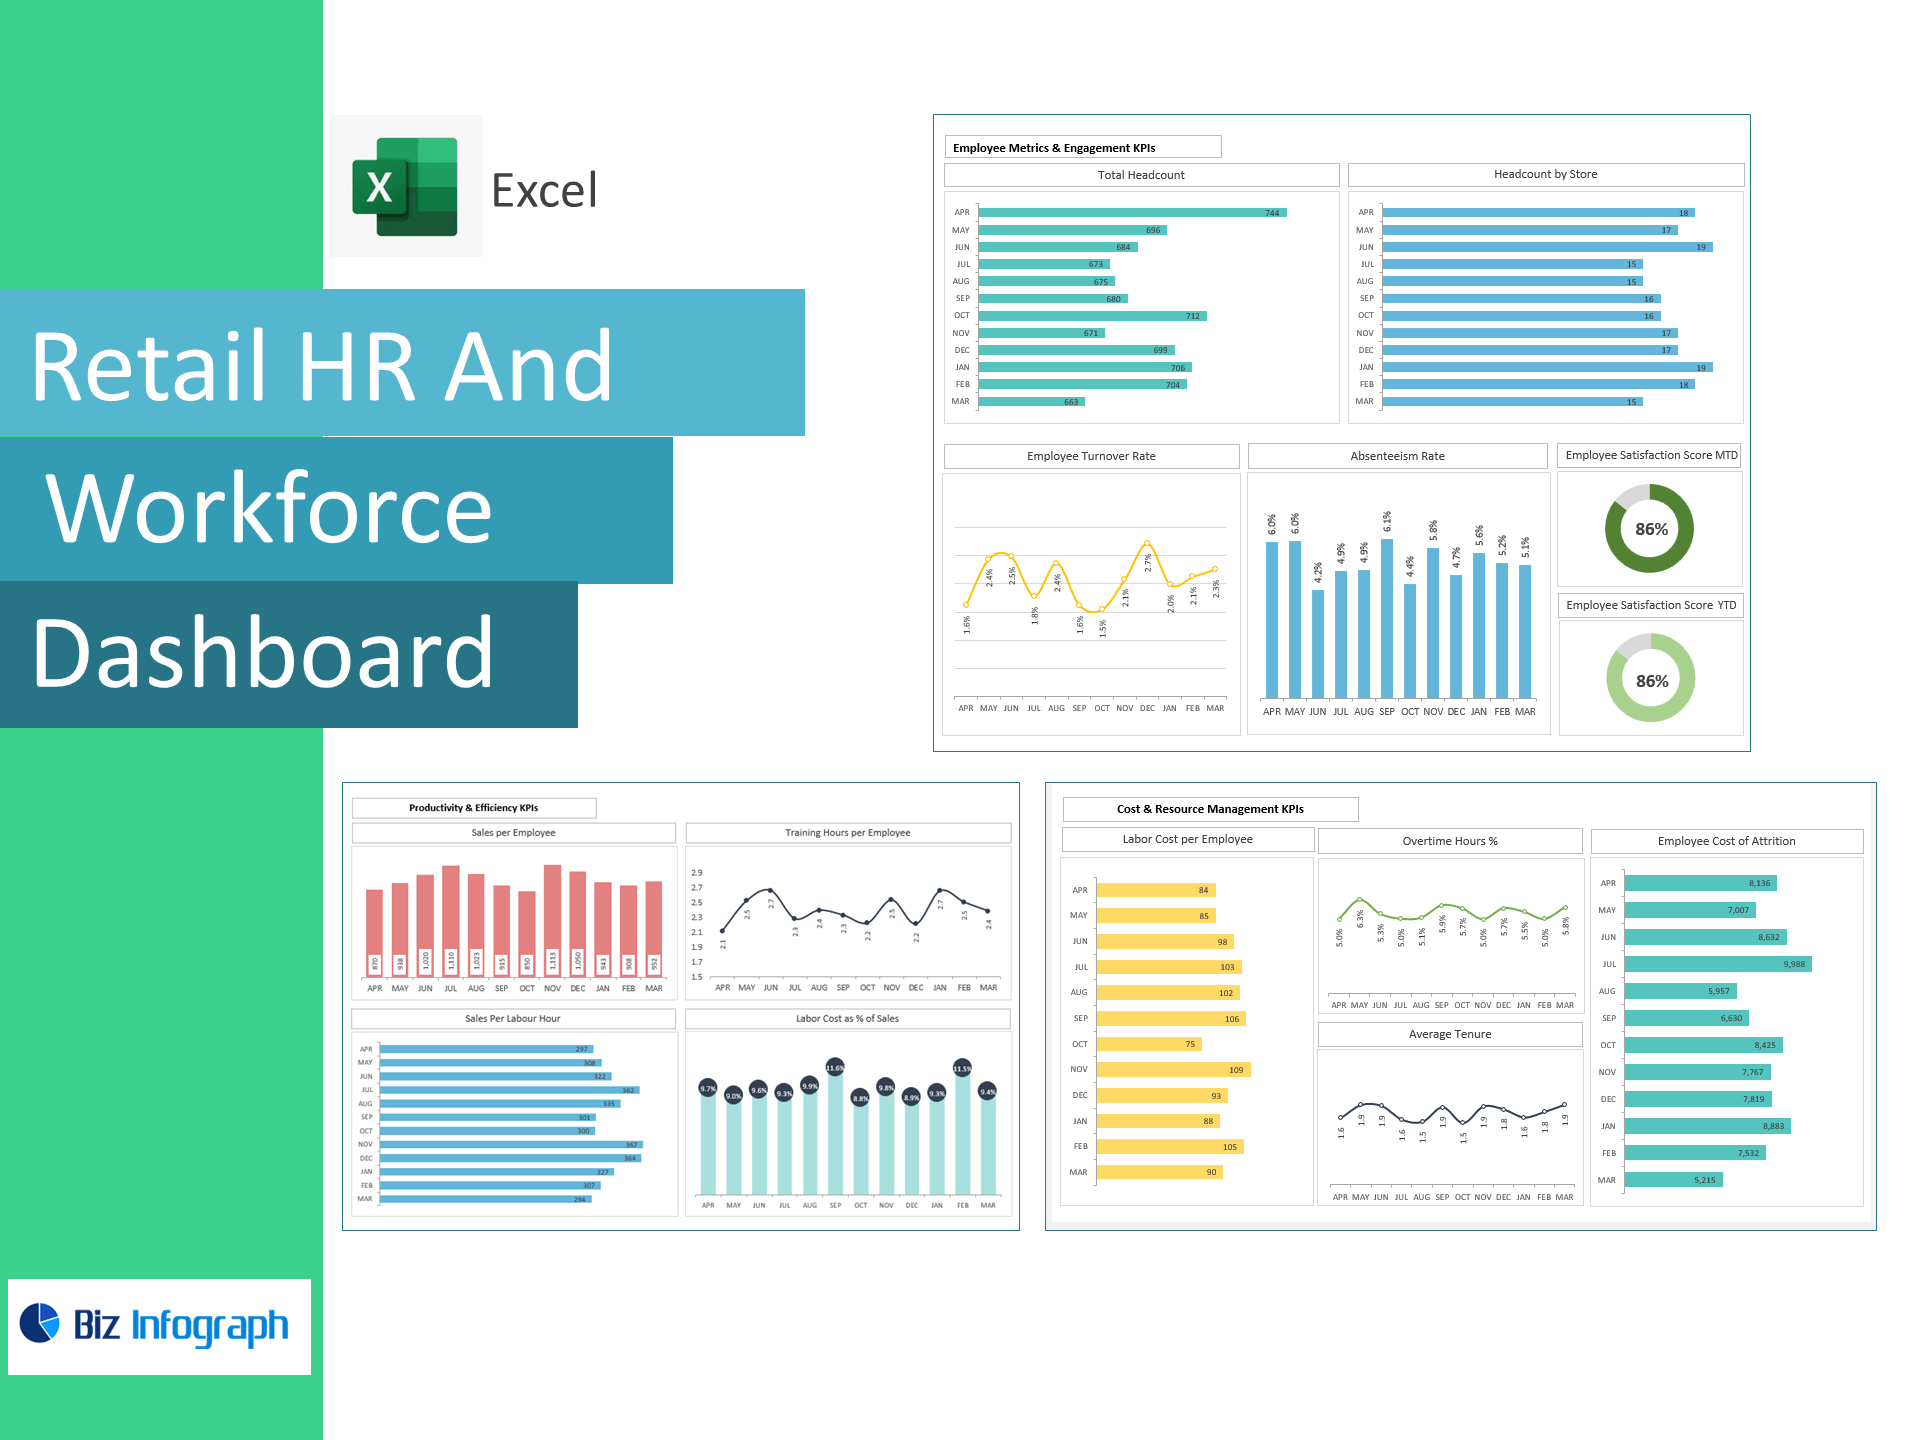
Retail HR & Workforce Dashboard — Excel Template
Optimize store staffing, control labor costs, and lift productivity—right in Excel. This template transforms HR, timesheet, and sales data into a live dashboard tracking Headcount, Turnover, Absenteeism, Satisfaction, Sales per Employee, Sales per Labour Hour, Labor Cost %, Overtime %, Average Tenure, and Cost of Attrition—so you can staff smarter and protect margins.
Why retailers choose this template
-
End-to-end workforce visibility: See store, online, and corporate headcount alongside sales and labor KPIs.
-
Cost control made simple: Monitor Labor Cost as % of Sales, Overtime %, and Labor Cost per Employee with instant variance cues.
-
Productivity focus: Track Sales per Employee and Sales per Labour Hour to improve scheduling and training ROI.
-
Ready on day one: Paste your data and the dashboard calculates everything—no add-ins or BI tools.
KPIs included (with ready-made formulas)
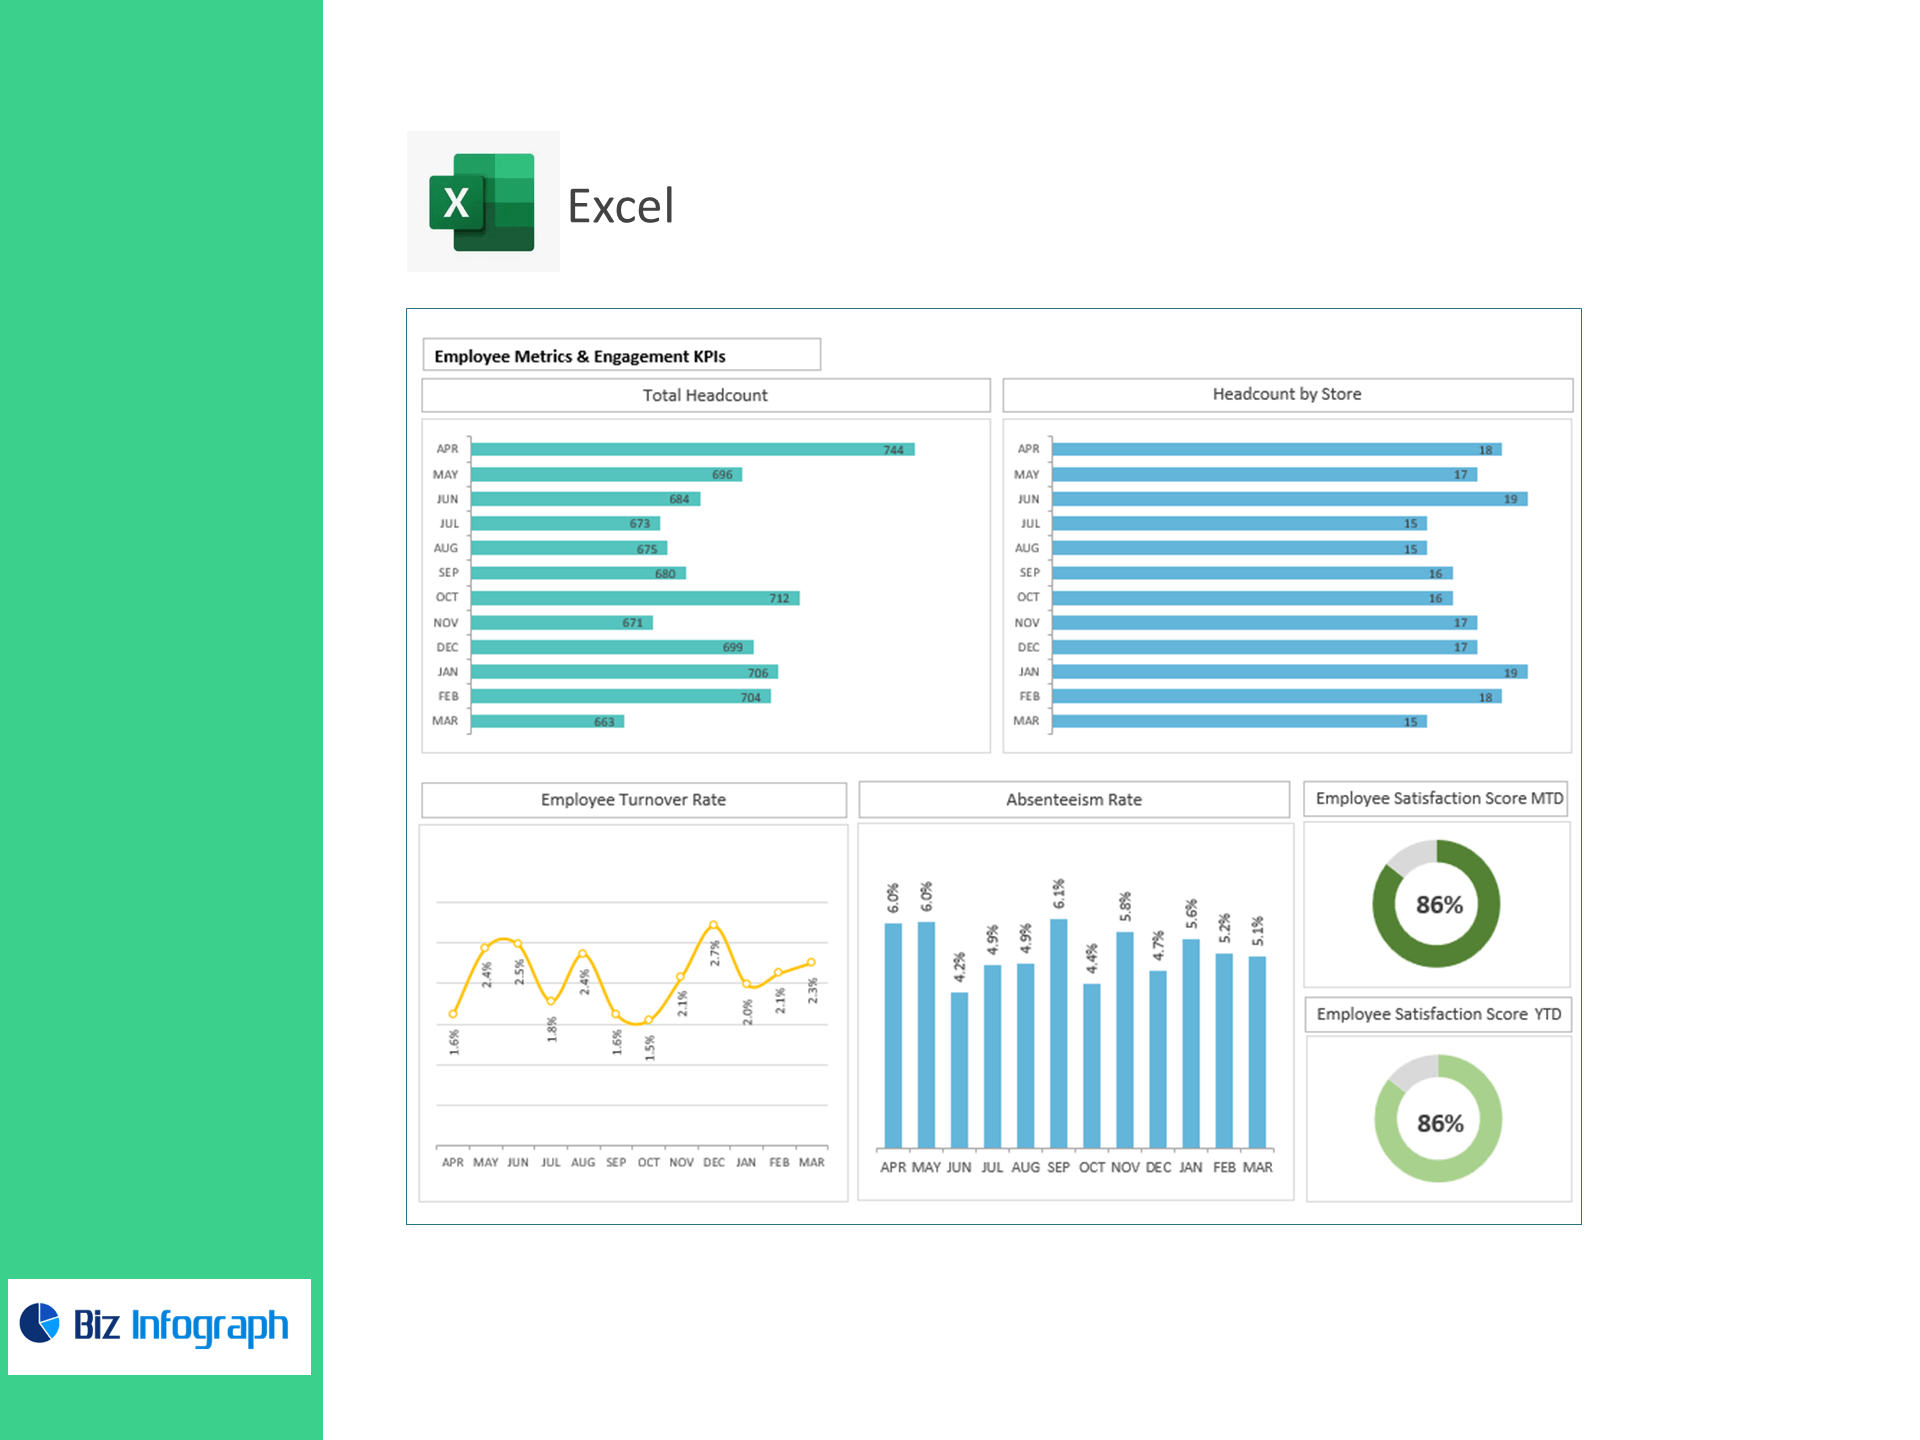
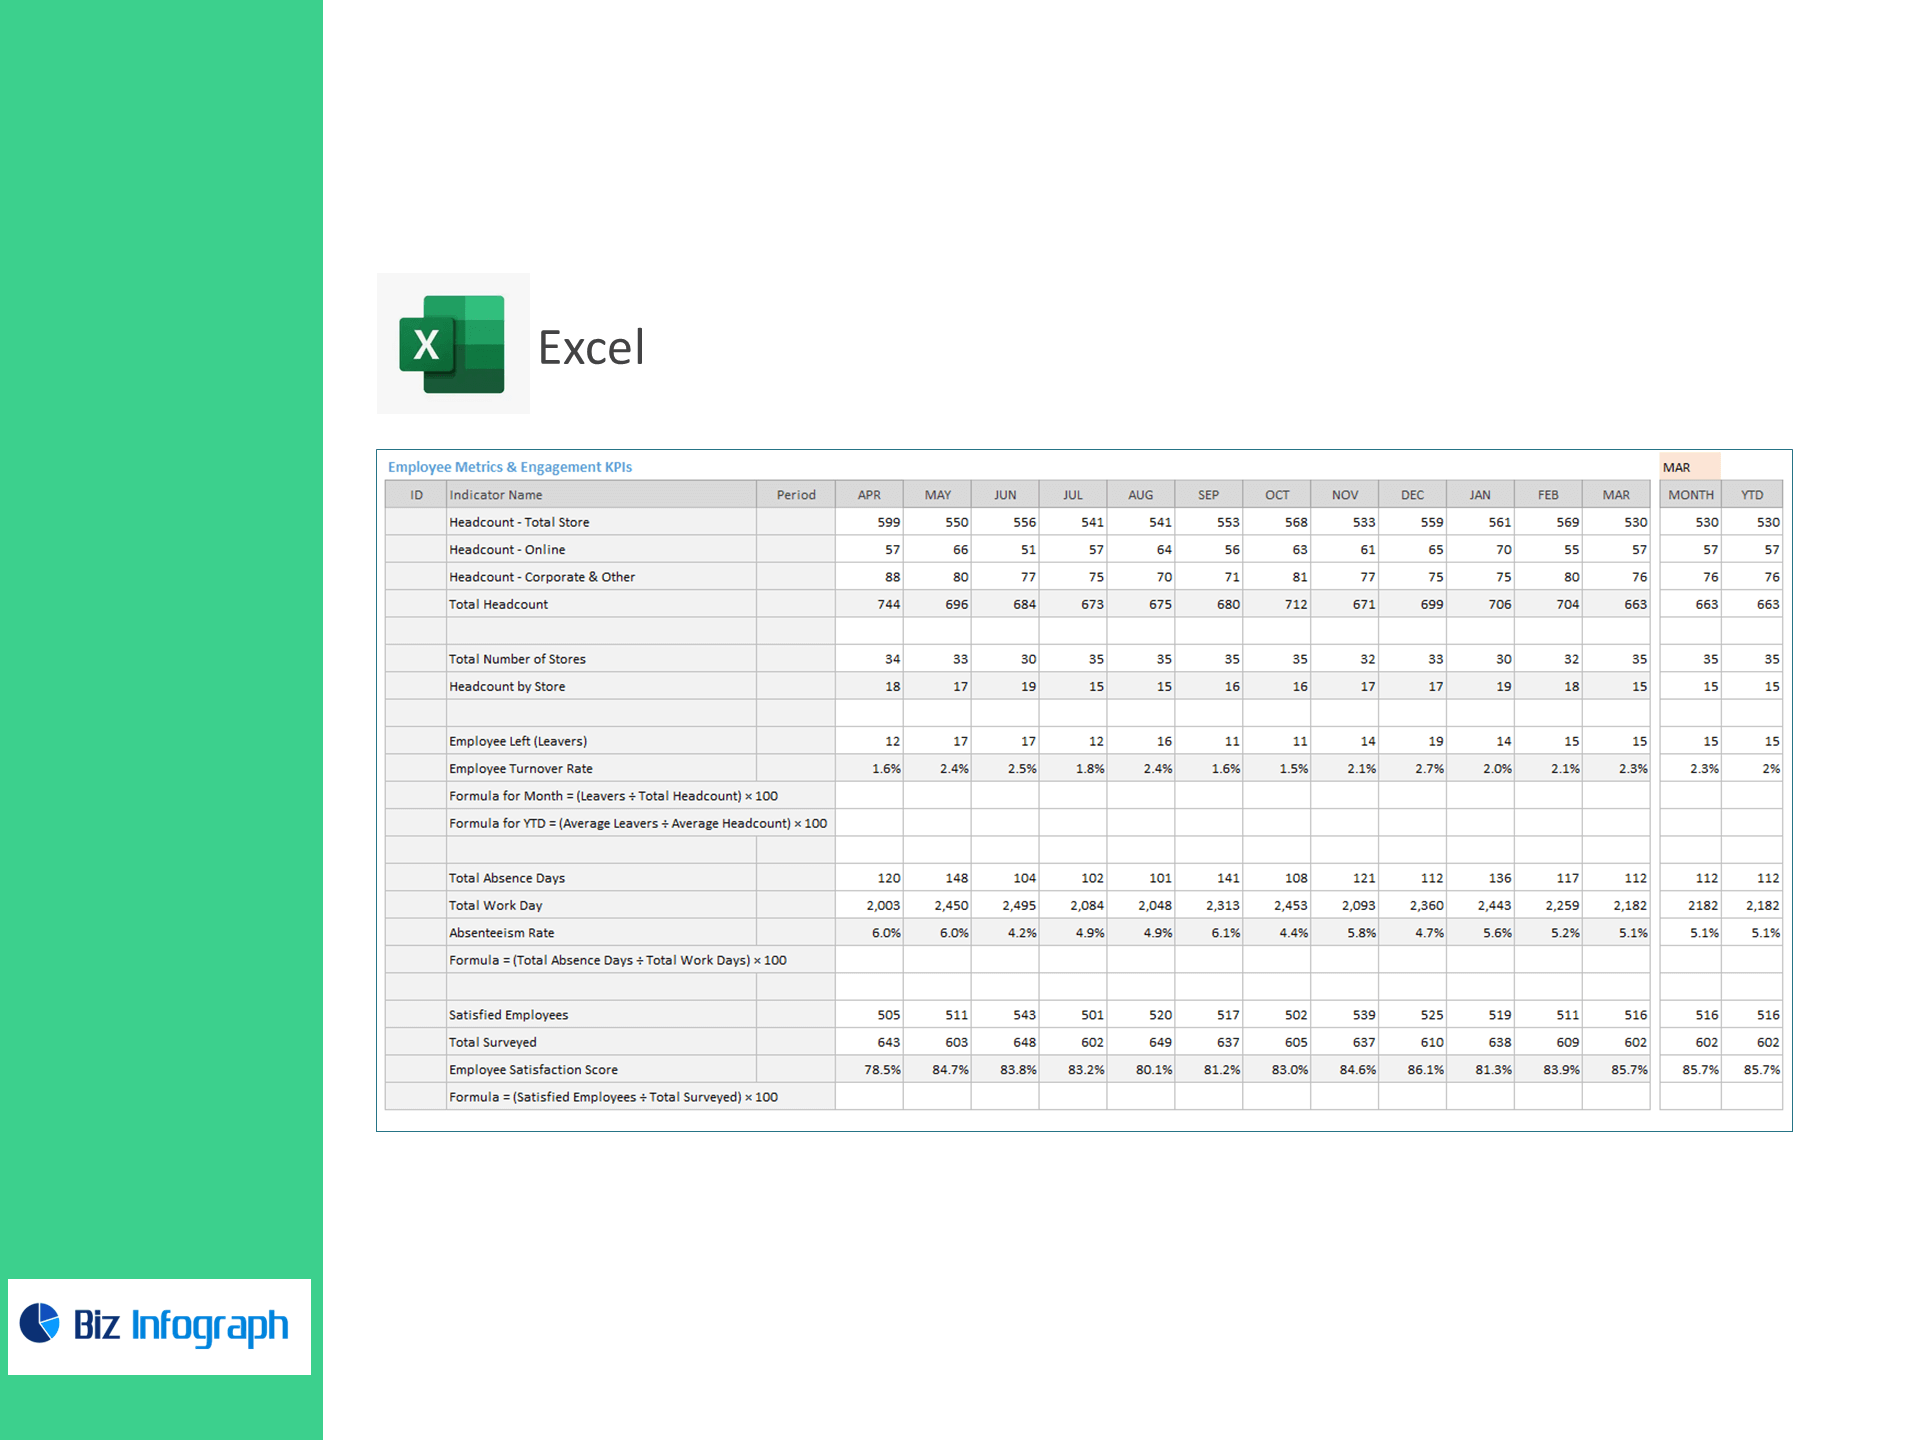
Employee Metrics & Engagement
-
Headcount: Total Store, Online, Corporate & Other, Total Headcount
-
Total Number of Stores; Headcount by Store
-
Leavers; Employee Turnover Rate (Monthly) = (Leavers ÷ Total Headcount) × 100
-
Employee Turnover Rate (YTD) = (Average Leavers ÷ Average Headcount) × 100
-
Total Absence Days; Total Work Days; Absenteeism Rate = (Absence Days ÷ Work Days) × 100
-
Satisfied Employees; Total Surveyed; Employee Satisfaction Score = (Satisfied ÷ Surveyed) × 100
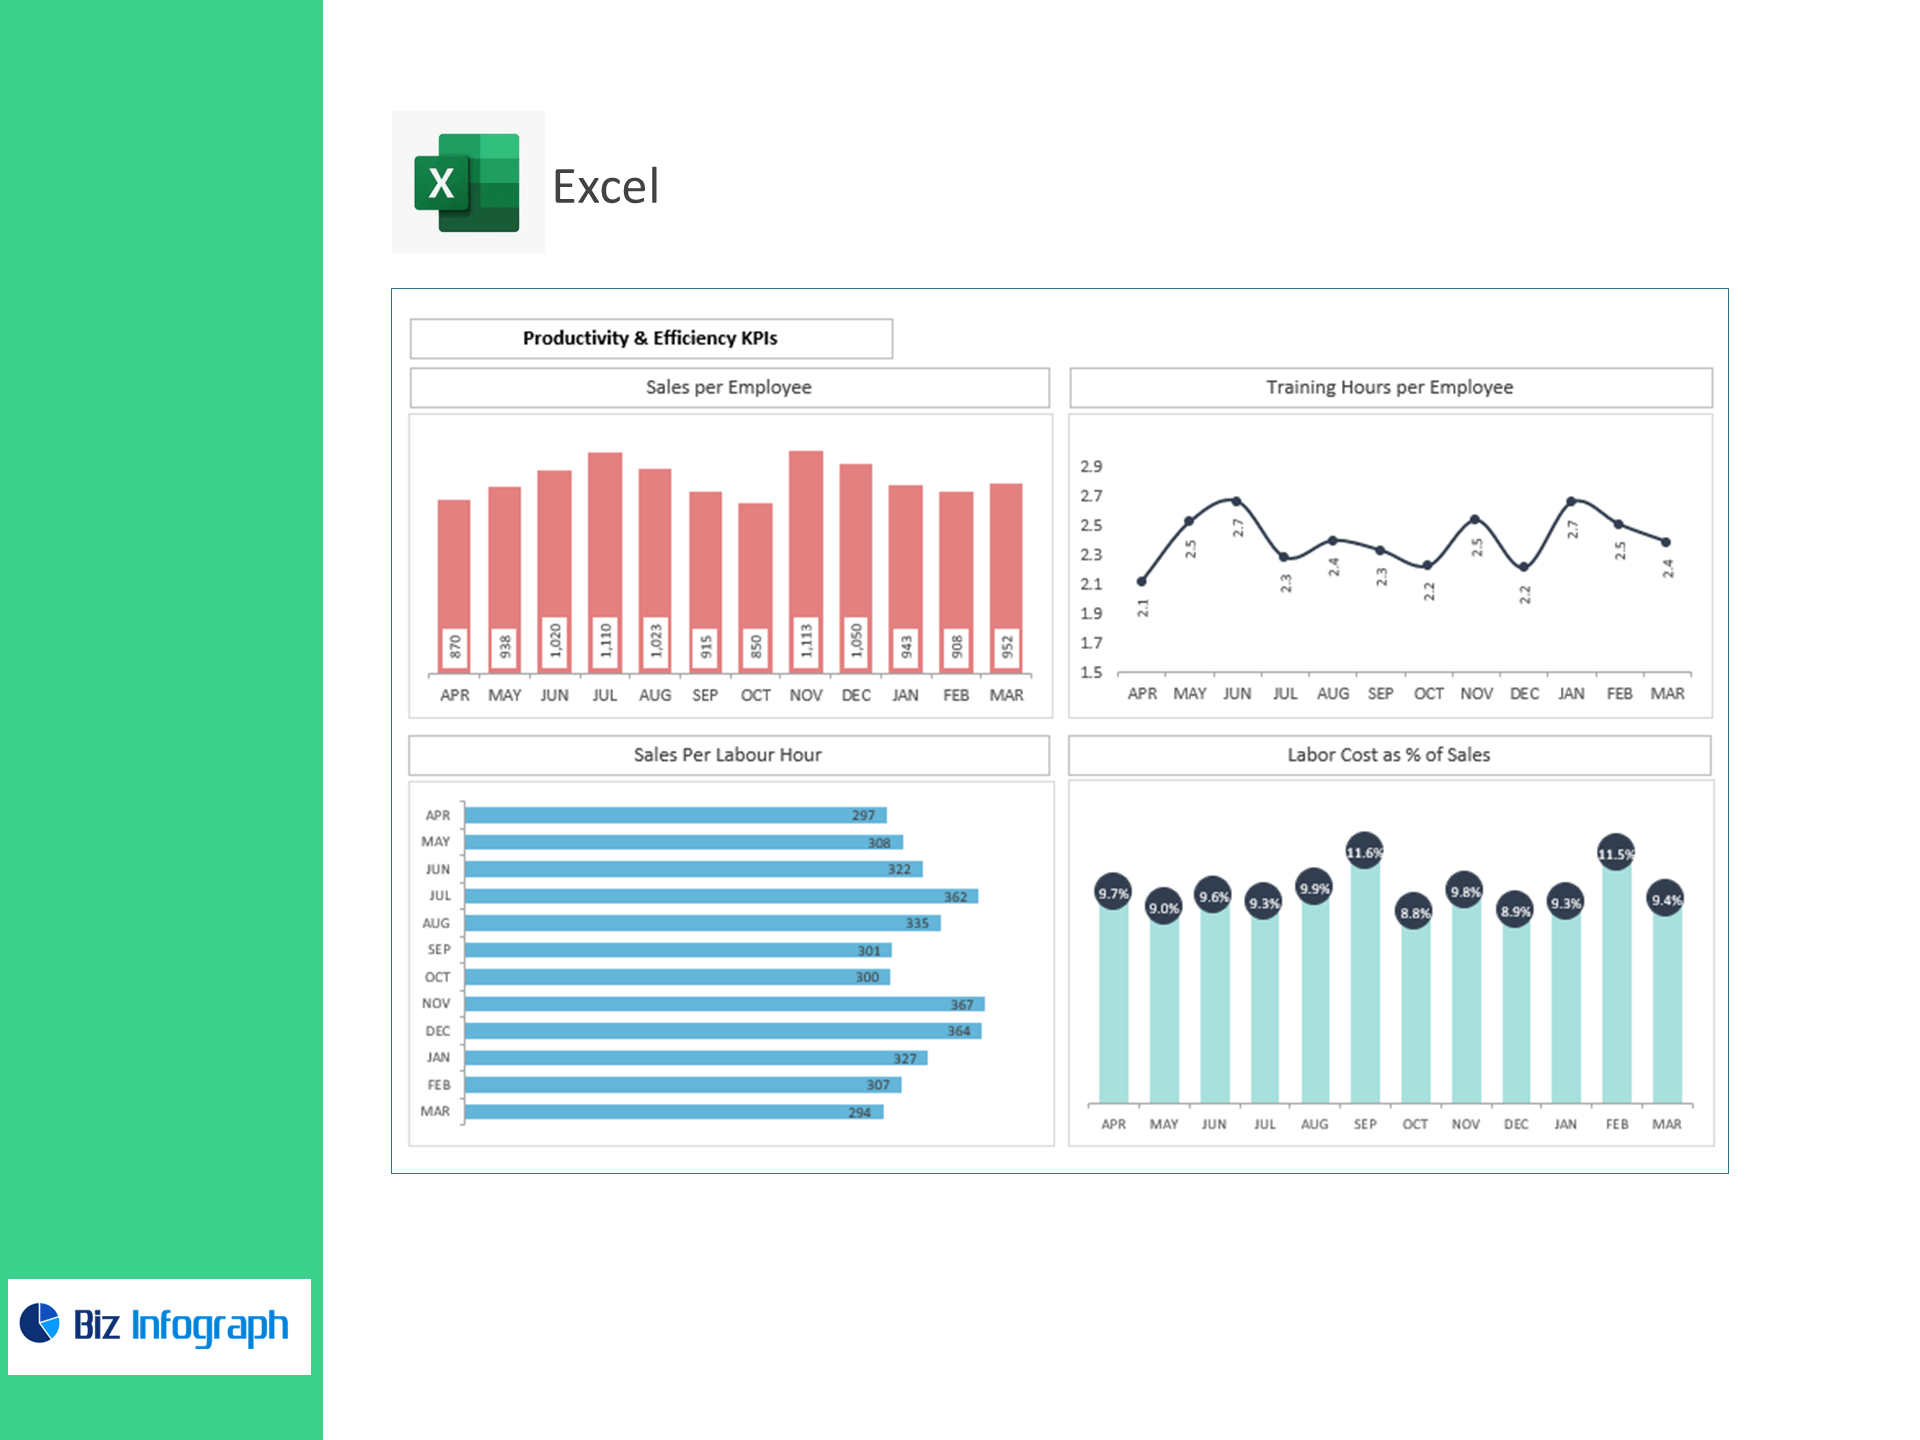
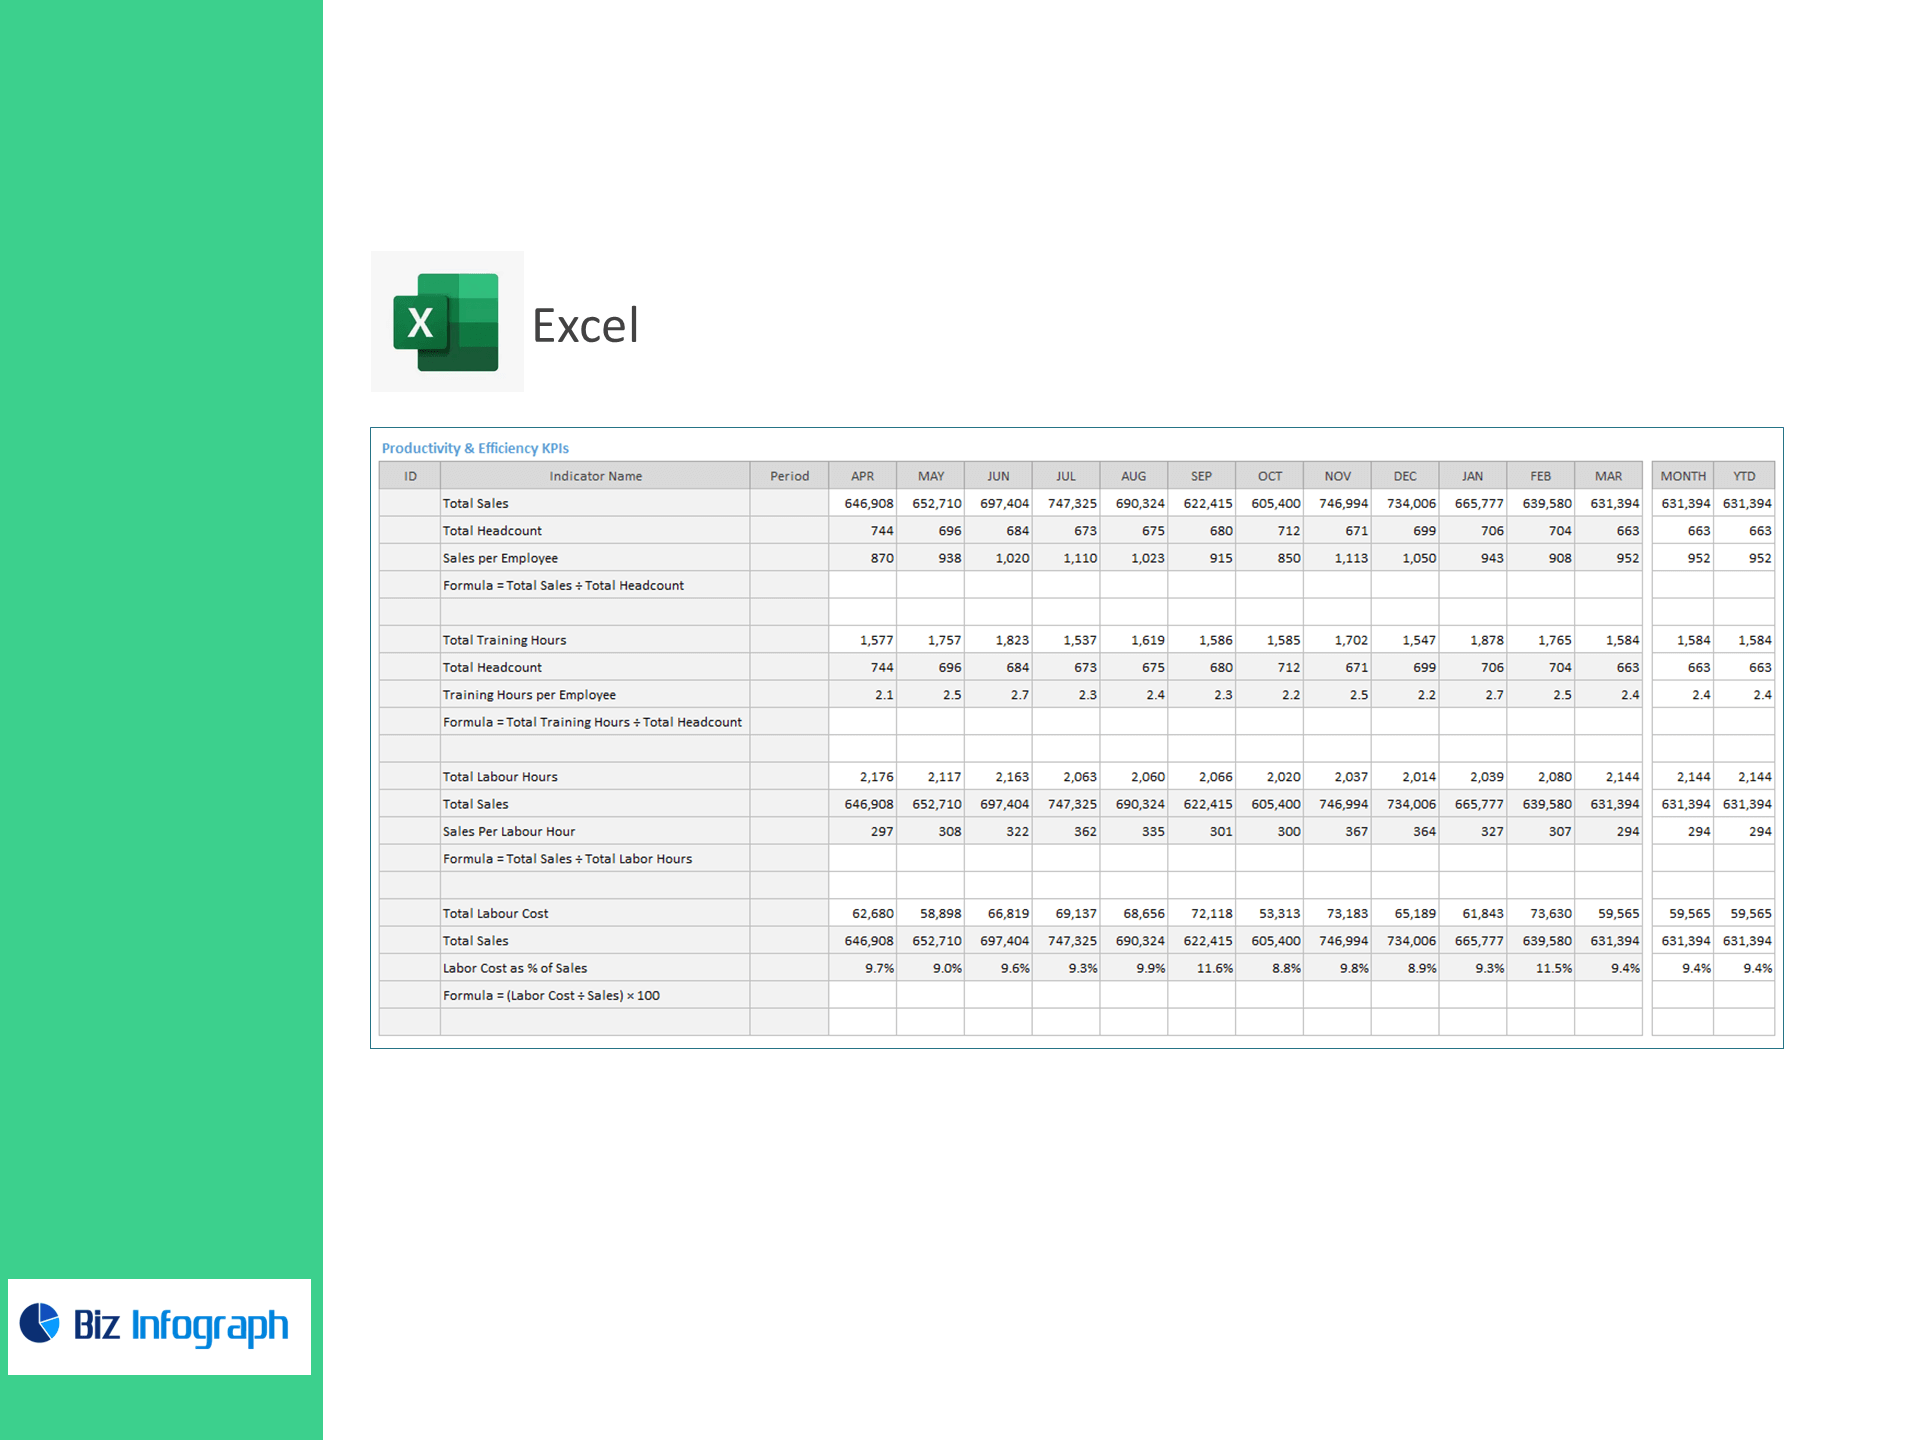
Productivity & Efficiency
-
Total Sales; Total Headcount; Sales per Employee = Sales ÷ Headcount
-
Total Training Hours; Training Hours per Employee = Training Hours ÷ Headcount
-
Total Labour Hours; Sales per Labour Hour = Sales ÷ Labour Hours
-
Total Labour Cost; Labor Cost as % of Sales = (Labour Cost ÷ Sales) × 100
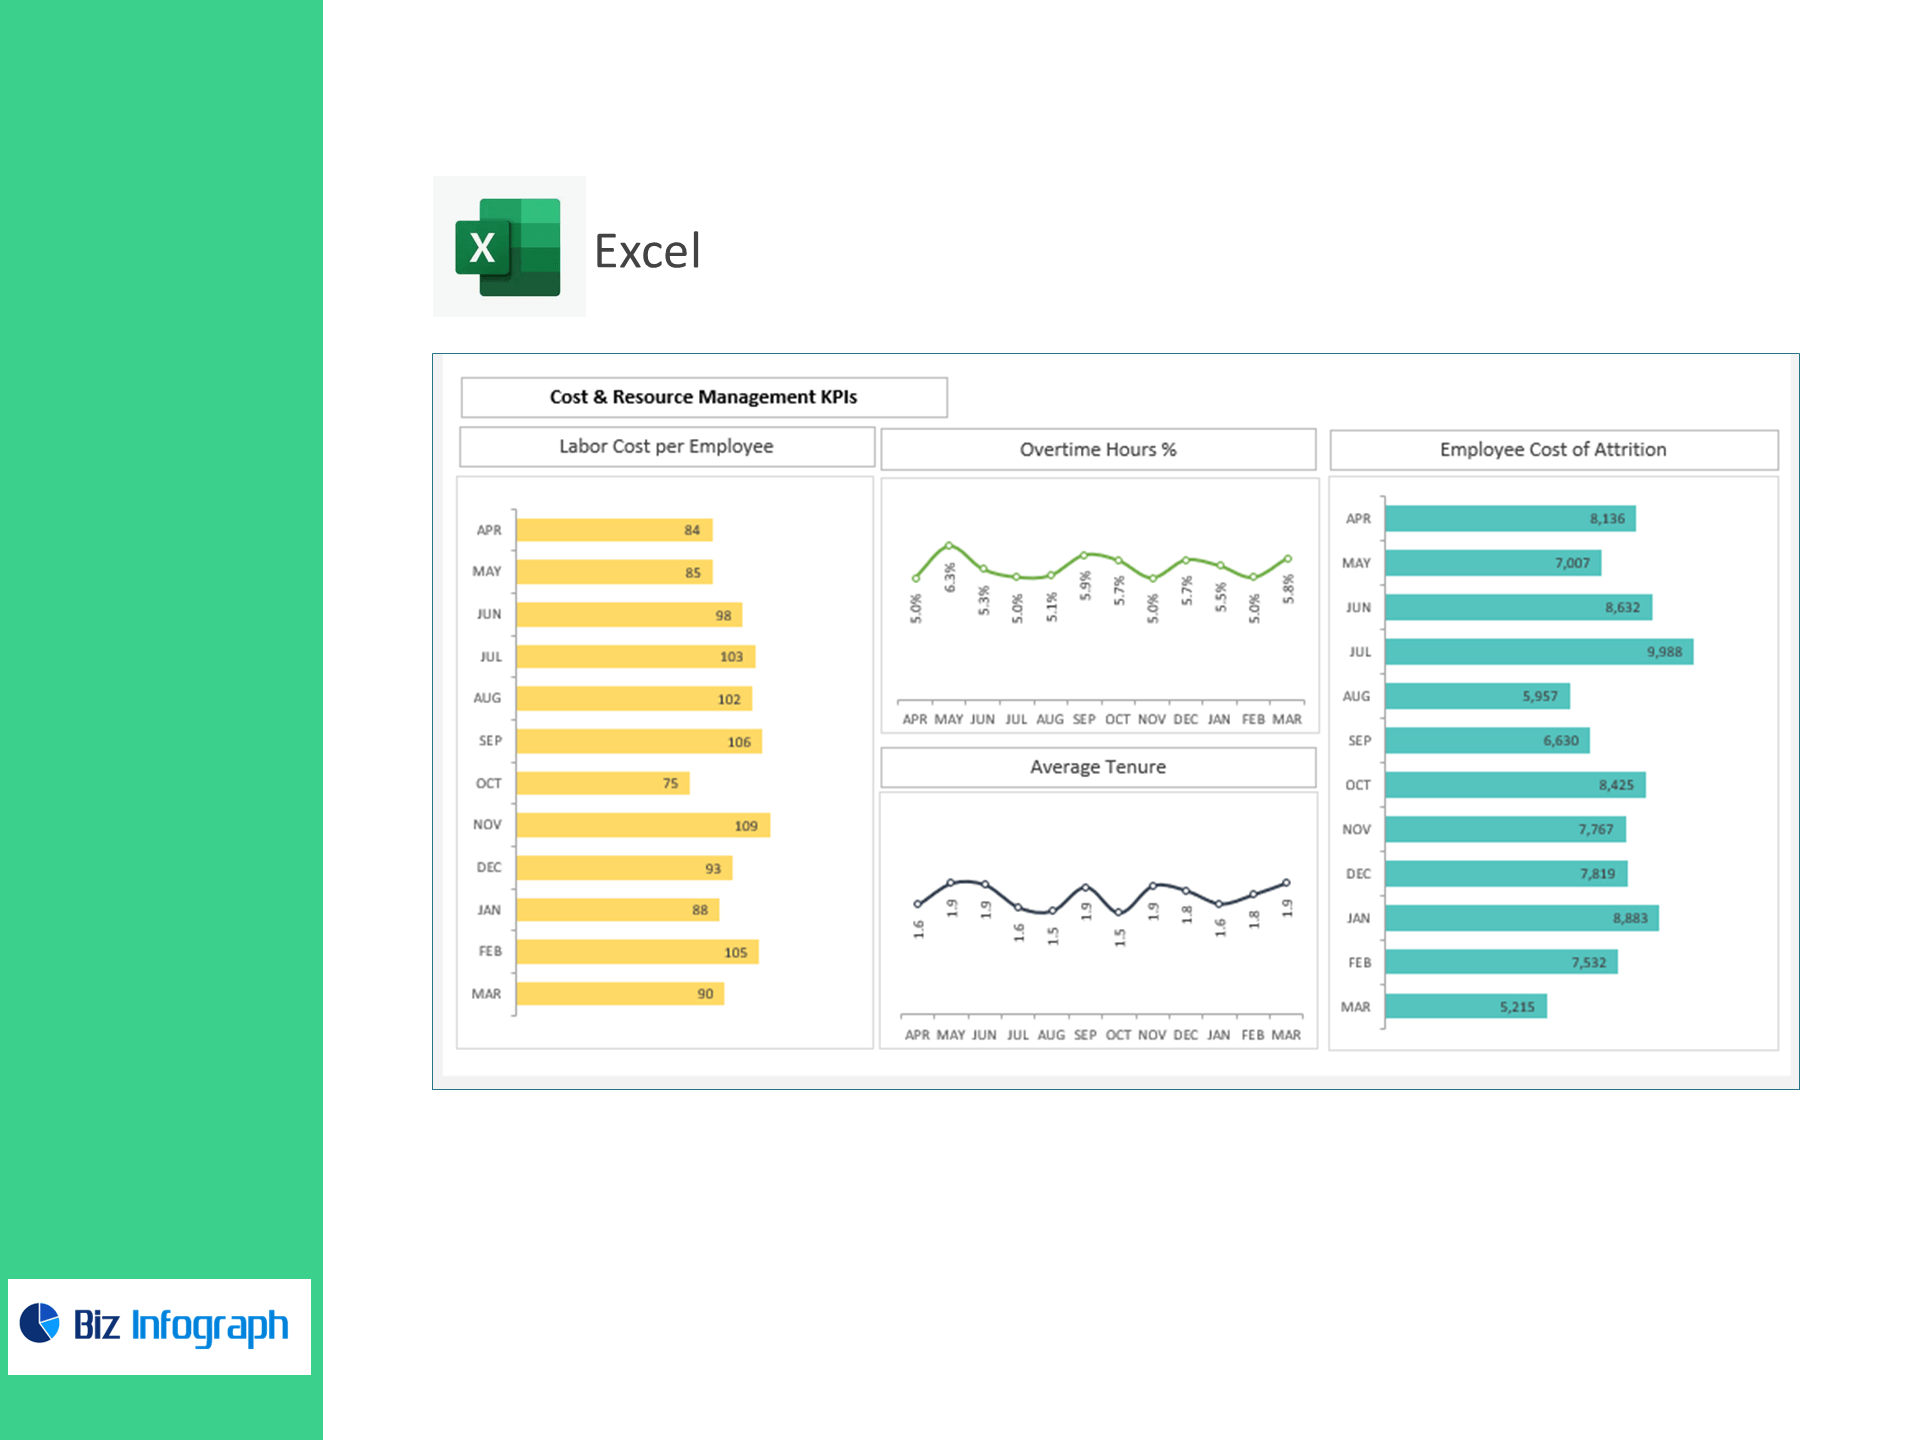
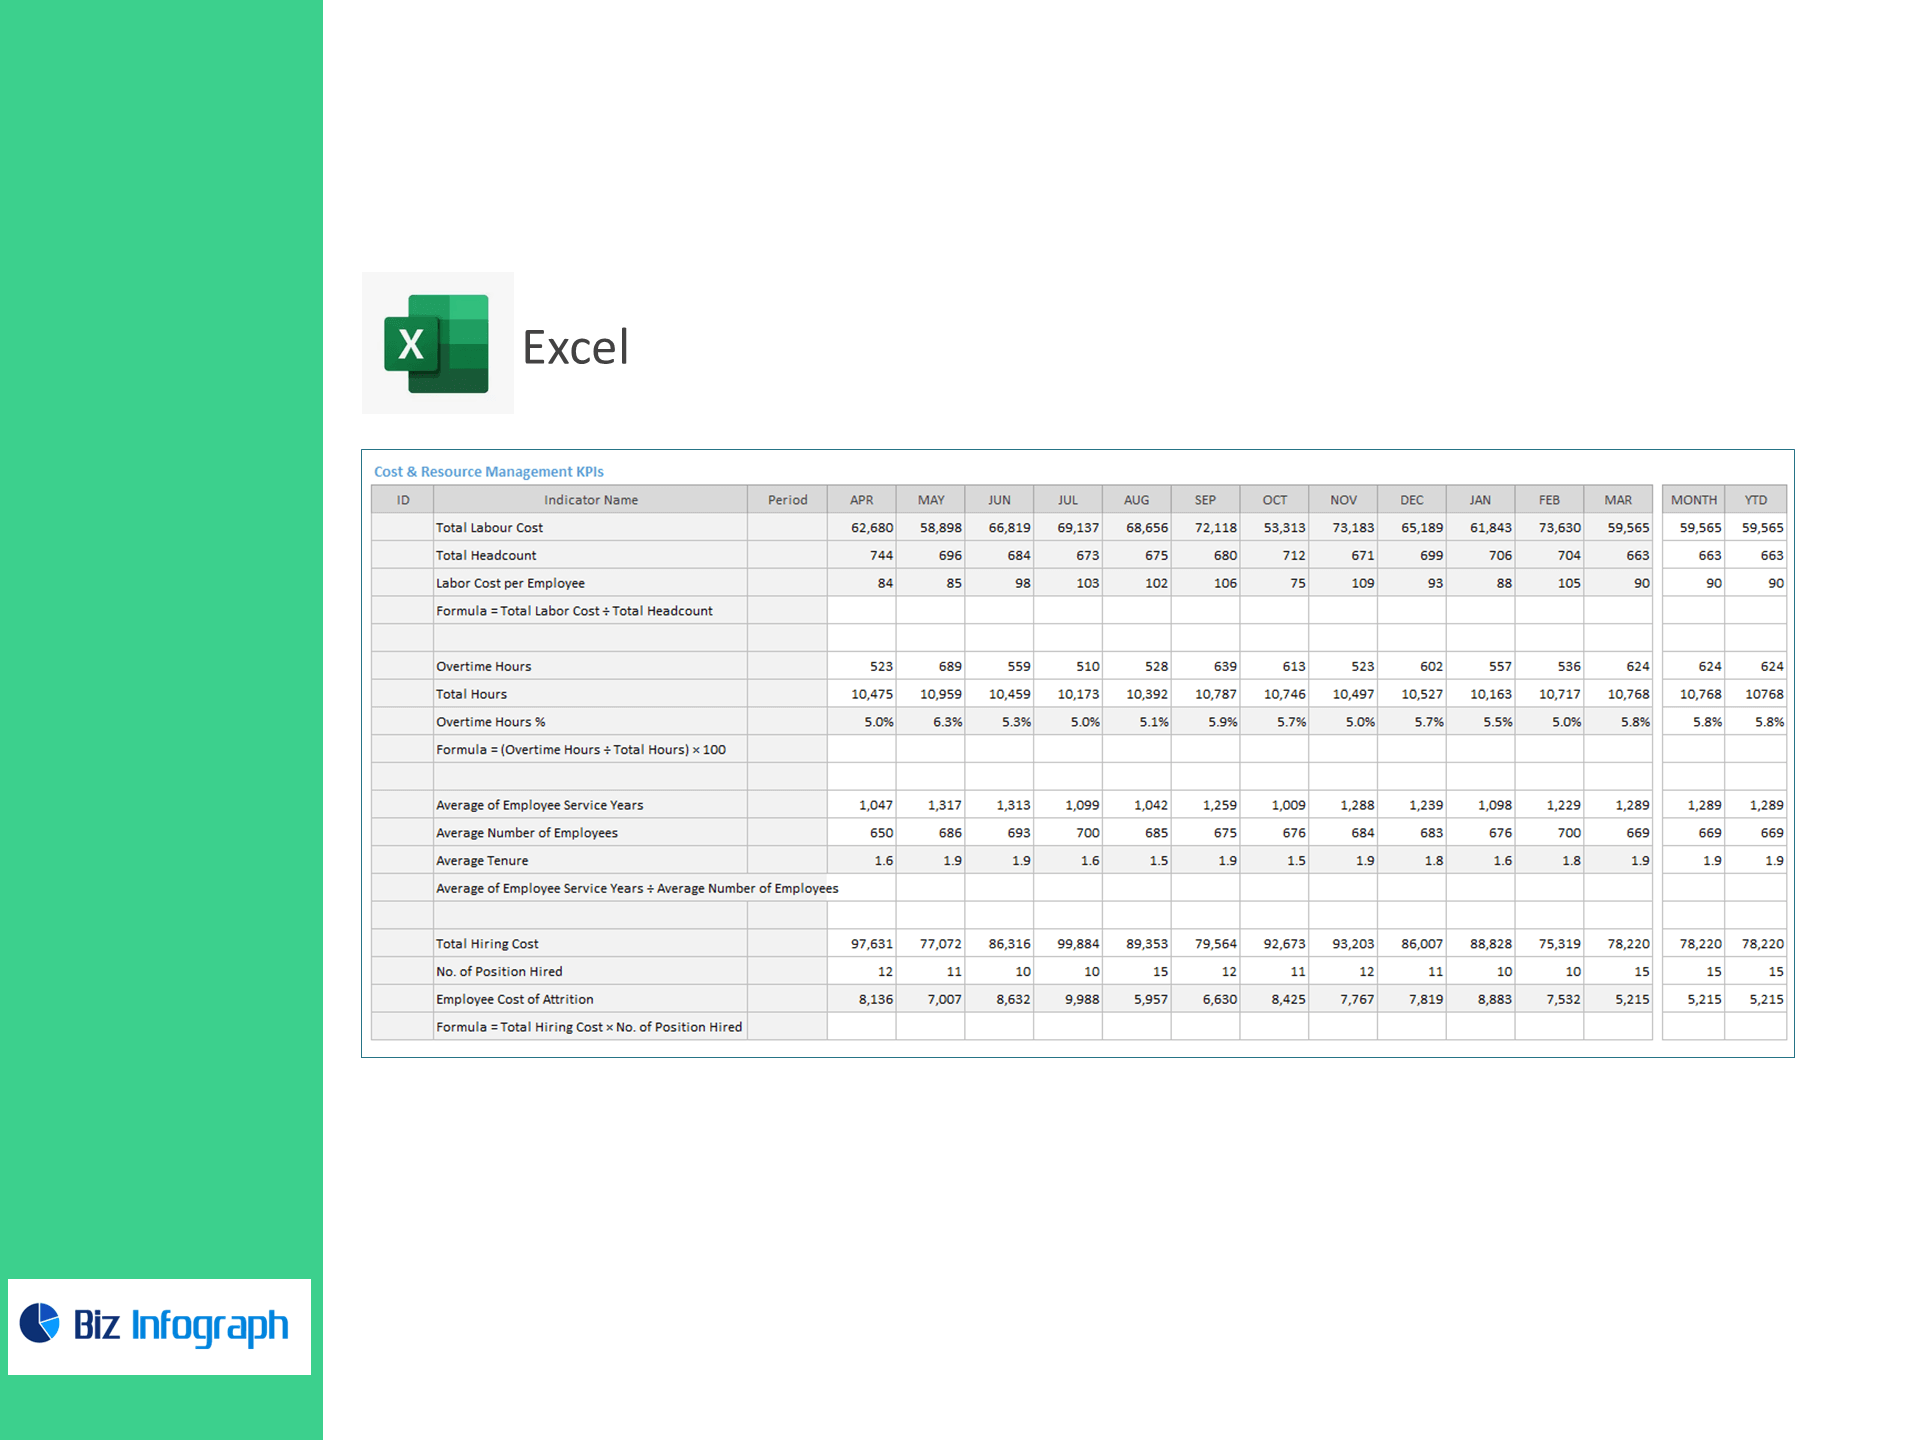
Cost & Resource Management
-
Labor Cost per Employee = Total Labour Cost ÷ Total Headcount
-
Overtime Hours; Total Hours; Overtime % = (Overtime Hours ÷ Total Hours) × 100
-
Average of Employee Service Years; Average Number of Employees; Average Tenure = Service Years ÷ Employees
-
Total Hiring Cost; No. of Positions Hired; Employee Cost of Attrition = Total Hiring Cost × No. of Positions Hired
What’s inside
-
Executive Dashboard: Tiles for Turnover, Absenteeism, Satisfaction, Sales/Employee, Labour Hour productivity, Labor %, Overtime %, Tenure, and Attrition Cost with trend & target variance.
-
Store & Channel View: Compare headcount and efficiency across stores, online, and corporate.
-
Scheduling & Overtime Monitor: Track labour hours vs. sales and identify overtime hotspots.
-
Engagement & Retention Hub: Satisfaction, turnover, and tenure by location/department.
-
Assumptions & Targets: Enter KPI targets; automatic color states for Above Target / Below Target.
-
Clean Data Tables: Import-ready sheets for Headcount, Timesheets, Sales, Surveys, and Hiring.
How it works
-
Paste your CSV/Excel data into the provided tables.
-
Set reporting periods and KPI targets.
-
Review the dashboard to balance staffing, reduce overtime, and improve retention.
Benefits
-
Right-size staffing: Align labour hours to demand using sales-per-labour-hour insights.
-
Cut avoidable costs: Spot overtime spikes and high-cost stores early.
-
Boost retention: Track turnover, absenteeism, tenure, and satisfaction to act fast.
-
Prove HR impact: Connect training and engagement to sales productivity.
For ready-to-use Dashboard Templates: