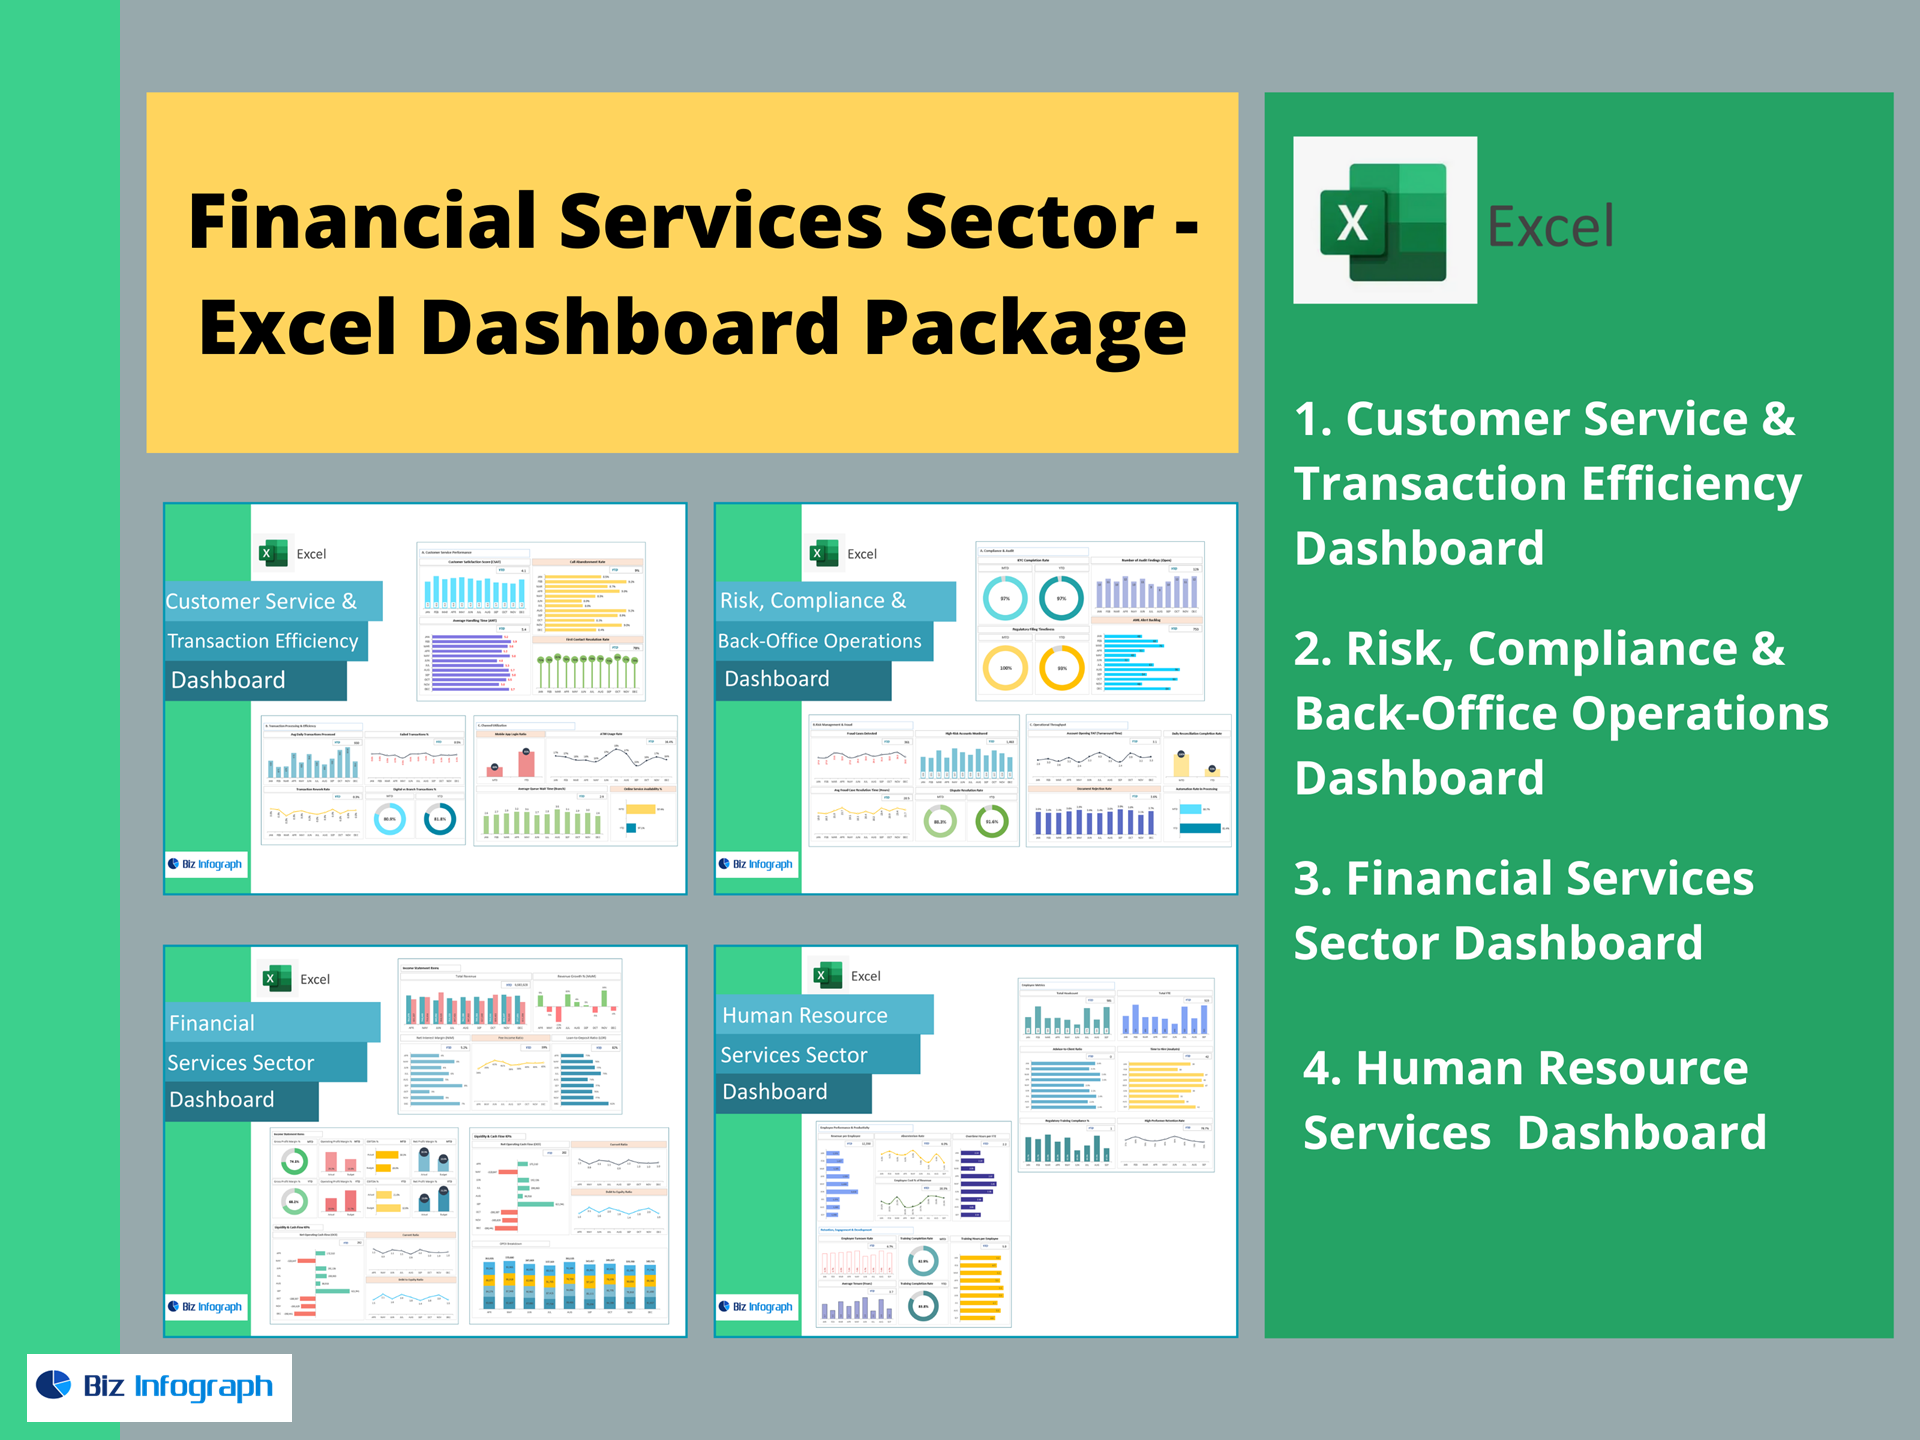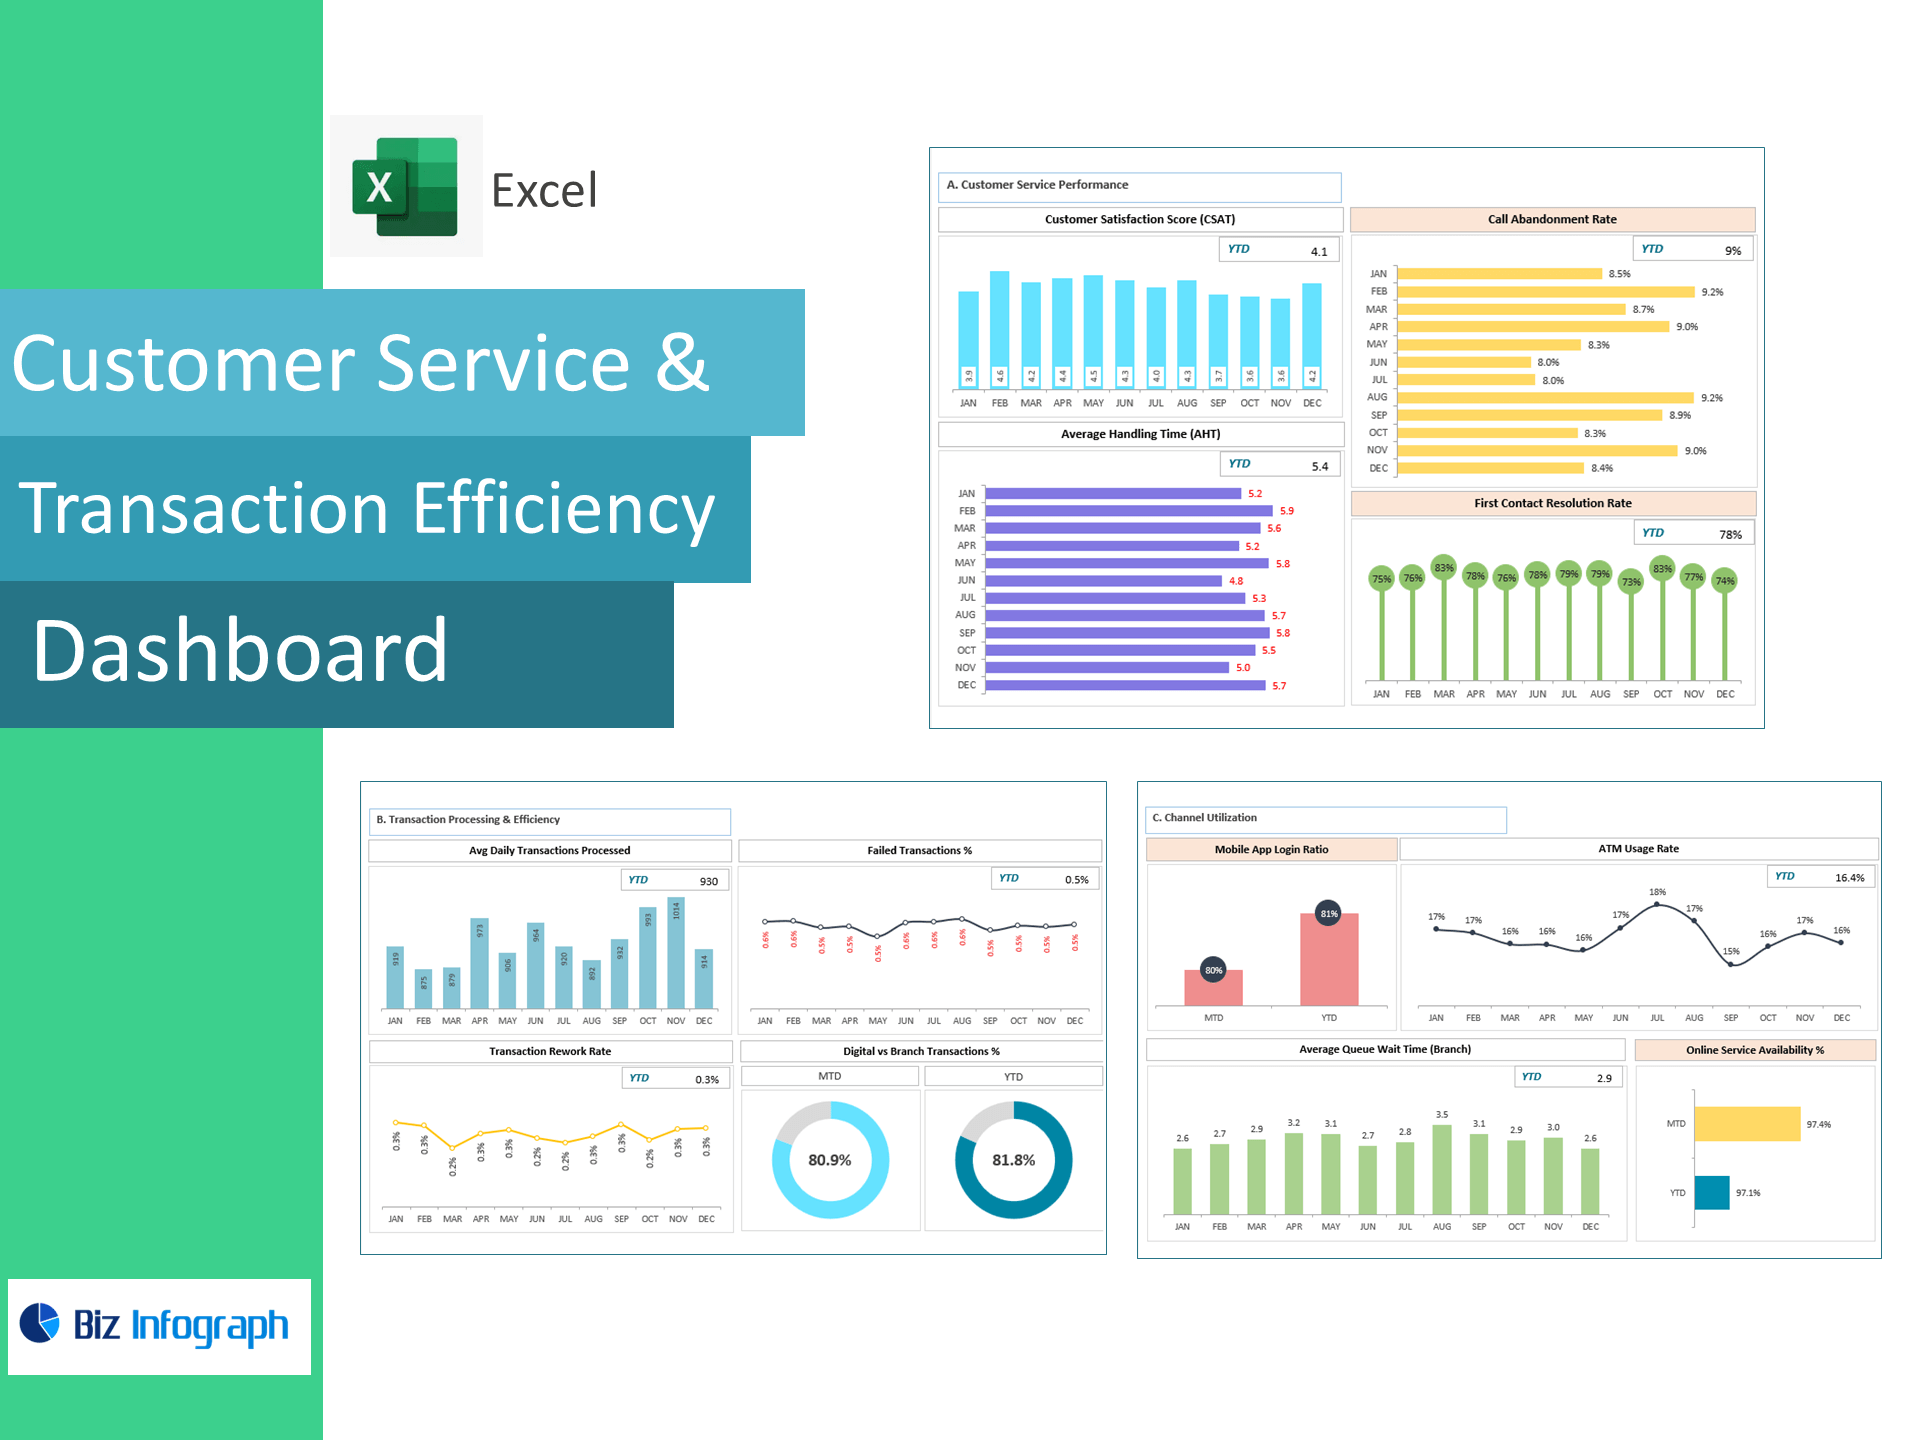
Customer Service & Transaction Efficiency Dashboard — Excel Template
Reduce wait times, increase digital adoption, and resolve cases faster—right in Excel. Built for banks, credit unions, fintechs, and service centers, this template converts contact-center and transaction logs into a live dashboard tracking CSAT, Call Abandonment, AHT, First Contact Resolution, Daily Transactions, Digital vs. Branch %, Failed Txns %, Rework Rate, Mobile App Login Ratio, ATM Usage, Branch Queue Time, and Online Service Availability—so you can improve CX and lower cost-to-serve.
Why teams choose this template
-
CX + Ops in one view: See customer satisfaction alongside call-center and transaction efficiency.
-
Actionable levers: Spot abandonment, long AHT, failure spikes, and queue hotspots in minutes.
-
Accelerate digital: Track mobile logins, ATM usage, and channel mix to shift volumes from branch.
-
Excel-native: Paste your data and go—no add-ins or BI setup required.
KPIs included (with ready-made formulas)
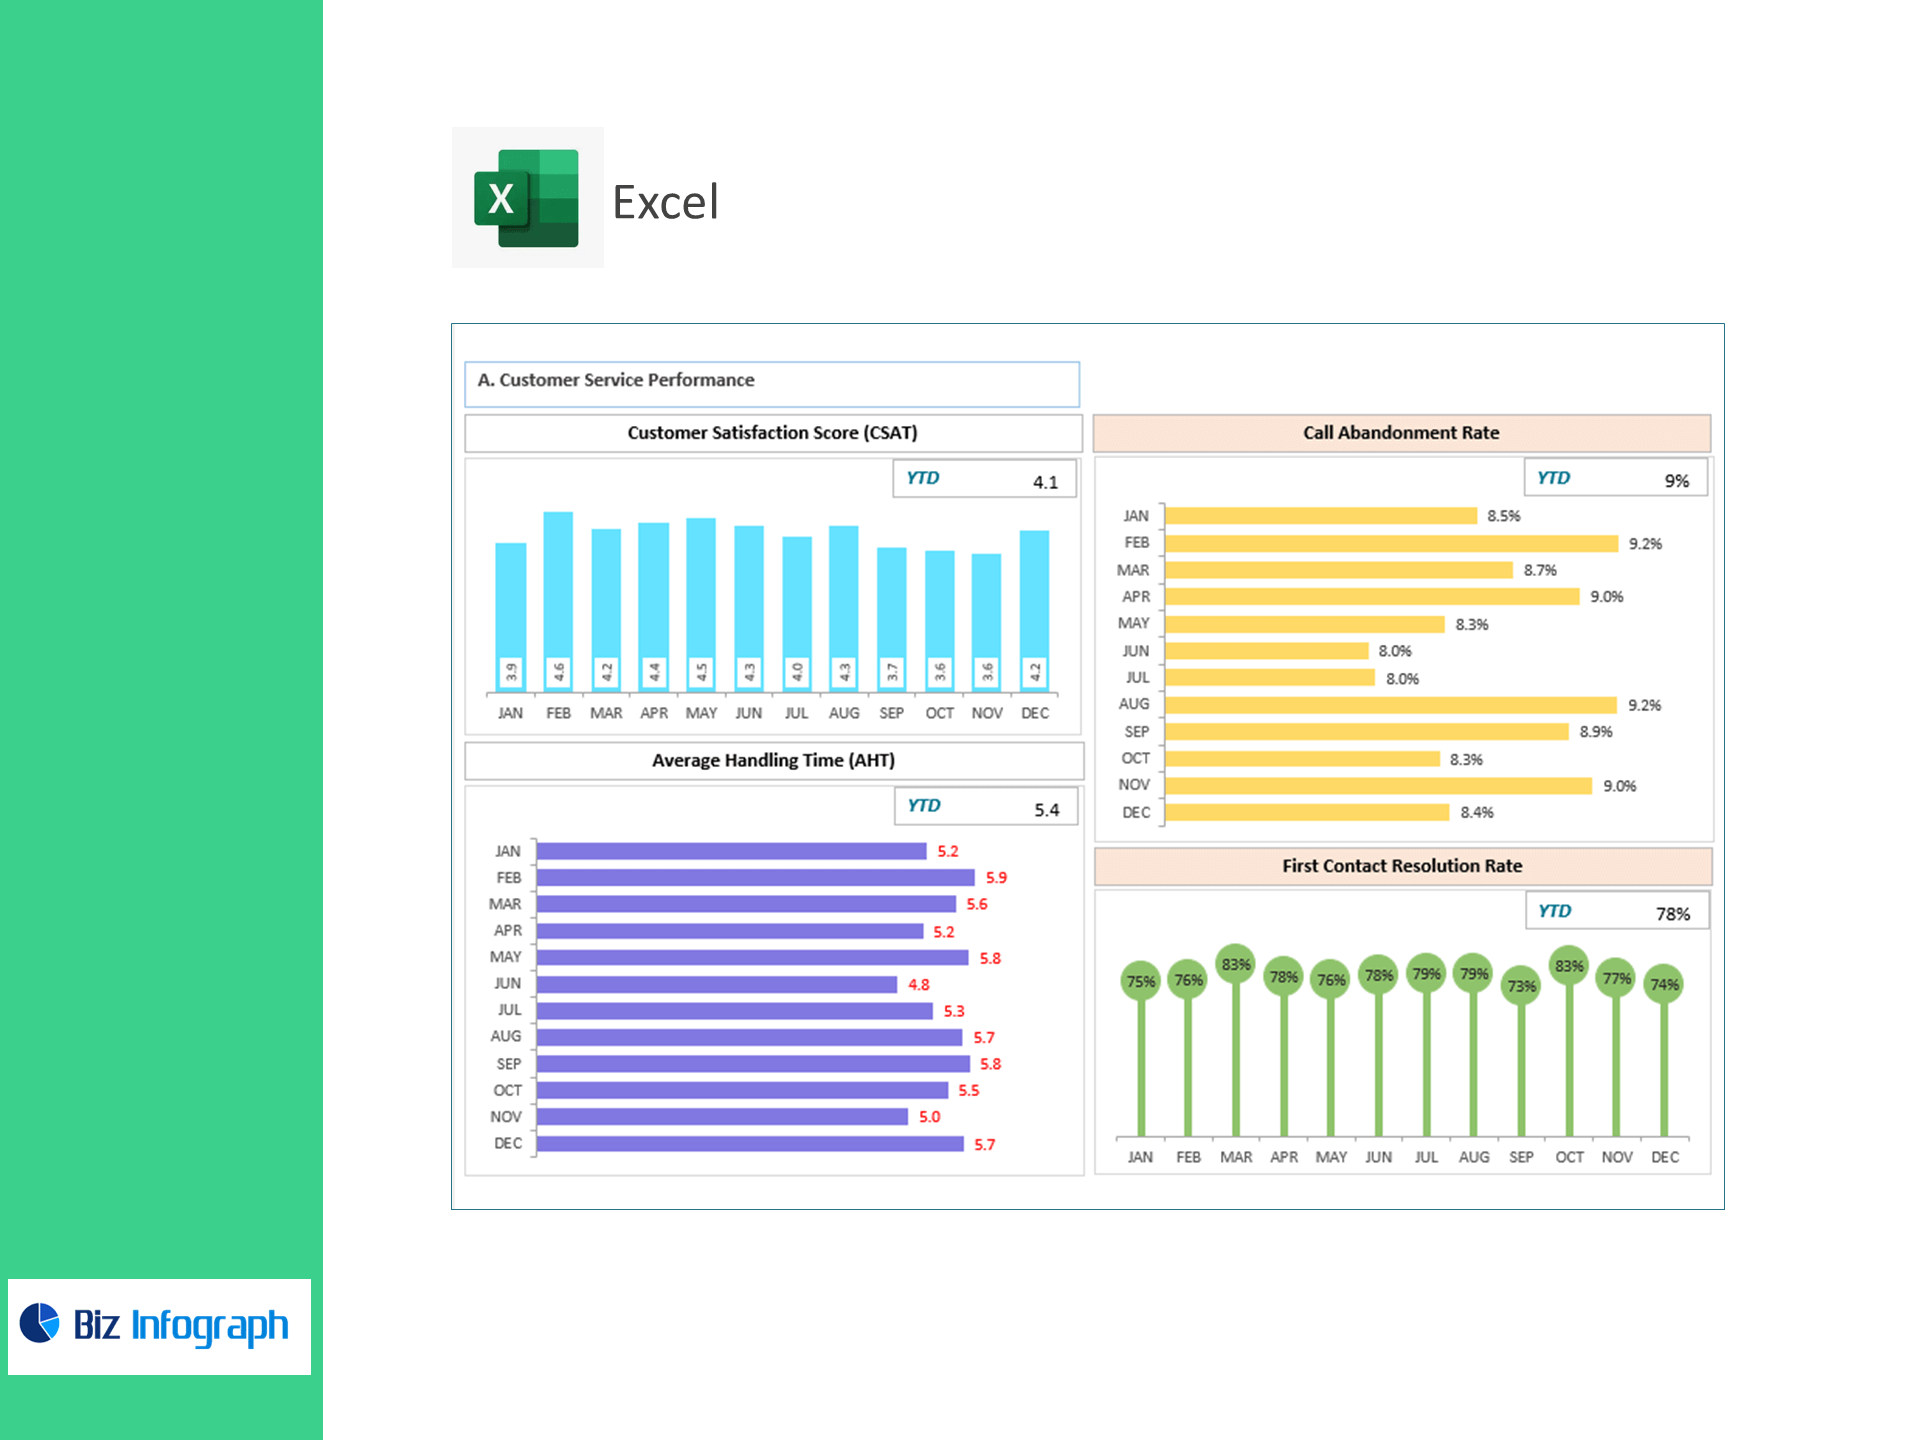
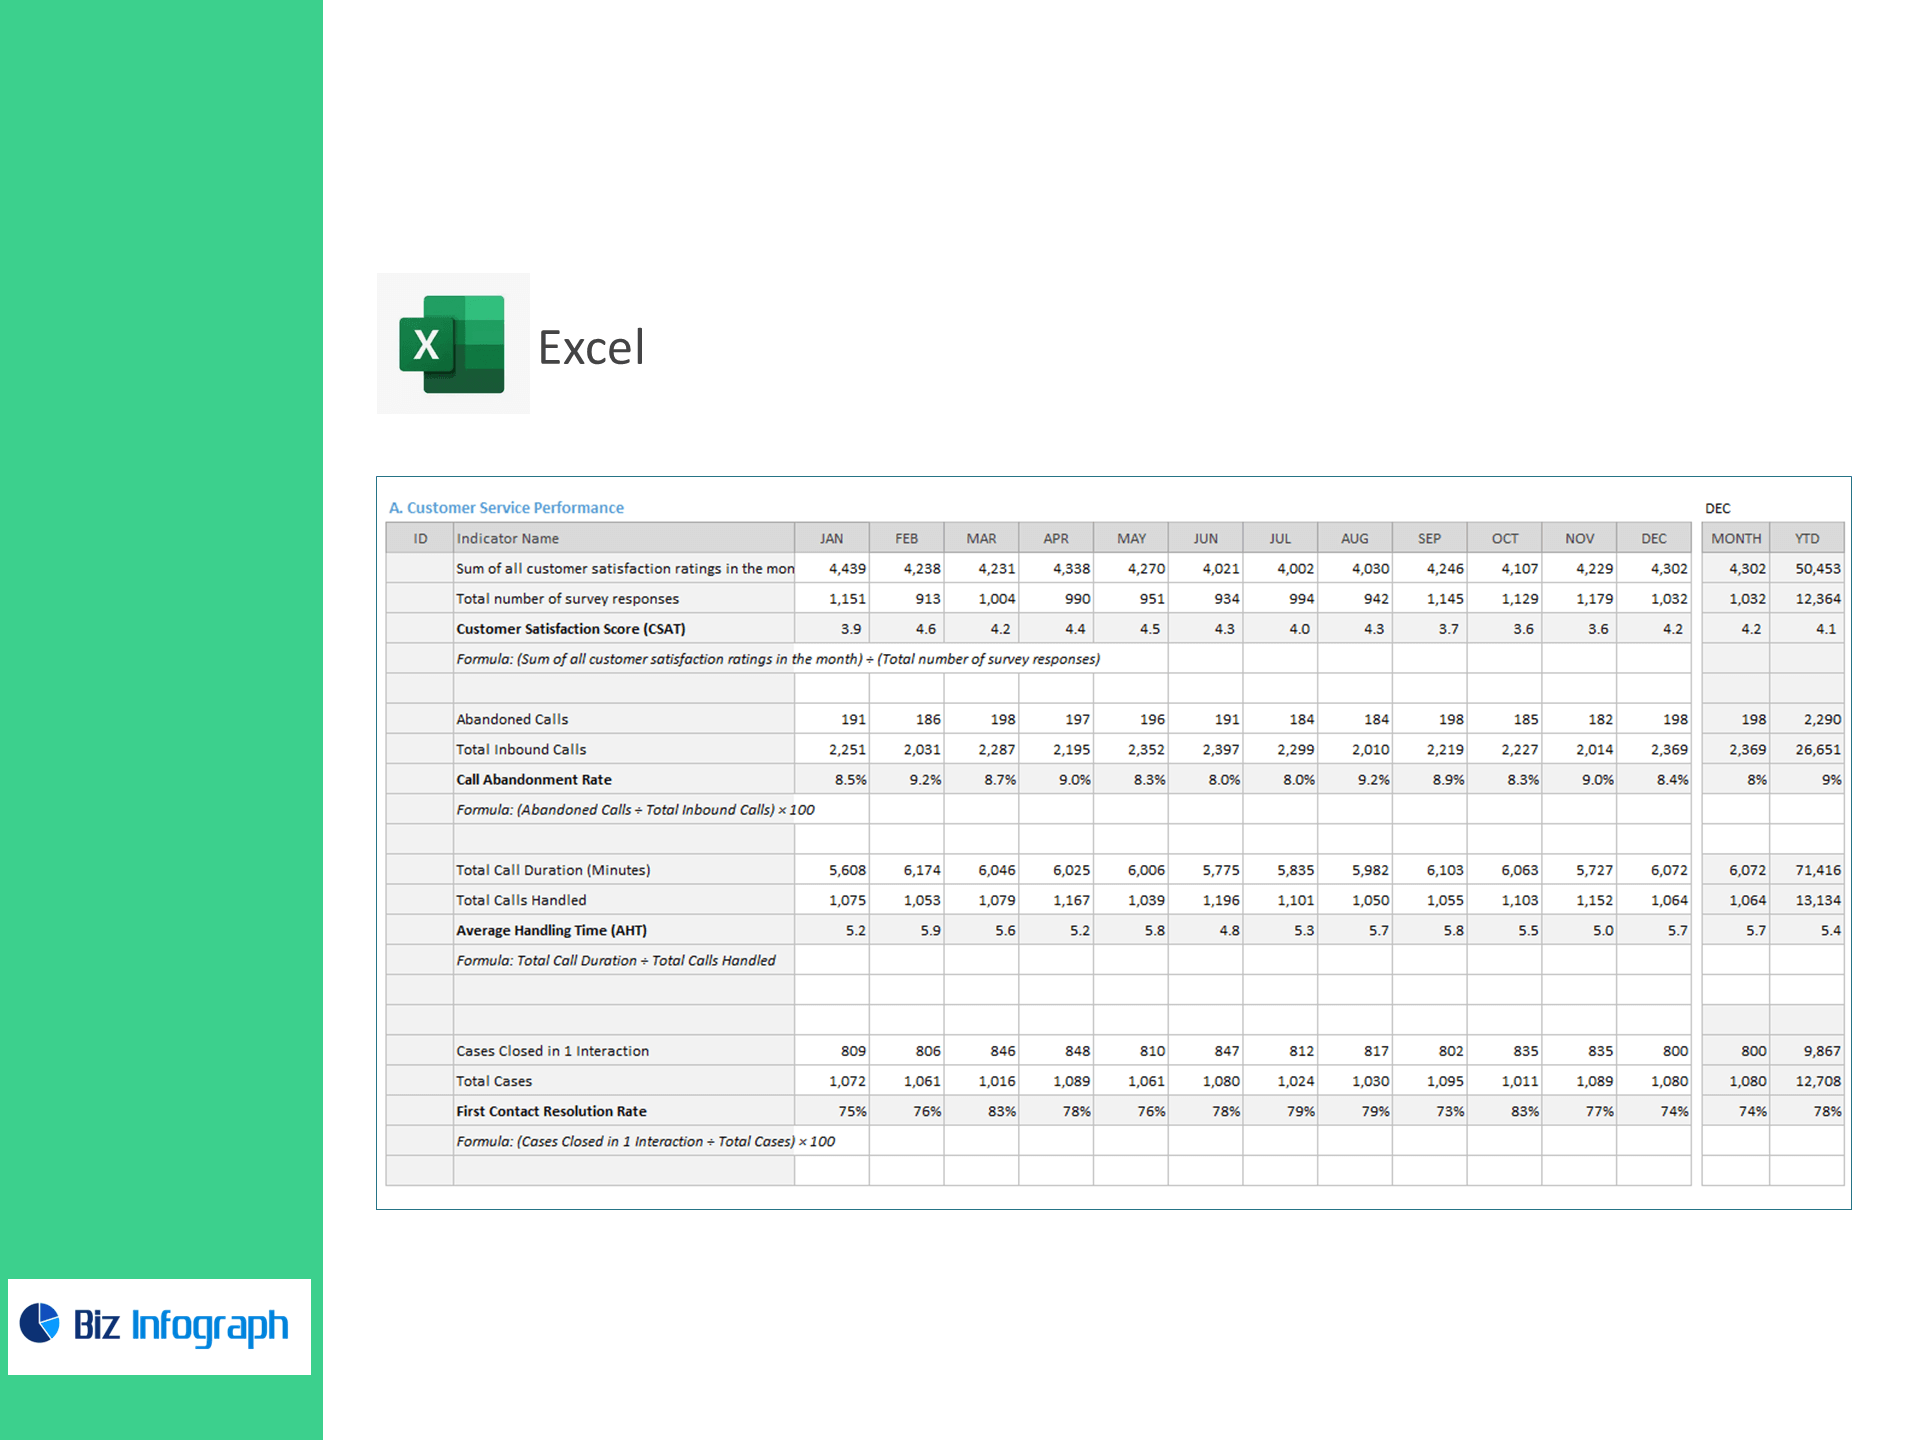
A) Customer Service Performance
-
Customer Satisfaction Score (CSAT) = Σ Monthly Satisfaction Ratings ÷ Survey Responses
-
Call Abandonment Rate (%) = Abandoned Calls ÷ Inbound Calls × 100
-
Average Handling Time (AHT) = Total Call Duration ÷ Calls Handled
-
First Contact Resolution Rate (%) = Cases Closed in 1 Interaction ÷ Total Cases × 100
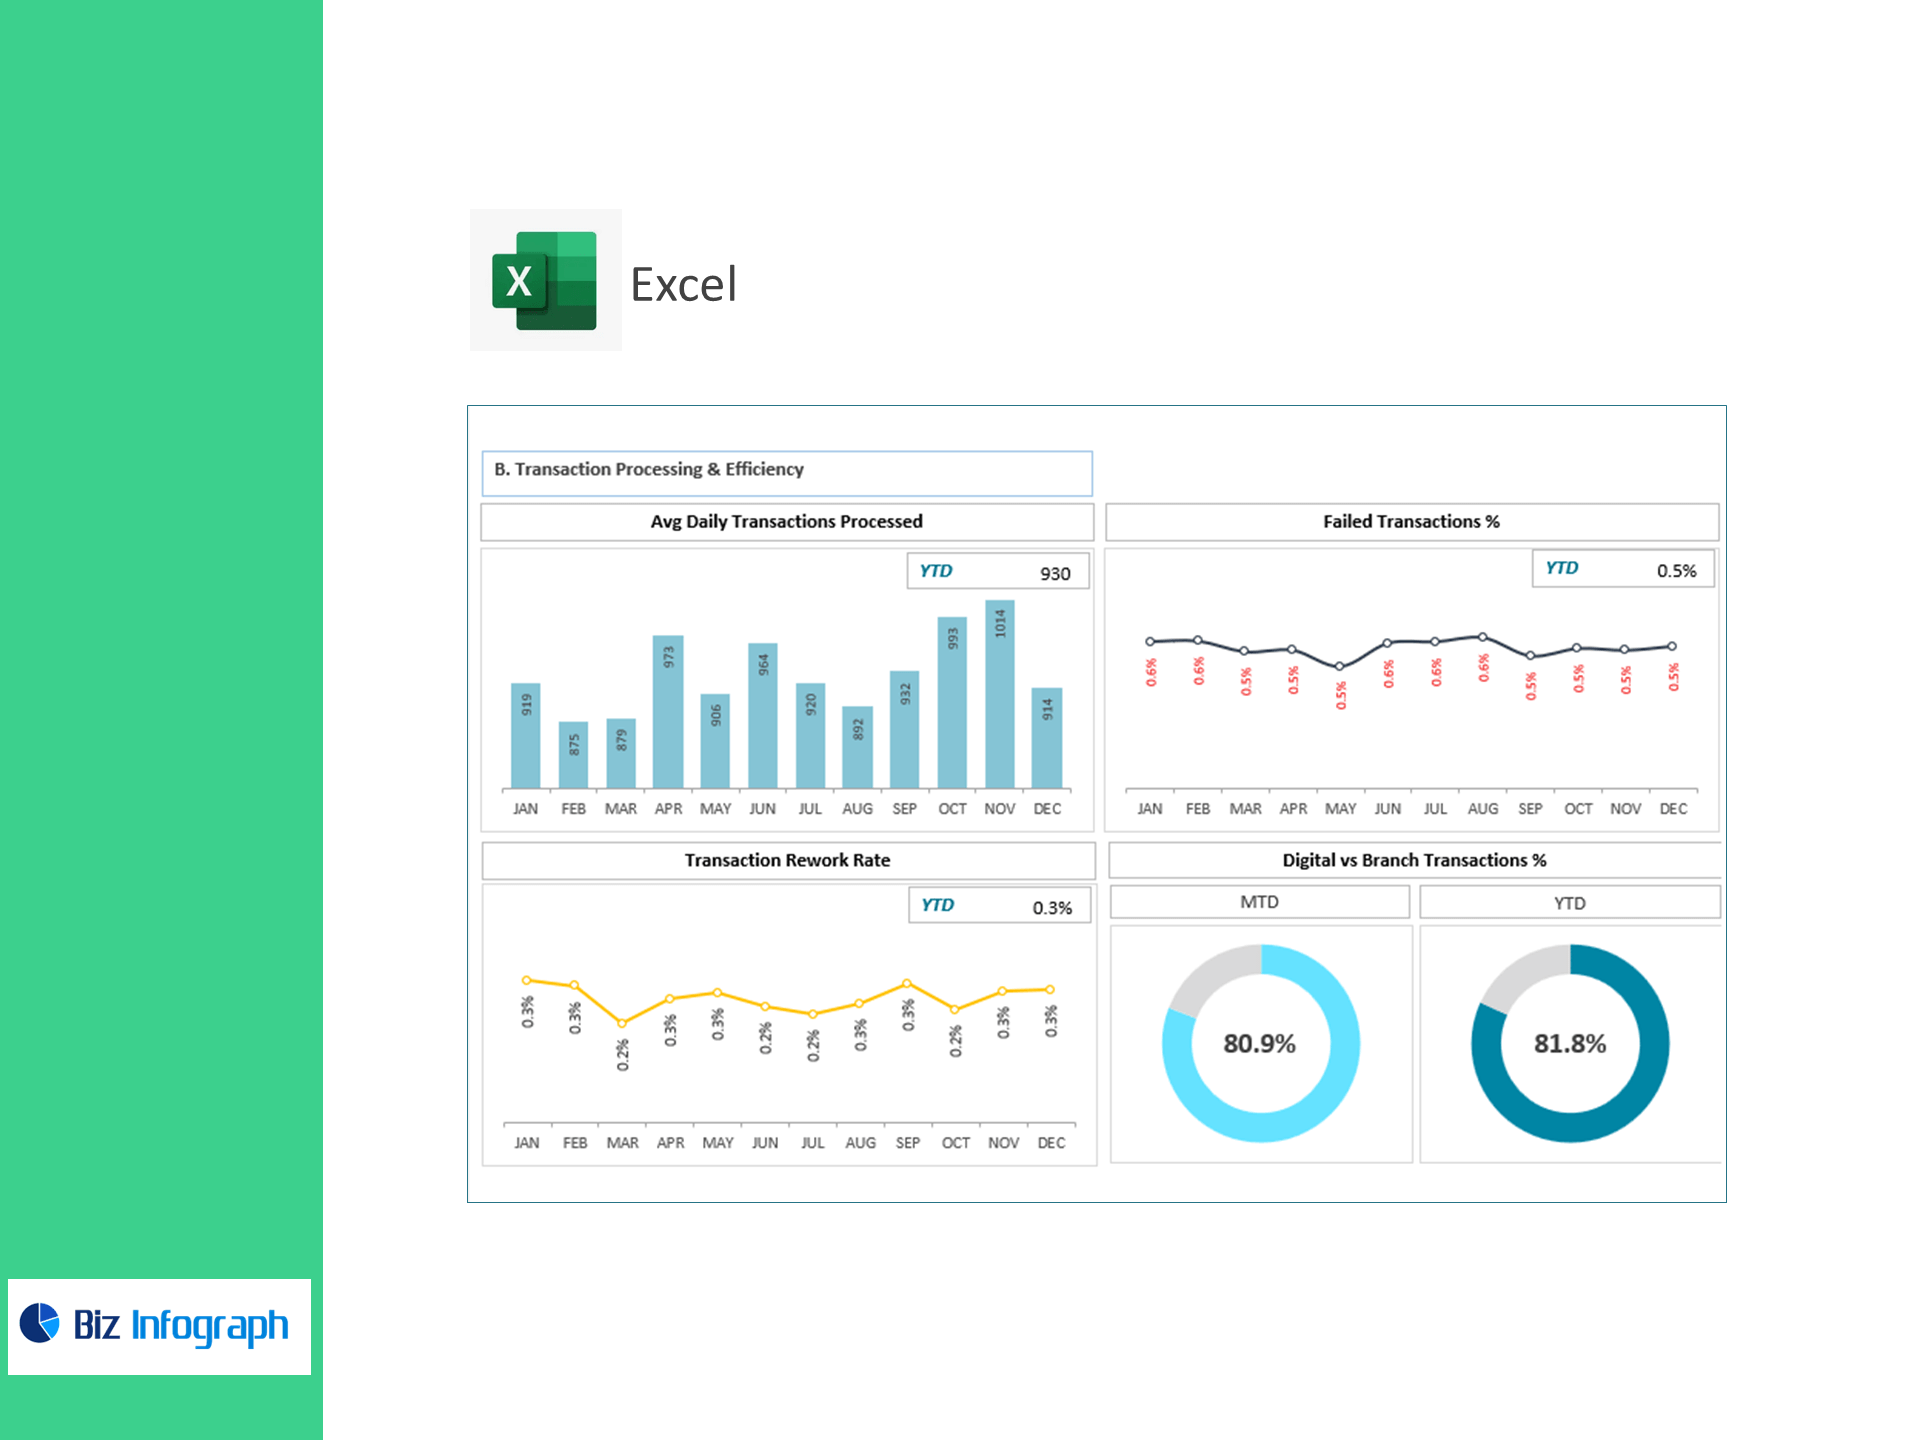
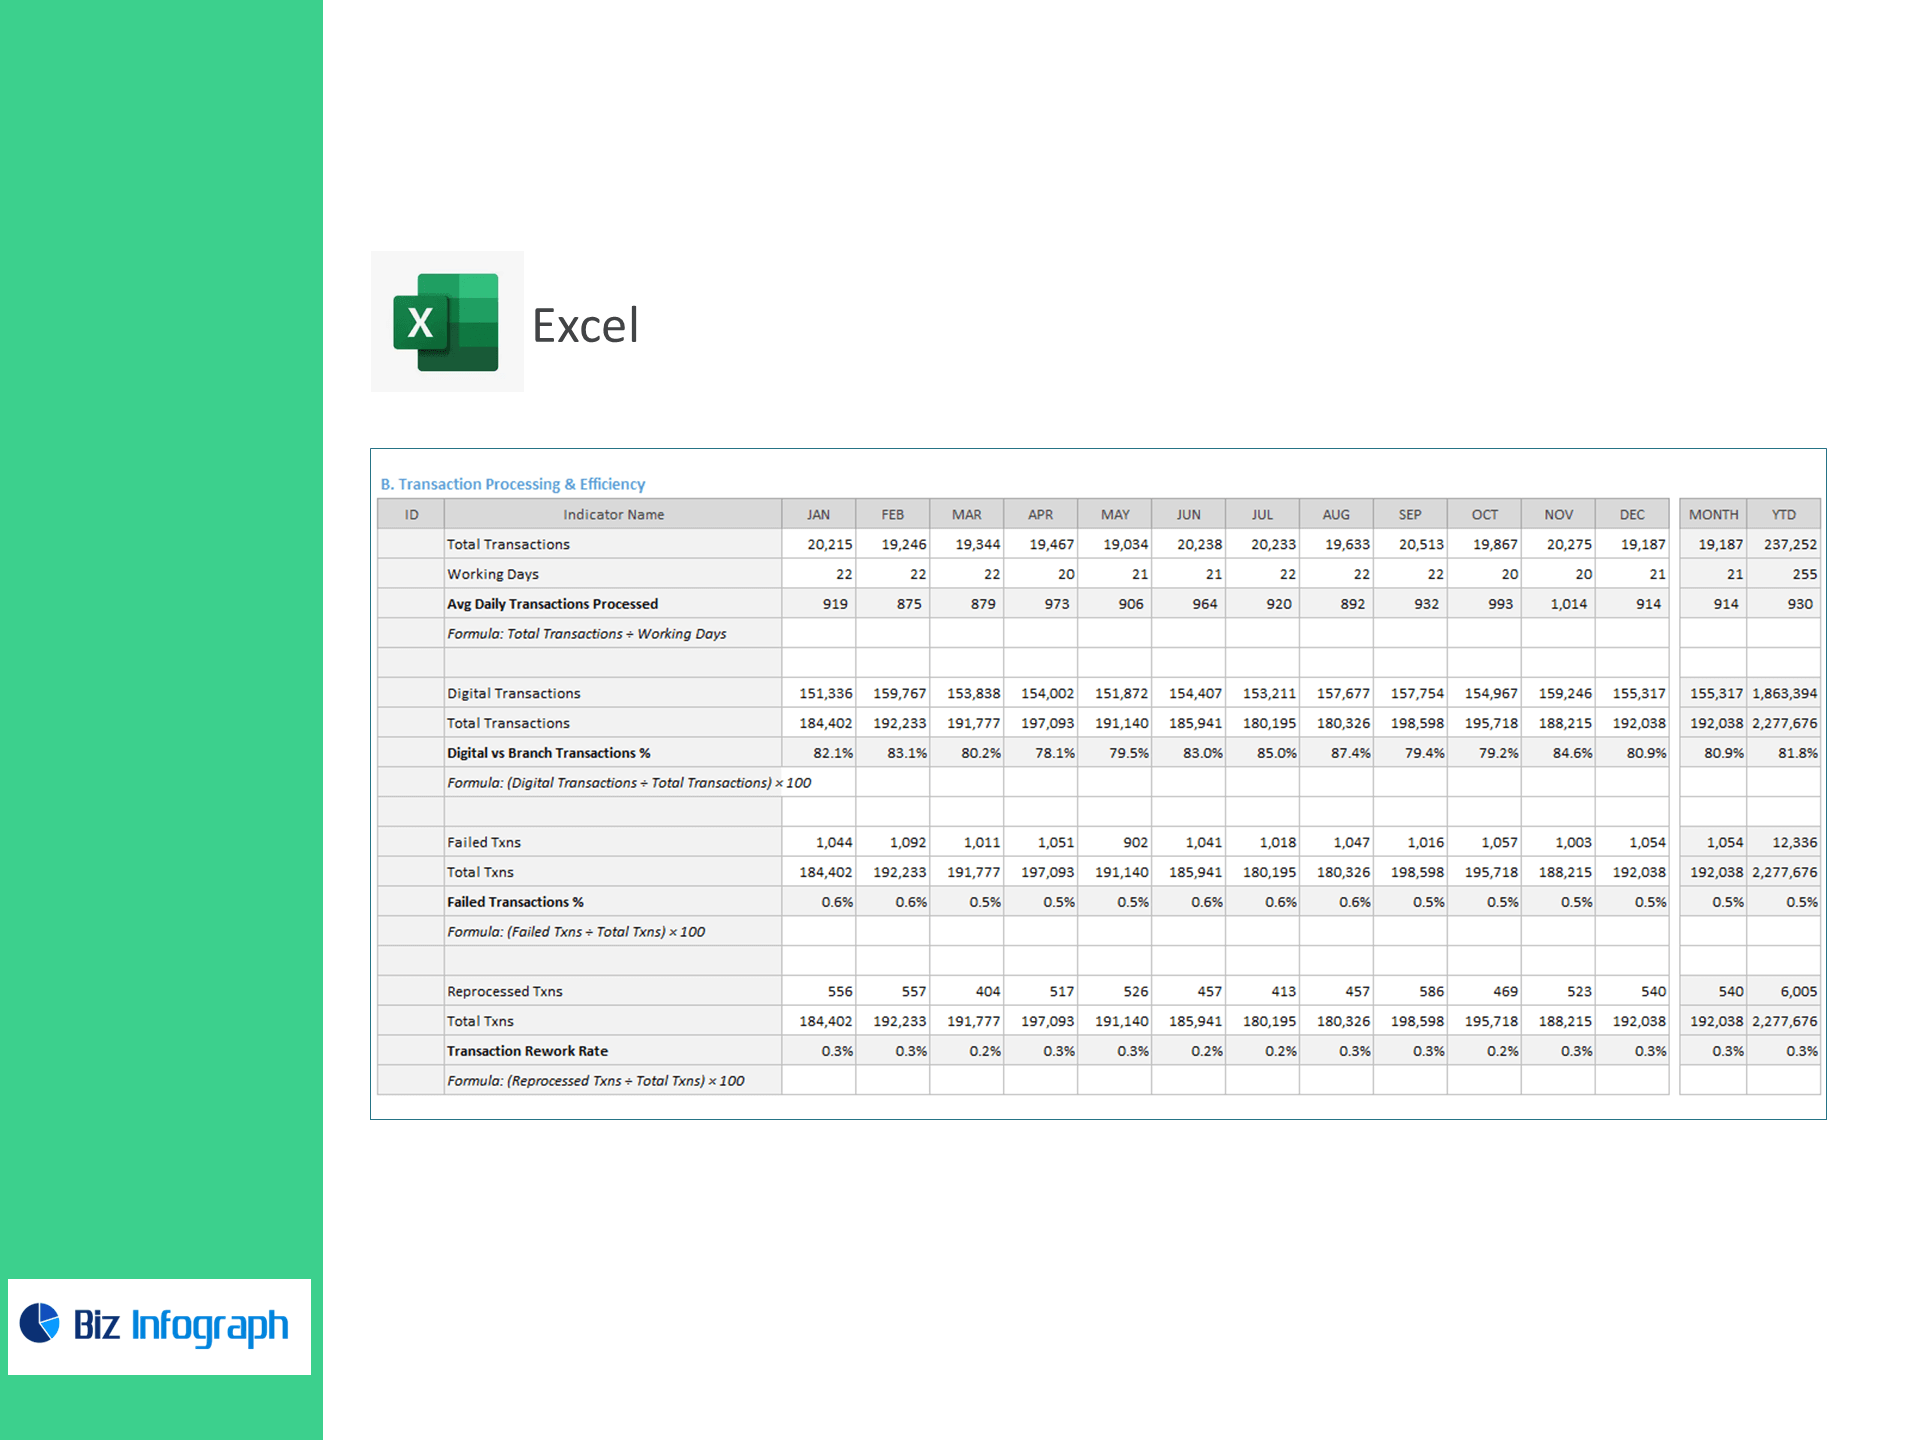
B) Transaction Processing & Efficiency
-
Avg Daily Transactions Processed = Total Transactions ÷ Working Days
-
Digital vs Branch Transactions (%) = Digital Transactions ÷ Total Transactions × 100
-
Failed Transactions (%) = Failed Txns ÷ Total Txns × 100
-
Transaction Rework Rate (%) = Reprocessed Txns ÷ Total Txns × 100
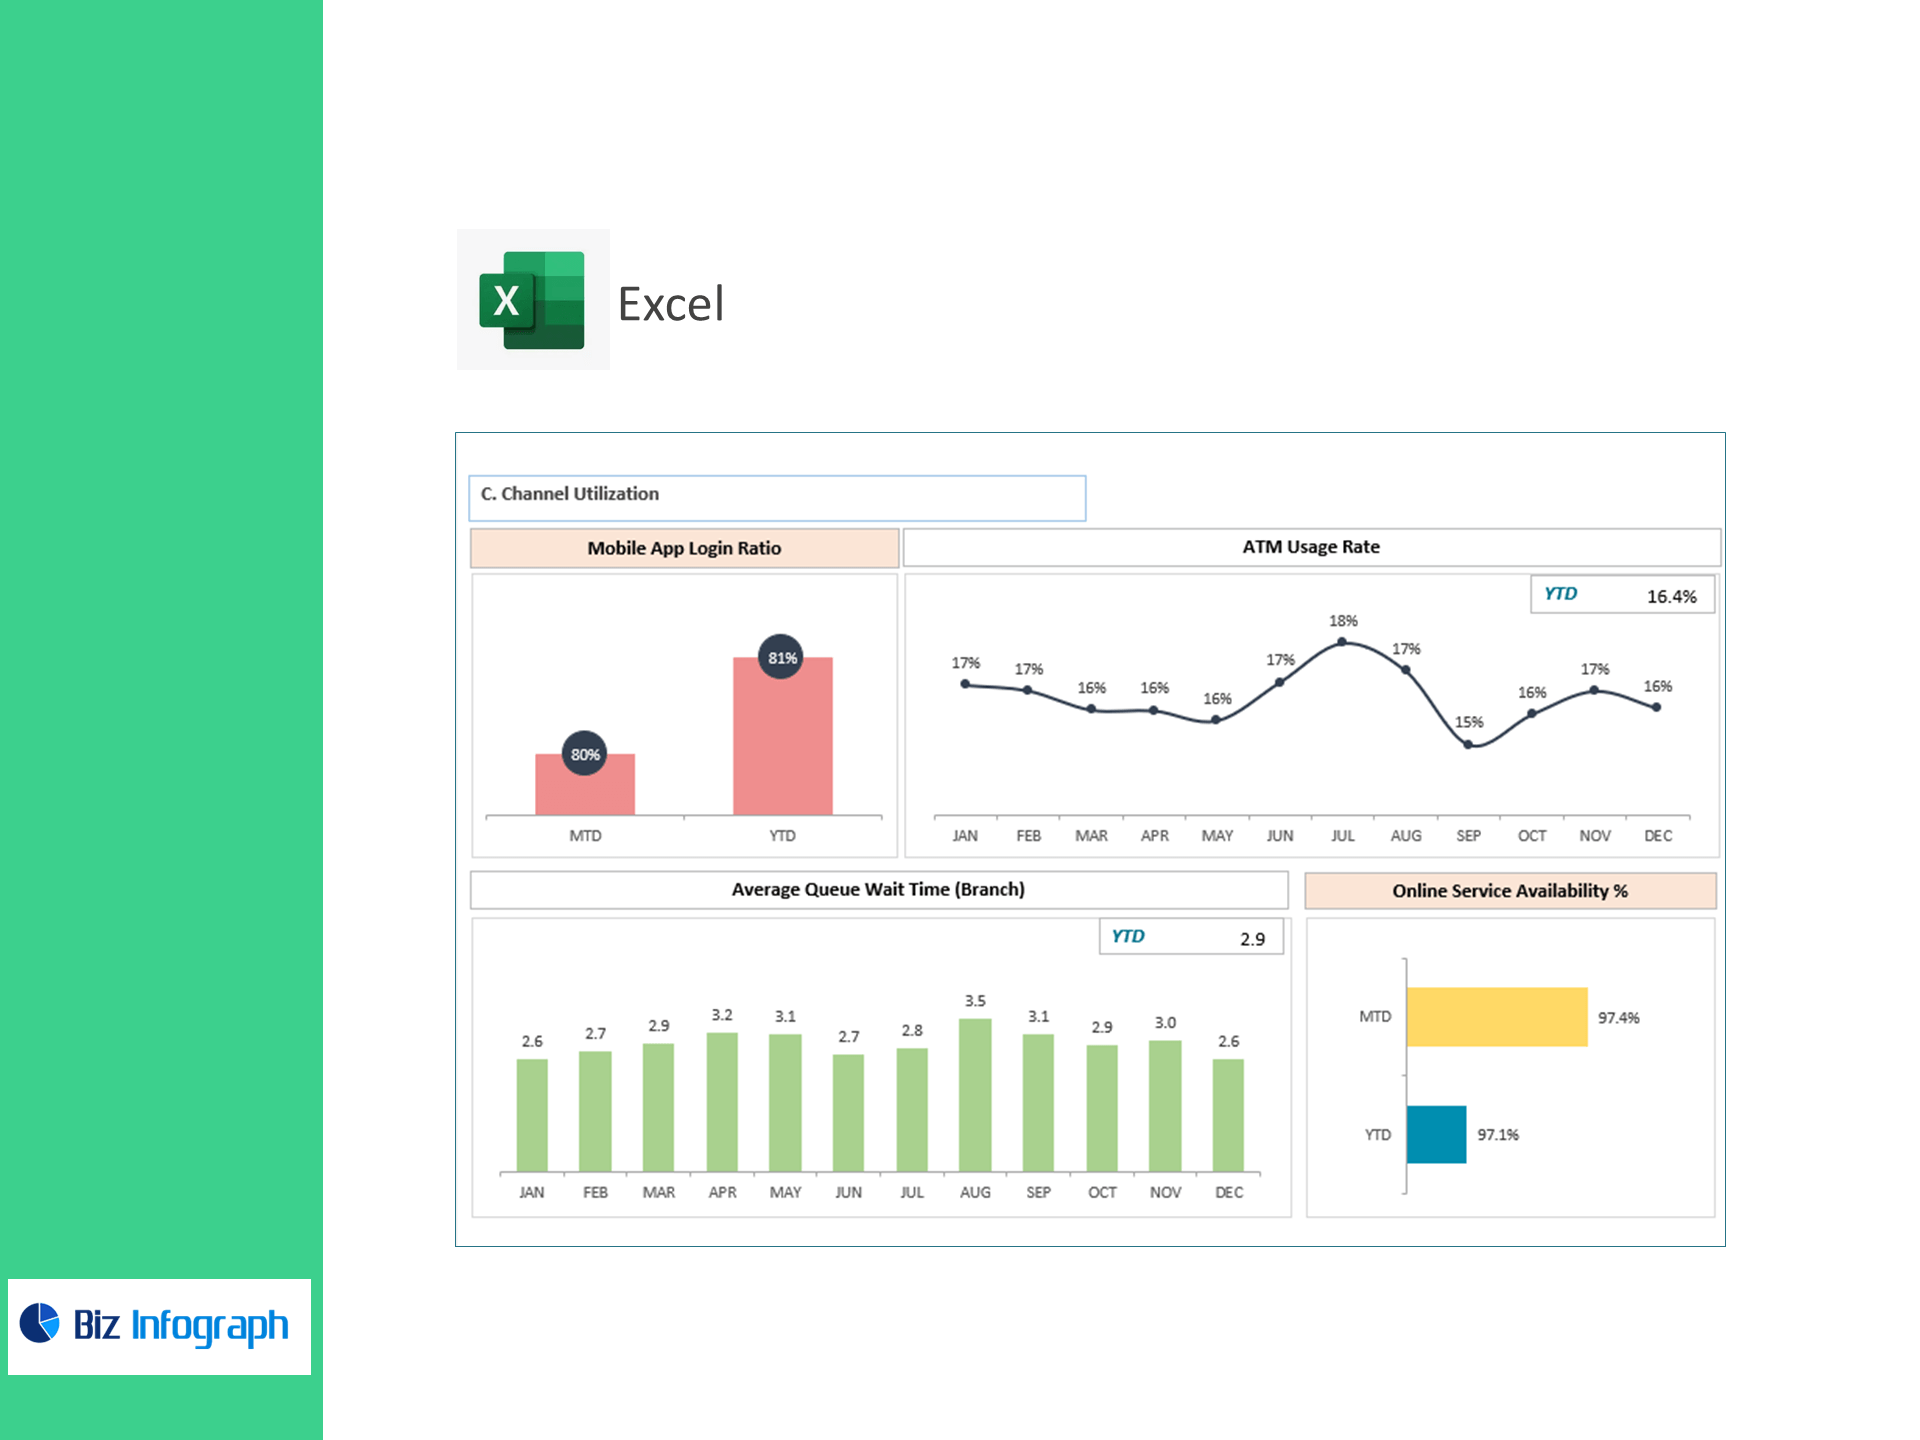
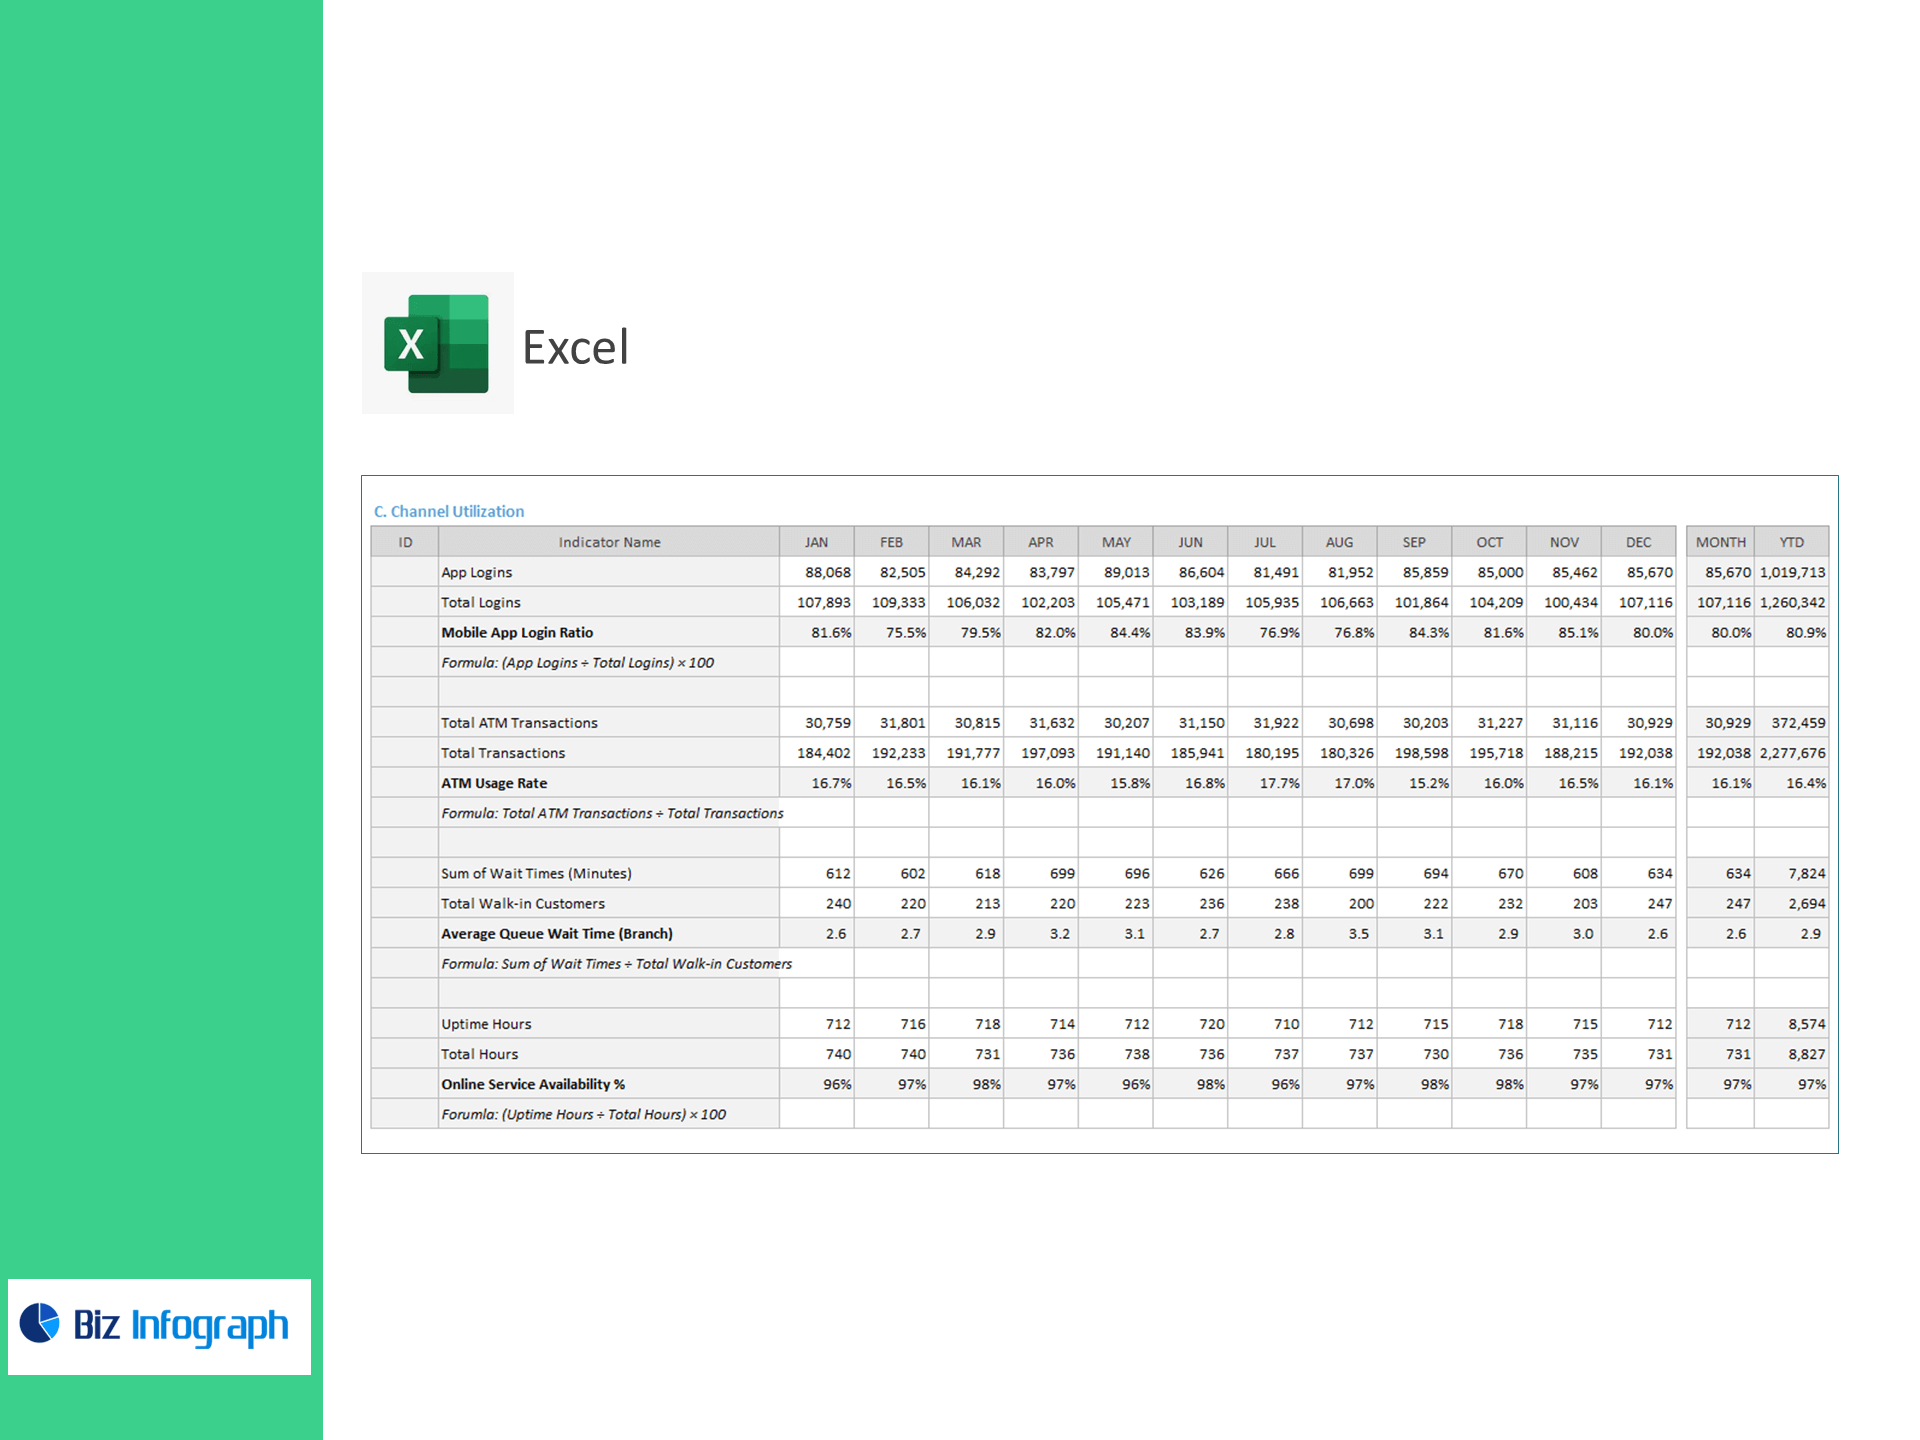
C) Channel Utilization
-
Mobile App Login Ratio (%) = App Logins ÷ Total Logins × 100
-
ATM Usage Rate = Total ATM Transactions ÷ Total Transactions
-
Average Queue Wait Time (Branch) = Σ Wait Minutes ÷ Walk-in Customers
-
Online Service Availability (%) = Uptime Hours ÷ Total Hours × 100
What’s inside
-
Executive Dashboard: Tiles and trends for CSAT, Abandonment, AHT, FCR, Daily Throughput, Digital Mix, Fail/Rework %, App & ATM usage, Queue Time, and Uptime—with variance to target.
-
Contact-Center View: Volume, service levels, and agent productivity diagnostics.
-
Transactions Panel: Failure and rework hotspots by product, channel, or time of day.
-
Channel Analytics: Mobile/ATM adoption, branch queues, and migration opportunities.
-
Targets & Assumptions: Enter KPI targets; automatic Above/Below Target flags.
-
Clean Data Sheets: Import-ready tables for Calls, Cases, Transactions, Logins, ATM, Branch Queues, and Uptime.
How it works
-
Paste CSV/Excel exports from your telephony, CRM, core/processor, and digital channels.
-
Set KPI targets and reporting periods.
-
Review visuals to fix bottlenecks, improve staffing, and drive digital adoption.
Benefits
-
Happier customers: Lower abandonment and wait times, raise FCR and CSAT.
-
Lower costs: Reduce AHT, fail/rework rates, and unnecessary branch traffic.
-
Digital growth: Track and lift mobile logins and ATM usage with clear goals.
-
Faster decisions: Board-ready visuals with transparent formulas.
For ready-to-use Dashboard Templates: