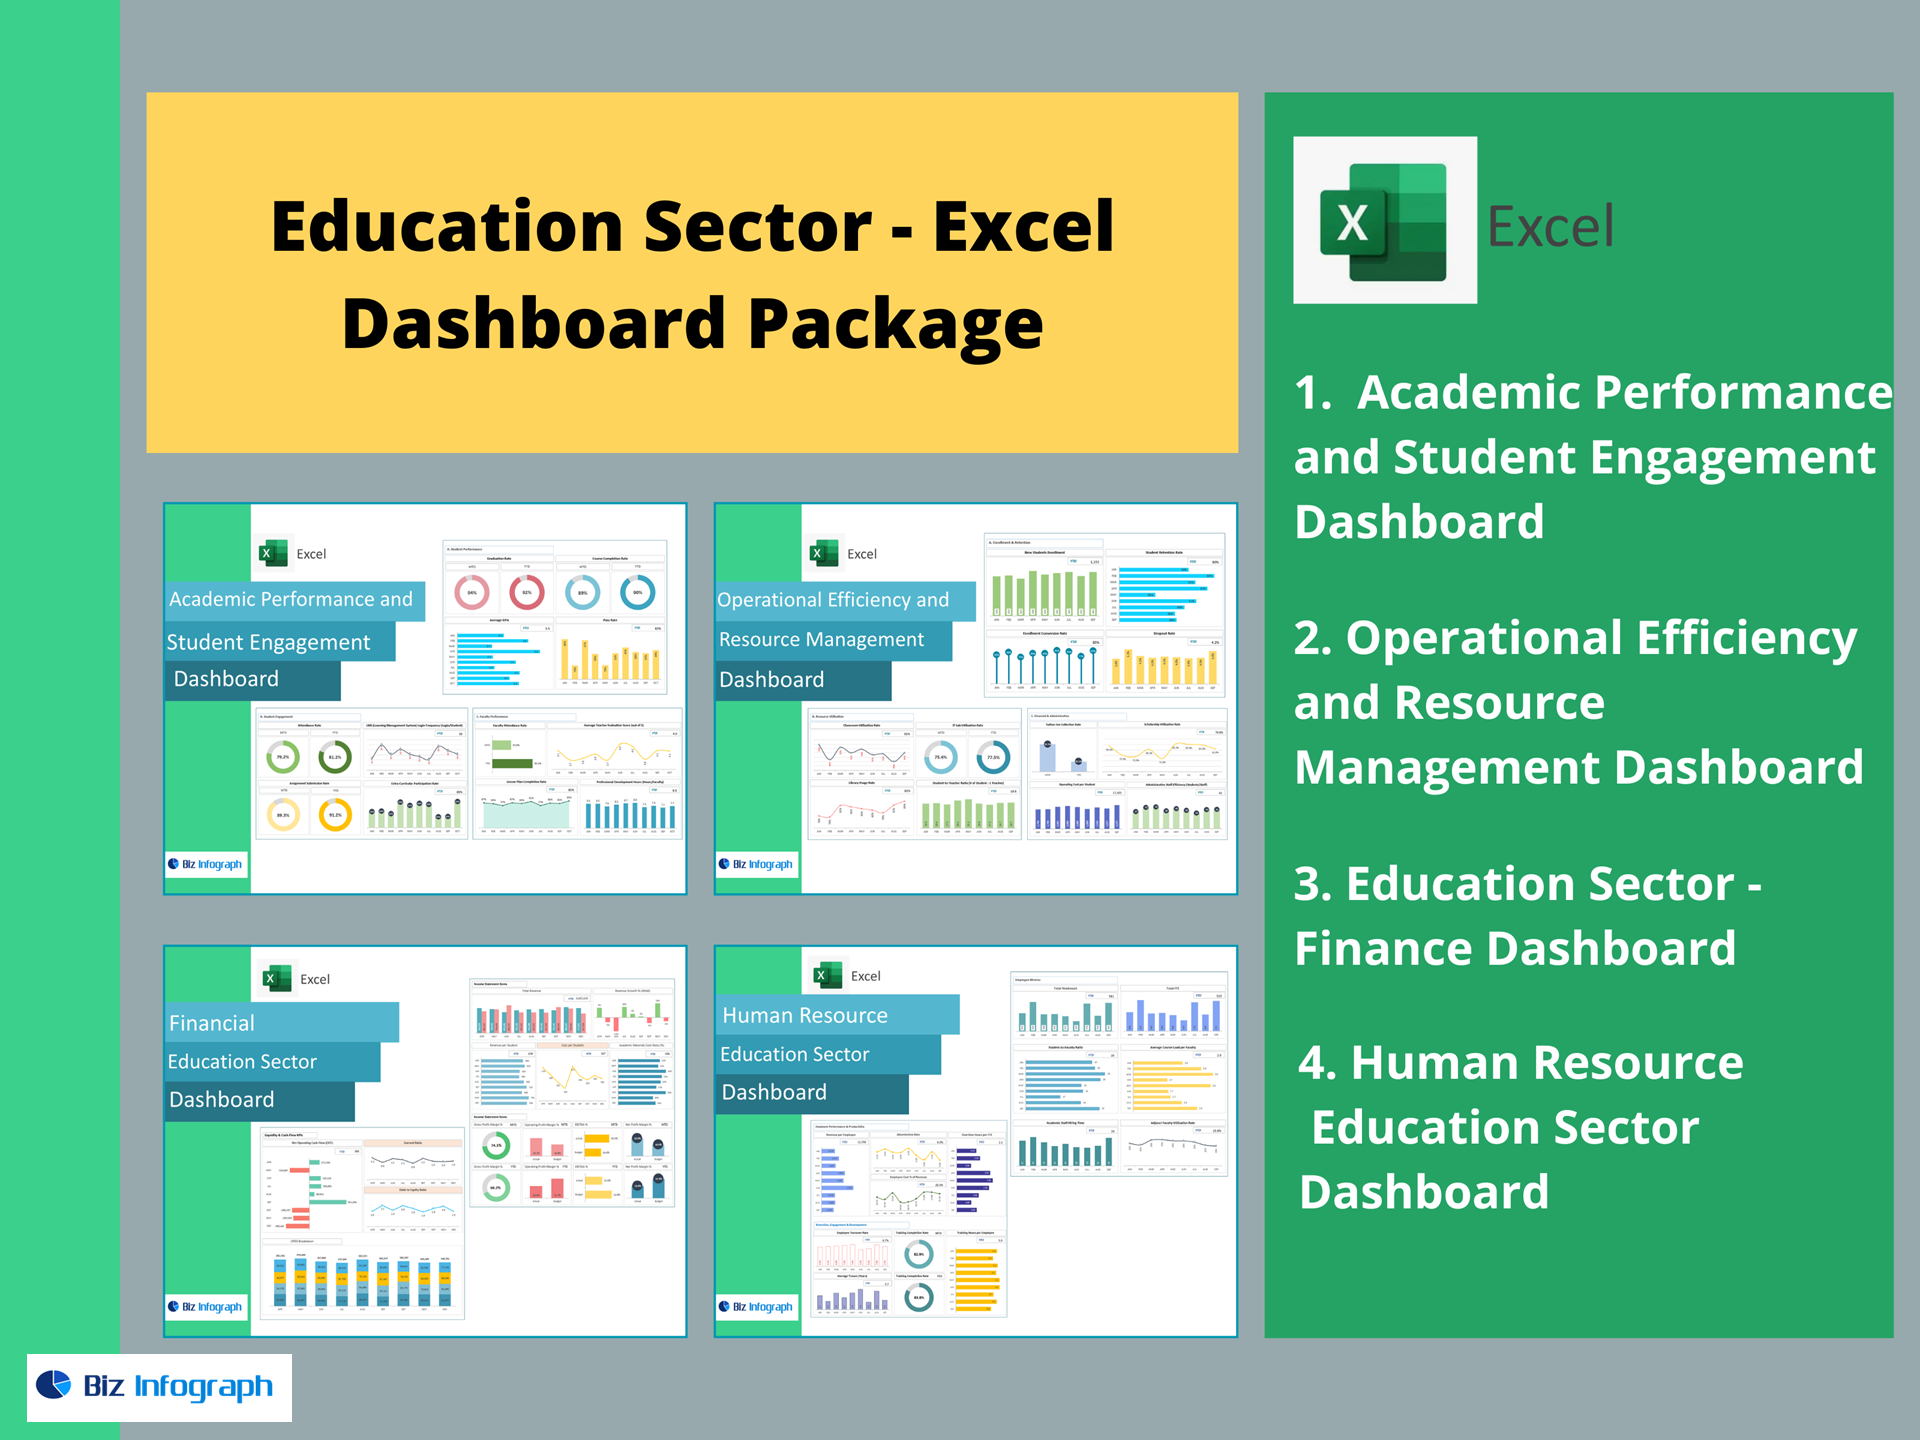
Academic Performance & Student Engagement Dashboard — Excel Template
Give your school a single-pane view of learning outcomes. This ready-to-use Excel dashboard tracks student performance, engagement, and faculty effectiveness—so you can lift graduation rates, improve attendance, and drive better teaching practices without building a model from scratch.
Who it’s for
Principals, Academic Deans, Program Chairs, Institutional Research, and Student Success teams that need actionable education KPIs for K-12, colleges, and training institutes.
What you get
-
Interactive dashboard (Excel 2016+ Win/Mac, no add-ins).
-
Clean data tabs for students, courses, exams, LMS, activities, and faculty.
-
Targets & RAG status (red/amber/green), trendlines (MoM/YoY), and variance to goal.
-
Filters by program, grade/level, cohort, section, instructor, and term.
KPIs included (with formulas)
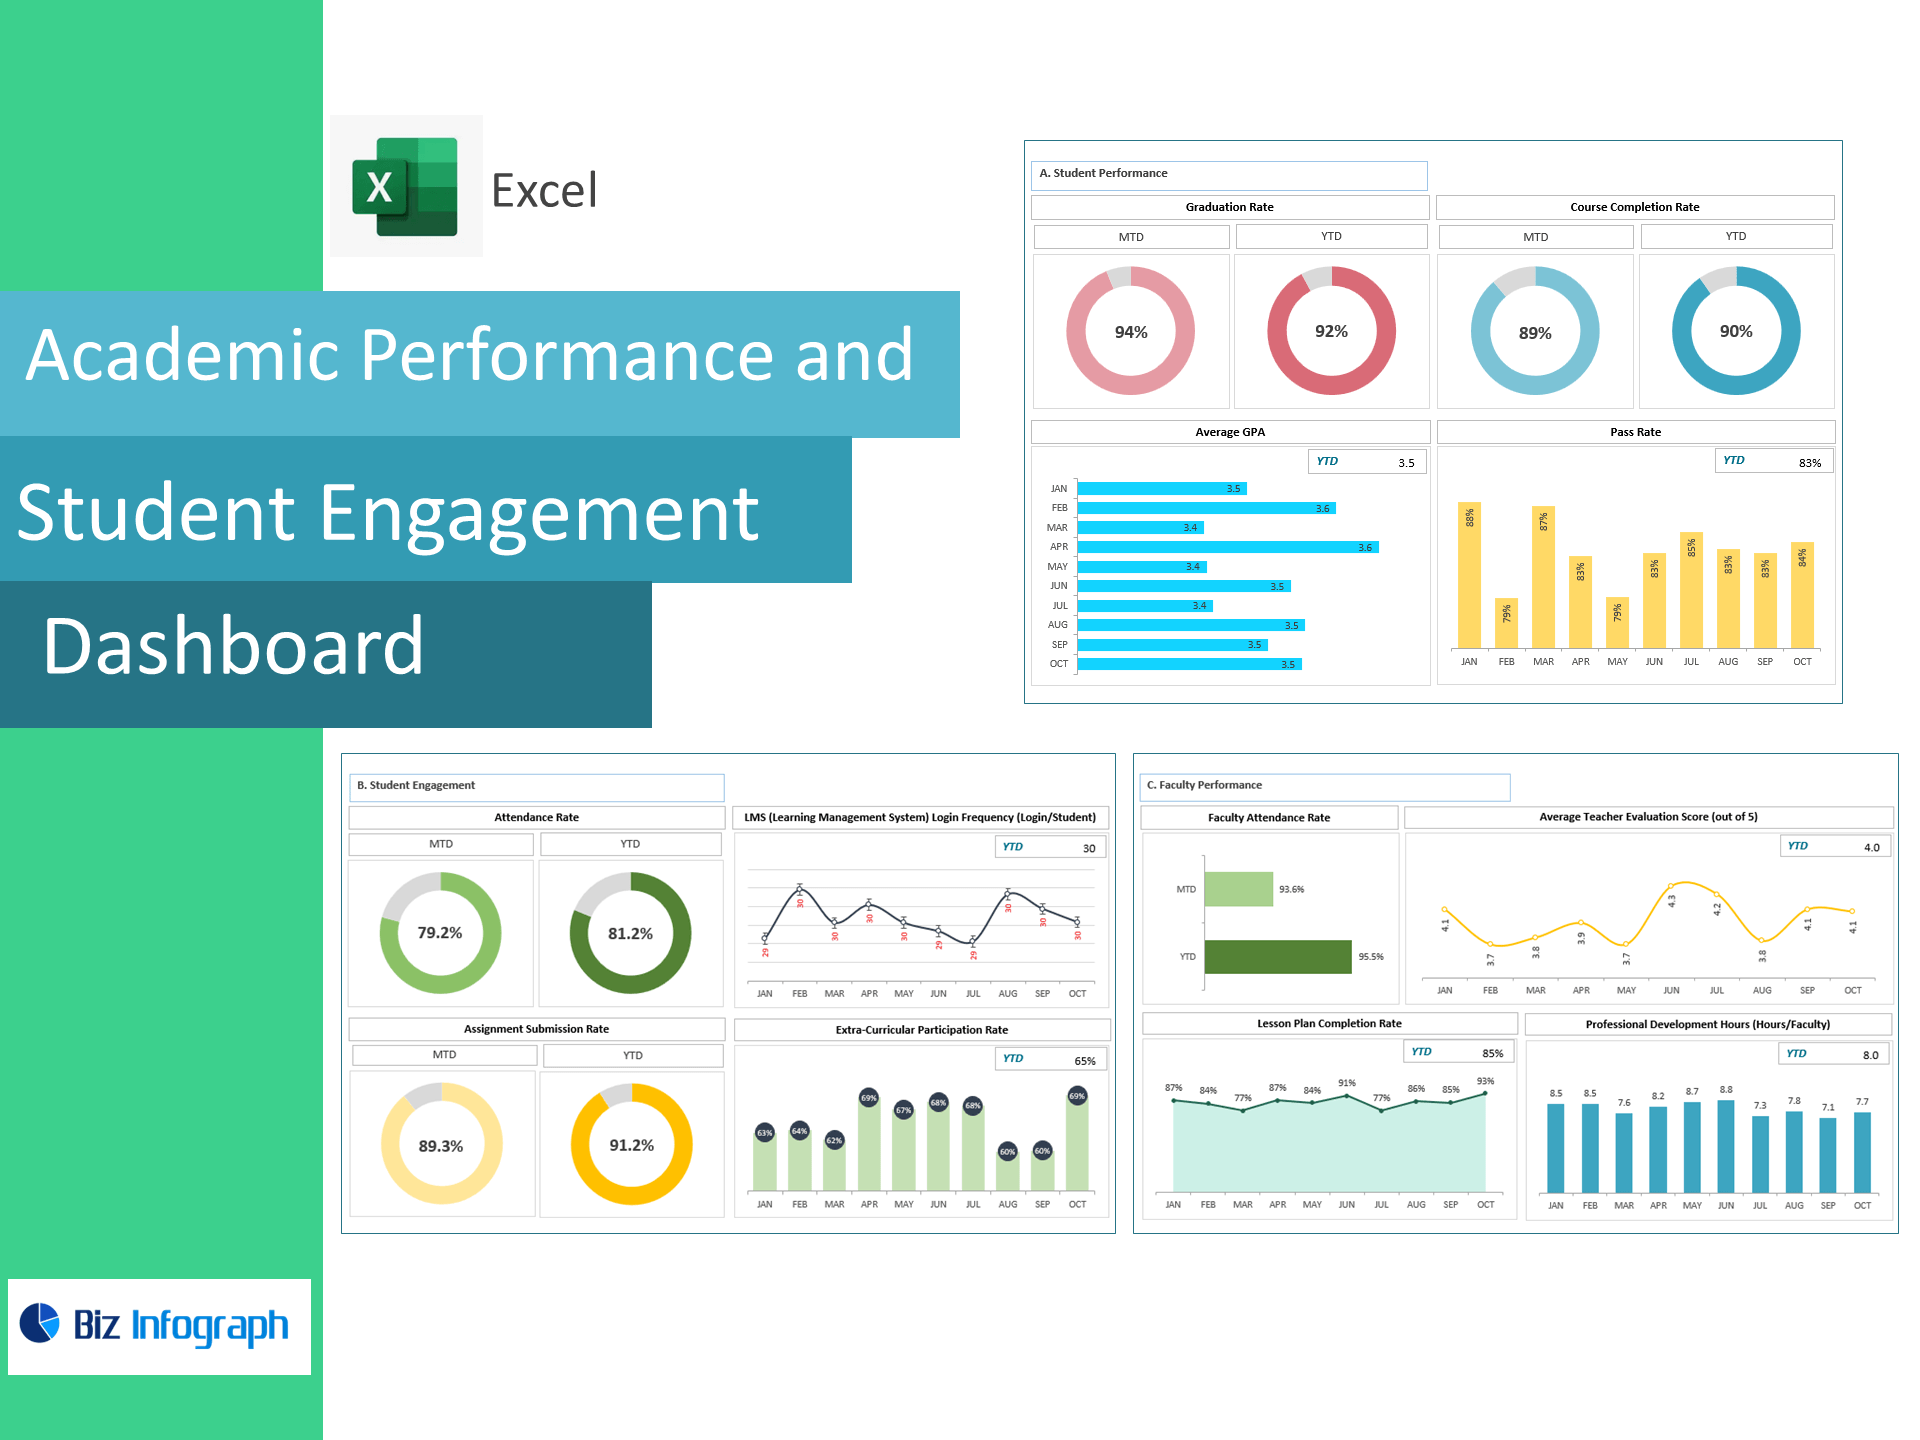
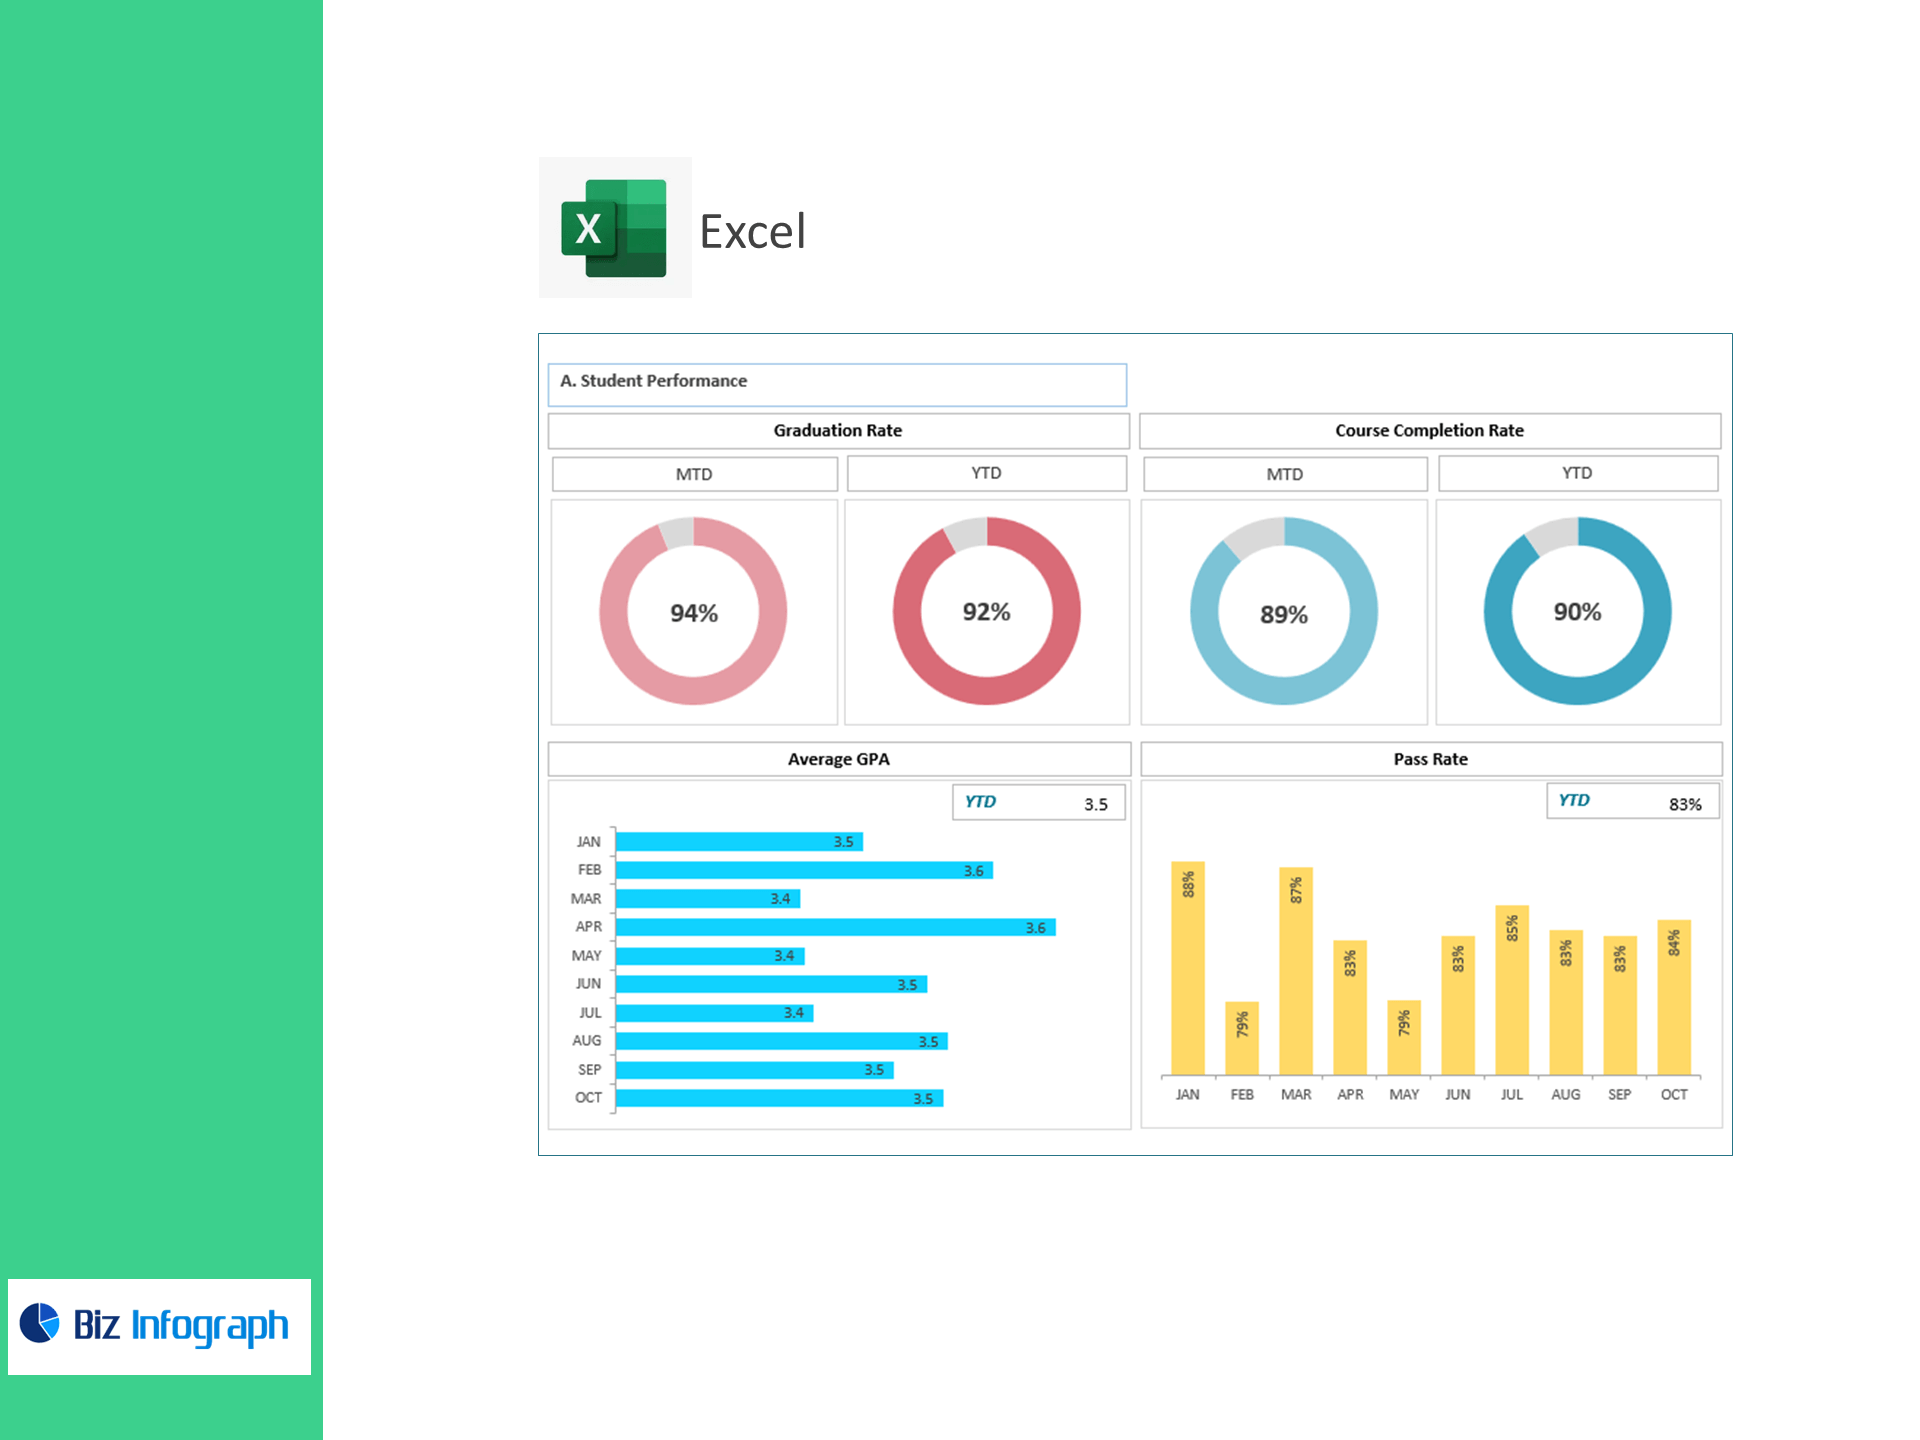
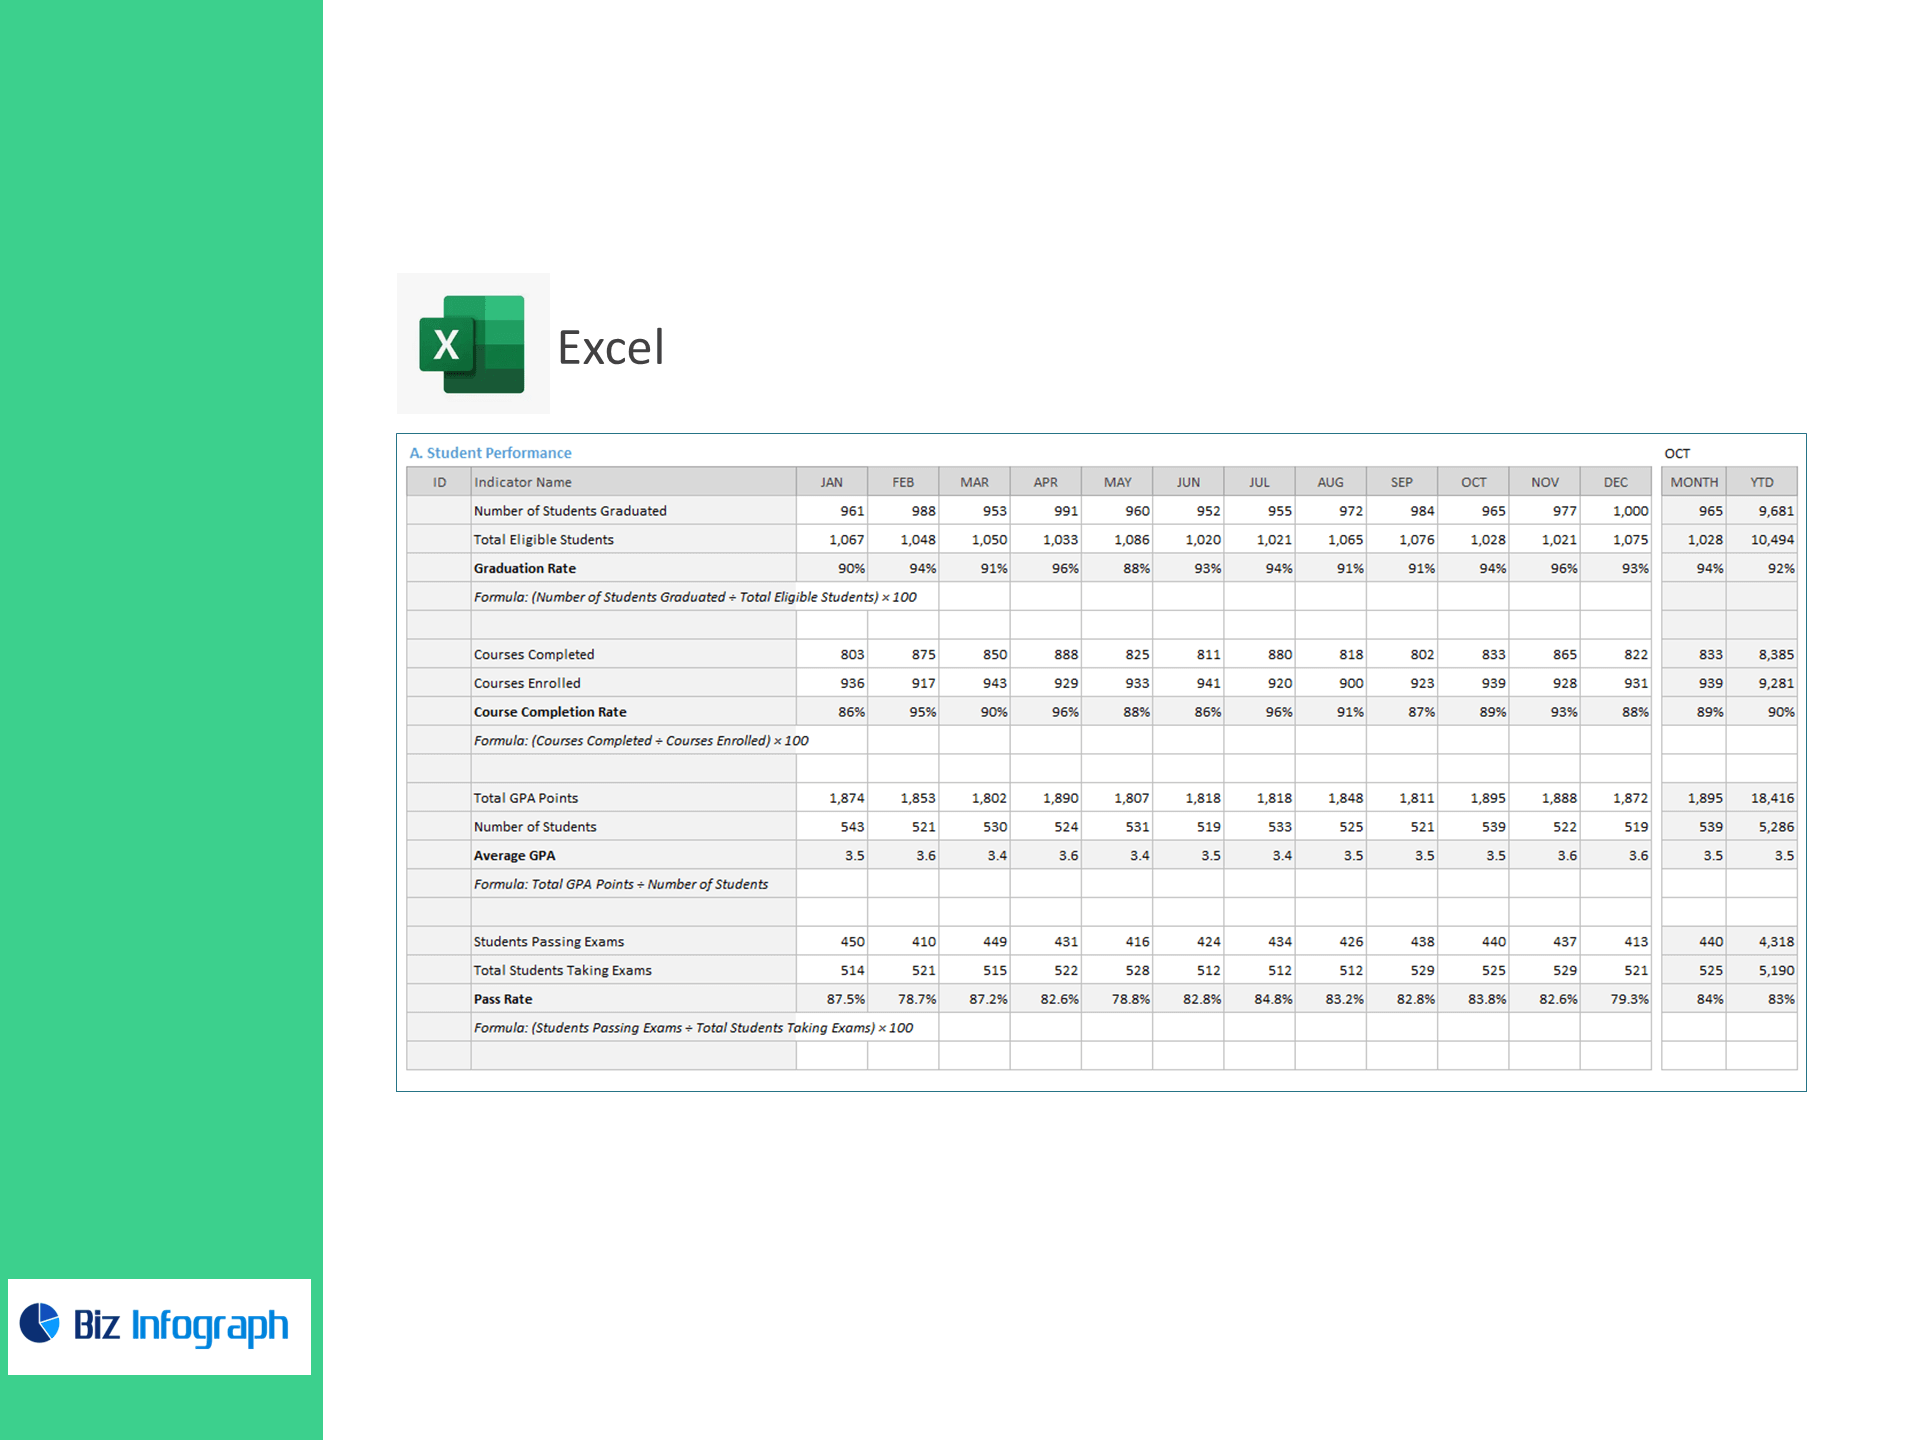
A) Student Performance
-
Graduation Rate (%) =
(Number of Students Graduated ÷ Total Eligible Students) × 100 -
Course Completion Rate (%) =
(Courses Completed ÷ Courses Enrolled) × 100 -
Average GPA =
Total GPA Points ÷ Number of Students -
Exam Pass Rate (%) =
(Students Passing Exams ÷ Total Students Taking Exams) × 100
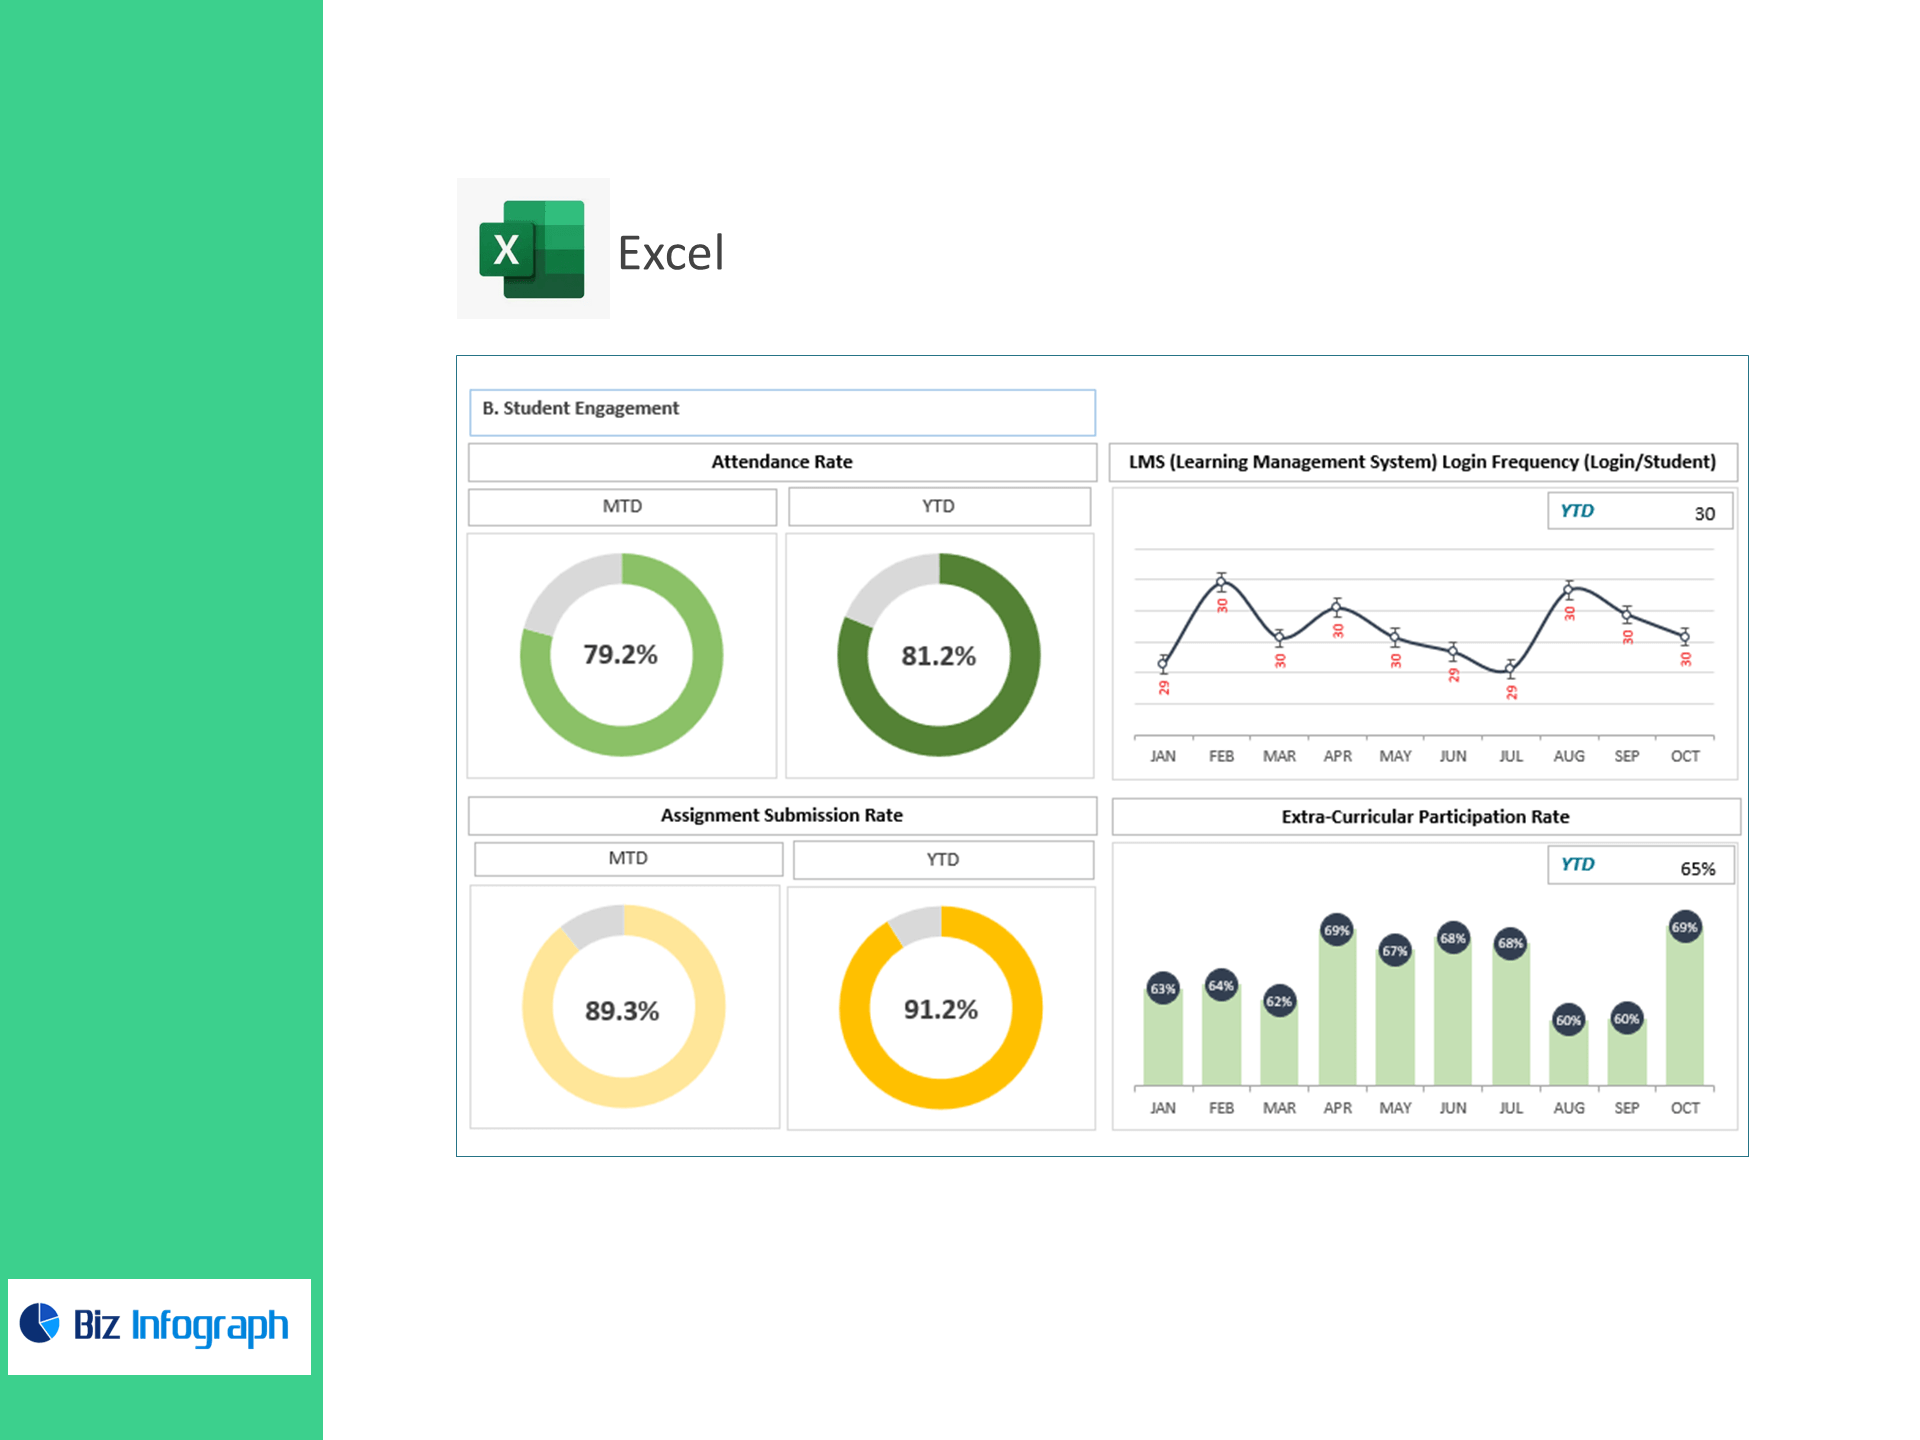
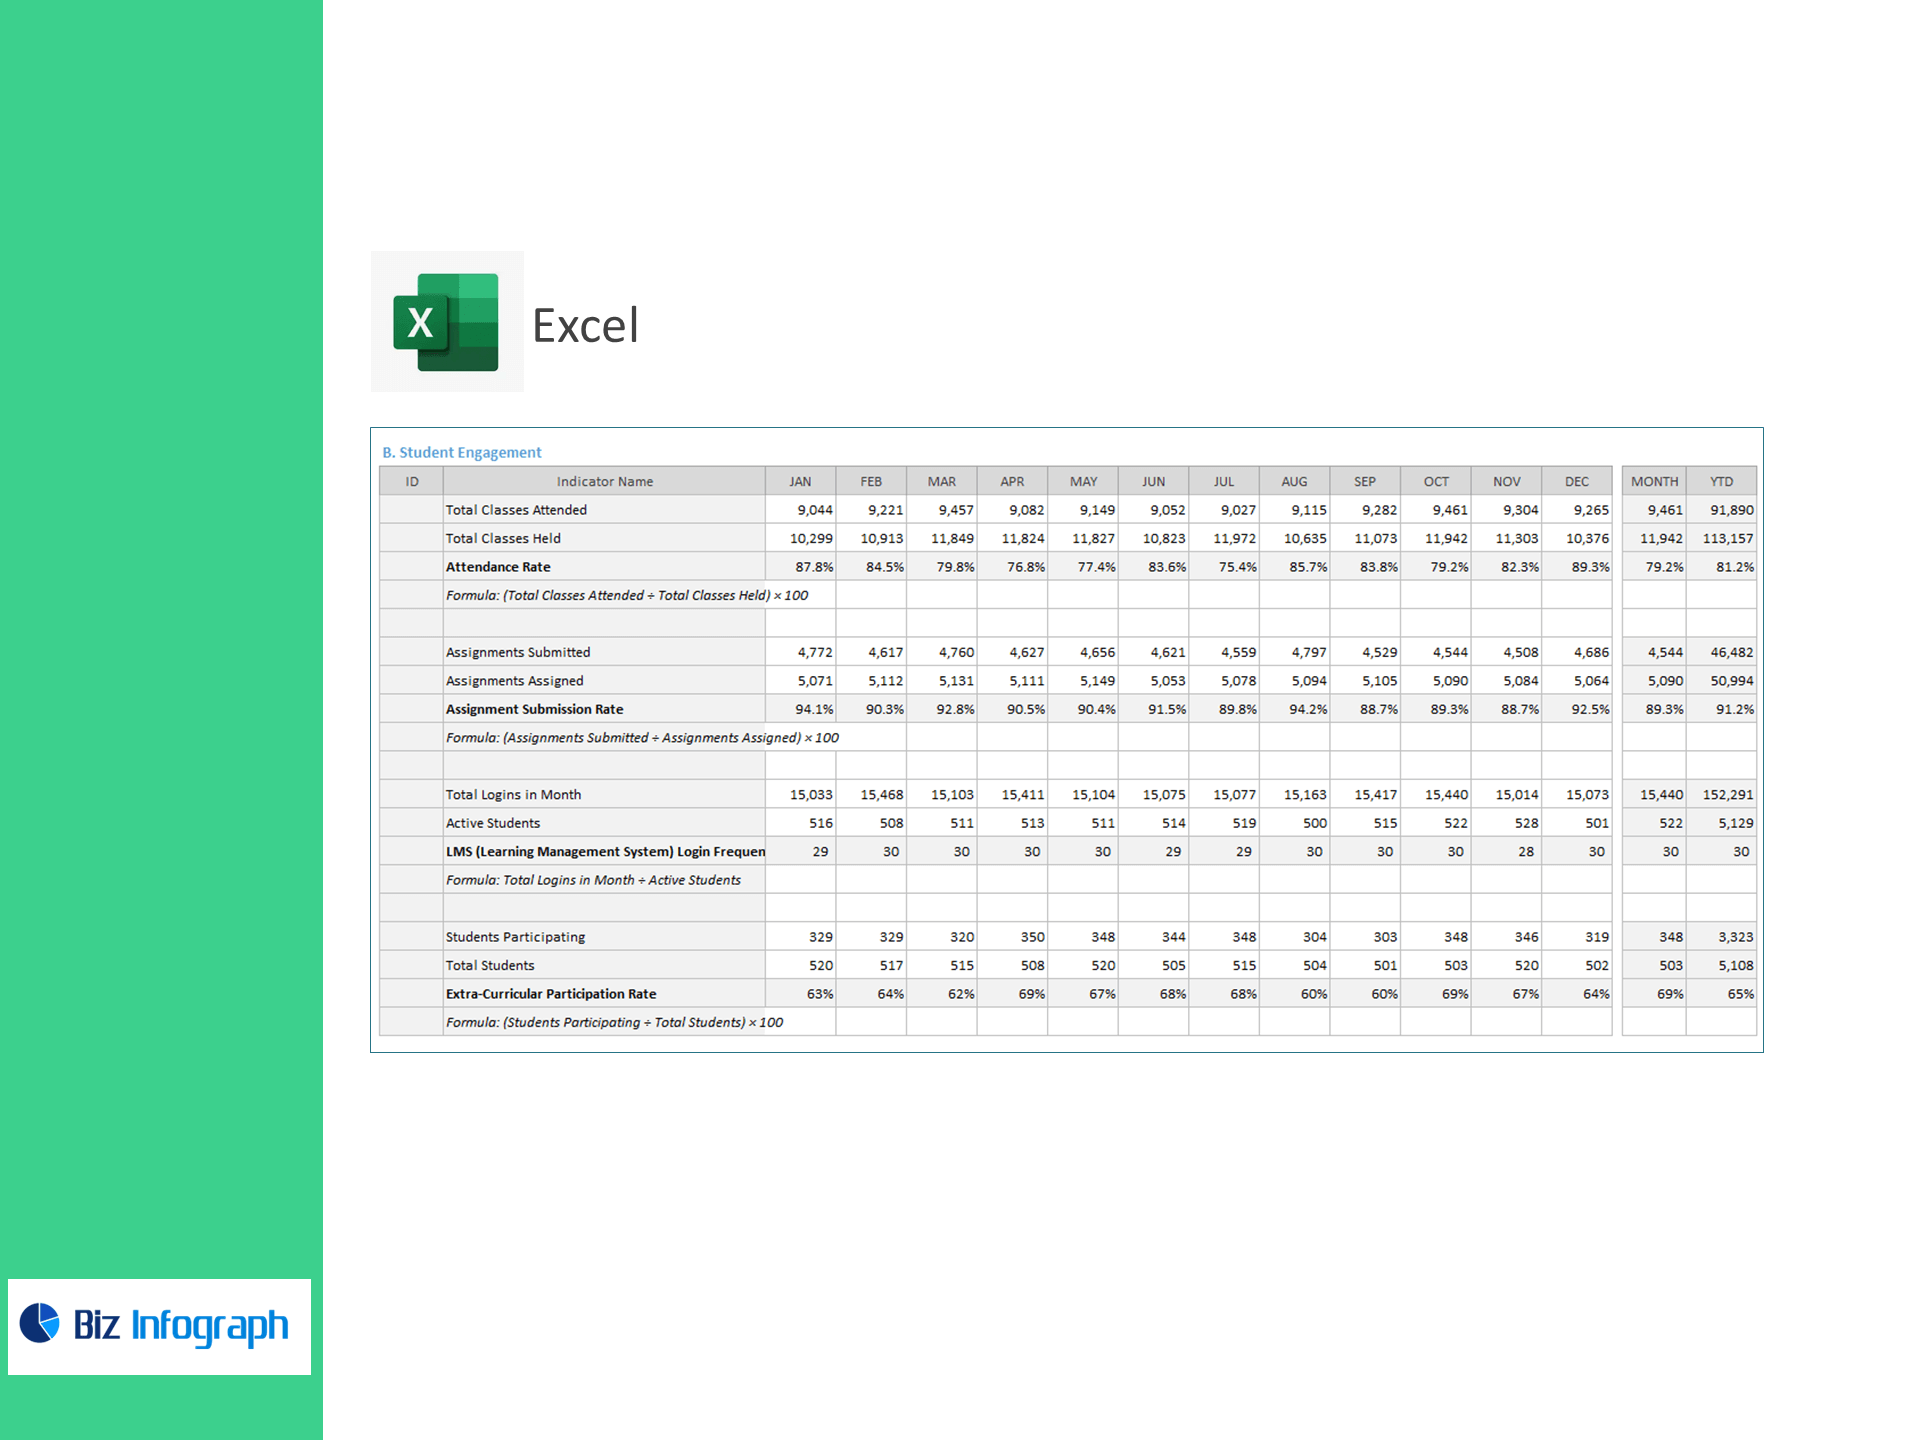
B) Student Engagement
-
Attendance Rate (%) =
(Total Classes Attended ÷ Total Classes Held) × 100 -
Assignment Submission Rate (%) =
(Assignments Submitted ÷ Assignments Assigned) × 100 -
LMS Login Frequency (logins/student) =
Total Logins in Month ÷ Active Students -
Extra-Curricular Participation Rate (%) =
(Students Participating ÷ Total Students) × 100
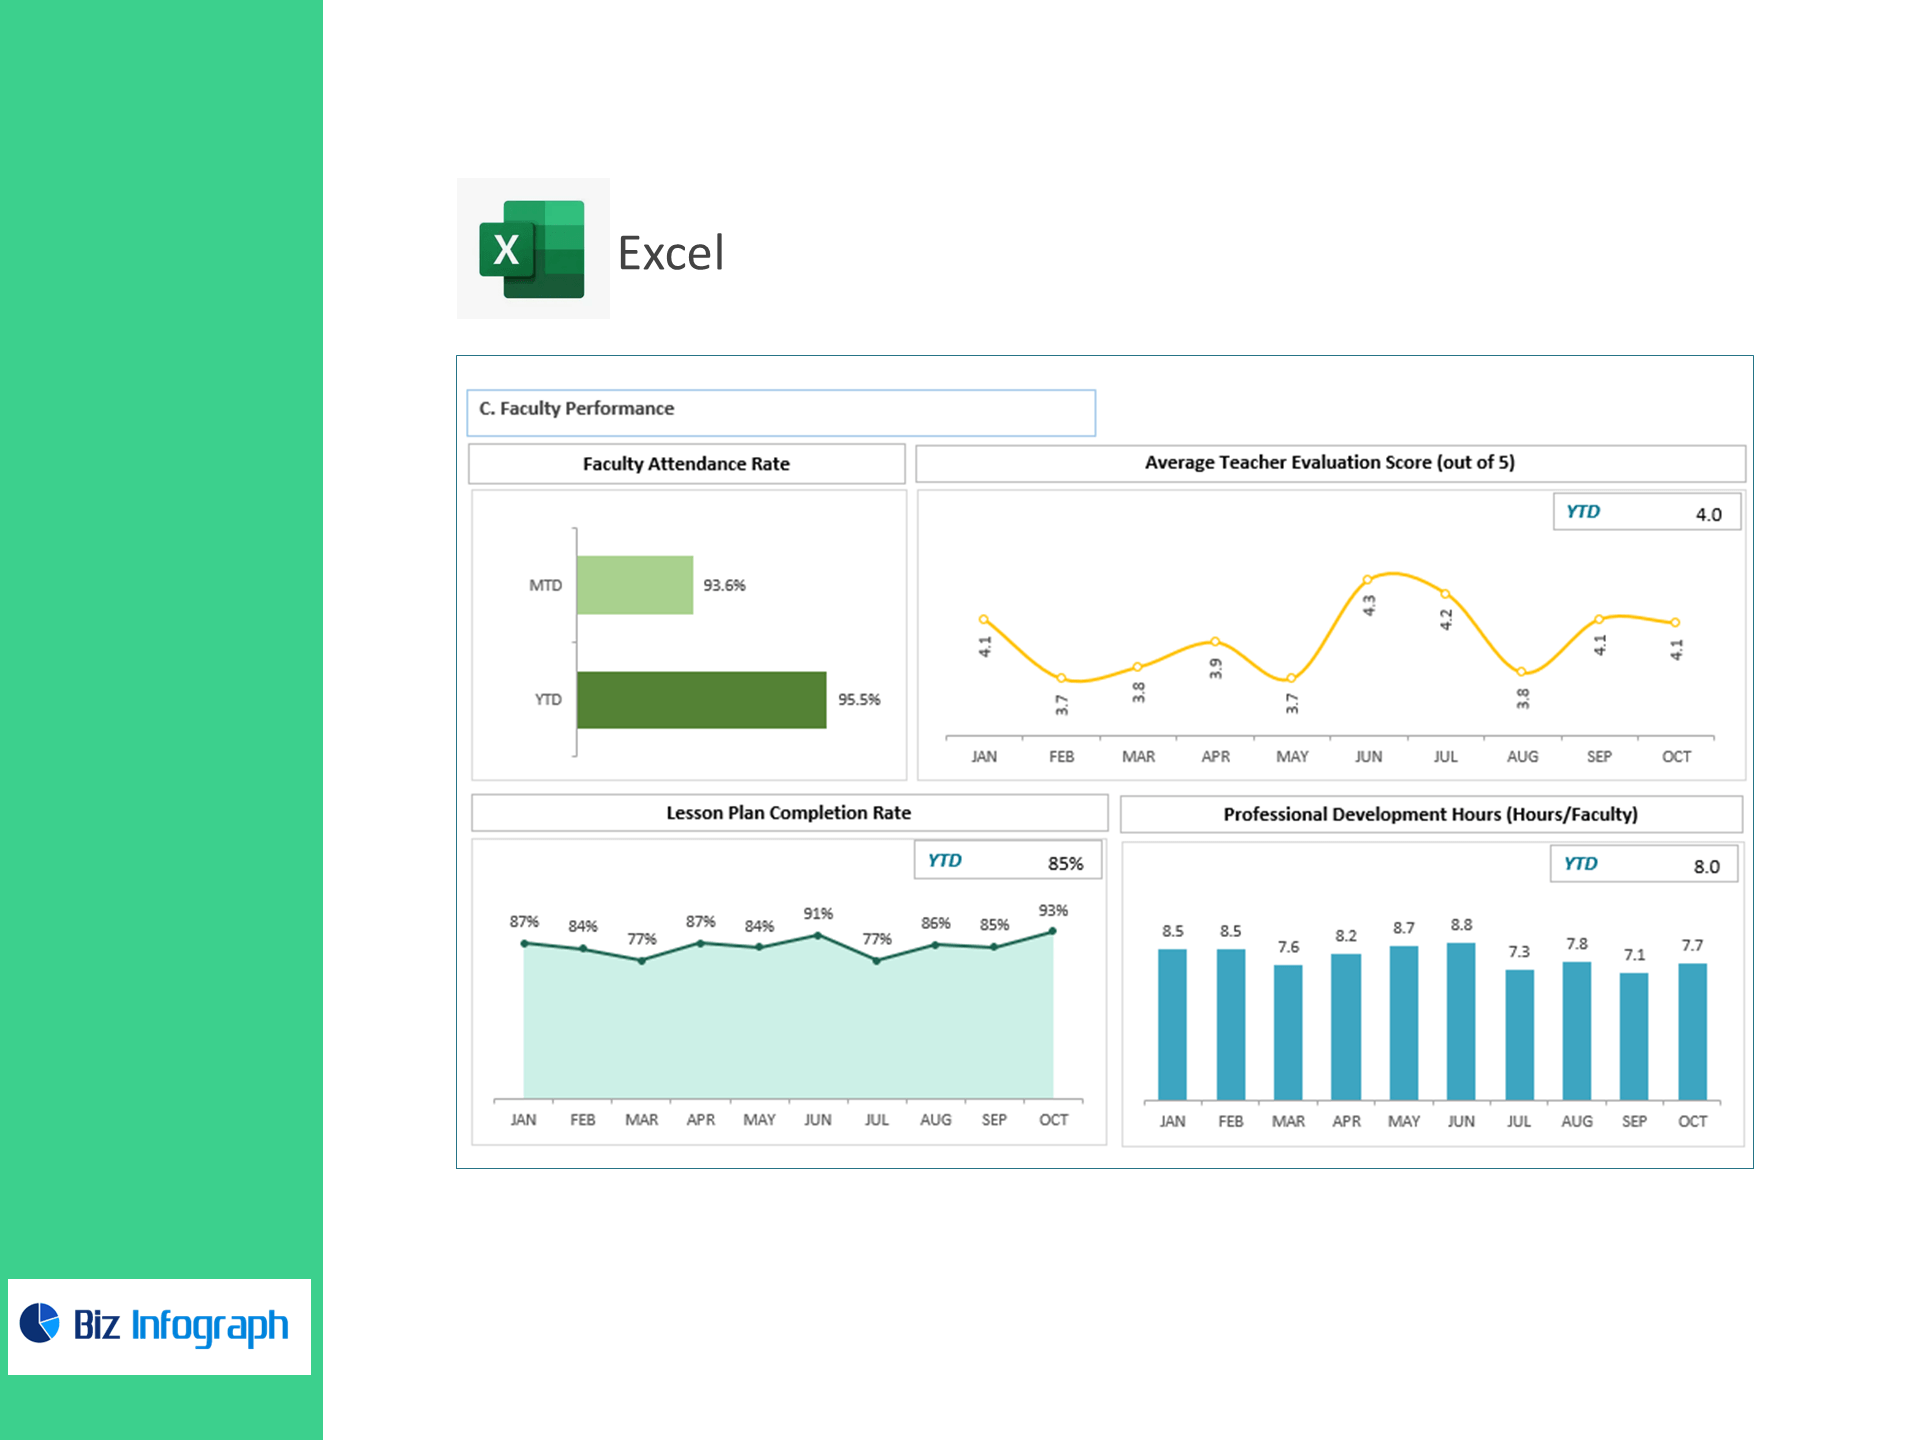
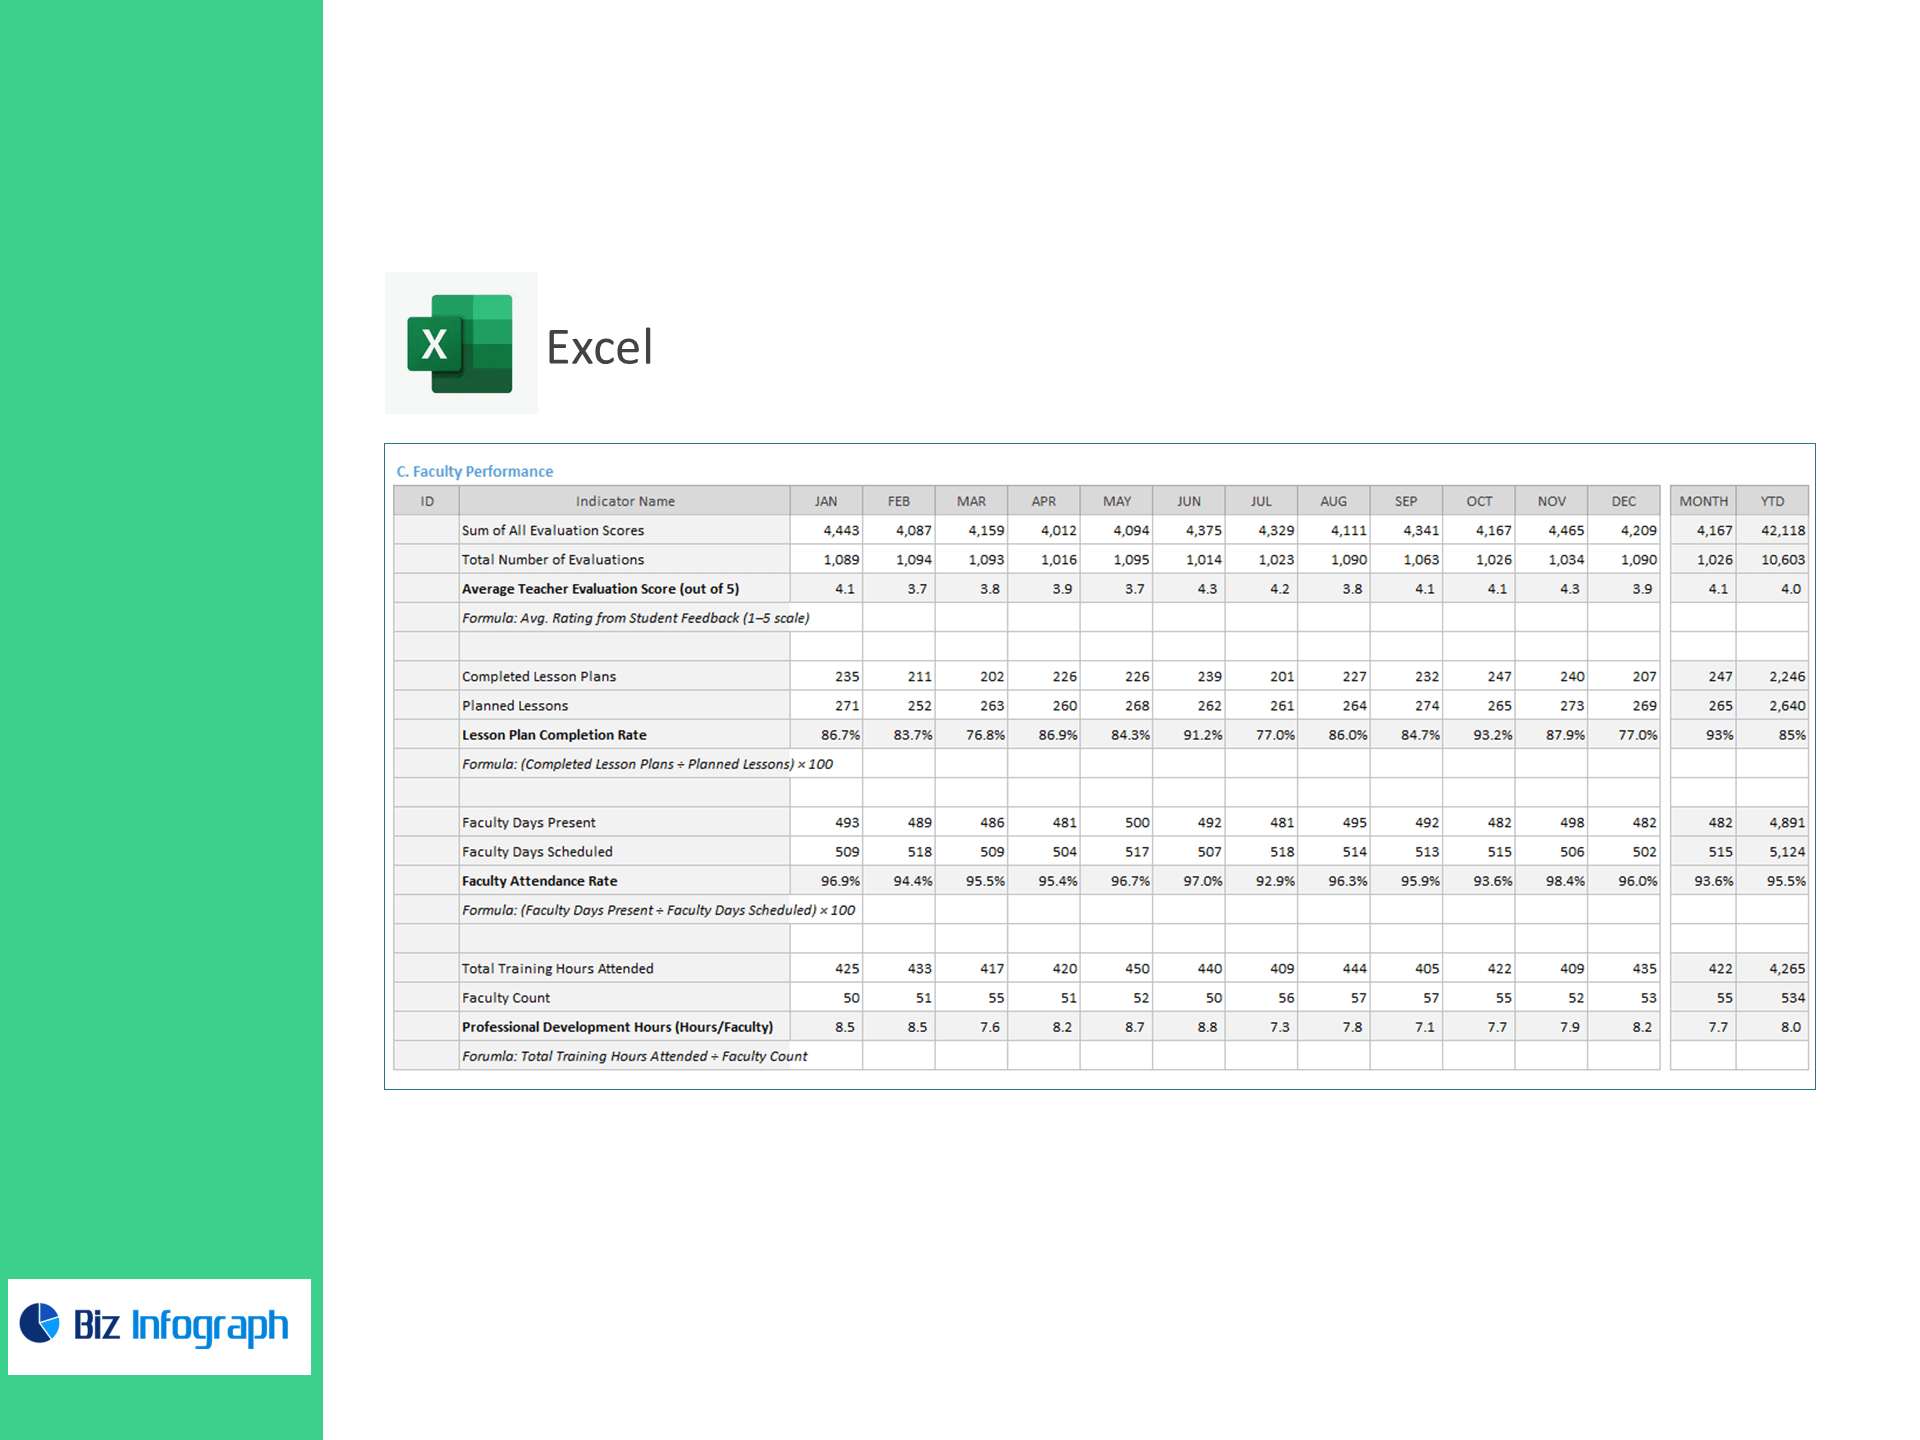
C) Faculty Performance
-
Average Teacher Evaluation Score (out of 5) =
Average of evaluation ratings -
Lesson Plan Completion Rate (%) =
(Completed Lesson Plans ÷ Planned Lessons) × 100 -
Faculty Attendance Rate (%) =
(Faculty Days Present ÷ Faculty Days Scheduled) × 100 -
Professional Development Hours (per faculty) =
Total Training Hours Attended ÷ Faculty Count
Why academic teams choose this template
-
See the full learning journey: link attendance, submissions, and LMS activity to GPA and pass rate.
-
Close equity gaps: slice KPIs by cohort, program, or instructor to target interventions.
-
Strengthen teaching quality: track evaluations, lesson planning, and PD hours in one place.
-
Be review-ready: export print-perfect reports for boards, accreditors, and parents.
What’s inside
-
Executive Overview: graduation, completion, GPA, pass rate, and engagement at a glance.
-
Drill-downs: cohort trendlines, course heatmaps, and instructor comparison.
-
Settings & Targets: define goals, terms, scales (GPA/5-point), and cohort mappings.
-
Documentation: plain-English KPI definitions and step-by-step setup.
For ready-to-use Dashboard Templates: