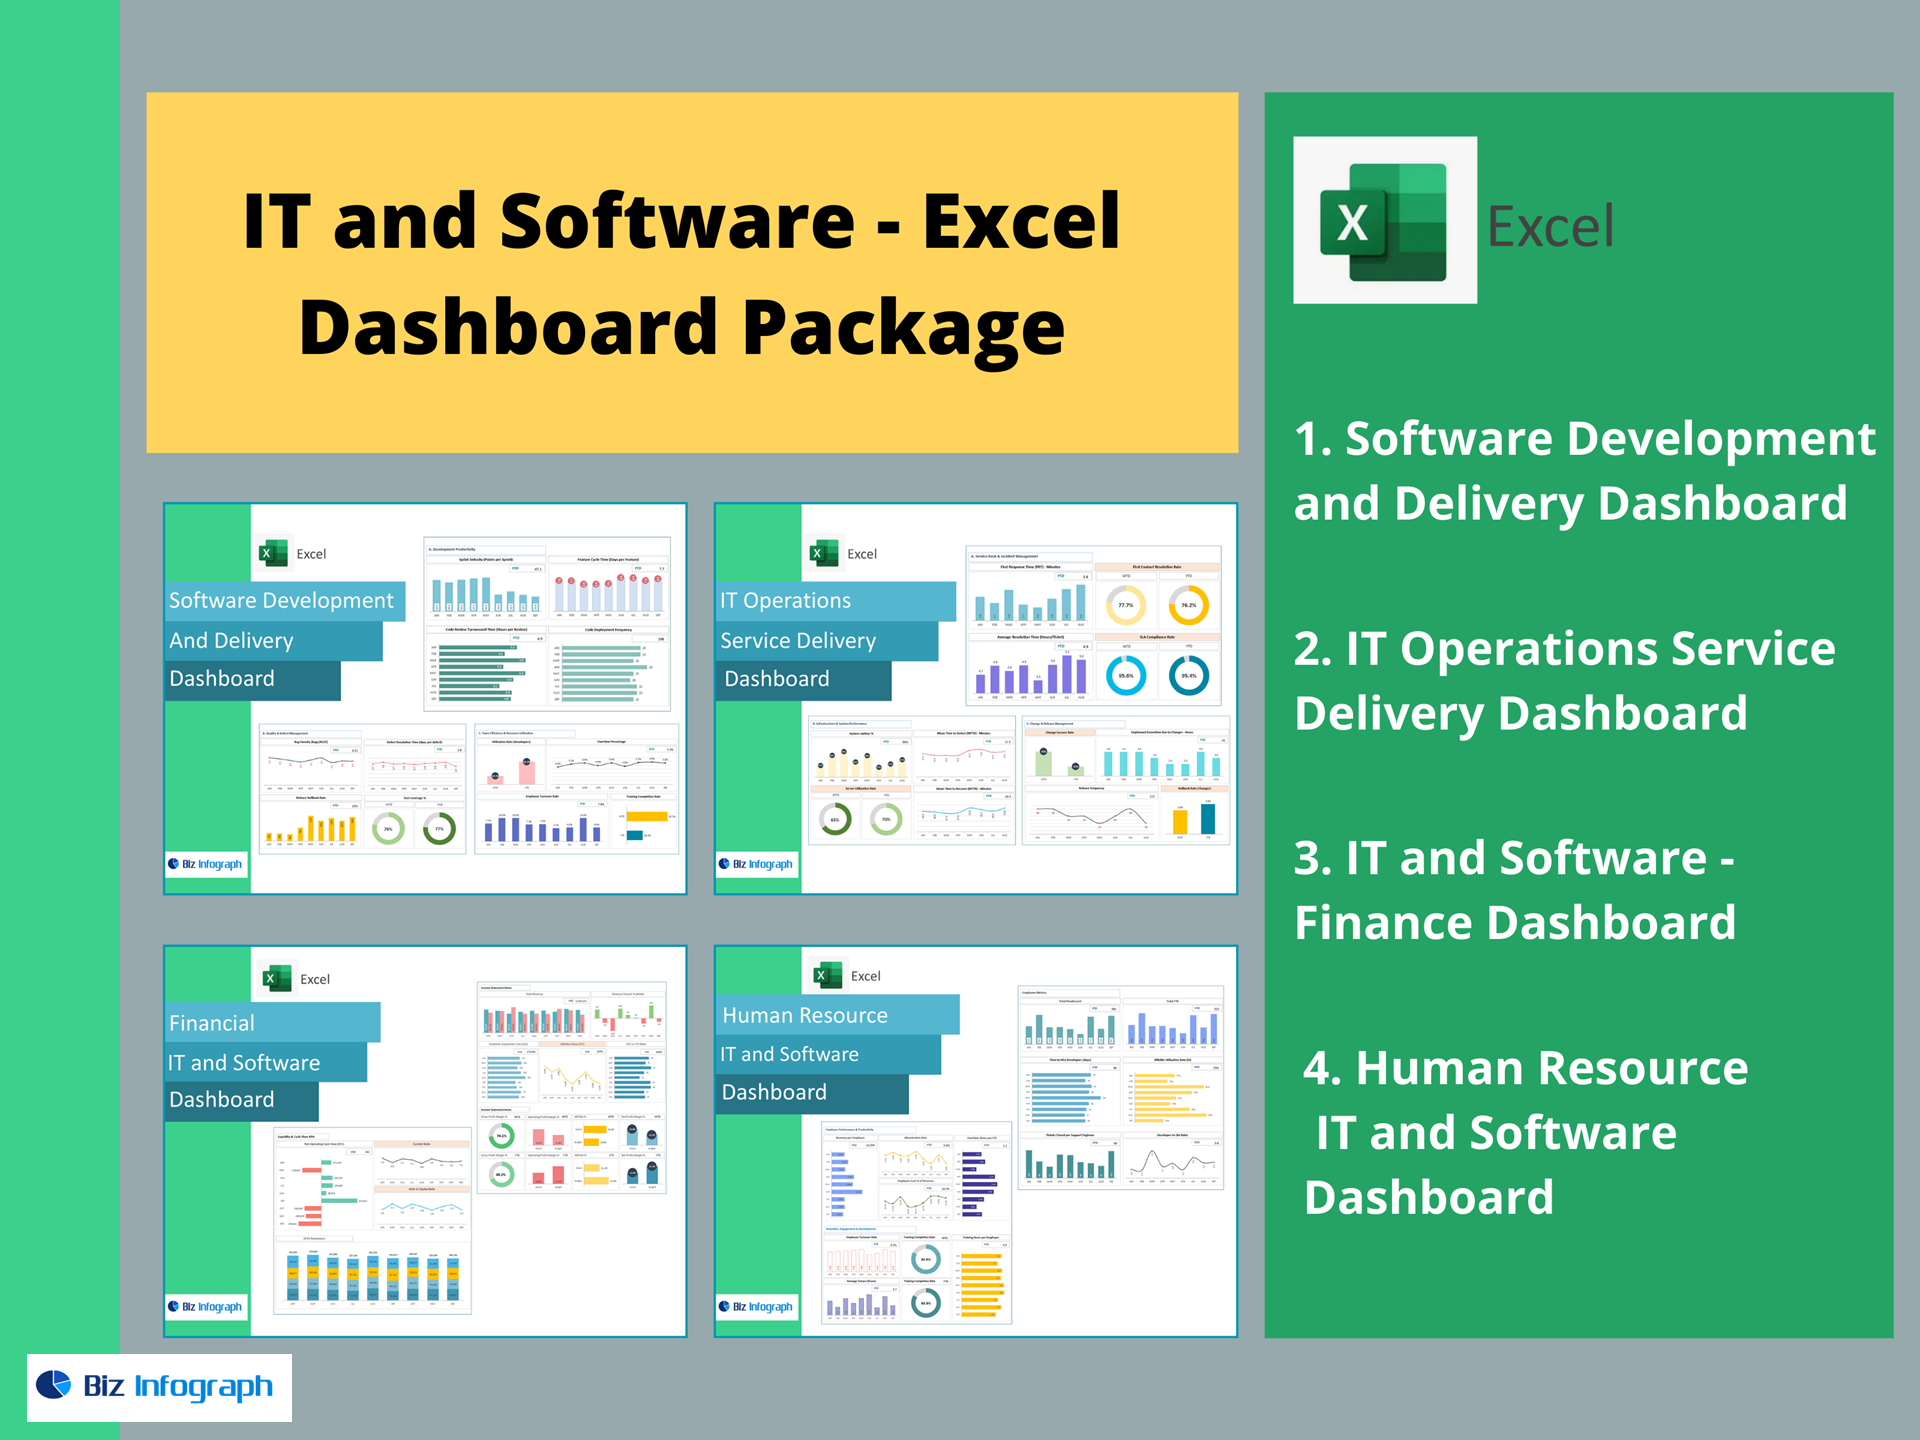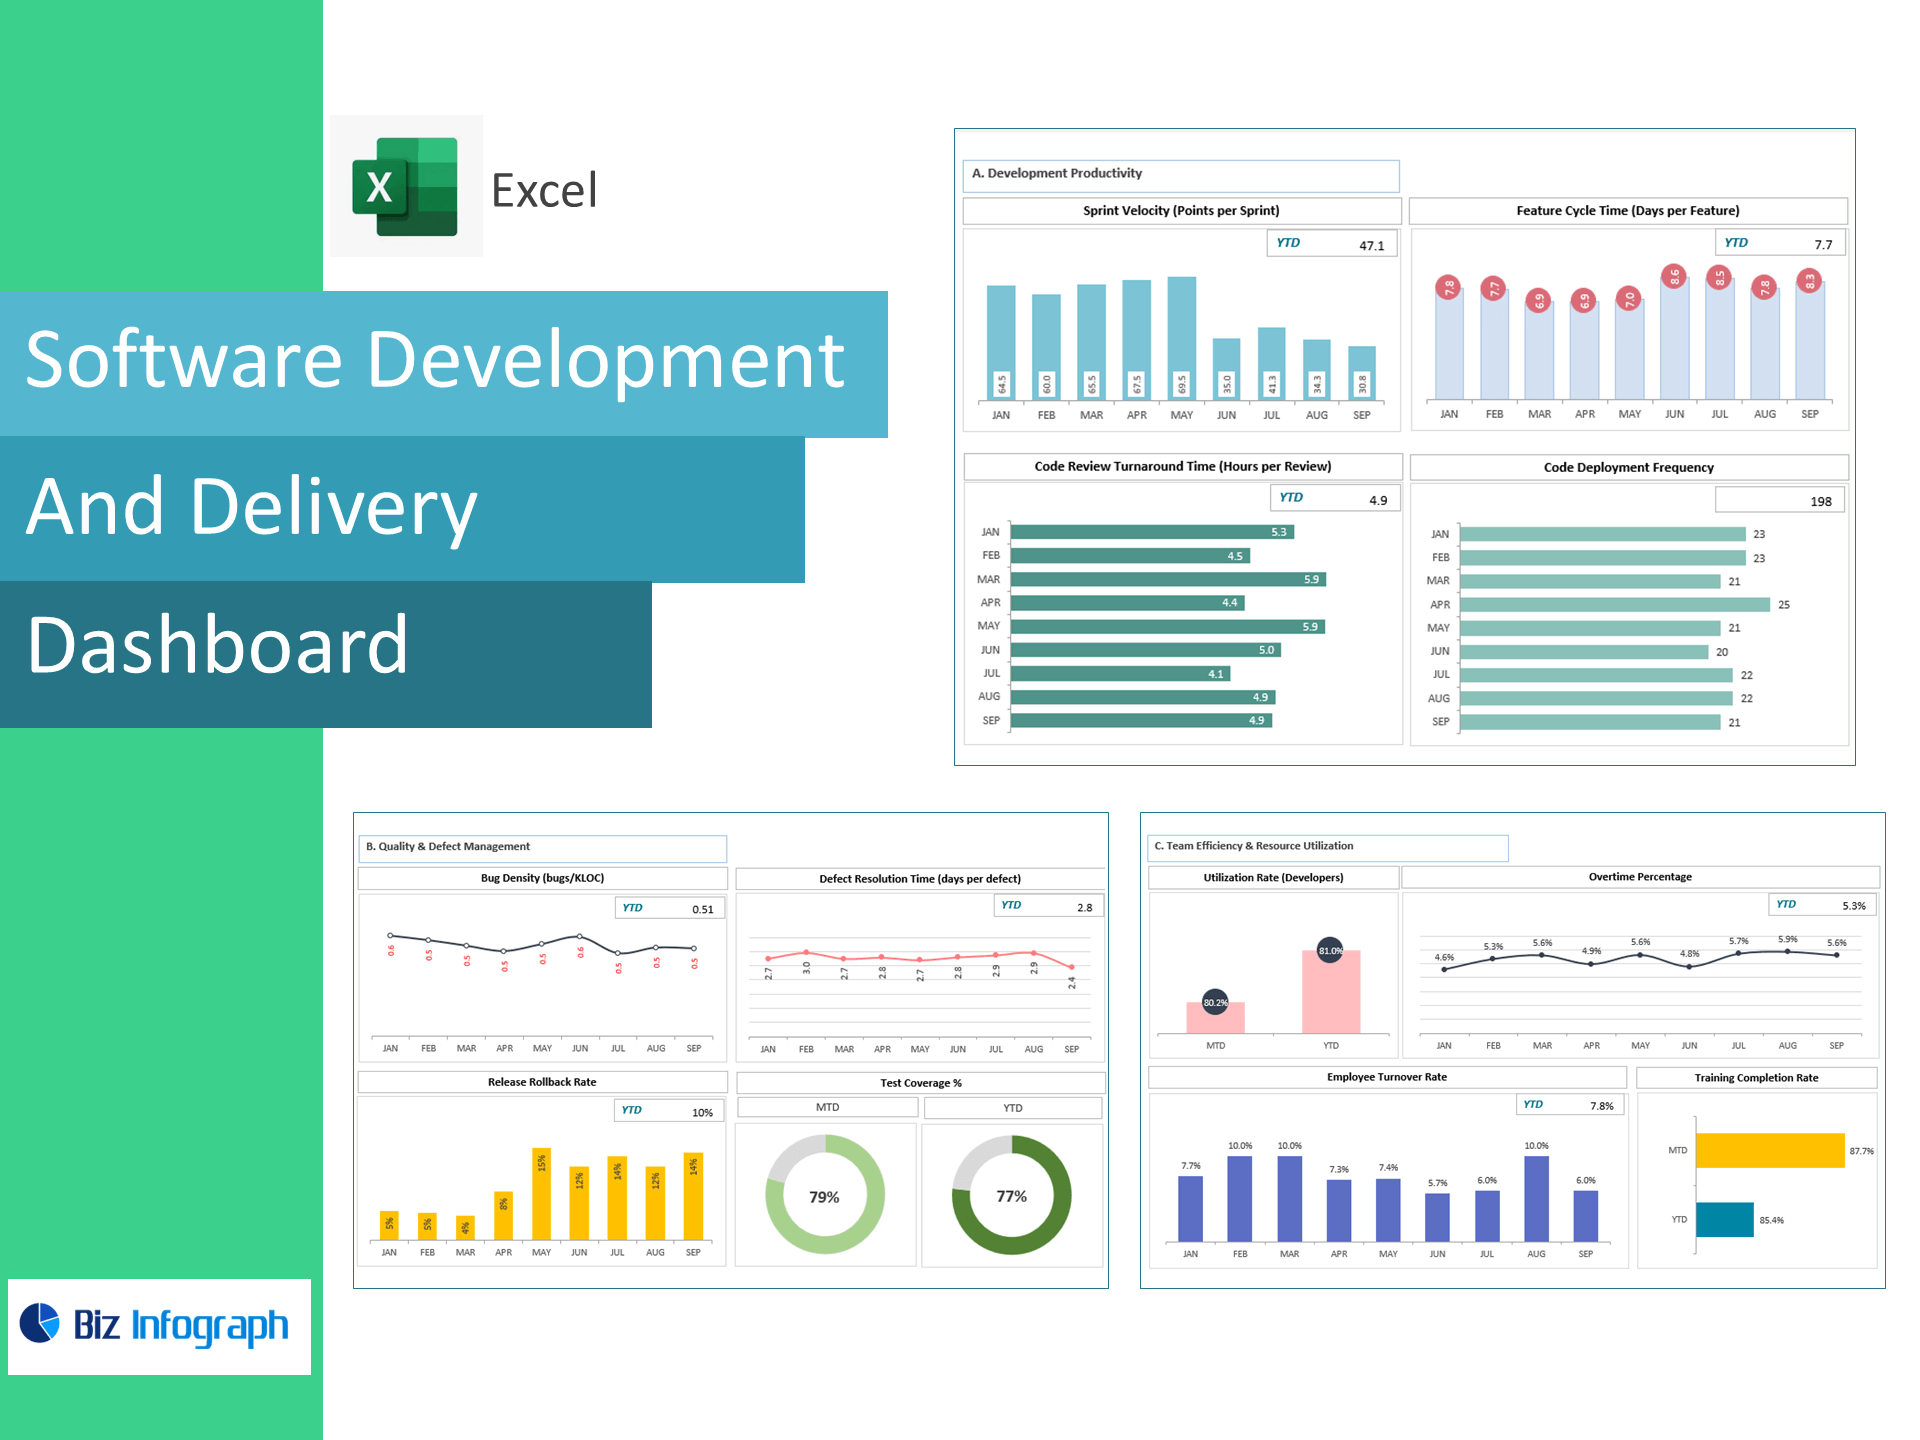


Software Development & Delivery Dashboard — Excel Template
Ship faster with fewer defects. This plug-and-play Excel dashboard converts Jira/Azure DevOps/GitLab exports into clear visuals across Agile productivity, quality & defects, and team utilization—so Engineering Managers and PMOs can track velocity, cycle time, deployment frequency, code review SLAs, bug trends, and rollback risk in one place.
What it tracks (pre-built KPIs)
A) Development Productivity
-
Sprint Velocity (pts/sprint)
-
Feature Cycle Time (days/feature)
-
Code Deployment Frequency (prod releases/month)
-
Code Review Turnaround Time (hrs/review)
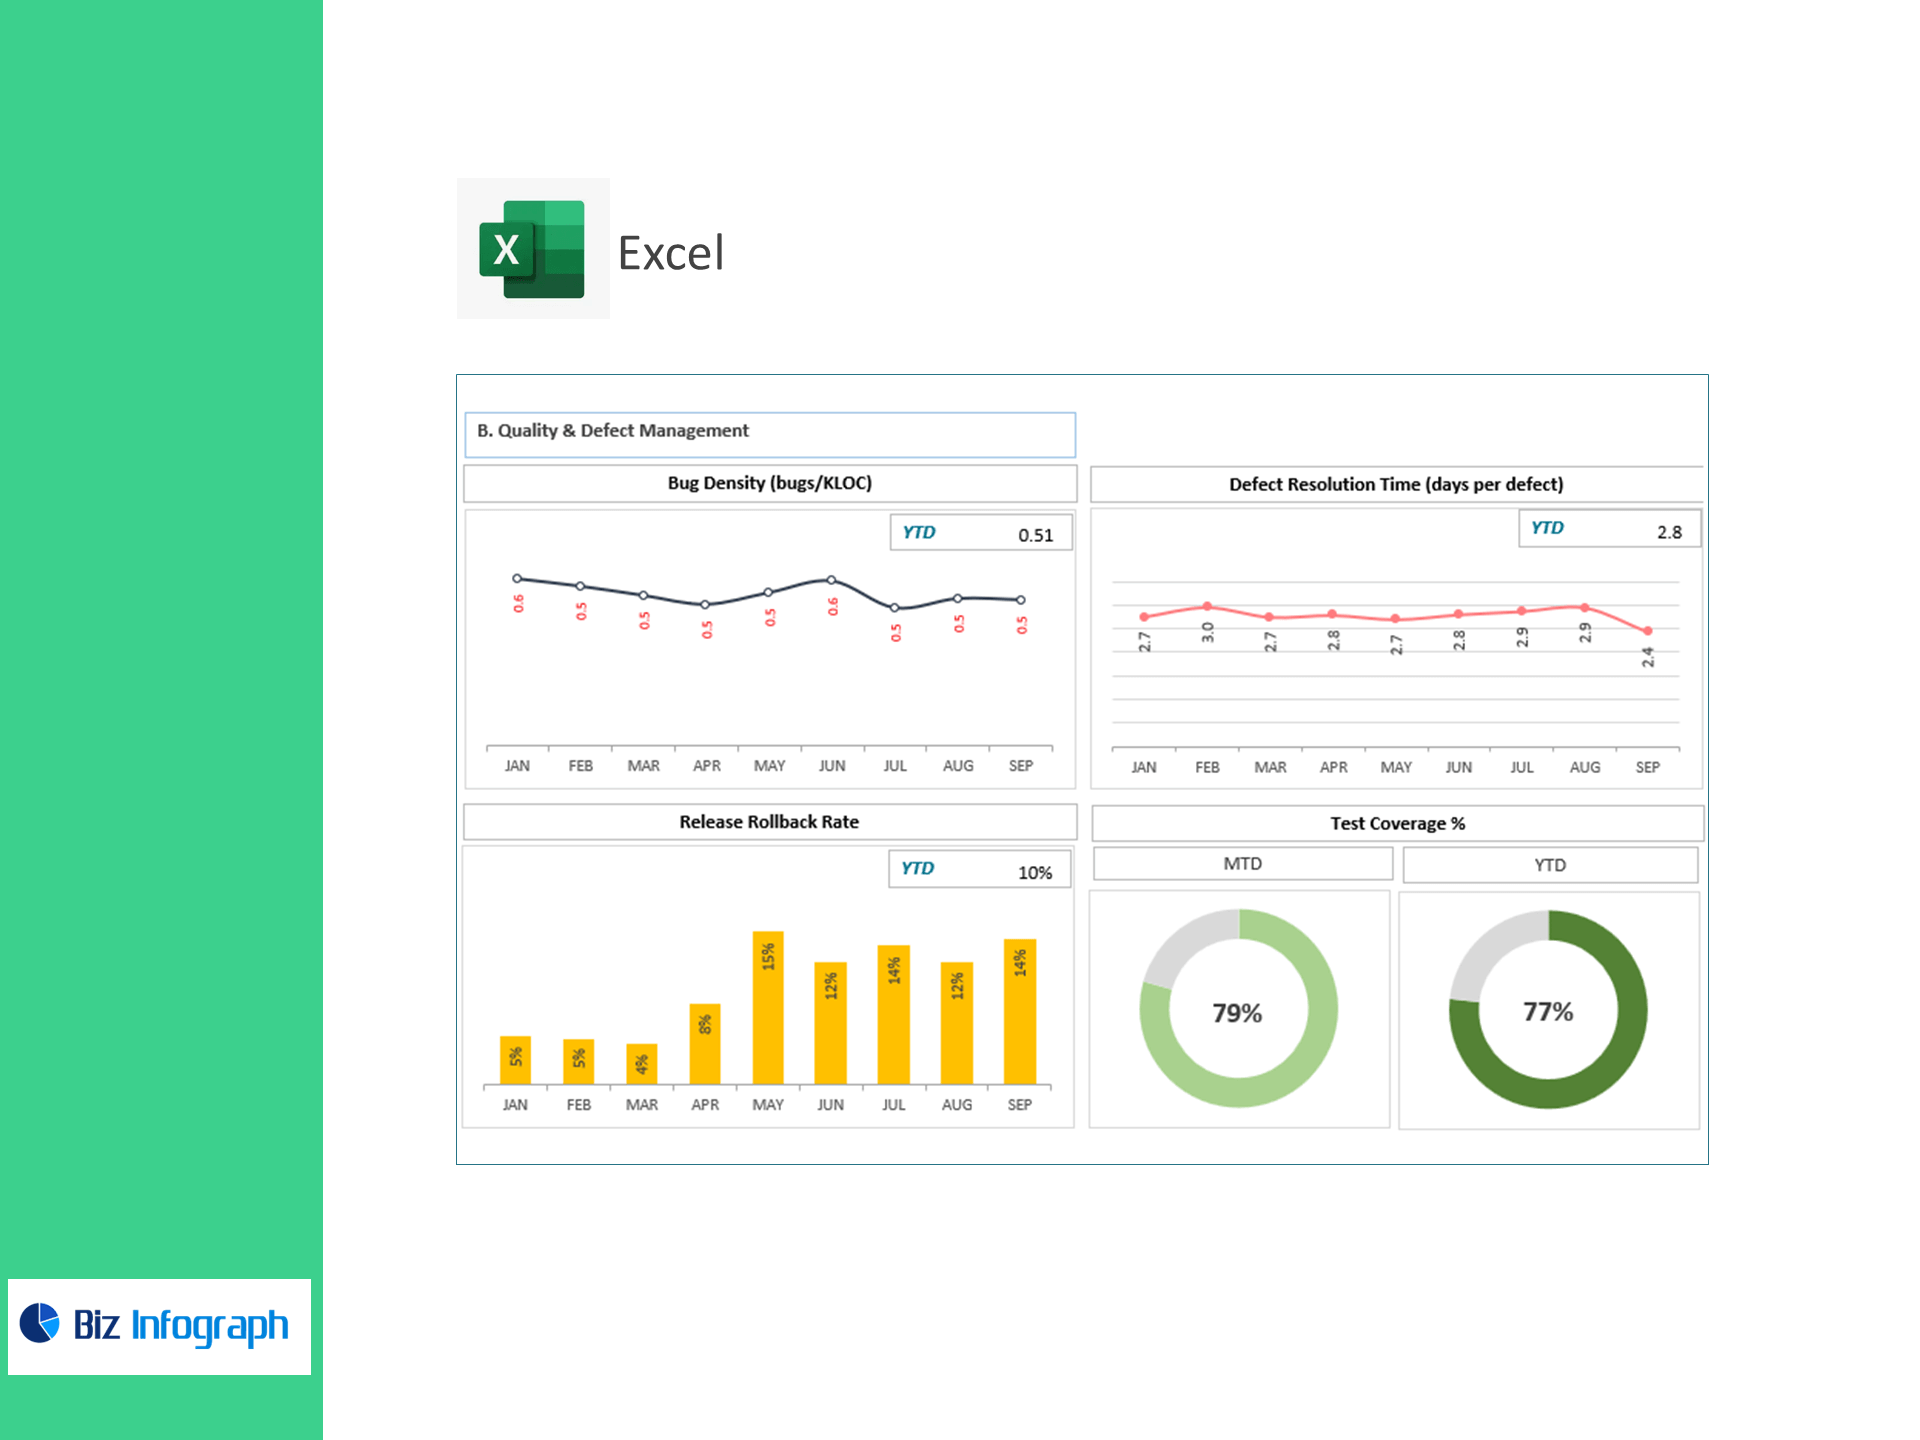
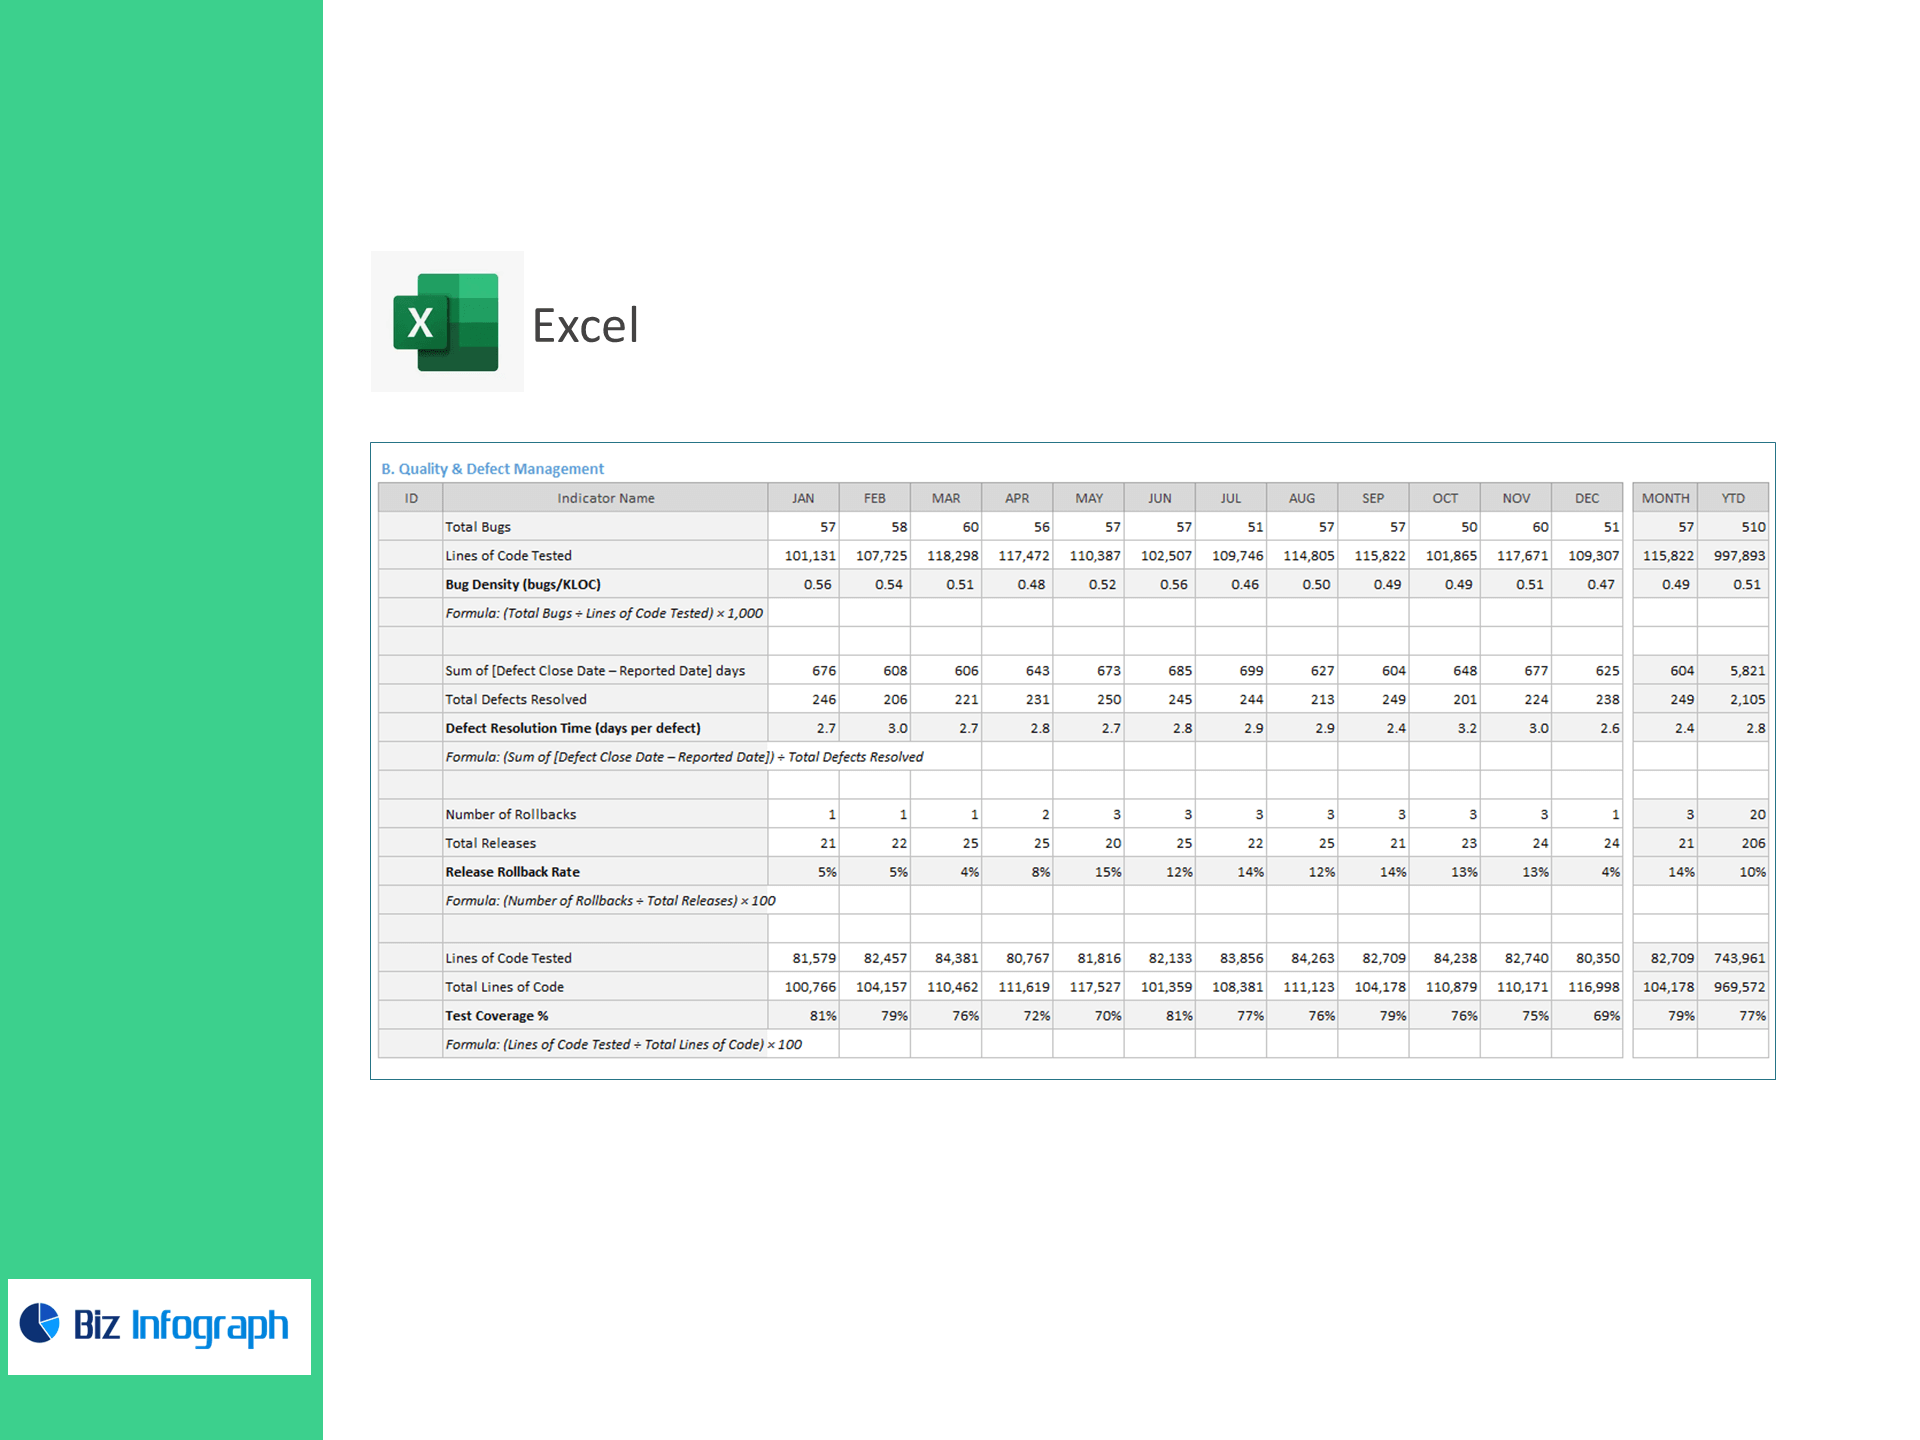
B) Quality & Defect Management
-
Bug Density (bugs/KLOC)
-
Defect Resolution Time (days/defect)
-
Release Rollback Rate (%)
-
Test Coverage (%)
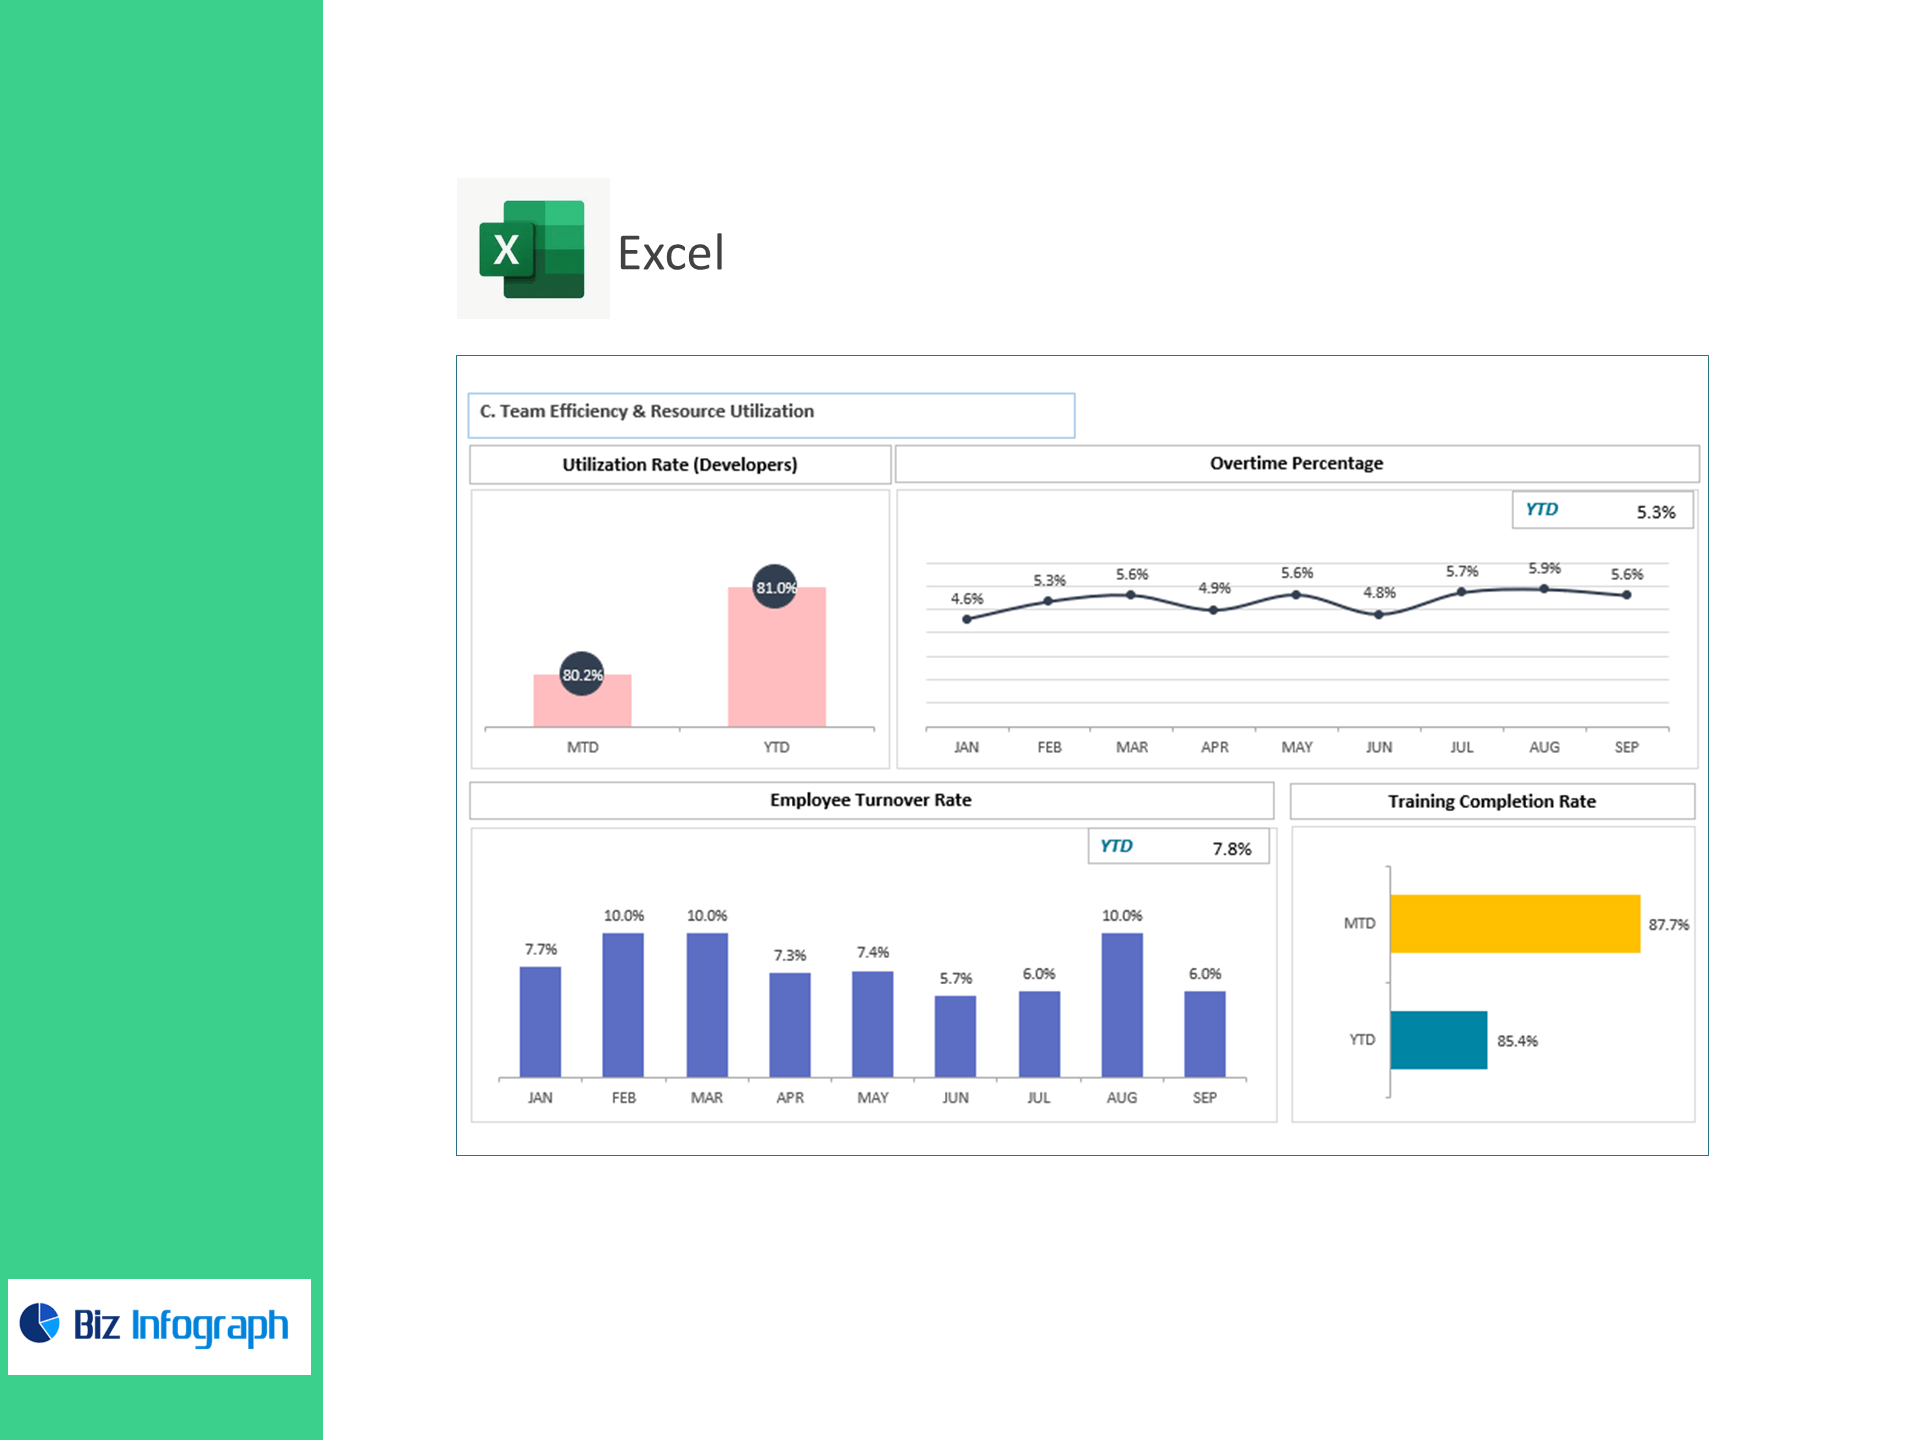
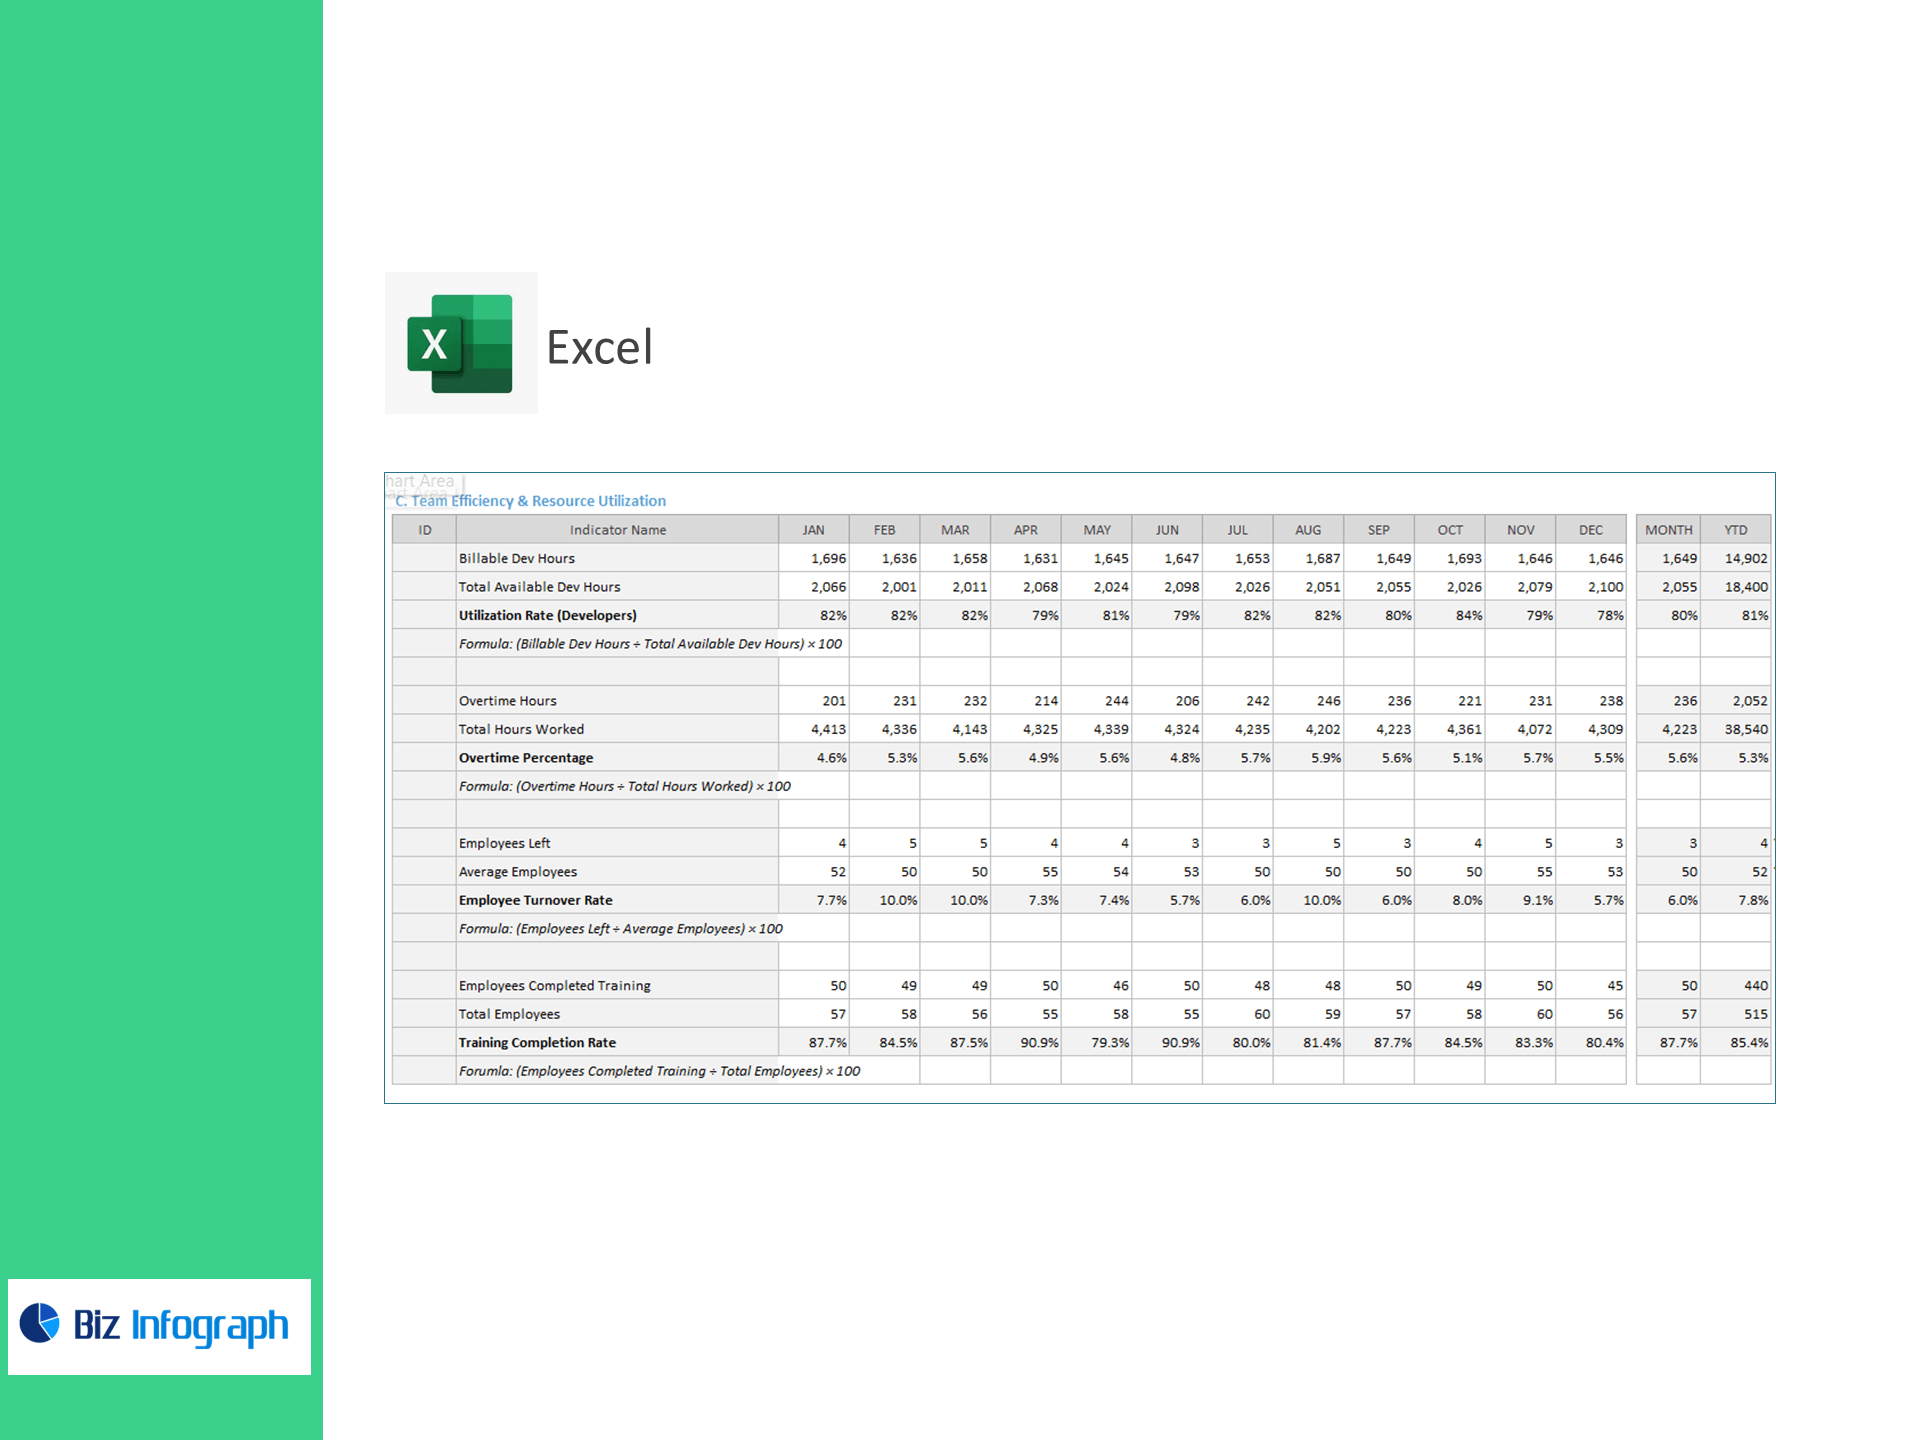
C) Team Efficiency & Resource Utilization
-
Developer Utilization Rate (%)
-
Overtime Percentage (%)
-
Employee Turnover Rate (%)
-
Training Completion Rate (%)
Why teams love it
-
Delivery at a glance: Velocity, flow, and reliability KPIs on one control panel.
-
Instant exec reporting: Auto-calculated trends, targets, and red/amber/green status.
-
Quality focus: Spot rising bug density, slow MTTR for defects, and risky rollbacks.
-
Excel-native: No macros. Paste CSVs from your tools and the charts update.
-
Scalable: Segment by squad, product, or release train; export to PDF/PowerPoint.
What’s inside
-
Executive Dashboard: KPI cards, burndown-style trends, on-time delivery gauge.
-
Productivity View: Velocity, cycle time, deployment frequency, review SLA.
-
Quality View: Bugs, KLOC, defect aging, rollback analysis, coverage heatmap.
-
People & Capacity View: Utilization, overtime, churn, training progress.
-
Data Model & Mapping Sheets: Clean schema for quick paste/import from Jira/ADO/Git.
-
Quick-Start Guide with sample data.
For ready-to-use Dashboard Templates: